
 Open Access Article
 This Open Access Article is licensed under a
 Creative Commons Attribution 3.0 Unported Licence
pH-Dependent physicochemical properties of ornithine lipid in mono- and bilayers†
Tetiana
Mukhina
 a,
Georg
Pabst
b,
Jean-Marie
Ruysschaert
c,
Gerald
Brezesinski
a and
Emanuel
Schneck
*a
a,
Georg
Pabst
b,
Jean-Marie
Ruysschaert
c,
Gerald
Brezesinski
a and
Emanuel
Schneck
*a
aInstitute for Condensed Matter Physics, TU Darmstadt, Hochschulstrase 8, 64289 Darmstadt, Germany. E-mail: emanuel.schneck@pkm.tu-darmstadt.de
bInsitute of Molecular Biosciences, University of Graz, Universitätsplatz 3, 8010, Graz, Austria
cLaboratoire de Structure et Fonction des Membranes Biologiques, Université Libre de Bruxelles, 1050 Bruxelles, Belgium
First published on 8th September 2022
Abstract
In certain bacteria, phosphatidylethanolamine lipids (PEL) get largely replaced by phosphate-free ornithine lipids (OL) under conditions of phosphate starvation. It has so far been unknown how much these two lipid types deviate in their physicochemical properties, and how strongly bacteria thus have to adapt in order to compensate for the difference. Here, we use differential scanning calorimetry, X-ray scattering, and X-ray fluorescence to investigate the properties of OL with saturated C14 alkyl chains in mono- and bilayers. OL is found to have a greater tendency than chain-analogous PEL to form ordered structures and, in contrast to PEL, even a molecular superlattice based on a hydrogen bonding network between the headgroups. This superlattice is virtually electrically uncharged and persists over a wide pH range. Our results indicate that OL and PEL behave very differently in ordered single-component membranes but may behave more similarly in fluid multicomponent membranes.
Introduction
Bacteria are able to sense the extracellular phosphorus (P) concentration and to react to it. At low P concentrations, they synthesize P-free lipids like ornithine lipids (OLs, see Fig. 1(A)) and use them to replace part of the phospholipids.1,2 OL contains a 3-hydroxy fatty acyl group attached in amide linkage to the α-amino group of the amino acid ornithine. A second fatty acyl group is ester-linked to the 3-hydroxy position of the first fatty acid. An N-acyl transferase contributes to the formation of the lyso-OL and an O-acyl transferase transfers the second acyl chain to the lyso-OL. About 25% of the bacterial species whose genomes have been sequenced are believed to have the capacity to form OLs. These P-free membrane lipids are absent in archaea and eukaryotes but widespread in eubacteria. For instance, the Gram-negative bacterium Vibrio cholerae survives in a P-poor aquatic environment by producing OLs that almost completely replace phosphatidylethanolamine lipids (PELs, see Fig. 1(B)), a major class of lipids of the bacterial membrane, while leaving cardiolipin and phosphatidyl glycerol lipid concentrations largely unmodified.3 It has so far been unknown how much OLs and PELs deviate in their physicochemical properties, and how strongly bacteria thus have to adapt in order to compensate for the difference.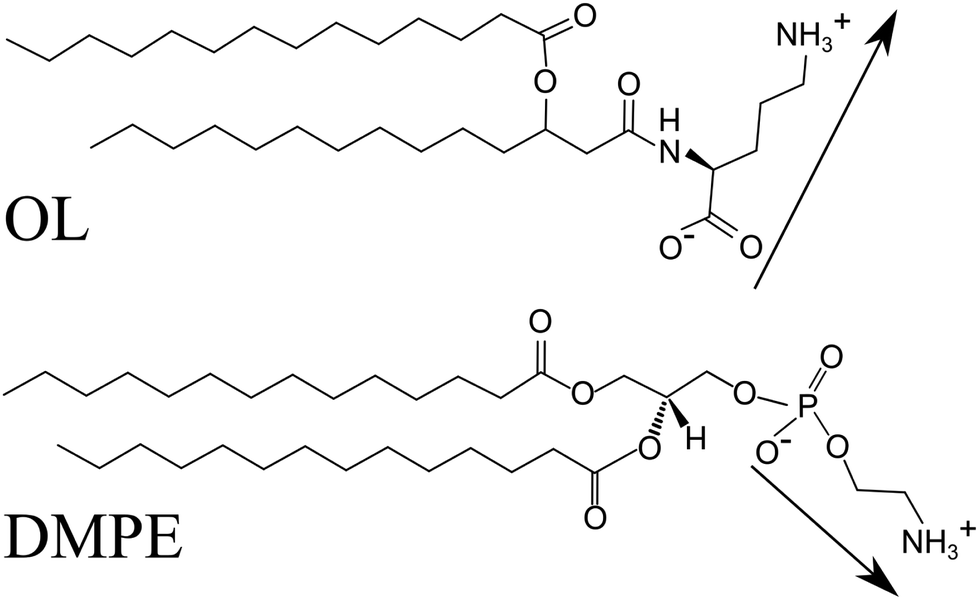 | ||
| Fig. 1 Chemical structures of ornithine lipid (OL) and the chain-analogous phosphatidylethanolamine lipid (PEL), DMPE. Arrows schematically indicate the electric dipole of the headgroups in the zwitterionic protonation state. The headgroup orientations were drawn arbitrarily. | ||
Like OLs, PELs have a zwitterionic headgroup with one positively chargeable amino group and one negatively chargeable group. The latter is a carboxy group in OLs and a phosphate group in PELs (see Fig. 1). PELs form more viscous and less fluid lipid membranes than the abundant phosphatidylcholine lipids (PCLs): the chain melting phase transition temperature Tm of PELs with saturated alkyl chains is more than 20 K higher than those of the corresponding PCLs.4 This difference also manifests in different time scales for lipid lateral reorganization.5 Due to their compact and less hydrated headgroups, PELs enable the formation of non-bilayer structures and affect the function of peripheral and integral membrane proteins.6 PELs also act as molecular chaperones in the folding of integral membrane proteins.7 In fact, the function of membrane proteins appears to require the presence of specific lipid species in the bilayer. For instance, several bacterial transporters (LmrP, LacY) require the presence of chemical motifs of the PEL headgroup to be active. The effect of these motifs on the function of LmrP is mediated by their interaction with the protein, and already the replacement of one of the three amino group hydrogens by methyl moieties (as in PCLs) leads to changes in the biochemical and biophysical properties of the reconstituted protein.8
An important question is whether under conditions of P-starvation OLs are suitable P-free replacements for PELs in a way that retains the main lipid functions. The overall headgroup architecture is indeed similar: both headgroups are nominally zwitterionic and rather compact. But there are also distinct chemical differences that may lead to differences in the lipids’ physicochemical properties. The carboxy group in OL and the phosphate group in PELs may in principle have different protonation degrees depending on the pH conditions, and the length of the dipole vector between the two chargeable groups as well as its conformational freedom with respect to the linker in the chemical structure may be different for OL and PELs (see Fig. 1). However, to what extent these differences affect the physicochemical properties of OLs has so far remained largely unknown.
Here, we investigate the physicochemical properties of OLs in mono- and bilayers. For this purpose, we have synthesized OLs with saturated alkyl chains of length nCH2 = 14. OL bilayers are investigated in aqueous dispersions using small- and wide-angle X-ray scattering (SAXS/WAXS) and differential scanning calorimetry (DSC). The structure of OL monolayers is studied using a Langmuir trough in combination with grazing-incidence X-ray diffraction (GIXD) and total-reflection X-ray fluorescence (TRXF). Our work focuses on elucidating the correlation between the environmental pH, including the possibility of protonation of the terminal amino group and deprotonation of the terminal carboxy group, and the charge-state-dependent formation of structures. OLs are found to behave clearly differently than PELs. The most striking result is that OLs, in contrast to PELs, form below the melting transition temperature a molecular superlattice based on a hydrogen bonding network among their headgroups. Interestingly, this superlattice is virtually uncharged and persists over a wide pH range.
Materials and methods
Ornithine lipid
To obtain the OL compound, an amide bond coupling ornithine residue and fatty acyl group was performed via several steps. Briefly, the commercially available α-Fmoc–δ-Boc–L-Orn–OH (compound 1) was benzylated by benzyl alcohol after the activation of carboxyl group of ornithine derivative by dicyclohexylcarbodiimide (DCC) and 4-dimethylaminopyridine (DMAP) to obtain compound 2 in good yield (70%) (Fig. 2, top).9 The N α-Fmoc group was then cleaved to give compound 3 in 84% yield (Fig. 2, top).10 (R,S) 3-hydroxytetradecanoic acid (compound 4) was converted into its benzyl ester (compound 5) in quantitative yield by reaction with benzyl bromide, triethylamine (TEA), and tetrabutylammonium iodide (Bu4 NI). Then the obtained benzylated compound was esterified with myristoyl chloride to give compound 6, which was purified and submitted to hydrogenation by Pd on carbon to give the fatty acyl moiety (compound 7) in 99% yield (Fig. 2, middle).11 The amide bond between ornithine and fatty acyl group was achieved by the acylation of the free amino group of compound 3 with compound 7, in the presence of isobutyl chloroformate (i-BuOCOCl) and N-methylmorpholine, to give the lipid ornithine compound (8) in 67% yield. The benzyl and the δ-Boc groups were cleaved respectively to give compound 10 with 98% yield (Fig. 2, bottom). Because the fatty acyl residue was obtained starting from R and S 3-hydroxytetradecanoic acid, two isomers of compound 10 were obtained RS and SS.11 As will be discussed further below, OL is not stable if stored in chloroform solution, resulting in a cyclic ornithine derivative. | ||
| Fig. 2 OL synthesis. Reagents and conditions: (a) DCC, DMAP, CH2Cl2, 0 °C, 24 h; (b) pyrrolidine, CH2Cl2, RT, 1 h; (c) benzyl bromide, Bu4 NI, TEA, EtOAc, RT, 24 h; (d) myristoyl chloride, pyridine, CH2Cl2, 0 °C then RT; (e) Pd/C, H2, RT, 3 h; (f) i-BuOCOCl, N-methylmorpholine, THF, 30 min at −15 °C then RT 24 h; (g) Pd/C, H2, RT, 2 h; (h) CF3 COOH. | ||
Materials
The solvents chloroform (purity ≥99.9%), methanol (purity ≥99.9%), and ethanol (purity ≥99.8%) were purchased from Sigma-Aldrich (Saint-Quentin Fallavier, France) and used as received. Hexane (purity ≥99.0%) was purchased from Chemsolute (Renningen, Germany) and used as received. MilliQ ultrapure deionized water (resistivity = 18.2 MΩ cm) was used for all purposes. Dimethyldioctadecylammonium bromide (DODAB) with a purity of ≥98% (TLC) was purchased from Sigma-Aldrich GmbH (Taufkirchen, Germany). Behenylsulfate (BS) was synthesized from behenyl alcohol and chlorosulphonic acid by Prof. B. Dobner (Institute of Pharmacy, University of Halle, Germany). For monolayer experiments the pH values of the subphases were adjusted by titration with HBr or Ca(OH)2. OL solution was obtained by dissolving lipid powder in chloroform at a concentration of ≈1 mg mL−1. Aqueous dispersions of OL were prepared by dissolving the lipid powder in chloroform/methanol (9![[thin space (1/6-em)]](https://www.rsc.org/images/entities/char_2009.gif) :1 vol:vol). The organic solvent was subsequently removed by placing the test tubes containing the lipid stock solution first under a gentle stream of nitrogen, and then overnight into a vacuum chamber. For the calorimetry and SAXS/WAXS experiments, dry lipid films were hydrated either in 25 mM glycine buffer adjusting for pH values of 2, 3, and 5 using HCl, or 20 mM Na-phosphate buffer (pH 7) for 2 hours at 65 °C and intermittently vortexed.
:1 vol:vol). The organic solvent was subsequently removed by placing the test tubes containing the lipid stock solution first under a gentle stream of nitrogen, and then overnight into a vacuum chamber. For the calorimetry and SAXS/WAXS experiments, dry lipid films were hydrated either in 25 mM glycine buffer adjusting for pH values of 2, 3, and 5 using HCl, or 20 mM Na-phosphate buffer (pH 7) for 2 hours at 65 °C and intermittently vortexed.
Differential scanning calorimetry (DSC)
Differential scanning calorimetry experiments were performed on dispersions of OL (2 mg ml−1) using a MicroCal VP, high-sensitivity DSC (MicroCal, Northampton, MA) at a scan rate of 30 K h−1. Each experiment consisted of three subsequent heating and cooling scans in the temperature range of 5–80 °C. Baseline subtraction was performed using Origin (OriginLab, Northampton, MA).Small-and wide angle X-ray scattering (SAXS/WAXS)
SAXS/WAXS experiments were carried out on a SAXPace compact camera (Anton Paar, Graz, Austria) attached to a 30 W Genix-3D microfocus generator (Xenocs, Sassenage, France) with Cu-anode producing a point-collimated X-ray beam of wavelength (λ = 1.54 Å). Aqueous dispersions (50 mg ml−1) were sedimented using a tabletop centrifuge (9000 g, 20 min) and filled into quartz-glass capillaries for measurements. Scattering patterns were recorded using an Eiger R 1 M detector system (Dectris, Baden-Daettwil, Switzerland) at a sample-to-detector distance of 180 mm, which allowed to detect the small- and wide-angle regimes simultaneously. Samples were equilibrated for 10 minutes and exposed for one hour total at each temperature using 12 frames à 5 minutes. Scattering patterns were reduced and background subtracted using SAXSanalysis (Anton Paar). Selected SAXS patterns were analyzed in terms of a global model for lamellar phases as detailed previously.12,13Pressure-area isotherms
Pressure-area isotherms were recorded either with a self-made, computer-interfaced film balance using the Wilhelmy method with a roughened glass plate or with the Langmuir trough (R&K, Potsdam, Germany) directly at the P08 beamline at DESY, Hamburg, using a filter paper plate as pressure sensor. The surface pressure was measured with an accuracy of ±0.1 mN m−1 and the molecular area with an accuracy of ±0.5 Å2. The OL solution was spread onto the surface of the aqueous subphase. After solvent evaporation, the Langmuir monolayer was laterally compressed by means of a movable barrier at a constant compression rate of dAL/dt ≈ 2–5 Å2 min−1, where AL is the available area per lipid.GIXD experiments
Grazing-incidence X-ray diffraction (GIXD) and total-reflection X-ray fluorescence (TRXF) experiments were carried out at the beamline P08 at storage ring Petra III of Deutsches Elektronen-Synchrotron (DESY, Hamburg, Germany) with beam energy 15 keV (wavelength λ = 0.826 Å). The incident X-ray beam strikes the air/water interface at a grazing incidence angle αi = 0.07°, at 85% of the critical angle of total external reflection αcr, thus allowing to selectively probe the immediate vicinity of the interface. The temperature-controlled Langmuir through was enclosed in a hermetically sealed container filled with helium. The beam footprint on the water surface was 1 mm × 60 mm as imposed by the incident beam optics. In order to stabilize the flatness of the water surface (suppress mechanically excited long-wavelength surface waves), a glass plate was placed into the aqueous solution below the beam footprint and about 0.3–1 mm below the water surface.The diffraction signal was collected with a one-dimensional position sensitive detector (PSD, MYTHEN, PSI, Villigen, Switzerland) by scanning the azimuth angle 2θ and, with that, the in-plane component Qxy = (4π/λ)sin(θ) of the scattering vector Q = (Qxy,Qz)T. The out-of-plane component, Qz = (2π/λ)[sin(α) + sin(αi)], is encoded in the vertical position of the PSD channels, where α denotes the angle between the scattered direction and the sample plane. The in-plane beam divergence was collimated with a Soller collimator placed in front of the PSD providing Δθ ≈ 0.09° (full-width-at-half-maximum, FWHM), corresponding to wresxy = (4π/λ)sin(Δ2θ/2) ≈ 0.012 Å−1.
Diffraction data analysis
To reconstruct the 2D crystalline structure of the monolayers, the diffraction peaks on the resulting intensity maps I(Qxy,Qz) were then analyzed along established procedures.14–16 The details given in the following paragraph are largely reproduced from a previous publication.17 Non-linear least squares fits of the I(Qxy,Qz) maps were performed to determine the precise positions and shapes of all diffraction peaks associated with a crystalline structure of the monolayer. Diffraction peaks were modeled with Gaussian functions in Qz-direction and Lorentzian functions in Qxy-direction, according to the previously established procedure.18,19 Each diffraction peak (identified with index i) is characterised with the positions (Q0xy(i), Q0z(i)) and widths (wxy(i), wz(i)) in in-plane and out-of-plane directions, accordingly. However, as required by the accepted geometrical model20–22 for the three peaks associated with the crystalline arrangement of tilted chains, two boundary conditions were imposed regarding the positions and widths of the peaks in out-of-plane direction:| Q0z(1) + Q0z(2) = Q0z(3) with Q0z(1) ≤ Q0z(2) ≤ Q0z(3) | (1) |
| wz(1) = wz(2) = wz(3) = wz. | (2) |
The background on which the peaks are situated was modeled with a two-dimensional polynomial function comprising a constant and terms proportional to Qz, to Qxy, and to Qz·Qxy. A representative example of an experimental I(Qxy,Qz) map and the modeled intensity are shown in Fig. 3(A) and (B). The integrated intensities in Qxy- and Qz-directions are shown in panels C and D, respectively.
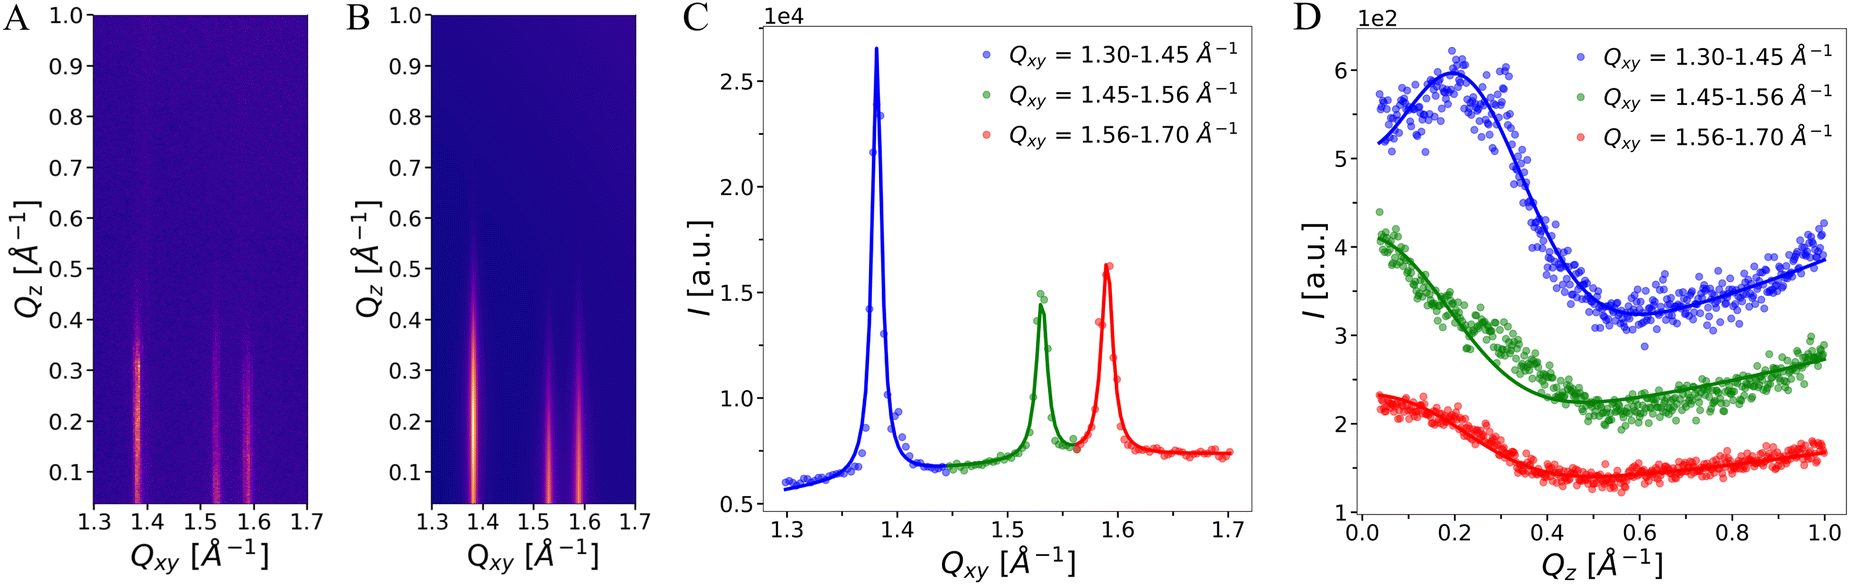 | ||
| Fig. 3 (A) GIXD pattern (intensity vs. Qxy and Qz) of an OL monolayer at 20 mN m−1 on water subphase at pH 3. (B) Modeled intensity. (C) Qz-integrated intensity vs. Qxy. The lines represents fit to the data points. (D) Piece-wise Qxy-integrated intensity vs. Qz. The integration ranges are given in the legend. Data and fits are shifted vertically for clarity. | ||
Peak indexing and lattice structure reconstruction
The following paragraph is largely reproduced from a previous publication.17 The two dimensional lattice of lipid chains was defined by the primitive vectors a and b, with lengths a and b, respectively, and the angle γ between them. The associated lattice repeat distances dhk = 2π/Qxy(hk), identified by the Miller indices h and k, encode these lattice parameters16,23 according to the relation: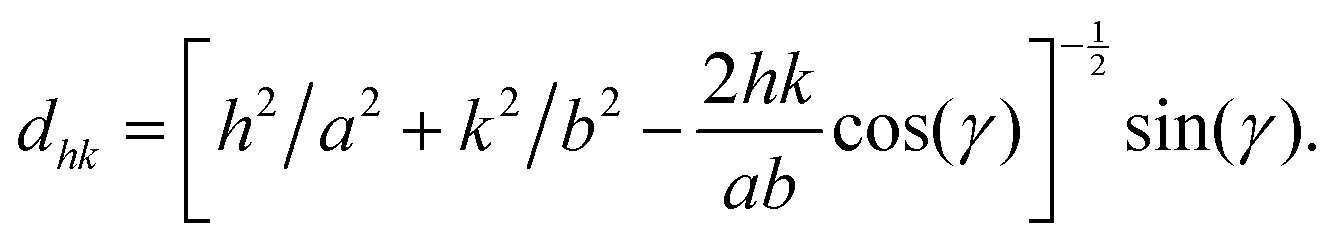 | (3) |
The crystallographic in-plane area per (two-chained) lipid then follows as Aclip = 2absin(γ). The chain tilt t with respect to the surface normal was obtained from the peak positions according to
| Qz(hk) = Qxy(hk)cos(ψhk)tan(t) | (4) |
According to the above definitions, the three lowest order peaks originating from the alkyl chain lattice correspond to the Miller index pairs (0,1)/(0,−1), (−1,0)/(1,0), and (1,−1)/(−1,1). However, a superlattice formed by whole molecules would then inconveniently have to be described by fractional indices. Instead, as in earlier studies,17,19,24 all peaks were indexed according to the superlattice under consideration and not according to the hydrocarbon chain lattice. Superlattice unit cell vectors, as and bs, were described as multiples of the chain lattice unit vectors, as = a1a + a2b and bs = b1a + b2b, respectively, with integers a1, a2, b1, and b2. Every diffraction peak was indexed with new integer Miller indices hs and ks corresponding to the superlattice unit cell vectors. The integers a1, a2, b1, and b2 were then systematically varied until the positions of all observed diffraction peak were simultaneously matched with sets of hs and ks within satisfactory precision (deviation smaller than 0.008 Å−1).24,25
TRXF experiments
Concomitantly with the GIXD measurements, TRXF experiments were performed on the Langmuir monolayers using the same setup. The X-ray fluorescence signal was detected with a X-123SDD detector (Amptek, Bedford, USA) placed almost parallel to the liquid surface and perpendicular to the photon beam axis. This detector position was chosen in order to keep the Compton scattering at the given polarization of the photons as low as possible. A detailed description of the theoretical background and experimental procedure of TRXF can be found in.26–29TRXF analysis
The X-ray fluorescence spectra were analyzed by fitting with multiple Gaussian functions representing the emission lines of the chemical elements. Constraints on the peak positions were imposed based on the tabulated line energies.30 In order to calibrate the surface excesses of Br− and Ca2+, dimethyldioctadecylammonium bromide (DODAB) and behenylsulfate (BS), respectively, were used as reference monolayers. DODAB with its quaternary ammonium headgroup ensures a permanent positive charge. BS contains one negative charge throughout the pH range used in the present work. Moreover, for both DODAB and BS the area per molecule at a given lateral pressure has been determined by GIXD experiments on a water subphase containing 1 mM Ca(Br)2. BS at Π = 25 mN m−1 forms an oblique lattice (a = 5.35 Å, b = 5.59 Å, γ = 106.1°) with strongly tilted but tightly packed chains (t ≃ 47°, A0 = 19.7 Å2). The molecular in-plane area is therefore 28.7 Å2, leading to a surface charge density of 0.558 C m−2. This value is slightly smaller than the one observed with monovalent cations (0.64 C m−2).31 DODAB at Π = 35 mN m−1 also forms an oblique lattice (a = 5.19 Å, b = 5.447 Å, γ = 115.1°) with strongly tilted but tightly packed chains (t ≃ 39°, A0 = 20.0 Å2). The molecular area amounts to 51.2 Å2 in perfect agreement with already published GIXD data.32 The surface charge density therefore is 0.313 C m−2. The counterions adsorbed to a charged monolayer are confined to a thin layer with an extension of less than 5 Å.27 When comparing the ion fluorescence between different monolayer systems, the thickness of the overlying monolayer has to be taken into consideration. Namely, the intensity Φe of the evanescent wave decays approximately exponentially with the depth starting from the air/monolayer interface. Its value at the ion adsorption plane is Φe(d) ≈ Φ0·exp(−d/Λ), where Φ0 is the incident intensity, d is the thickness of the ion-impenetrable hydrophobic part of the monolayer, and Λ ≈ 7 nm is the decay length of the evanescent wave for the given grazing-incidence configuration. The resulting attenuation correction factors according to eqn (5) in the Results section follow as α = exp(d/Λ) and αR = exp(dR/Λ), where dR applies to the reference monolayer.The thickness of the chain region of BS, dBS was determined with two approaches: the C22 alkyl chain of BS is in all-trans conformation with a cross-sectional area of A0 = 19.7 Å2 and strongly tilted (t = 47°). The theoretical length of such a stretched alkyl chain is lmax = 1.54 Å + n·1.265 Å = 29.3 Å, where n = 22 is the number of CH2 groups.33 The resulting layer thickness is then dBS = lmax·cos(t) = 20.0 Å. A consistent alternative estimate follows as dBS = mhch/(Aρ) = 19.9 Å from the molecular mass mhch of the hydrophobic chain, the molecular area A ≈ 29 Å2, and the mass density ρ ≈ 0.9 g cm−3 (value for polyethylene). Using the same approach, the thickness values of DODAB (at Π = 20 mN m−1) and of OL (at all pressures in the LC phase) were obtained as dDODAB = 16 Å and dOL = 20.5 Å.
Results
The aqueous media used for OL mono- and bilayers had pH values ranging from 2 to 10. For the monolayer experiments the aqueous solutions contained 1 mM CaBr2, which is needed for the TRXF measurements but, as will be shown, has no significant influence on the monolayer behavior. Unless stated differently, all experiments were conducted at 20 °C or well above the chain melting transition.In the following we first address the behavior of OL in bilayers, as observed by DSC and SAXS/WAXS. Subsequently we move on to discuss isotherms, GIXD, and TRXF results on OL monolayers. Next, we integrate monolayer and bilayer results, and finally we compare our findings on OLs to the well-known behavior of PELs.
Thermotropic behavior of OL bilayers
Phase transitions in aqueous OL bilayer dispersions were determined by differential scanning calorimetry (DSC). Absolute values of the isobaric heat capacity Cp were determined by subtracting a baseline and normalizing by lipid concentration following standard protocols (see e.g.34). The transition enthalpies are given per definition by the integral over Cp in the melting regime. The heating and cooling scans reveal a significant increase of the chain melting transition temperature Tm with increasing pH (Fig. 4). For example, upon heating Tm = 42.5 °C at pH 2 and Tm = 58.9 °C at pH 7. The transition peaks are broad and asymmetric upon heating, but exhibit multiple maxima upon cooling, starting with a sharp transition peak at the highest temperature, signifying high cooperativity. Moreover, we observed a pronounced hysteresis for the transition temperatures at pH 5 and 7, with the largest temperature difference at pH 5 (ΔTm ≈ 13 K). The peak splitting upon cooling might be connected to the presence of differing populations of charged/uncharged forms of OL. Interestingly, the transition enthalpies, ΔHm ≈ 7–8 kcal mol−1, do not vary significantly with pH, and are significantly higher than those reported for chain-analogous phosphatidylcholine lipids (PCL) or PEL (ΔHm ≈ 6 kcal mol−1). Consistently, also the melting temperatures35,36 of dimyristoyl PC (23.6 °C) and of dimyristoyl PE (49.3 °C) are significantly lower than that of OL at neutral pH.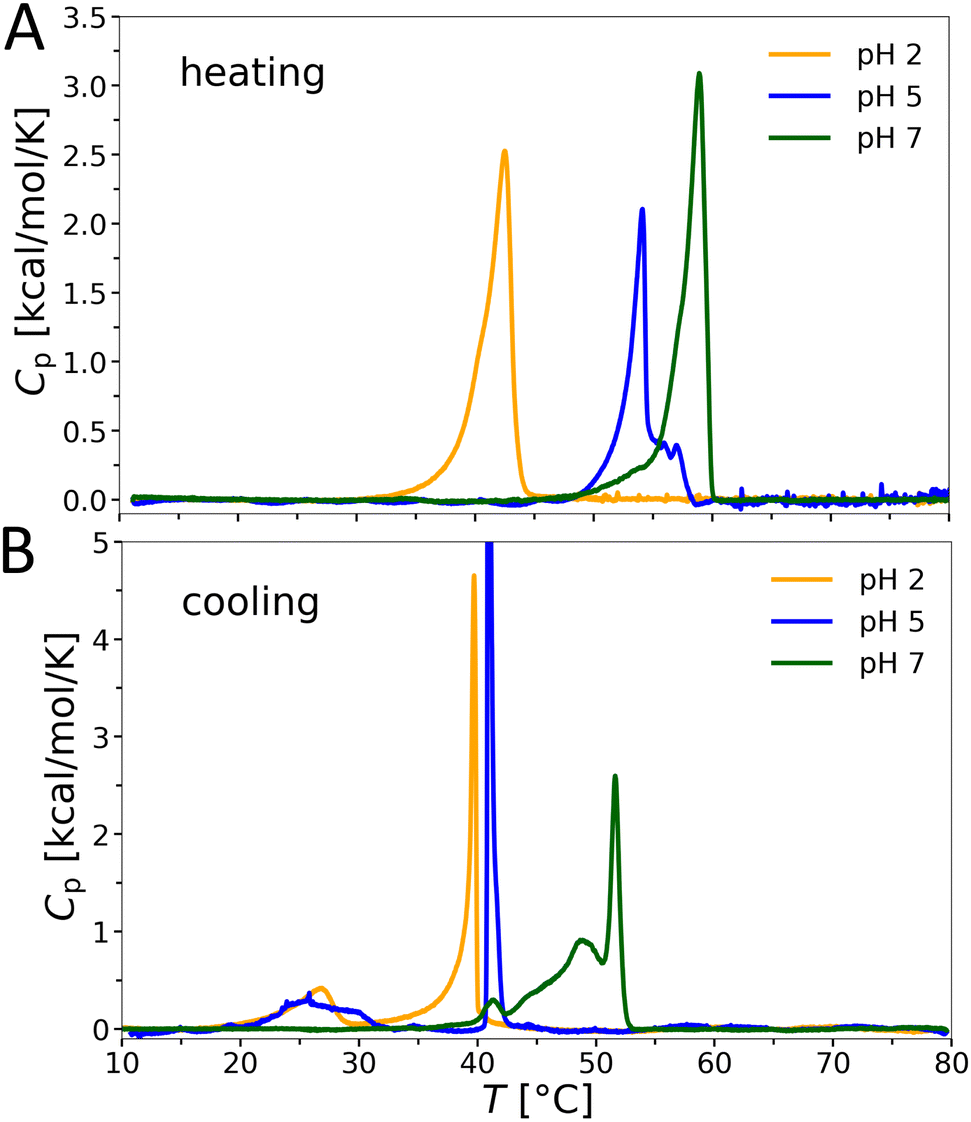 | ||
| Fig. 4 DSC heating and cooling scans (3rd out of 3) of OL bilayer suspensions as a function of pH. | ||
Structure of OL bilayers
We next performed SAXS/WAXS experiments on OL suspensions as a function of pH and temperature. Below the chain melting temperature, wide-angle data (Q > 1.2 Å−1) show a peculiar pH-dependence of the hydrocarbon chain packing (Fig. 5(A)). At pH 2, only one wide-angle peak is observed at Q = 1.46 Å−1 leading to an unusually large cross-sectional area of the chains (21.4 Å2) when assuming upright hexagonal packing. However, this peak is asymmetric, suggesting a smeared shoulder at higher Q-values. The WAXS pattern of a sharp peak followed by a broad shoulder at higher Q resembles the one of chain-ordered PCL (DPPC)37 with a chain tilt of ≈32°, which is consistent with the GIXD pattern38 of DPPC at the monolayer–bilayer equivalence pressure of 30–35 mN m−139 when considering the the projection of the WAXS peak on the Qxy, Qz axes that are distinguished by GIXD. In the present case of OL at pH 2, the intensity shoulder is at only Q ≈ 1.48 Å−1 when fitting the WAXS peak with two Lorentzian functions, indicating a much smaller chain tilt angle of OL than that in DPPC bilayers. Such a pattern appears to correspond to an orthorhombic unit cell with a chain-cross-sectional area of ≈ 21.0 Å2, which is reasonable for a “long-branched”40 C14 chain, since 3-myristoyl-oxy-myristic acid is used for the synthesis of OL (see Fig. 2). No additional Bragg peaks are found in the mid-Q (0.6 Å−1 < Q < 1.2 Å−1) to high-Q-region. Scattering patterns of chain-ordered OL bilayers at higher pH are more complex. Besides two main chain peaks in the high-Q-region, additional small peaks are observed in the mid-Q-region. The positions of the main chain peaks centered at Q ≈ 1.38 Å−1 and Q ≈ 1.56 Å−1 are practically the same at pH 7 and pH 5, but shifted to slightly higher Q-values at pH 3. At pH 3, 5, and 7, additional peaks in the mid- Q-region at Q ≈ 0.7 Å−1 and at Q ≈ 1.0 Å−1 can be identified. These weak peaks are sharp at pH 7 and broader at pH 5 and 3. Similar features were previously reported for lamellar subgel phases41,42 and indicate the formation of a molecular superlattice, which is obviously absent at pH 2 and slightly perturbed at pH 3 and pH 5.
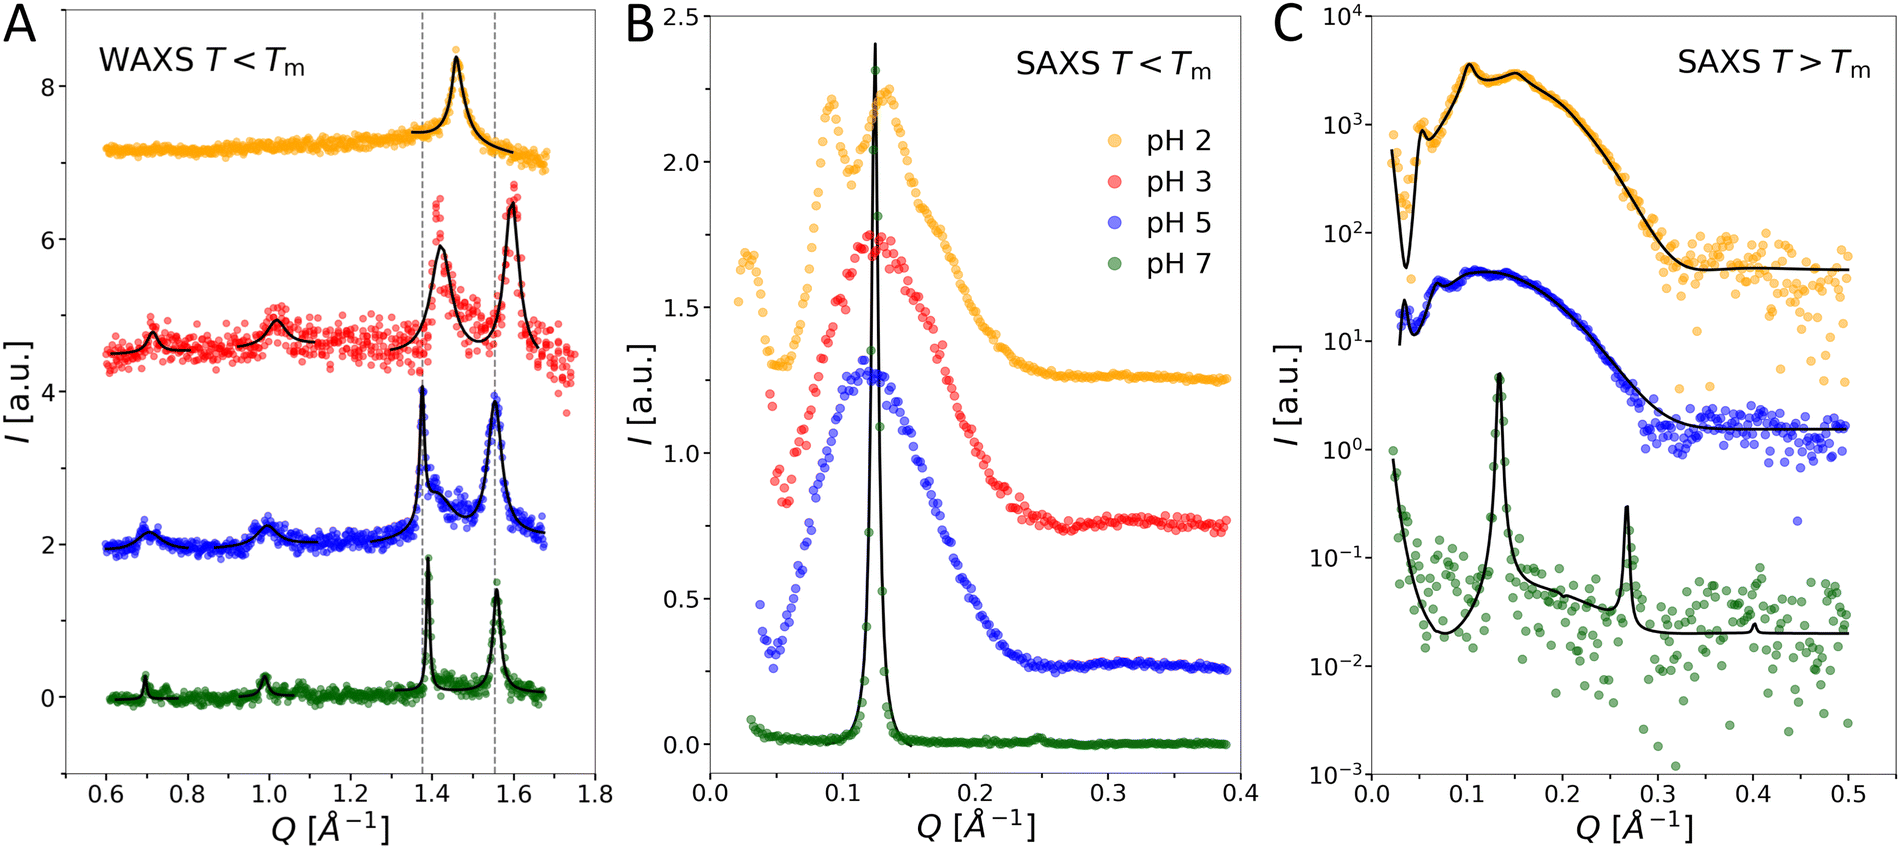 | ||
| Fig. 5 Elastic X-ray scattering of OL vesicles as a function of temperature and pH. (A) WAXS and (B) SAXS data recorded well below the Tm at pH 2, 3, 5, and 7. Dashed grey lines in panel A exemplarily indicate the peak positions at pH 5 (Q = 1.38 Å−1 and 1.56 Å−1) as guides for the eye. Solid lines in panels A and B indicate Lorentzian fits of selected peaks. (C) SAXS data at pH 2, 5, and 7 above the Tm. Solid lines correspond to best fits using a global analysis model. | ||
Focusing on the SAXS region (Q < 0.6 Å−1, Fig. 5(B)), several Bragg peaks and broad intensity modulations are observed at pH 2, which correspond to a d-spacing of ≈144 Å. At pH 3 and pH 5, only broad modulations of the scattering intensity occur. The absence of Bragg peaks and the specific modulation of the scattering intensity suggests the formation of positionally uncorrelated bilayers and might indicate the presence of a small amount of charged species.43–45 Based on the scattering pattern observed at pH 3 and pH 5, the more complex pattern at pH 2 indicates the formation of positionally weakly correlated bilayers. Finally, sharp Bragg peaks with a lamellar repeat distance of d = 52.3 Å are observed at pH 7. Such Bragg peaks in the SAXS region indicate positionally correlated bilayers, which originate from the formation of multilamellar aggregates due to attractive interactions between the individual bilayers.13,46,47
Above the Tm, the WAXS patterns at all pH values exhibit a single broad wide-angle peak centered at Q ≈ 1.39 Å−1 (data not shown), signifying molten hydrocarbon chains. The small-angle region (Fig. 5(C)) shows either broad Bragg peaks combined with broad intensity modulations (pH 2 and pH 5) or only sharp peaks (pH 7). These data were analyzed in terms of a global analysis model, as detailed previously.12,13 Unfortunately, OL bilayers, unlike phospholipid bilayers, have only weak electron density contrast between their headgroups and the aqueous phase. This leads to low SAXS signals even for concentrated OL dispersions and extended exposure times. Consequently, electron density profiles cannot be determined at sufficient resolution in order to precisely deduce the membrane thickness. However, we are still able to determine an approximate value of 40 Å for the overall membrane thickness. In contrast, d-values can be determined with great accuracy. Here we find two highly swollen structures, d = 122.7 ± 0.3 Å (pH 2) and 183.2 ± 0.8 Å (pH 5), as well as closely bound multibilayers, with only a very thin interstitial water layer, at pH 7, with d = 46.9 ± 0.1 Å. Comparing the different d-values indicates strong attractive interactions or the absence of a pronounced short-range hydration repulsion48 between the OL lamellae at neutral pH, while repulsion, most likely of electrostatic origin, seems to dominate interbilayer interactions at lower pH. Note that we cannot conclude whether the positional correlation in the highly swollen multilamellar aggregates is due to a force balance at large membrane separations or due to limited sample hydration dictated by the preparation technique described in Materials and Methods section. However, the latter scenario might explain the absence of positional correlations below the Tm at pH 5. In this view the lateral expansion of the vesicles across the melting transition (typically ≈25%) would sufficiently increase the vesicle size to induce positional correlations between the densely packed liposomes.
Monolayer isotherms
OL monolayers were investigated in a pH range between pH 3 and 10, over which the Π–A isotherms are quite similar, see Fig. 6(A). This observation suggests that the charge densities at pH 3 and 10 are either very low or at least similar in magnitude, albeit presumably of opposite sign because the terminal amino group is expected to be protonated at low pH (leading to a net positive charge) whereas the terminal carboxy group is expected to be deprotonated at high pH (leading to a net negative charge). Both isotherms have a pressure lift-off point at around AL ≈ 77 Å2, indicating the existence of a liquid-expanded (LE) phase at low lateral pressures. At pH 3 the transition into an ordered phase is characterized by a hindered nucleation seen by a local pressure maximum in the isotherm.25,49 This surface-inhibited nucleation requires an over-compression (supersaturation of the LE phase) to initiate the nucleation process. Therefore, the compression curves do not represent equilibrium conditions. In contrast, the decompression isotherms, which do not exhibit such a local maximum, can be assumed to resemble equilibrium conditions more closely. The hysteresis between compression and decompression is significant, with a pressure difference of 4–5 mN m−1. The pH has only little influence on the transition pressure. However, no over-compression is observed at pH 10. The plateau region, characterizing the first-order transition from ordered to LE in the decompression isotherms, is very flat on the pH 3 subphase but significantly tilted on the pH 10 subphase. The latter may be an indication of a mixture of differently charged species. The chain-analogous PEL DMPE exhibits also an isotherm with a plateau region around 10 mN m−1 at 20 °C. However, such a comparison is not straightforward due to the different chemical structures in the backbone and hydrophobic regions that will be discussed later in more detail.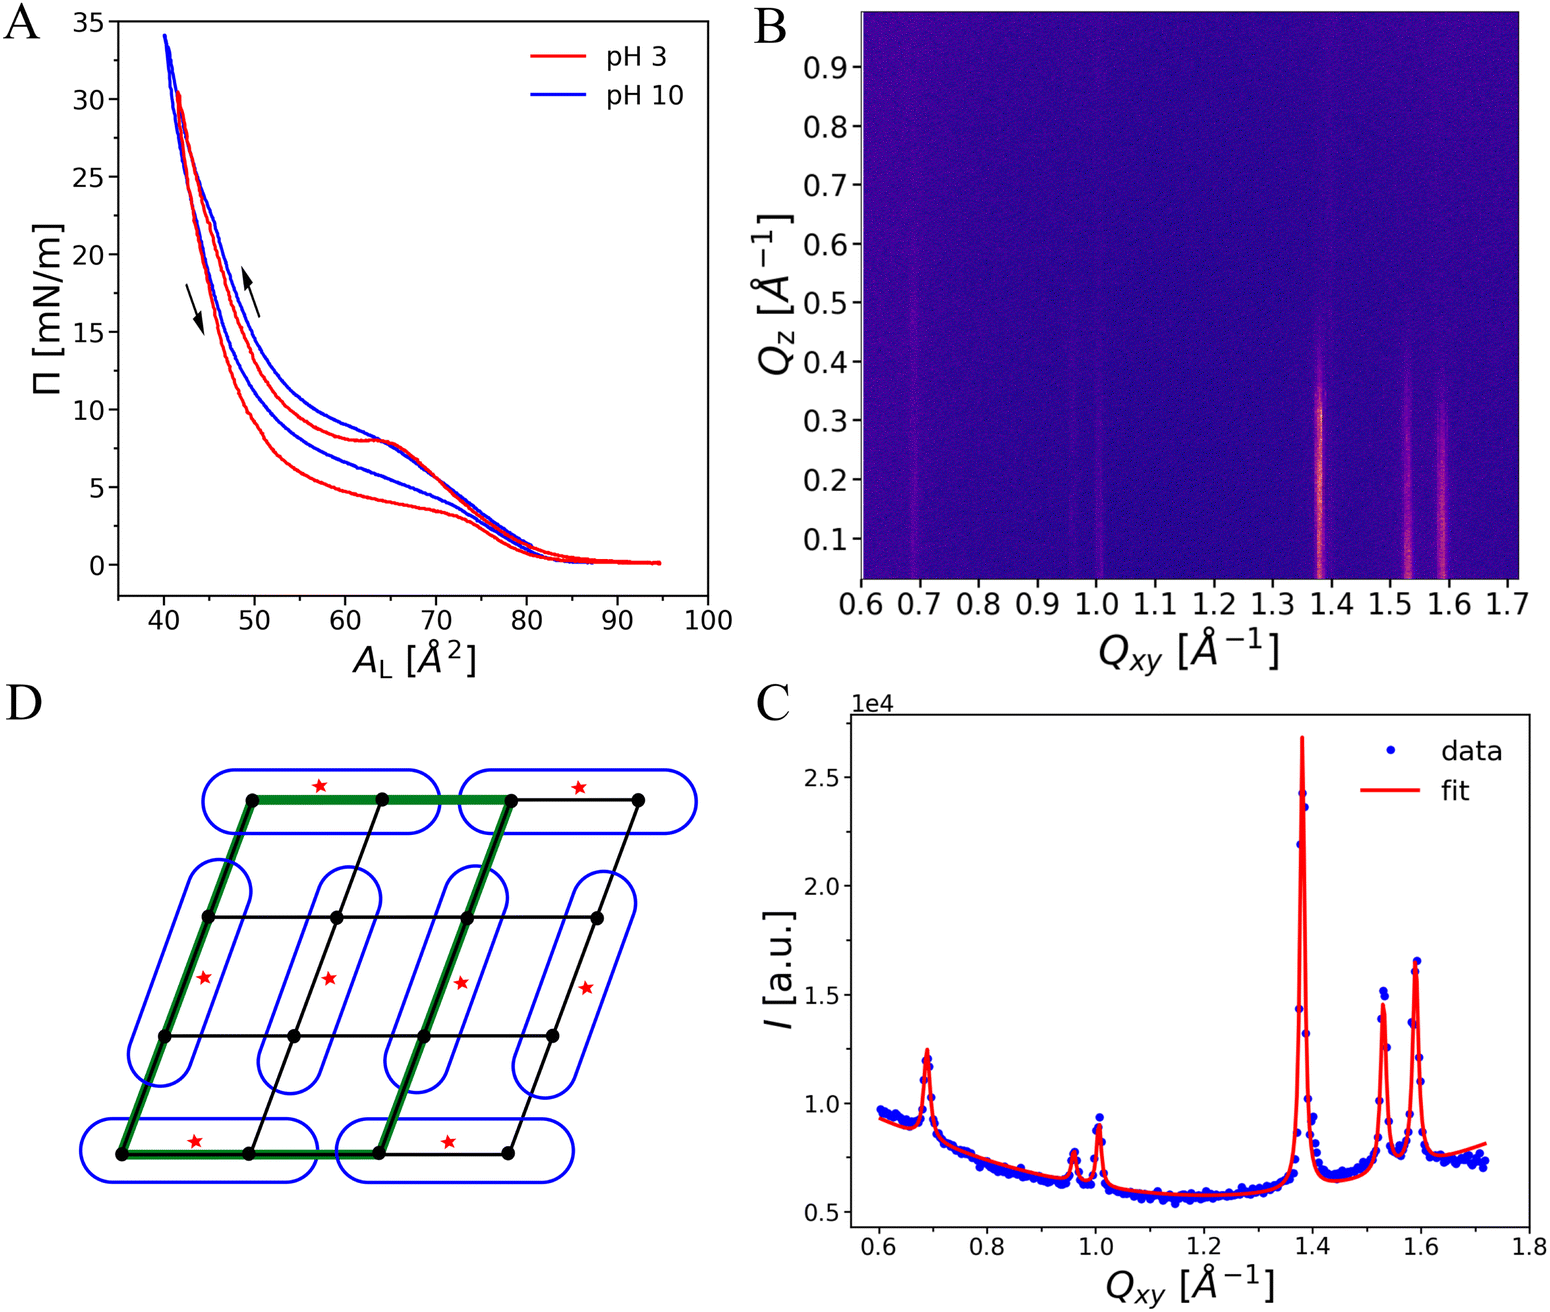 | ||
Fig. 6 (A) Pressure vs. area isotherms of OL at low and high pH. The sub-phases additionally contain 1 mM CaBr2 for TRXF measurements. The available area per lipid AL was calibrated with the crystallographic area per lipid in the LC phase at Π = 30 mN m−1. (B) GIXD pattern (Intensity vs. in-plane component Qxy and the out-of-plane component Qz of the scattering vector ![[Q with combining right harpoon above (vector)]](https://www.rsc.org/images/entities/i_char_0051_20d1.gif) ) for an OL monolayer at Π = 20 mN m−1 on pH 3 subphase containing 1 mM CaBr2. (C) Integrated GIXD intensity vs. Qxy (blue symbols) and the corresponding fit (red line) for the same sample. (D) Schematic top-view representation of the corresponding molecular lattice. One of the possible molecular arrangements is shown. The back dots and red stars indicate the position of the chains and headgroups, respectively. Black lines indicate repeating unit cell of alkyl chains. The molecular lattice is defined with a green parallelogram. ) for an OL monolayer at Π = 20 mN m−1 on pH 3 subphase containing 1 mM CaBr2. (C) Integrated GIXD intensity vs. Qxy (blue symbols) and the corresponding fit (red line) for the same sample. (D) Schematic top-view representation of the corresponding molecular lattice. One of the possible molecular arrangements is shown. The back dots and red stars indicate the position of the chains and headgroups, respectively. Black lines indicate repeating unit cell of alkyl chains. The molecular lattice is defined with a green parallelogram. | ||
GIXD on monolayers
To obtain information about the molecular arrangement in the ordered phase, GIXD experiments were performed. The diffraction patterns exhibit up to eight peaks in the mid-to-wide angle region within the measured Qxy-range. The peak positions are consistent with those observed by SAXS/WAXS in OL bilayers, demonstrating that OL monolayers and bilayers have essentially the same structural features. The peak positions shift only slightly upon compression and are virtually unaffected by the subphase pH (see ESI,† Fig S1–S5 and Tables S1–S7). As a representative example, we discuss in the following the diffraction pattern of OL at Π = 20 mN m−1 at pH 3, see Fig. 6(B). The simulated intensity pattern corresponding to the best-matching parameters is shown in the ESI,† Section 1, Fig. S2. The Qz-integrated experimental and simulated intensities are shown in panel C. The three most intense peaks in the wide-angle region indicate the ordering of the alkyl chains in an oblique lattice. The peaks in the mid-angle region are the fingerprint of a molecular superlattice, as was observed earlier for glycolipids17,19,24 but also for lipids with phosphatidylcholine (PC) headgroups under certain conditions in bulk.41,42,50–52 This molecular superlattice of OL can be attributed to a strong hydrogen-bonding or dipole network between the lipid headgroups.The three chain peaks at (Qxy, Qz) = (1.38, 0.20) Å−1, (1.53, 0.08) Å−1, and (1.59, 0.12) Å−1 correspond to Miller index pairs (0,1)/(0,−1), (1,0)/(−1,0), and (1,−1)/(−1,1) and characterize an oblique chain lattice with a = 4.49 Å, b = 4.98 Å, and γ = 114.1°, see Methods section. The chains are only weakly tilted, t ≈ 8°, and packed with a chain cross-sectional area of A0 = 20.2 Å2, which is typical for phospholipids in a condensed monolayer with free rotation of the chains.22,53–56 The obtained peak width along Qz (wz in eqn (2)) according to the Scherrer equation corresponds to a diffracting layer thickness17,19 of ≈16 Å, which is in satisfactory agreement with the predicted length of extended C14 chains in all-trans conformation (≈18 Å).33
Based on the additional diffraction peaks and on the above chain lattice, a molecular superlattice is obtained as described in Methods section and in.17,19,24 The lattice points in such a superlattice represent groups of whole molecules instead of a single hydrocarbon chain. Since the chains are chemically bound parts of the molecules, the superlattice inevitably has to be commensurate with the chain lattice. In fact, superlattices and chain lattices were reported to be commensurate even in cases where the superlattice was defined by a non-covalently bound layer of cadmium adsorbed to arachidate monolayers.57–59 In the present case, the most compact superlattice compatible with the observed diffraction peaks has the unit cell vector lengths as = 3·a = 13.47 Å and bs = 2·b = 9.96 Å. This superlattice with an area of 122.5 Å2 comprises three OL molecules, corresponding to six hydrocarbon chains with Axy = 20.4 Å2. The three molecules feature distinct characteristics such as varying headgroup orientations, as schematically exemplified in Fig. 6(D). In fact, it is highly plausible that the headgroups have to assume distinct orientations in order to be engaged in dipolar intermolecular interactions. It should be noted that not all peaks that can occur with this lattice are visible in the diffraction pattern. Peak intensities can be zero in case of certain symmetries or immeasurably low when the electron density variation on the associated length scale is low (near-vanishing form factor). The molecularly-crystalline arrangement of the OL molecules agrees well with the lack of noticeable changes in the monolayer structure upon lateral compression. The low extent of chain tilting indicates that the in-plane area requirement of the headgroup is very similar to that required for two alkyl chains. Interestingly, this superlattice is not affected even by strong variations of the subphase pH (see ESI,† Sections 2 and 3). The formation of a strong hydrogen-bonding or dipolar network is apparently much more energetically favorable than the variation the headgroup protonation state.
TRXF on monolayers
In the next step, the pH-dependent protonation state of OL in the monolayers was quantified with the help of TRXF, an element-specific complementary scattering technique26–28,60 that uses the same measurement setup as GIXD. Following the strategy in our earlier work,26,61 the interfacial ion excess is used as a proxy of the monolayer charge density, which in turn is a direct function of the protonation degree of the lipids.The subphases contain only one type of counterion of each sign (Br− as anion and Ca2+ as cation) to avoid ion competition in the formation of the electrical double layer (EDL). The divalent cation Ca2+ was chosen because calcium trace contamination in ultra-pure water can contribute to the competition in an undesired manner when monovalent cations are used.61 It should be noted that the subphase pH was adjusted with HBr or Ca(OH)2 and salt was added such that the final concentration the counterion of interest (Br− at low pH and Ca2+ at high pH) was kept always constant (see also Materials section).
The number of excess ions adsorbed to the monolayer per unit area, Γ, is extracted from the ion-specific fluorescence intensity I by accounting for bare-surface and reference measurements:
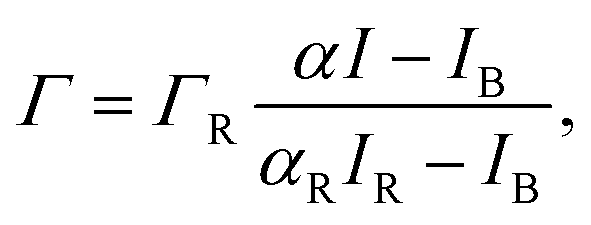 | (5) |
Fig. 7 shows the relevant regions of fluorescence spectra (Ca: Kα1 = 3.69 keV, Kα2 = 3.69 keV, Kβ1 = 4.01 keV and Br: Kα1 = 11.92 keV, Kα2 = 11.88 keV, Kβ1 = 13.29 keV) obtained with OL monolayers at two different pH conditions. Surprisingly, at all pH values of the subphase, only a weak ion excess is observed (Γ ≪ ΓR). Such negligible counter-ion excess does not necessarily require the absence of any charged groups at an interface. As was shown earlier for zwitterionic PCL62 and for stoichiometric mixing of lipids with oppositely charged groups that form ion pairs,63 salt ions merely respond to the net charge density of the interface when oppositely charged groups are densely packed, as in the present case. With this in mind, the OL monolayers behave as practically charge-neutral even at clearly non-neutral pH. This is remarkable, because for free ornithine the protonation states of carboxy and amino groups are supposed to be highly pH dependent, such that a net positive charge is expected at pH 3 and a net negative charge is expected at pH 10.64 In contrast, our results indicate that the density of positively and negatively charged groups remains essentially equal, irrespective of the pH. Apparently, zwitterionic or totally uncharged molecular states are stabilized by intermolecular interactions in the superlattice. Zwitterionic states may be stabilized by favorable dipolar interactions between the oppositely charged amine and carboxy groups of adjacent lipids forming a 2-dimensional network of “ion pairs”. Similarly, uncharged states may be stabilized by an energetically favorable hydrogen bonding network (HBN). In both cases the protonation state that allows for superlattice formation is apparently strongly stabilized against pH-induced variations.
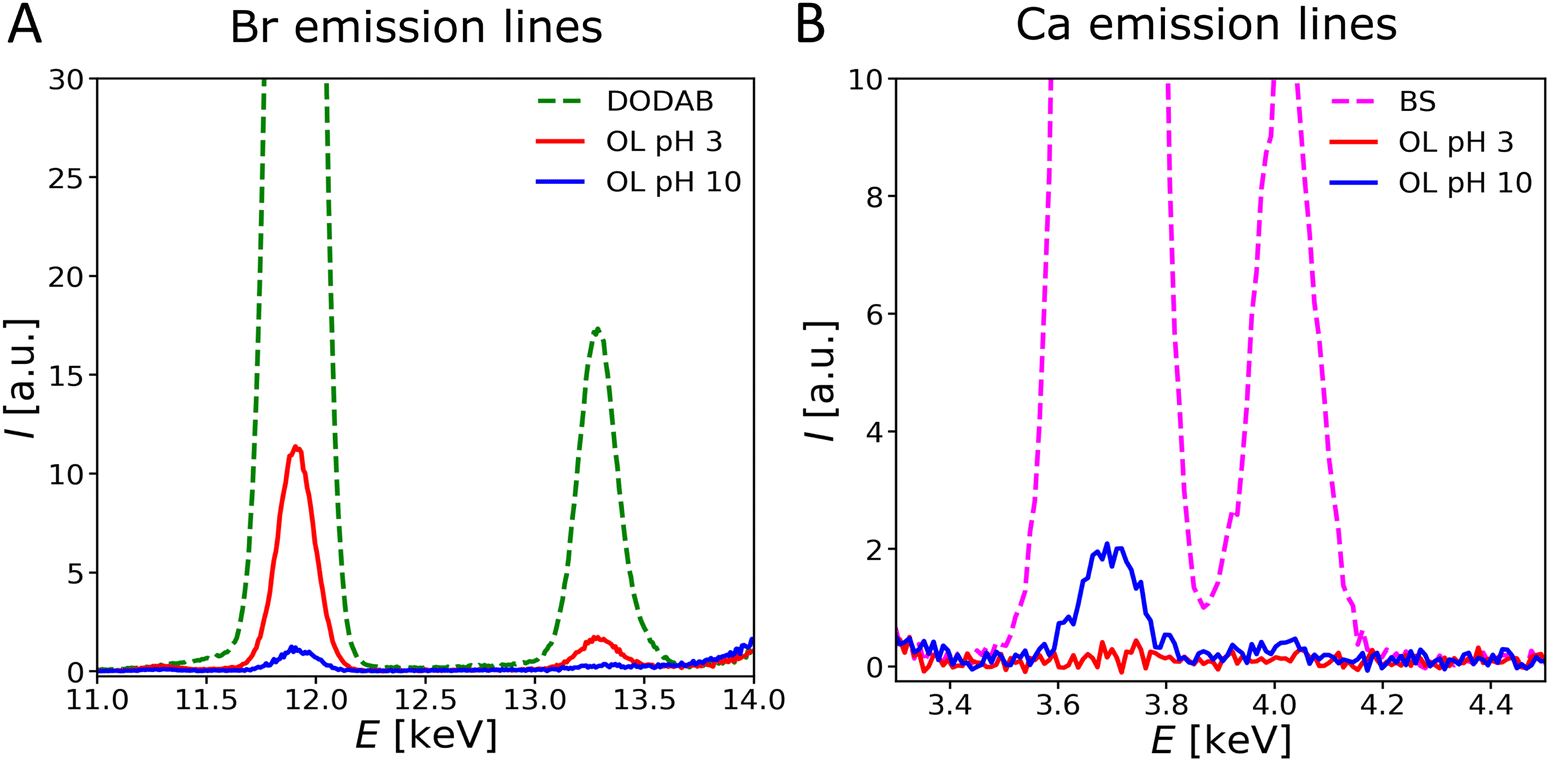 | ||
| Fig. 7 Emission lines of Br (A) and Ca (B) in the X-ray fluorescence spectra of OL at 30 mN m−1 at pH 3 (red) and at pH 10 (blue). The emission lines for the charged reference systems DODAB (dotted-dashed, green) and BS (dotted-dashed, magenta) are shown for comparison. | ||
An important argument in favor of the formation of an HBN in OL monolayers is the observation of a rigid structure that does not respond to changes in surface pressure or pH. The tilt angle of the hydrocarbon chains is approximately the same at all pressures. Similar behavior has been observed in uncharged glycolipid monolayers forming a HBN-based supramolecular lattice,19 which can be attributed to the fact that hydrogen bonds are short and directed.65 In contrast, monolayers forming ion pairs do not attract counterions either, but were reported to respond to increasing lateral pressure with decreasing tilt angle.63 At pH values between the two pKa values of amino acids (≈ 2–9), the formation of a highly ordered structure based on HBN thus seems to be energetically more favorable than keeping the headgroup in the zwitterionic state. In general, weak ion adsorption can also occur to non-charged lipid monolayers due to ion-specific preferential interactions with defined motifs.19 However, closer inspection reveals that in the present case the weak excess (always less than 1 ion per 10 OL molecule) is somewhat more pronounced for Br− at low pH and for Ca2+ at high pH, indicating that the monolayer is slightly positively charged at low pH and slightly negatively charged at high pH, in line with the expected trend but much weaker in magnitude. Nevertheless, according to earlier reports,45 even rather low charge densities are able to lead to the disruption of the lamellar ordering of bilayers observed here by SAXS. Based on the observed low monolayer charge and its weak interaction with the ions, one can safely assume that the presence of 1 mM CaCl2 has little influence on the monolayer structure.
Comparison of monolayer and bilayer systems
On a qualitative level, the in-plane structures formed by OL in monolayers and bilayers below the Tm are consistent. At moderate pH values between 3 and 10, the formation of an HBN-stabilized molecular superlattice characterized by additional peaks in the mid-Q-range is observed in both cases. On a quantitative level the lattice parameters in mono- and bilayer systems appear to be slightly different. In the monolayer, the chain lattice is oblique whereas in the bilayer, it seems to be orthorhombic. However, it cannot be completely excluded that the peak observed at Qxy = 1.53 Å−1 by GIXD on monolayers is simply too weak to be observed in the bilayer experiments, due to unfavorable overlapping of structure factor and form factor. Possible differences may in general be attributed to cross-leaflet interactions affecting the membrane organization, but we have to refrain from such a detailed comparison between WAXS on OL bilayers and GIXD on OL monolayers because the WAXS data do not resolve all the necessary details.At pH 5 and pH 3 uncorrelated bilayers are found below Tm, which demonstrates that the HBN is only formed between the headgroups in one leaflet but not between adjacent bilayers. At the extreme pH value of 2, OL bilayers no longer form any superlattice and seem to be charged, suggesting that a HBN that requires the uncharged headgroup state cannot be maintained against the strong protonation stress. Without the superlattice the chain tilt increases due to the larger distances between the headgroups as a result of their charge. The absence of a superlattice at pH 2 might be also the reason for the much smaller hysteresis between the heating and cooling DSC curves compared to pH 5 and 7. Apparently, the regeneration of the HBN, which is broken upon heating above the main transition temperature, needs longer after cooling the sample down.
Comparison of OL and PEL
Comparing OL and PEL is not straightforward because of differences not only in the headgroup chemistry but also in the chain-headgroup linkage. In the case of PEL, two chains are connected via the glycerol backbone with the headgroup. In OL, the C14 fatty acid used for the synthesis is branched at position 3 and the glycerol backbone is not existing. According to tabulated pK values one would expect the headgroup of both PEL and OL to be zwitterionic at physiological pH, i.e., to carry an electric dipole.All the above experiments consistently evidence a much stronger tendency of OL to form highly ordered structures compared to chain-analogous PELs. Importantly, the observed molecular superlattice in the OL monolayers is practically incompressible with regard to the tilt and molecular area (Fig. 8, blue symbols) and essentially charge-neutral over a wide pH range, whereas the chain lattice of DMPE can be easily compressed up to the non-tilted state (Fig. 8, red symbols).66,67 Taken together, these findings indicate that the lattice structure as well as the non-charged protonation states of carboxy and amino groups are strongly stabilized by a favorable HBN.
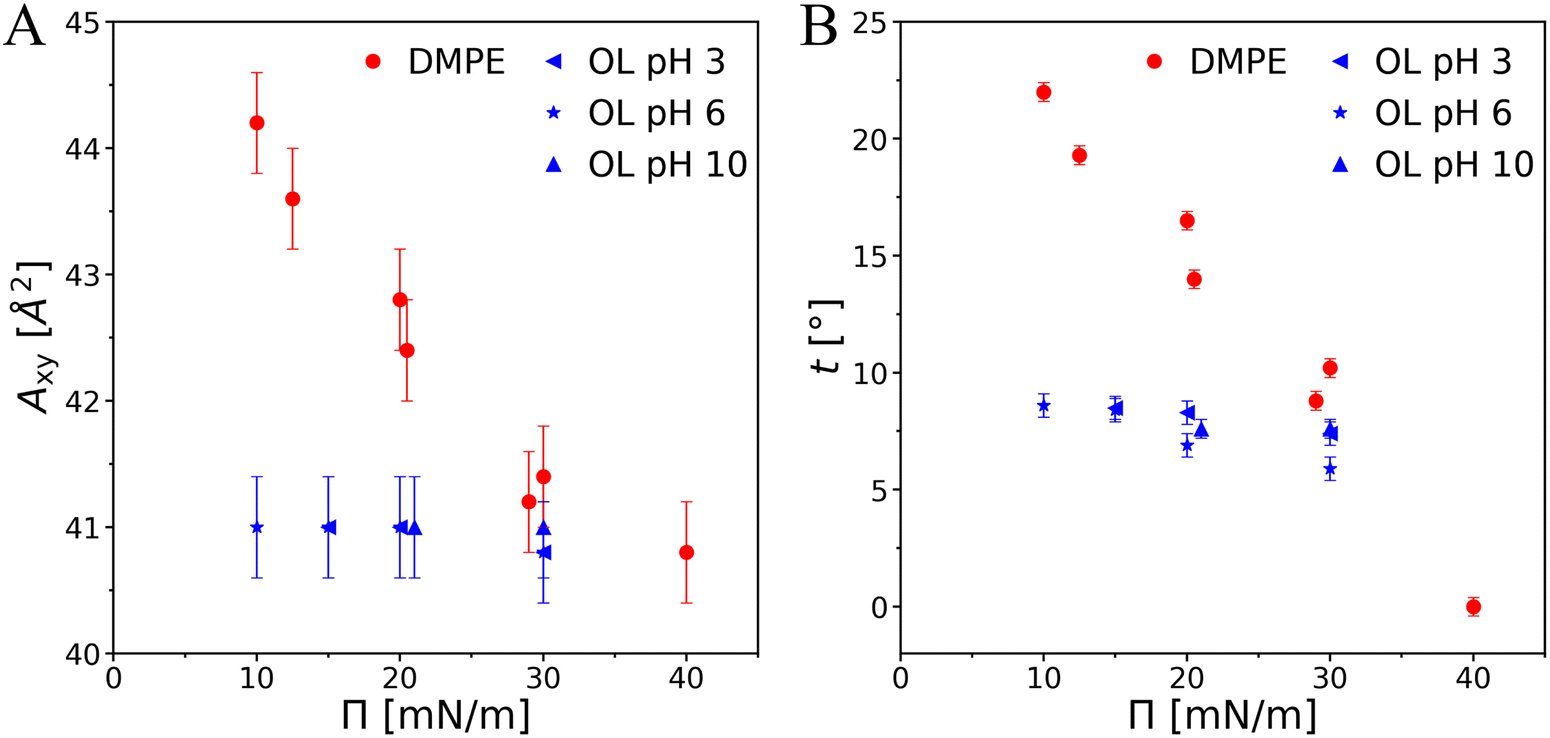 | ||
| Fig. 8 Pressure dependence of the area per molecule Axy (A) and of the tilt angle t (B) for OL and DMPE. The data for DMPE were taken from ref. 66 and 67. | ||
The obvious question is why this is the case for OL but not for chain-analogous PEL. At first, the number of hydrogen bond donors/acceptors is higher for OL, which may facilitate formation of an HBN-based superlattice. Secondly, the energetic cost of protonation of a carboxy group and of a phosphate group in general can be different, and one might therefore imagine that the uncharged protonation state of OL may be more favorable than that of PEL. However, comparatively higher pKa values of carboxy groups (between 4 and 5) were only reported for short-chain fatty acids in water, while their pKa values in amino acids are similar to that of phosphate groups (both ≈ 2)64,68 and likely more applicable to the case of OL. Finally, in the zwitterionic protonation state the dipole moments of OL and PEL are different (see Fig. 1) and OL likely has a greater conformational freedom to express a superlattice. The P−–N+ dipole of PEL is assumed to lie nearly parallel to the bilayer plane in both gel and fluid lamellar phases, and inter-lipid hydrogen bonding has been assumed.69 The NH3 group donates a proton to form a hydrogen bond with either a PO2− or a C![[double bond, length as m-dash]](https://www.rsc.org/images/entities/char_e001.gif) O of a nearest-neighbor headgroup. This arrangement might already be so favorable that there is little tendency to give up the zwitterionic state to form a HBN of uncharged headgroups instead. In fact, the inter-lipid hydrogen bonds involving zwitterionic headgroups have been hypothesized70 to contribute to the higher Tm values of PEL bilayers compared to PCL bilayers with the same hydrocarbon chains. The Tm of PEL is roughly constant over a wide pH range indicating that PEL is zwitterionic, i.e., without net charge.36 Differences are observed only at very low pH (positive net charge), where the Tm is slightly higher, and at very high pH (negative net charge), where the Tm is much lower. Such net charges lead to electrostatic repulsion but also to changes in the molecule shape entailing structural changes. OL behaves similarly and exhibits the lowest Tm at pH 2. The important difference is the formation of a HBN over a wide pH range in which PEL stays zwitterionic.
O of a nearest-neighbor headgroup. This arrangement might already be so favorable that there is little tendency to give up the zwitterionic state to form a HBN of uncharged headgroups instead. In fact, the inter-lipid hydrogen bonds involving zwitterionic headgroups have been hypothesized70 to contribute to the higher Tm values of PEL bilayers compared to PCL bilayers with the same hydrocarbon chains. The Tm of PEL is roughly constant over a wide pH range indicating that PEL is zwitterionic, i.e., without net charge.36 Differences are observed only at very low pH (positive net charge), where the Tm is slightly higher, and at very high pH (negative net charge), where the Tm is much lower. Such net charges lead to electrostatic repulsion but also to changes in the molecule shape entailing structural changes. OL behaves similarly and exhibits the lowest Tm at pH 2. The important difference is the formation of a HBN over a wide pH range in which PEL stays zwitterionic.
Cyclization of the OL headgroup
An important observation is the chemical cyclization of the headgroup when storing OL in CHCl3 solutions for extended periods of time. The reason appears to be the decomposition of chloroform into phosgene, chlorine and HCl in a photochemical reaction under the influence of light and oxygen. Phosgene, in turn, may then act as a catalyst under acidic conditions to activate the cyclization of the OL headgroup. The experimental details are described in the ESI† (Section 4). In conclusion, in order to prevent undesired cyclization, chloroform solutions of OL have to be freshly prepared for each experiment and should not be stored for longer than one hour.Conclusions
In this study, the physicochemical properties of OL and PEL were compared in order to elucidate to what extent OL is suited to replace PEL under conditions of P-starvation in a biological context. The combined use of SAXS/WAXS and DSC on OL bilayers as well as Langmuir isotherms, GIXD, and TRXF on OL monolayers revealed that tail-saturated OLs form below the melting transition temperature a molecular superlattice based on an HBN among their headgroups. This superlattice involves the uncharged protonation state of the headgroup and surprisingly persists over a wide pH range (pH 3–10). In contrast, PELs do not usually form such a superlattice and mainly exist in the zwitterionic form.In summary, OL and PEL are found to behave very differently in the investigated single-component model systems with saturated tails. However, biological membranes are multicomponent systems with mainly unsaturated lipids that form predominantly liquid-like phases and therefore rather inhibit the formation of highly ordered structures. Under such fluid conditions the differences between OL and PEL may be largely leveled out, so that replacement of PEL by OL under P-starvation may nevertheless be biologically tolerable. Future studies will have to explore the behavior of OL in binary or multicomponent lipid systems. To this end, key questions such as to what extent OL is miscible with other lipids and whether it phase-separates to form highly ordered structures, as recently reported for certain glycolipids,17 need to be addressed.
Abbreviations
| BS | Behenylsulfate |
| Bu4NI | Tetrabutylammonium iodide |
| DCC | Dicyclohexylcarbodiimide |
| DMPE | Dimyristoylphosphatidylethanolamine |
| DMAP | 4-Dimethylaminopyridine |
| DODAB | Dimethyldioctadecylammonium bromide |
| DPPC | Dipalmitoylphosphatidylcholine |
| DSC | Differential scanning calorimetry |
| EtOAc | Ethyl acetate |
| GIXD | Grazing incidence X-ray diffraction |
| HBN | Hydrogen-bonding network |
| OL | Ornithine lipid |
| PCL | Phosphatidylcholine lipid |
| PEL | Phosphatidylethanolamine lipid |
| RT | Room temperature |
| SAXS | Small-angle X-ray scattering |
| TEA | Triethylamine |
| THF | Tetrahydrofuran |
| TRXF | Total reflection X-ray fluorescence |
| WAXS | Wide-angle X-ray scattering |
Author contributions
Tetiana Mukhina: data curation, formal Analysis, investigation, resources, software, validation, visualization, writing – original draft, writing – review & editing. Georg Pabst: conceptualization, data curation, formal analysis, investigation, methodology, resources, validation, visualization, writing – review & editing. Jean-Marie Ruysschaert: conceptualization, data curation, formal analysis, investigation, methodology, resources, validation, visualization, writing – review & editing. Gerald Brezesinski: conceptualization, data curation, formal analysis, funding acquisition, investigation, methodology, project administration, resources, software, supervision, validation, visualization, writing – original draft, writing – review & editing. Emanuel Schneck: conceptualization, data curation, formal analysis, funding acquisition, investigation, methodology, project administration, resources, software, supervision, validation, visualization, writing – original draft, writing – review & editing.Conflicts of interest
There are no conflicts to declare.Acknowledgements
We acknowledge DESY (Hamburg, Germany), a member of the Helmholtz Association HGF, for the provision of experimental facilities. Parts of this research were carried out at PETRA III and we would like to thank Chen Shen for assistance in using P08. Beamtime was allocated for proposals I-20190719 and I-20190800. Financial support by the German Research Foundation (DFG) via grant SCHN 1396/2 is gratefully acknowledged. We thank Jalal Soubhye and Michel Gelbcke (Laboratoire de Chimie Pharmaceutique Organique, Université Libre de Bruxelles) for the synthesis of ornithine lipid, Irina Berndt (Max Planck Institute of Colloids and Interfaces, Potsdam, Germany) for isotherm measurements, and Alexandra Zenz (University of Graz) for performing DSC experiments.References
- M. A. Vences-Guzmán, O. Geiger and C. Sohlenkamp, Ornithine lipids and their structural modifications: From A to E and beyond, FEMS Microbiol. Lett., 2012, 335, 1–10 CrossRef.
- S.-K. Kim, S.-J. Park, X.-H. Li, Y.-S. Choi, D.-S. Im and J.-H. Lee, Bacterial ornithine lipid, a surrogate membrane lipid under phosphate-limiting conditions, plays important roles in bacterial persistence and interaction with host, Environ. Microbiol., 2018, 20, 3992–4008 CrossRef CAS PubMed.
- L. C. Barbosa, C. L. Goulart, M. M. Avellar, P. M. Bisch and W. M. von Kruger, Accumulation of ornithine lipids in Vibrio cholerae under phosphate deprivation is dependent on VC0489 (OlsF) and PhoBR system, Microbiology, 2018, 164, 395–399 CrossRef CAS PubMed.
- G. Cevc, Phospholipids handbook, CRC press, 1993 Search PubMed.
- M. D. Bazzi and G. L. Nelsestuen, Interaction of annexin VI with membranes: Highly restricted dissipation of clustered phospholipids in membranes containing phosphatidylethanolamine, Biochemistry, 1992, 31, 10406–10413 CrossRef CAS PubMed.
- J. A. Killian and B. de Kruijff, et al., Nonbilayer lipids affect peripheral and integral membrane proteins via changes in the lateral pressure profile, Biochim. Biophys. Acta, Biomembr., 2004, 1666, 275–288 CrossRef PubMed.
- A. G. Rietveld, M. C. Koorengevel and B. De Kruijff, Non-bilayer lipids are required for efficient protein transport across the plasma membrane of Escherichia coli. The, EMBO J., 1995, 14, 5506–5513 CrossRef CAS PubMed.
- P. Hakizimana, M. Masureel, B. Gbaguidi, J.-M. Ruysschaert and C. Govaerts, Interactions between phosphatidylethanolamine headgroup and LmrP, a multidrug transporter: A conserved mechanism for proton gradient sensing?, J. Biol. Chem., 2008, 283, 9369–9376 CrossRef CAS PubMed.
- I. Loke, N. Park, K. Kempf, C. Jagusch, R. Schobert and S. Laschat, Influence of steric parameters on the synthesis of tetramates from-amino–alkoxy-esters and Ph3PCCO, Tetrahedron, 2012, 68(2), 697–704 CrossRef CAS.
- O. V. Larionov and A. de Meijere, Enantioselective total syntheses of belactosin A, belactosin C, and its homoanalogue, Org. Lett., 2004, 6, 2153–2156 CrossRef CAS PubMed.
- O. R. Martin, W. Zhou, X. Wu, S. Front-Deschamps, S. Moutel, K. Schindl, P. Jeandet, C. Zbaeren and J. A. Bauer, Synthesis and immunobiological activity of an original series of acyclic lipid a mimics based on a pseudodipeptide backbone, J. Med. Chem., 2006, 49, 6000–6014 CrossRef CAS.
- G. Pabst, M. Rappolt, H. Amenitsch and P. Laggner, Structural information from multilamellar liposomes at full hydration: Full q-range fitting with high quality X-ray data, Phys. Rev. E: Stat. Phys., Plasmas, Fluids, Relat. Interdiscip. Top., 2000, 62, 4000 CrossRef CAS.
- G. Pabst, R. Koschuch, B. Pozo-Navas, M. Rappolt, K. Lohner and P. Laggner, Structural analysis of weakly ordered membrane stacks, J. Appl. Crystallogr., 2003, 36, 1378–1388 CrossRef CAS.
- J. Als-Nielsen, D. Jacquemain, K. Kjaer, F. Leveiller, M. Lahav and L. Leiserowitz, Principles and applications of grazing incidence X-ray and neutron scattering from ordered molecular monolayers at the air–water interface, Phys. Rep., 1994, 246, 251–313 CrossRef CAS.
- D. Jacquemain, S. G. Wolf, F. Leveiller, M. Deutsch, K. Kjaer, J. Als-Nielsen, M. Lahav and L. Leiserowitz, Two-dimensional crystallography of amphiphilic molecules at the air–water interface, Angew. Chem., Int. Ed. Engl., 1992, 31, 130–152 CrossRef.
- T. R. Jensen and K. Kjaer, Structural properties and interactions of thin films at the air–liquid interface explored by synchrotron X-ray scattering, Stud. Interface Sci., 2001, 11, 205–254 CAS.
- T. Mukhina, G. Brezesinski, C. Shen and E. Schneck, Phase behavior and miscibility in lipid monolayers containing glycolipids, J. Colloid Interface Sci., 2022, 615, 786–796 CrossRef CAS.
- G. Brezesinski, E. Scalas, B. Struth, H. Moehwald, F. Bringezu, U. Gehlert, G. Weidemann and D. Vollhardt, Relating lattice and domain structures of monoglyceride monolayers, J. Phys. Chem., 1995, 99, 8758–8762 CrossRef CAS.
- C. Stefaniu, V. M. Latza, O. Gutowski, P. Fontaine, G. Brezesinski and E. Schneck, Headgroup-ordered monolayers of uncharged glycolipids exhibit selective interactions with ions, J. Phys. Chem. Lett., 2019, 10, 1684–1690 CrossRef CAS PubMed.
- K. Kjaer, Some simple ideas on X-ray reflection and grazing-incidence diffraction from thin surfactant films, Phys. B, 1994, 198, 100–109 CrossRef CAS.
- V. M. Kaganer, I. R. Peterson, R. M. Kenn, M. C. Shih, M. Durbin and P. Dutta, Tilted phases of fatty acid monolayers, J. Chem. Phys., 1995, 102, 9412–9422 CrossRef CAS.
- V. M. Kaganer, H. Möhwald and P. Dutta, Structure and phase transitions in Langmuir monolayers, Rev. Mod. Phys., 1999, 71, 779–819 CrossRef CAS.
- C. Stefaniu and G. Brezesinski, Grazing incidence X-ray diffraction studies of condensed double-chain phospholipid monolayers formed at the soft air/water interface, Adv. Colloid Interface Sci., 2014, 207, 265–279 CrossRef CAS PubMed.
- C. Stefaniu, I. Vilotijevic, M. Santer, D. Varón Silva, G. Brezesinski and P. H. Seeberger, Subgel phase structure in monolayers of glycosylphosphatidylinositol glycolipids, Angew. Chem., Int. Ed., 2012, 51, 12874–12878 CrossRef CAS PubMed.
- C. Stefaniu, C. Wölk, G. Brezesinski and E. Schneck, Relationship between structure and molecular interactions in monolayers of specially designed aminolipids, Nanoscale Adv., 2019, 1, 3529–3536 RSC.
- G. Brezesinski and E. Schneck, Investigating ions at amphiphilic monolayers with X-ray fluorescence, Langmuir, 2019, 35, 8531–8542 CrossRef CAS PubMed.
- V. L. Shapovalov, M. E. Ryskin, O. V. Konovalov, A. Hermelink and G. Brezesinski, Elemental analysis within the electrical double layer using total reflection X-ray fluorescence technique, J. Phys. Chem. B, 2007, 111, 3927–3934 CrossRef CAS PubMed.
- J. Daillant, L. Bosio, J. J. Benattar and C. Blot, Interaction of cations with a fatty acid monolayer. A grazing incidence X-ray fluorescence and reflectivity study, Langmuir, 1991, 7, 611–614 CrossRef CAS.
- R. Klockenkamper, J. Knoth, A. Prange and H. Schwenke, Total-reflection X-ray fluorescence, Anal. Chem., 1992, 64, 1115A–1123A CAS.
- X-ray data booklet. 2001; https://xdb.lbl.gov/xdb.pdf.
- V. L. Shapovalov and G. Brezesinski, Breakdown of the Gouy–Chapman model for highly charged Langmuir monolayers: Counterion size effect, J. Phys. Chem. B, 2006, 110, 10032–10040 CrossRef CAS PubMed.
- C. Symietz, M. Schneider, G. Brezesinski and H. Möhwald, DNA alignment at cationic lipid monolayers at the air/water interface, Macromolecules, 2004, 37, 3865–3873 CrossRef CAS.
- J. N. Israelachvili, Intermolecular and surface forces, Academic press, 2015 Search PubMed.
- H. Heerklotz, The microcalorimetry of lipid membranes, J. Phys.: Condens. Matter, 2004, 16, R441 CrossRef CAS.
- R. Koynova and M. Caffrey, Phases and phase transitions of the phosphatidylcholines, Biochim. Biophys. Acta, Biomembr., 1998, 1376, 91–145 CrossRef CAS.
- R. Koynova and M. Caffrey, Phases and phase transitions of the hydrated phosphatidylethanolamines, Chem. Phys. Lipids, 1994, 69, 1–34 CrossRef CAS.
- A. Tardieu, V. Luzzati and F. Reman, Structure and polymorphism of the hydrocarbon chains of lipids: A study of lecithin-water phases, J. Mol. Biol., 1973, 75, 711–733 CrossRef CAS PubMed.
- M. Lúcio, F. Bringezu, S. Reis, J. L. Lima and G. Brezesinski, Binding of nonsteroidal anti-inflammatory drugs to DPPC: Structure and thermodynamic aspects, Langmuir, 2008, 24, 4132–4139 CrossRef.
- D. Marsh, Lateral pressure in membranes, Biochim. Biophys. Acta, Biomembr., 1996, 1286, 183–223 CrossRef CAS.
- P. Nuhn, G. Brezesinski, B. Dobner, G. Förster, M. Gutheil and H.-D. Dörfler, Synthesis, calorimetry, and X-ray diffraction of lecithins containing branched fatty acid chains, Chem. Phys. Lipids, 1986, 39, 221–236 CrossRef CAS.
- V. Raghunathan and J. Katsaras, Structure of the L c phase in a hydrated lipid multilamellar system, Phys. Rev. Lett., 1995, 74, 4456 CrossRef CAS PubMed.
- V. Raghunathan and J. Katsaras, L β→ L c phase transition in phosphatidylcholine lipid bilayers: A disorder-order transition in two dimensions, Phys. Rev. E: Stat. Phys., Plasmas, Fluids, Relat. Interdiscip. Top., 1996, 54, 4446 CrossRef CAS.
- B. Pozo-Navas, V. Raghunathan, J. Katsaras, M. Rappolt, K. Lohner and G. Pabst, Discontinuous unbinding of lipid multibilayers, Phys. Rev. Lett., 2003, 91, 028101 CrossRef CAS.
- B.-S. Lu, S. P. Gupta, M. Belicka, R. Podgornik and G. Pabst, Modulation of elasticity and interactions in charged lipid multibilayers: Monovalent salt solutions, Langmuir, 2016, 32, 13546–13555 CrossRef CAS PubMed.
- V. M. Latza, B. Demé and E. Schneck, Membrane adhesion via glycolipids occurs for abundant saccharide chemistries, Biophys. J., 2020, 118, 1602–1611 CrossRef CAS.
- E. Leontidis, A. Aroti, L. Belloni, M. Dubois and T. Zemb, Effects of monovalent anions of the Hofmeister series on DPPC lipid bilayers Part II: Modeling the perpendicular and lateral equation-of-state, Biophys. J., 2007, 93, 1591–1607 CrossRef CAS PubMed.
- A. Schlaich, B. Kowalik, M. Kanduč, E. Schneck and R. R. Netz, Physical mechanisms of the interaction between lipid membranes in the aqueous environment, Phys. A, 2015, 418, 105–125 CrossRef CAS.
- M. Kanduč, A. Schlaich, A. H. de Vries, J. Jouhet, E. Maréchal, B. Demé, R. R. Netz and E. Schneck, Tight cohesion between glycolipid membranes results from balanced water–headgroup interactions, Nat. Commun., 2017, 8, 1–9 CrossRef PubMed.
- G. Brezesinski, A. D. J. Calow, C. L. Pereira and P. H. Seeberger, Thermodynamic and structural behavior of α-galactosylceramide and C6-functionalized α-GalCer in 2D layers at the air–liquid interface, ChemBioChem, 2020, 21, 241–247 CrossRef CAS PubMed.
- J. Katsaras, V. A. Raghunathan, E. J. Dufourc and J. Dufourcq, Evidence for a two-dimensional molecular lattice in subgel phase DPPC bilayers, Biochemistry, 1995, 34, 4684–4688 CrossRef CAS PubMed.
- D. Marsh, Lateral order in gel, subgel and crystalline phases of lipid membranes: Wideangle X-ray scattering, Chem. Phys. Lipids, 2012, 165, 59–76 CrossRef CAS PubMed.
- N. Albon, Transitions and molecular packing in highly purified 1,2-dipalmitoylphosphatidyl choline–water phases. II. The structures of DPPC phases with low water content, J. Chem. Phys., 1983, 79, 469–476 CrossRef CAS.
- E. B. Sirota, Remarks concerning the relation between rotator phases of bulk n-alkanes and those of Langmuir monolayers of alkyl-chain surfactants on water, Langmuir, 1997, 13, 3849–3859 CrossRef CAS.
- R. Kenn, K. Kjaer and H. Möohwald, Non-rotator phases in phospholipid monolayers?, Colloids Surf., A, 1996, 117, 171–181 CrossRef CAS.
- C. Alonso and J. A. Zasadzinski, A brief review of the relationships between monolayer viscosity, phase behavior, surface pressure, and temperature using a simple monolayer viscometer, J. Phys. Chem. B, 2006, 110, 22185–22191 CrossRef CAS PubMed.
- B. D. Casson, R. Braun and C. D. Bain, Phase transitions in monolayers of medium-chain alcohols on water studied by sum-frequency spectroscopy and ellipsometry, Faraday Discuss., 1996, 104, 209 RSC.
- F. Leveiller, D. Jacquemain, M. Lahav, L. Leiserowitz, M. Deutsch, K. Kjaer and J. Als-Nielsen, Crystallinity of the double layer of cadmium arachidate films at the water surface, Science, 1991, 252, 1532–1536 CrossRef CAS PubMed.
- F. Leveiller, C. Boehm, D. Jacquemain, H. Moehwald, L. Leiserowitz, K. Kjaer and J. Als-Nielsen, Two-dimensional crystal structure of cadmium arachidate studied by synchrotron X-ray diffraction and reflectivity, Langmuir, 1994, 10, 819–829 CrossRef CAS.
- I. Kuzmenko, H. Rapaport, K. Kjaer, J. Als-Nielsen, I. Weissbuch, M. Lahav and L. Leiserowitz, Design and characterization of crystalline thin film architectures at the air–liquid interface: Simplicity to complexity, Chem. Rev., 2001, 101, 1659–1696 CrossRef CAS PubMed.
- W. Bu and D. Vaknin, X-ray fluorescence spectroscopy from ions at charged vapor/water interfaces, J. Appl. Phys., 2009, 105, 084911 CrossRef.
- M. Sturm, O. Gutowski and G. Brezesinski, The influence of calcium traces in ultrapure water on the lateral organization in tetramyristoyl cardiolipin monolayers, ChemPhysChem, 2019, 20, 1521–1526 CAS.
- O. Szekely, A. Steiner, P. Szekely, E. Amit, R. Asor, C. Tamburu and U. Raviv, The structure of ions and zwitterionic lipids regulates the charge of dipolar membranes, Langmuir, 2011, 27, 7419–7438 CrossRef CAS.
- C. Wölk, G. Hause, O. Gutowski, R. D. Harvey and G. Brezesinski, Enhanced chain packing achieved via putative headgroup ion-triplet formation in binary anionic lipid/cationic surfactant mixed monolayers, Chem. Phys. Lipids, 2019, 225, 104827 CrossRef.
- D. R. Lide, CRC handbook of chemistry and physics, CRC press, 2004, vol. 85 Search PubMed.
- A. Shahi and E. Arunan, Why are hydrogen bonds directional?, J. Chem. Sci., 2016, 128, 1571–1577 CrossRef CAS.
- E. Maltseva and G. Brezesinski, Adsorption of amyloid beta (1–40) peptide to phosphatidylethanolamine monolayers, ChemPhysChem, 2004, 5, 1185–1190 CrossRef CAS.
- S. Gromelski and G. Brezesinski, Adsorption of DNA to zwitterionic DMPE monolayers mediated by magnesium ions, Phys. Chem. Chem. Phys., 2004, 6, 5551–5556 RSC.
- D. Marsh, CRC handbook of lipid bilayers, CRC press, 1990 Search PubMed.
- D. A. Pink, S. McNeil, B. Quinn and M. J. Zuckermann, A model of hydrogen bond formation in phosphatidylethanolamine bilayers, Biochim. Biophys. Acta, Biomembr., 1998, 1368, 289–305 CrossRef CAS.
- J. M. Boggs, Lipid intermolecular hydrogen bonding: Influence on structural organization and membrane function, Biochim. Biophys. Acta, Biomembr., 1987, 906, 353–404 CrossRef CAS.
Footnote |
| † Electronic supplementary information (ESI) available. See DOI: https://doi.org/10.1039/d2cp01045c |
| This journal is © the Owner Societies 2022 |