
 Open Access Article
 This Open Access Article is licensed under a Creative Commons Attribution-Non Commercial 3.0 Unported Licence
Structural, dynamical, and electronic properties of the ionic liquid 1-ethyl-3-methylimidazolium bis(trifluoromethylsulfonyl)imide†
Kana
Ishisone
 ,
Guido
Ori
and
Mauro
Boero
*
,
Guido
Ori
and
Mauro
Boero
*
University of Strasbourg, Institut de Physique et Chimie des Matériaux de Strasbourg, CNRS, UMR 7504, 23 rue du Loess, F-67034, France. E-mail: mauro.boero@ipcms.unistra.fr
First published on 21st March 2022
Abstract
We provide a microscopic insight, both structural and electronic, into the multifold interactions occurring in the ionic liquid 1-ethyl-3-methylimidazolium bis(trifluoromethylsulfonyl)imide [EMIM][TFSI] currently targeted for applications in next-generation low-power electronics and optoelectronic devices. To date, practical applications have remained hampered by the lack of fundamental understanding of the interactions occurring both inside the IL and at the interface with the substrate. Our first principles dynamical simulations provide accurate insights into the nature of bonding and non-bonding interactions, dynamical conformational changes and induced dipole moments, along with their statistical distributions, of this ionic liquid, that have so far not been completely unraveled. The mobilities of the two ionic species are obtained by long-lasting dynamical simulations at finite temperature, allowing simultaneous monitoring and quantification of the isomerization occurring in the IL. Moreover, a thorough analysis of the electronic structure and partial charge distributions characterizing the two components, the cation and anion, allow rationalization of the nature of the electrostatic interactions, hydrogen bonding properties of the two ionic counterparts, and the infra-red and dielectric response of the system, especially in the low frequency range, for the full characterization of the IL.
Introduction
The forefront field of device electronics, 2D semiconducting (nano)materials such as graphene, h-BN, MoS2, WSe2, and black phosphorus (BP) are becoming a playground for applications in forthcoming electronic and optoelectronic devices. In this type of system, a crucial factor is the possibility of achieving a high interfacial charge density (HICD) crucial for triggering unprecedented and interesting phenomena such as superconductivity1,2 and quantum interference (QI) effects.3 Furthermore, HICD has been indicated as a key factor to improve the performance of emerging memory device technologies for neuromorphic computing.4,5 In this general scenario, ionic liquids (ILs) are becoming a major component for pioneering novel 2D material-based field-effect transistors, which could greatly benefit from a gating capable of inducing an HICD, as the latter would allow the operating voltages to be reduced,1–6 with clear advantages in terms of energy consumption and sustainability. From a general point of view, ILs are compounds made of a liquid salt containing mobile organic cations and inorganic anions, and their use as effective gating media has already been pioneered and fully acknowledged.5–9 At an applied voltage, the ionic moieties that form the IL undergo separation, and one of the two ionic species, either cations or anions, depending on the local electric field, accumulates on the 2D material surface, forming an electric double layer (EDL). In turn, the charge density that can be induced at the hybrid interface becomes orders of magnitude larger than that of a conventional silicon back gate. Despite intensive experimental efforts, accompanied on a few occasions by atomistic simulations either at a static quantum chemical level to complement experiments10,11 or by classical molecular dynamics with ad hoc force fields,12–16 key questions remain unanswered about the specific interactions occurring between the IL and the 2D material. An additional difficulty is the fact that the integration of ILs in real applications is hampered by the lack of fundamental understanding of the interactions occurring at a molecular and atomic level. This is even more crucial in the case of ILs that exist in the liquid phase at room temperature, hence presenting all the operational problems linked to fluidity-related instability. Moreover, ILs also offer an additional advantage as “green” and recyclable solvents for chemical synthesis and can be used to develop hybrid organic–inorganic materials in which they are confined inside the porous network of an inorganic framework.17–19 As such, in view of concerns about sustainability, ILs are prone to have a moderate environmental impact in terms of their toxicity and biodegradability.20,21By using first-principles molecular dynamics (FPMD), empowered by free energy sampling techniques, when necessary, we provide a microscopic insight into the IL system, 1-ethyl-3-methylimidazolium bis(trifluoromethylsulfonyl)imide ([EMIM][TFSI]), currently targeted for forefront applications.22–25 To date, a limited number of studies26,27 have been published exploiting FPMD to tackle this class of systems and all are limited to short dynamical simulations or static electronic structure calculations. This is not so surprising because of the high computational workload needed to model a realistic IL by FPMD under the thermodynamic conditions of typical experiments. Conversely, long lasting classical molecular dynamics (CMD) studies have been reported, but unfortunately model potentials do not allow these to go much beyond structural information.
Here we intend to fill the gap between CMD and FPMD by using large size and long time scales within FPMD. Indeed, for an IL such as [EMIM][TFSI], taking into account explicitly the electronic structure is crucial to extract the fundamental chemical bonding features and to obtain macroscopically observable quantities such as the infra-red spectrum. Yet, to this aim, a sufficiently extended time scale is needed to capture dynamical features such as the conformational changes and the consequent evolution of the hydrogen bonding structure. Analogously, an accurate simulation of the infra-red and dielectric response at low frequencies calls for long simulation times, with the maximum frequency being sampled equal to 1/(maximum simulation time). On top of that, a careful analysis of the bonding and dipole moment of [EMIM][TFSI] is presented for the full characterization of the chemical nature of the liquid. For these reasons, we resort to a long-lasting FPMD of more than 100 ps. This provides a clear picture of the structural and dynamical properties, full characterization of the conformational changes occurring in the flexible cations and anions and a thorough analysis of the electronic structure, partial charges and time evolving dipole moment, sensitive to the evolution of the hydrogen bond (H-bond) network. This, in turn, allows the nature of the electrostatic interactions to be rationalized. The change in the induced dipole moment with respect to the routinely considered dimers in a vacuum, the nature of the chemical bonds in terms of Wannier function analyses and the infra-red and dielectric response of the material allow us to extract macroscopic observables for direct comparison with available experiments. The relatively long FPMD time scale allows the low-frequency part of the IR spectrum to be improved, at the same time allowing the properties of this IL to be unraveled, features which have so far not been investigated at this level of accuracy. Our study provides a convincing picture of the relative distances of the moieties that make up the IL and their evolution as a result of the electrostatic and H-bond interactions regulating the behaviour of the liquid. The 130 ps time scale of our simulations allows a thorough analysis of the electronic structure and partial charge distributions of the two components, cations and anion, and provides insight into the nature of the electrostatic interactions and H-bond properties not accessible to experiments, yet important for boosting this innovative line of research and unraveling all the fundamental microscopic features escaping experimental probes.
Computational methods
Our computational approach makes use of the FPMD within the density functional theory28 (DFT) framework and according to the Car–Parrinello29 method as implemented in the developer's version of the CPMD30 code. The valence–core interaction was described using the norm-conserving numerical pseudopotential of the Martins–Troullier type,31,32 and the exchange and correlation functional of Becke33 and Lee–Yang–Parr34 (BLYP) was complemented by a first-principles evaluation of the van der Waals dispersion forces based on the Wannier function centers35 (WFCs) boosted by a propagation scheme36 to reduce the computational burden. Valence electrons are treated explicitly and their wavefunctions are expanded on a plane-wave (PW) basis set with a cut-off of 100 Ry. This value was accurately tuned based on the convergence of the stress tensor (pressure) as a function of the number of PWs in the preparation phase before starting the production run. Canonical NVT simulations were carried out by controlling the temperature via a Nosé–Hoover37–39 thermostat, and for the numerical integration of the Car–Parrinello equations of motion, a fictitious electron mass of 400.0 au and a time step of 3.0 au (0.0726 fs) ensured good numerical control of the constants of motion.Our [EMIM][TFSI] simulated system started from a liquid in a periodically repeated cubic supercell of lateral size equal to L = 20.8597 Å, amounting to 680 atoms and 1360 electrons. This system size includes twenty formula units of [EMIM][TFSI] (see Fig. 1), amounting to 20 [EMIM] cations and 20 [TFSI] anions.
 | ||
| Fig. 1 Simulated [EMIM][TFSI] system (left) and details of the ionic pair constituting the ionic liquid (right). In the left panel each cation is highlighted in orange and each anion in purple to simplify the readability of the figure. The atomic structure of a typical [EMIM][TFSI] dimer is shown in the right panel and the atom colour code adopted here and in the following is white for H, grey for C, blue for N, red for O, yellow for S and cyan for F. The atomic labelling and colours will be the same in the subsequent figures. | ||
The initial construction of the simulation cell started from an experimental density of 1.5183 g cm−3, as reported in the literature.40,41 On these grounds, before moving to FPMD, a classical MD simulation was used to prepare the initial configuration employing the classical force field developed by Canongia Lopes and co-workers,42 with its updated parameterization by Köddermann et al.43
An analysis of the internal pressure during NVT dynamics at different cell sizes allowed optimization of the reported value, which is in excellent agreement (1.5140 g cm−3) with the experimental density and leaves the simulated system with a residual pressure oscillating around −0.4 GPa (see Fig. S1 in the ESI†), compatible with the accuracy allowed by DFT simulations.44,45 Additional computational details will be given in the next paragraphs whenever needed to support the discussion.
Results and discussion
Structural properties
The complexity of this IL system makes FPMD simulations computationally demanding. The large steric volume occupied by each ion and the non-trivial molecular structure require long simulation times to reach thermal equilibrium (see Fig. S1 in the ESI† for additional details). For this reason, we performed a ∼130 ps long NVT dynamics simulation at a target temperature of 300 K, being the typical room temperature at which many experiments are performed,3–9 except for the case of superconductivity, and at which devices based on ILs are expected to operate. We recall that the melting point of [EMIM][TFSI] is 256 K,46 which means that the system is in the liquid phase at room temperature. Starting from an overall analysis of the IL as a whole, all along the trajectory generated by our long-lasting dynamics, we monitored the pair correlation functions (PCFs) of the IL using the standard formula: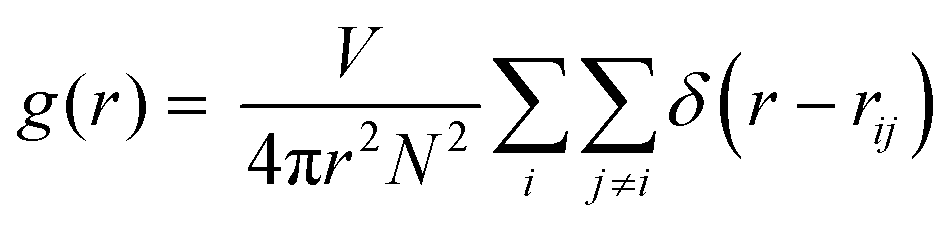 | (1) |
 | ||
| Fig. 2 Pair correlation functions for the [EMIM][TFSI] system. The brown line indicates the cation–anion radial distribution function, the orange line the cation–cation one and the purple line the anion–anion g(r). | ||
Namely, the two ionic moieties keep a minimal distance of about 3.9 Å all along the dynamics with a major distribution in the range of 4.9–6.7 Å, where the first shoulder and the most pronounced peak of the corresponding PCF are located (Fig. 2). This is mainly due to electrostatic interactions between the cations and anions and to the presence of hydrogen bonds (H-bonds). This point will be discussed in detail in the paragraph dedicated to the electronic properties. A closer inspection of the curious double peak at ∼5.2 Å and ∼6.1 Å present in the PCF of [EMIM][TFSI] has shown that this feature is due to two different conformers contributing separately to this distribution (see Fig. S3 in the ESI†). The details of these conformers will be provided in the ongoing discussion. The other two PCFs, corresponding to the average cation–cation and anion–anion distribution, present broad peaks between 7 and 9 Å, as expected in view of the alternation between the cations and anions that form the IL. Since the overall electrostatic and H-bond interactions prevent direct contact between [EMIM]–[EMIM] and [TFSI]–[TFSI], these distributions are peaked at larger distances than the [EMIM][TFSI] PCF and basically are a fingerprint of the dominating cation–anion electrostatics. The broadening is mainly due to the flexibility of the molecular component and, in the case of the [EMIM] cations, the abundance of hydrophobic components, such as CH3 groups, not prone to create H-bonds, makes the whole PCF distribution broad and nearly structureless. An accurate analysis of the H-bonds is presented below. A more structured peaked shape is instead present in the anion–anion distribution, since the [TFSI] exposes O and F47 atoms that carry electron-rich lone pairs and tend to form relatively strong H-bonds. We anticipate that these details will be clearer in the analysis of partial charges and the electronic structure given in paragraph 3.3. The results summarized in Fig. 2 are consistent with those reported in ref. 12 obtained within a classical molecular dynamics framework.
From a more detailed atomistic standpoint, the PCFs of the single H atoms of the [EMIM] cation from the [TFSI] anion can provide additional information about the H-bond features of the IL. This result is sketched in Fig. 3, whereas other relevant interatomic distance distributions are shown in Fig. S4 of the ESI.† As can be seen from the PCF of Fig. 3, rather strong H-bonds ranging from 1.6 to 3 Å (first peak of the PCF) are formed between the two ionic species and these contribute to the structure of the liquid which, indeed, is not kept together exclusively by simple Coulomb interactions between more or less distant point-like charges.
 | ||
| Fig. 3 Trans and cis configurations spontaneously assumed by the [TFSI] moiety in the ionic liquid (left) and the pair correlation functions of the H atoms of the cation and O atoms of the anion involved in the formation of H-bonds (right). H-bonds are indicated as dashed lines and the atom color code is identical to the one adopted in Fig. 1. | ||
An interesting feature is the fact that the anion [TFSI] can assume spontaneously either a cis or a trans orientation as sketched in Fig. 3. By monitoring this feature in terms of the dihedral angle C–S–S–C of the [TFSI] moiety all along the dynamics, we extracted the distribution presented in Fig. 4. The torsion angle C–S–S–C discriminating between the cis and the trans configurations spans a range from 0° to 180°, a clear indicator of the high flexibility of the system, with a pronounced peak at 180° (trans) and a lower peak at about 40° (cis), indicating that the trans configuration is the major isomer present in the liquid all along the dynamics. The computed ratio of cis and trans conformers (regions marked in Fig. 4) is 5![[thin space (1/6-em)]](https://www.rsc.org/images/entities/char_2009.gif) :9.
:9.
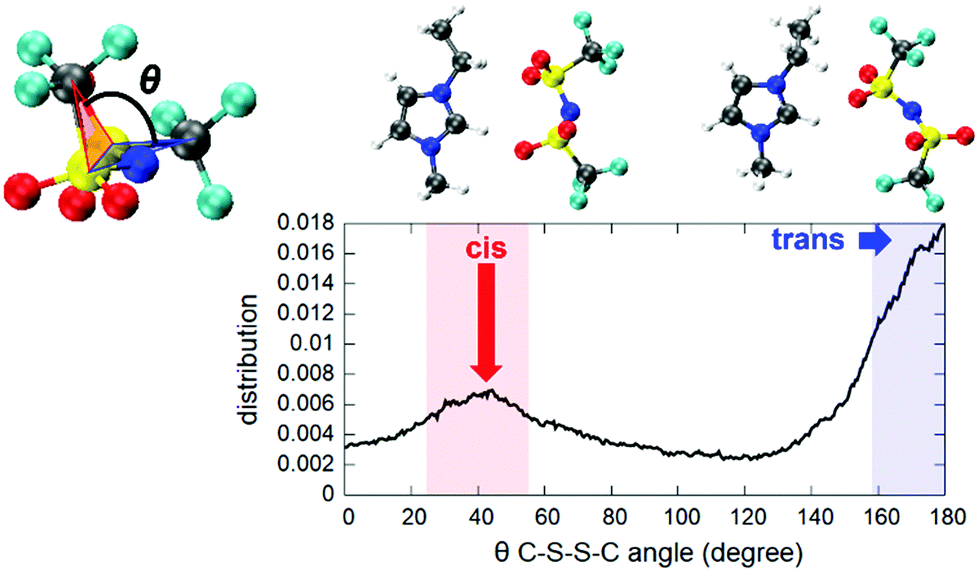 | ||
| Fig. 4 Distribution of the dihedral angle C–S–S–C of the [TFSI] anion, characterizing the cis–trans-isomerization during the dynamics. The colored ranges are the regions above the half height of each peak and are used to compute the cis and trans conformer ratio. | ||
This seems to be due to the fact that a trans configuration has more degrees of freedom to form H-bonds with the nearby [EMIM] cations surrounding the anion in the liquid state, without being constrained to be bound to the [EMIM] molecules shown both in Fig. 3 and 4 and representing the only two possibilities in a vacuum.11 Indeed, a full optimization of isolated [EMIM] cis-[TFSI] and [EMIM] trans-[TFSI] performed within our computational scheme in a vacuum has given a total energy difference between the two configurations of ΔE = 2.68 kcal mol−1 with the trans isomer energetically located above the cis one. Yet, this is due to the reduced number of H-bonds that such an isolated system can realize as a stand-alone molecular pair but does not reflect the actual situation in an extended liquid, where a wealth of possibilities in forming H-bonds (sketched in Fig. 3 as dashed lines pointing outside the shown pair) exist, thus conferring a higher stability to the trans conformer, as reflected in the distribution in Fig. 4.
This result can be ascribed to both the wide variety of H-bonding formation and to the minimization of the steric repulsion between the symmetric sulphonyl and trifluoromethyl groups promoted by the cis conformation.48 For an IL like the one targeted in this study, 1-ethyl-3-methylimidazolium bis(trifluoromethanesulfonyl)imide, ∼75% content of the trans conformer was determined in the bulk IL using Raman spectroscopy and ab initio calculations.49 Note that in a confined environment more efficient packing of the TFSI anions is promoted by the cis conformation as found in an IL confined in silica and semiconducting chalcogenide pores.19,48,50 The distribution of the number of [EMIM] molecules having H–O H-bonds with either a cis or a trans [TFSI] in the liquid are shown in Fig. S5 of the ESI.† The trans conformer has a slightly larger number of surrounding [EMIM] molecules with respect to the cis conformer, consistent with our discussion above. Contrary to the anion, which has a very flexible (switchable) structure, the cation presents a moderate molecular flexibility, characterized by a broad distribution of the torsion angle of the C–N bond connecting the ethyl group and the imidazolium ring (θ2 angle), with a small peak at around 100° (out-of-plane conformer) (Fig. S6 in the ESI†). Conversely, the rigid structure of the ethyl group (Ceth2–Ceth1–N2 angle) is underscored by the sharp distribution of the θ1 angle peaking at ∼110° in the same figure.
Dynamical properties
By exploiting the 130 ps long dynamics, we focused on the mobility of the two ionic species in the IL. As done for the overall pair correlation functions in Fig. 2, the centres of mass Ri(t) of both the [EMIM] cation and the [TFSI] anion were monitored, and the result is shown in Fig. 5. We observe that the Fickian regime, namely the one in which the mean square displacement (MSD) scales linearly with time t is not fully reached even in the last time window of the 130 ps simulation. This makes reliable estimation of the self-diffusivity of the cations and anions difficult. Yet, at least an indication of the diffusivities can be attempted for both the ionic 3D mobilities (D*) according to the typical Einstein formula considering the slope of the MSD plot to have reached the beginning of the diffusion regime toward the end of the simulation: | (2) |
 | ||
| Fig. 5 (a) Sketch of the trajectories of the center of mass of [EMIM] cations (orange) and [TFSI] anions (purple) during the simulation. (b) Mean square displacement (MSD) of the [EMIM] cations (orange line) and the [TFSI] anions (purple line) during the dynamics at 300 K. After the equilibration stage, represented by the initial slope, a mobility regime is reached and used to compute the ionic mobilities. Details are given in the text. | ||
The estimated mobility coefficients are found to be close to the available experimental measurements51,52 carried out using a spin-echo technique. Specifically, we obtained mobility coefficients equal to 0.0070 Å2 ps−1 for the [EMIM] cation and 0.0061 Å2 ps−1 for the [TFSI] anion, to be compared with values of 0.007 and 0.004 Å2 ps−1 for the cation and the anion, respectively, measured51,52 at room temperature. This is also an indication of the time scale required to obtain a realistic FPMD simulation of this class of systems able to reproduce with acceptable accuracy slowly varying dynamical quantities. By looking into the details of the atomic structure of both the cation and the anion, we remark that, as shown in Fig. 4, a predominance of trans conformers of [TFSI] has been detected. Now, by analysing the dynamics of the single molecules along the trajectory, we can see that the same molecule does not retain its configuration (either trans or cis) all along the motion of the IL but sometimes undergoes spontaneous switching between the two isomers. A typical example representative of this trend is shown in Fig. 6, where the isomers are discriminated based on the C–S–S–C torsion angle, as specified in paragraph 3.1, and indicate that there is only a small barrier separating the two isomers. Indeed, the system is able to overcome it with simple dynamical fluctuations during the 300 K NVT dynamics. In Fig. 6, C–S–S–C angles around 180° indicate a trans configuration, whereas values in the range of 25–55° are referred to the cis isomer. The trajectories of the C–S–S–C torsion angles of other [TFSI] molecules are also shown in Fig. S7 of the ESI,† where an analogous analysis for the [EMIM] cation is reported for completeness in Fig. S8 in the ESI.† The results show that the ethyl group rotates around the bond with the imidazolium ring constantly, indicating the presence of a negligible energy barrier to this conformer change.
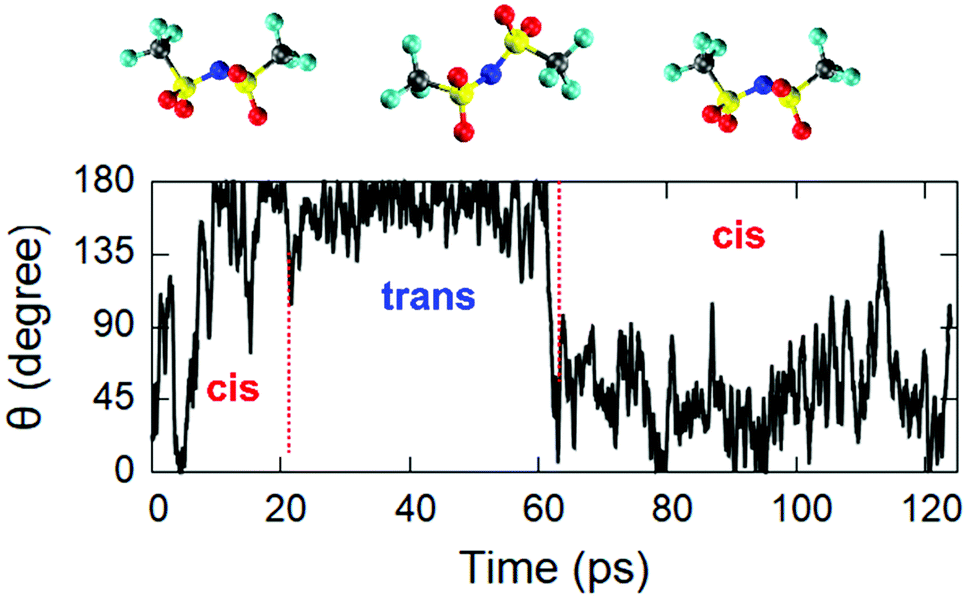 | ||
| Fig. 6 Evolution of the configuration of a typical [TFSI] molecule during the dynamics. The range of values around 180° of the C–S–S–C torsion angle indicates a trans conformer, whereas values in the range of 25–55° indicate a cis configuration. | ||
As a general observation, we can infer that it might take even longer times than the one afforded here to observe a statistically meaningful number of conformational switches (here limited to two) to reproduce the actual experimental conditions. Nonetheless, these processes are correctly captured in our simulations. To better quantify the free energy barrier for the switch between the cis and trans configurations of [TFSI], we resorted to blue moon ensemble (BME) simulations.53 By using the torsion angle C–S–N–S as a reaction coordinate, which is able to discriminate between the two conformers, we performed auxiliary BME simulations with this reaction coordinate, starting from the NVT well equilibrated system. The results are summarized in Fig. 7.
 | ||
| Fig. 7 The left panel show the free energy profile along the S–N–S–C torsion angle (reaction coordinate) as obtained from the BME simulations. The right panel shows the distribution of the torsion angle S–N–S–C as obtained from the analysis of the unconstrained FPMD. The results of the BME simulation, in terms of exp(−ΔF/kBT), are shown for comparison. | ||
In the free energy profile of Fig. 7, each point, evidenced by black circles along the line, represents a sampled value of the C–S–N–S torsion angle (reaction coordinate), for which the BME simulation lasted for about 2 ps, necessary to obtain well averaged constraint forces for the thermodynamical integration. The range of sampled values, from 109° to 180°, spans all the torsion angles going from a trans to a cis conformer of the [TFSI] moiety.
As evidenced by this BME analysis, a free energy barrier of about 3.1 kcal mol−1 separates the trans from the cis configuration, sufficiently small to be overcome during our regular (unconstrained) NVT dynamics by simple statistical fluctuations. In fact, by computing from the free energy profile ΔF the corresponding probability as exp(−ΔF/kBT), kB being the Boltzmann constant and T the simulation temperature, we get a curve that can be superposed on the statistical distribution almost exactly.
Electronic properties
The electronic structure of the system being available simultaneously with the atomic configuration in a FPMD approach, we computed the Kohn–Sham eigenstates of the average configuration of the liquid at 300 K. More precisely, using the Hamiltonian diagonalization procedure, to the occupied states, regularly updated in the FPMD approach, we added the lowest twelve unoccupied states. The result is sketched in Fig. 8. Within the computational approach used here and taking into consideration the systematic underestimation affecting DFT based calculations, an energy gap of 3.64 eV separates the top of the valence band from the bottom of the empty states.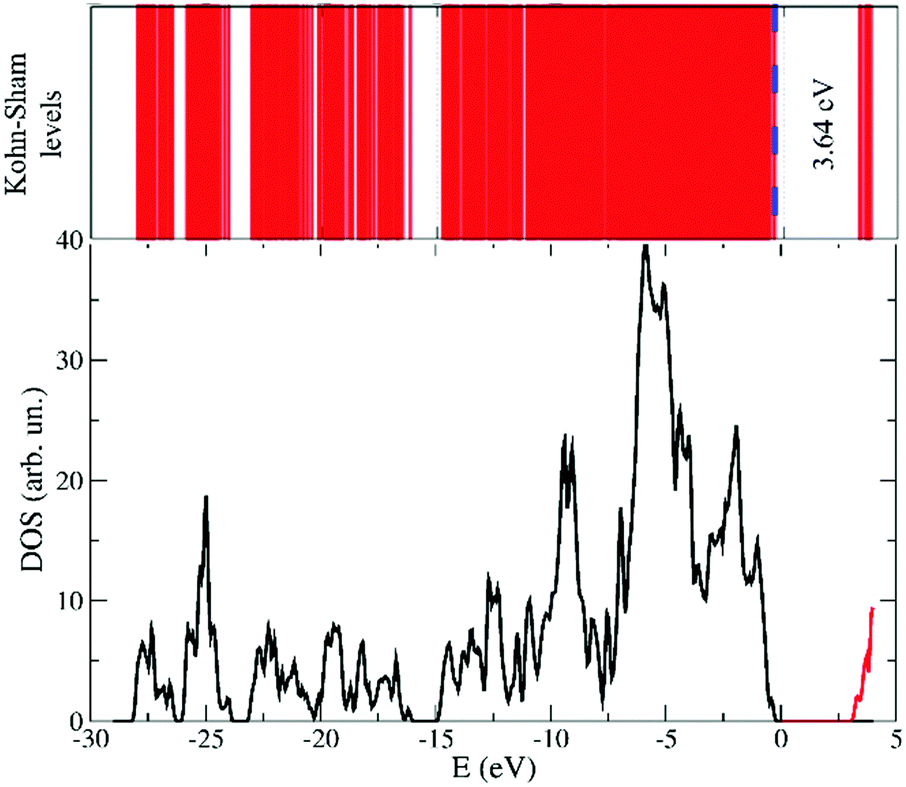 | ||
| Fig. 8 Band diagram and related electronic density of states (DOS) for the simulated [EMIM][TFSI] ionic liquid. In the DOS (lower panel) the black line indicates the occupied states, whereas the red line indicates the empty states. An energy gap of 3.64 eV separates the two sets of Kohn–Sham eigenstates. | ||
This gap does not undergo any noticeable shrinking all along the dynamics, thus retaining a wide energetic separation between the highest occupied orbitals (HOMOs) in the proximity of the valence band upper edge and the lowest unoccupied orbitals (LUMOs). On the other hand, the nature of the HOMOs and LUMOs differs significantly as shown in Fig. 9. Specifically, the HOMO wavefunctions resemble a bonding state of the [TFSI] anion between the N and S atoms, with a pronounced amplitude located along the bond directions joining the central N and the two S atoms. Large contributions from the nearby O 2p states are also present (see Fig. 9) as lobes localized on top of the oxygen atoms. Conversely, the LUMO states are localized on the [EMIM] cation and resemble mostly C–N antibonding states with wavefunctions carrying a node in the centre of each C–N bond of the central pentagonal ring.
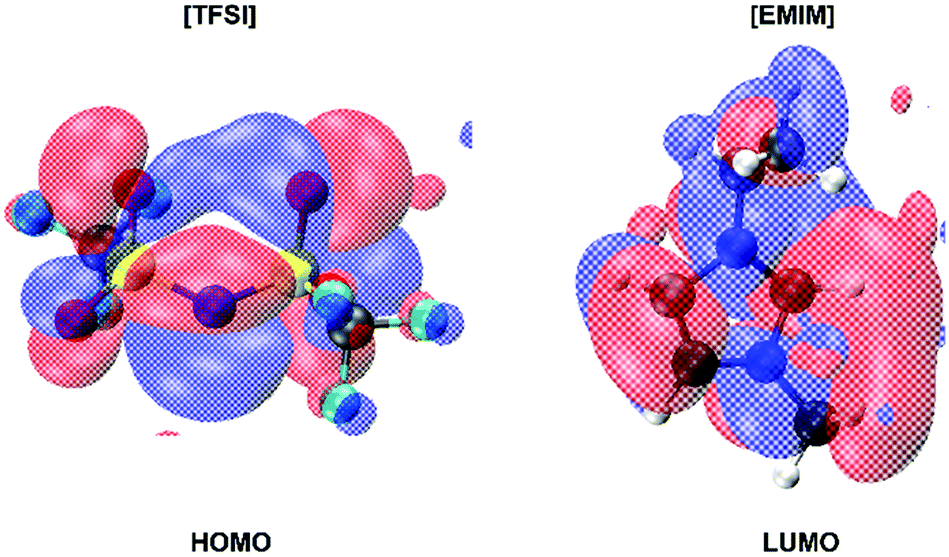 | ||
| Fig. 9 Typical highest occupied orbital (HOMO) and lowest unoccupied one (LUMO) in the ionic liquid. The top of the valence band is composed mostly of bonding states located on the N and S atoms of the anion [TFSI] with large contributions from the O 2p states visible as pronounced lobes in the left panel of the figure. Instead, the LUMO states resemble mostly C–N antibonding states of the [EMIM] cation with wavefunctions presenting a node in the center of this chemical bond. Blue (negative amplitude) and red (positive amplitude) isosurfaces are shown at a value of 10−4 Å−3/2. | ||
To quantify the partial charges of each atom, we exploited the electronic density, available on the fly all along the dynamics, and computed for several uncorrelated configurations the value of the Bader charges54,55 of each atom that is present in the cation and the anion of the IL. The result of this analysis is reported in Fig. 10. The main features can be summarized as: (i) the Bader charges of each atom do not undergo any significant fluctuation all along the dynamics, (ii) the Bader charges of the [TFSI] anion are unaffected by the configuration of the molecule in the sense that both the cis and the trans conformers are characterized by the same values within the numerical accuracy allowed by this type of computational approach. For the sake of completeness, the Bader charges of the cis and trans [TFSI] anion in the gas phase are reported in Fig. S9 of the ESI.† And (iii) the total Bader charge of [EMIM] is equal to +1.08e and that of [TFSI] is −0.81e, confirming the cationic and anionic nature of the two moieties as a whole and the detailed distribution of the partial charges contributing to these overall values.
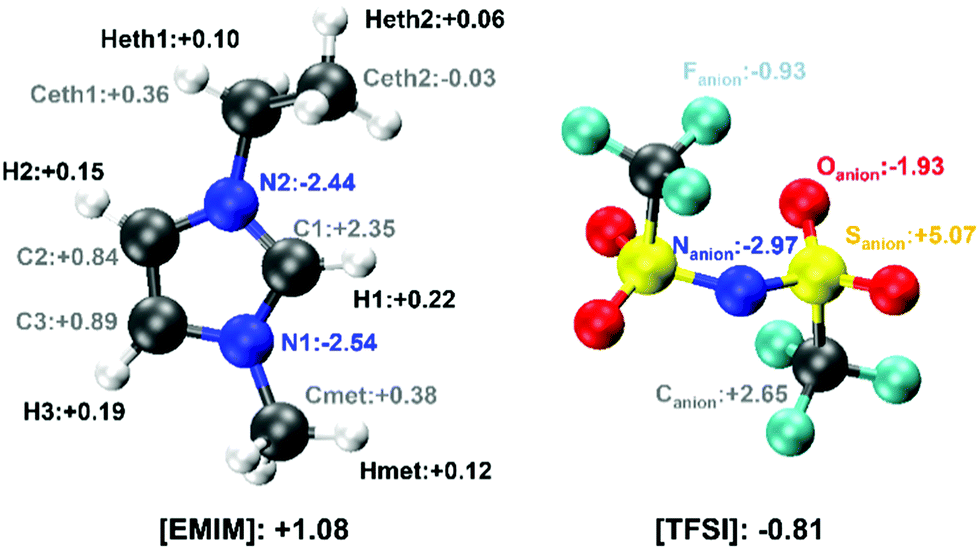 | ||
| Fig. 10 Schematic representation of the Bader charge of the atoms of the [EMIM] and [TFSI] ions. The colour code of the atoms and their labelling is identical to all former figures. | ||
A unitary rotation of the Kohn–Sham orbitals within the maximally localized Wannier function and the Wannier function centre (WFC) scheme56,57 allows for a very practical analysis of the chemical bonds and provides a shorthand visualization of the electronic structure that can result in being more cumbersome by resorting uniquely on the Kohn–Sham orbitals. A picture of the WFCs for the whole [EMIM] and [TFSI] ions is shown in Fig. S10 of the ESI.† Here, we limit the discussion to the peculiarity of the S–O58 and C–F59 chemical bonds. In terms of the distribution of the WFCs around the atoms of interest, the situation is shown in Fig. 11.
 | ||
| Fig. 11 Wannier function centres (orange spheres) and their distribution around the S–O (left panel) and the C–F (right panel) chemical bonds monitored during the FPMD dynamics. If the angles are small, it means that the Wannier function centres are located along the bonds. | ||
The structure and nature of the S–O chemical bonds have been a source of debate, and only in the early 1950s was some consensus eventually reached. In short, a sort of compromise58 exists between the electronegative O atoms and the need for stable S valence electrons. In the case of the sulphur dioxide-like groups of [TFSI], the O atoms show basically a single lone pair remaining bound to the O atoms and three WFCs more or less displaced toward the S atom, but nonetheless close to O, thus conferring an ionic character to this bond and accounting for a positive charge left on top of the S atom. A positive charge left on the sulphur is indeed the result expected on the basis of an accurate atomic orbital analysis in ref. 58 for sulfones and sulfoxides and is in line with the localization of the WFCs in the present analysis (Fig. 11) and also compatible with the analysis of Bader charges shown in Fig. 10. The S–O bond is then very strong, resembling a tight double bond but being mainly ionic with the (negative) valence electrons mostly displaced toward the O site. Less complicated is the situation of the C–F bond. In this case, three WFCs remain as lone pairs in the proximity of the F site, whereas one doubly occupied WFC is located along the C–F bond (see Fig. 11) but is strongly displaced toward the F site (see Fig. S11 in the ESI†), thus accounting for a negative partial charge of F, as opposed to a positive one on C, in perfect agreement with the Bader charge analysis. The details of other WFCs are reported in Fig. S12 of the ESI.†
The availability of the WFCs is also a useful tool to compute the local dipole moment p of each [EMIM][TFSI] pair of the IL as a simple sum of point-like charges:
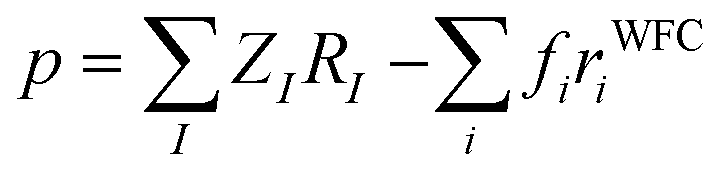 | (3) |
 | ||
| Fig. 12 (a) Typical geometry of one [EMIM] and its surrounding [TFSI] in the first coordination shell. (b) Dipole moment distribution of the [EMIM]–[TFSI] pairs (first coordination shell) inside the ionic liquid. | ||
Since the dipole moment of an ionic liquid is experimentally difficult to measure,60 this can provide a useful quantitative analysis complementing experimental probes. Yet, a closer contact with experiments would be desirable. To encompass this difficulty, since the global dipole moment M(t) is available all along the dynamical trajectory, we computed the infra-red (IR) spectrum as the Fourier transform of the dipole–dipole autocorrelation function,
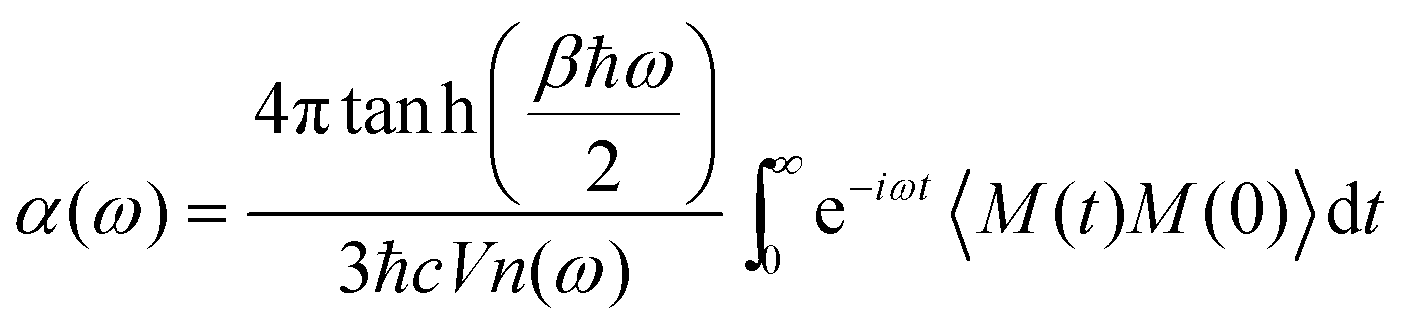 | (4) |
 | (5) |
The computed IR spectrum and the accompanying dielectric function are shown in Fig. 13. Consistent with the experimental outcome,61,62 our computed IR spectrum (lower panel in Fig. 13) is dominated by the contribution of [TFSI] and we are able to reproduce all the sharp peaks between 500 and 1500 cm−1, attributed to all the ring modes as detailed in ref. 62. Analogously, the small peak between 2800 and 3100 cm−1, originating from the C–H stretching modes, makes just a small contribution.
 | ||
| Fig. 13 The real part of the refractive index (ε1) and the IR absorption spectrum (α) of the simulated [EMIM][TFSI] as obtained from the autocorrelation function of the total dipole moment as described in the text. | ||
To disentangle the contributions of each vibrational mode to the IR spectrum, we performed a normal mode analysis of an [EMIM]–cis[TFSI] dimer. These results are summarized in Table S1 in the ESI.† We can observe that a slight shift toward lower frequencies, affecting particularly this part of our IR spectrum, is not surprising and represents a typical limit in DFT-based calculations of the IR response in polar liquids.66 The dielectric function, on the other hand, provides useful information about the frequency range in which the material is operational and allows tuning the current flow under an applied electric field, a key issue in the fabrication of field-effect transistors exploiting ILs.
Conclusions
We undertook a thorough analysis of the structural, dynamical, electronic and spectroscopic properties of the ionic liquid [EMIM][TFSI], representing a current target system for the realization of next-generation electronic devices. We resort to long-lasting FPMD simulations to bridge the gap between the former classical MD studies and short lasting first-principles simulations. This computational effort allows us to unravel the highly dynamical yet tuneable features of the system, providing a microscopic picture not accessible to experimental probes. In particular, we evidence how the diffusion is a slow process, whereas fast conformational changes occur at room temperature, realized upon overcoming a modest free energy barrier, without affecting the overall structure of the polar liquid, which indeed presents pair correlation functions that do not undergo significant changes on the simulation time scale afforded here.The efficient H-bond network realized inside the IL is responsible for a significant enhancement of the local dipole moment of the [EMIM][TFSI] pairs that, in turn, confers a remarkable stability to this peculiar liquid phase. This is encouraging in view of the use of these liquid materials in devices that are expected to operate at room temperature. The electronic structure is characterized by a rather large band gap, ensuring the absence of undesired HOMO–LUMO transitions under the typical working conditions. Moreover, the nature of the chemical bonds is rationalized in terms of Wannier function analyses to picture the degree of ionicity of the atoms that form the two ionic moieties, with particular attention to the case of S bound to O and F, which have been a long-standing source of debate. The relatively long simulation time also allows the infra-red spectrum and the dielectric response in the low frequency range to be refined, the minimum reachable frequency being ν = 1/(maximum simulation time). This allows us to obtain macroscopic observables directly comparable to experiments and provides insightful information on the best suited range of frequencies where the material can be safely employed for the efficient realization of devices.
Author contributions
The manuscript was written through contributions of all authors. All authors have given approval to the final version of the manuscript.Conflicts of interest
The authors declare no competing financial interest.Acknowledgements
We thank the HPC Centre at the University of Strasbourg funded by the Equipex Equip@Meso project (Programme Investissements d’Avenir) - CPER Alsacalcul/Big Data, and the Grand Equipement National de Calcul Intensif (GENCI) under allocation DARI-A0100906092. We are grateful to Iréné Amiehe Essomba for his kind help in the preparation of the IL system, and to Emanuele Orgiu and Carlo Massobrio for fruitful discussions and insightful suggestions. Funding: K. I. is funded by the French Bourse du Gouvernement – Ministère Affaires Étrangeres and the Japanese Takenaka Scholarship Foundation.References
- J. T. Ye, Y. J. Zhang, R. Akashi, M. S. Bahramy, R. Arita and Y. Iwasa, Superconducting Dome in a Gate-Tuned Band Insulator, Science, 2012, 338, 1193–1196 CrossRef CAS PubMed.
- D. Costanzo, S. Jo, H. Berger and A. F. Morpurgo, Gate-induced superconductivity in atomically thin MoS2 crystals, Nat. Nanotechnol., 2016, 11, 339–344 CrossRef CAS PubMed.
- C. Jia, M. Famili, M. Carlotti, Y. Liu, P. Wang, I. M. Grace, Z. Feng, Y. Wang, Z. Zhao, M. Ding, X. Xu, C. Wang, S.-J. Lee, Y. Huang, R. C. Chiechi, C. J. Lambert and X. Duan, Quantum interference mediated vertical molecular tunneling transistors, Sci. Adv., 2018, 4, eaat8237 CrossRef CAS PubMed.
- N. K. Upadhyay, H. Jiang, Z. Wang, S. Asapu, Q. Xia and J. J. Yang, Emerging Memory Devices for Neuromorphic Computing, Adv. Mater. Technol., 2019, 4, 1800589 CrossRef.
- R. A. John, F. Liu, N. A. Chien, M. R. Kulkarni, C. Zhu, Q. Fu, A. Basu, Z. Liu and N. Mathews, Synergistic Gating of Electro-Iono-Photoactive 2D Chalcogenide Neuristors: Coexistence of Hebbian and Homeostatic Synaptic Metaplasticity, Adv. Mater., 2018, 30, 1800220 CrossRef PubMed.
- G. Gao, J. Yu, X. Yang, Y. Pang, J. Zhao, C. Pan, Q. Sun and Z. L. Wang, Triboiontronic Transistor of MoS2, Adv. Mater., 2018, 31, 1806905 CrossRef PubMed.
- A. G. Kelly, T. Hallam, C. Backes, A. Harvey, A. S. Esmaeily, I. Godwin, J. Coelho, V. Nicolosi, J. Lauth, A. Kulkarni, S. Kinge, L. D. A. Siebbeles, G. S. Duesberg and J. N. Coleman, All-printed thin-film transistors from networks of liquid-exfoliated nanosheets, Science, 2017, 356, 69–73 CrossRef CAS PubMed.
- S. J. Park, D. Nam, D.-Y. Jeon and G.-T. Kim, Transport-map analysis of ionic liquid-gated ambipolar WSe2 field-effect transistors, Semicond. Sci. Technol., 2019, 34, 075022 CrossRef CAS.
- J.-K. Huang, J. Pu, C.-L. Hsu, M.-H. Chiu, Z.-Y. Juang, Y.-H. Chang, W.-H. Chang, Y. Iwasa, T. Takenobu and L.-J. Li, Large-Area Synthesis of Highly Crystalline WSe2 Monolayers and Device Applications, ACS Nano, 2014, 8, 923–930 CrossRef CAS PubMed.
- Y. Umebayashi, T. Fujimori, T. Sukizaki, M. Asada, K. Fujii, R. Kanzaki and S. Ishiguro, Evidence of Conformational Equilibrium of 1-Ethyl-3-methylimidazolium in Its Ionic Liquid Salts:Raman Spectroscopic Study and Quantum Chemical Calculations, J. Phys. Chem. A, 2005, 109(40), 8976–8982 CrossRef CAS PubMed.
- N. R. Dhumal, H. J. Kim and J. Kiefer, Electronic Structure and Normal Vibrations of the 1-Ethyl-3-methylimidazolium Ethyl Sulfate Ion Pair, J. Phys. Chem. A, 2011, 115(15), 3551–3558 CrossRef CAS PubMed.
- K. Fujii, Y. Soejima, Y. Kyoshoin, S. Fukuda, R. Kanzaki, Y. Umebayashi, T. Yamaguchi, S. Ishiguro and T. Takamuku, Liquid Structure of Room-Temperature Ionic Liquid, 1-Ethyl-3-methylimidazolium Bis-(trifluoromethanesulfonyl) Imide, J. Phys. Chem. B, 2008, 112(14), 4329–4336 CrossRef CAS PubMed.
- Z. Liang, C. Zhao, W. Zhao, Y. Zhang, P. Srimuk, V. Presser and G. Feng, Molecular Understanding of Charge Storage in MoS2 Supercapacitors with Ionic Liquids, Energy Environ. Mater., 2021, 4, 631–637 CrossRef CAS.
- W. Zhao, S. Bi, C. Zhang, P. D. Rack and G. Feng, Adding Solvent into Ionic Liquid-Gated Transistor: The Anatomy of Enhanced Gating Performance, ACS Appl. Mater. Interfaces, 2019, 11(14), 13822–13830 CrossRef CAS PubMed.
- D. T. Bowron, C. D’Agostino, L. F. Gladden, C. Hardacre, J. D. Holbrey, M. C. Lagunas, J. McGregor, M. D. Mantle, C. L. Mullan and T. G. A. Youngs, Structure and Dynamics of 1-Ethyl-3-methylimidazolium Acetate via Molecular Dynamics and Neutron Diffraction, J. Phys. Chem. B, 2010, 114, 7760–7768 CrossRef CAS PubMed.
- T. G. A. Youngs, J. D. Holbrey, C. L. Mullan, S. E. Norman, M. C. Lagunas, C. D’Agostino, N. D. Mantle, L. F. Gladden, D. T. Bowrond and C. Hardacre, Neutron diffraction, NMR and molecular dynamics study of glucose dissolved in the ionic liquid 1-ethyl-3-methylimidazolium acetate, Chem. Sci., 2011, 2, 1594–1605 RSC.
- A. Vioux and B. Coasne, From Ionogels to Biredox Ionic Liquids: Some Emerging Opportunities for Electrochemical Energy Storage and Conversion Devices, Adv. Energy Mater., 2017, 7, 1700883 CrossRef.
- A. Schlaich, D. Jin, L. Bocquet and B. Coasne, Electronic screening using a virtual Thomas–Fermi fluid for predicting wetting and phase transitions of ionic liquids at metal surfaces, Nat. Mater., 2022, 21, 237–245 CrossRef CAS PubMed.
- G. Ori, C. Massobrio, A. Pradel, M. Ribes and B. Coasne, Structure and Dynamics of Ionic Liquids Confined in Amorphous Porous Chalcogenides, Langmuir, 2015, 31, 6742–6751 CrossRef CAS PubMed.
- S. P. F. Costa, A. M. O. Azevedo, P. C. A. G. Pinto and M. L. M. F. S. Saraiva, Environmental Impact of Ionic Liquids: Recent Advances in (Eco)toxicology and (Bio) degradability, ChemSusChem, 2017, 10, 2321–2347 CrossRef CAS PubMed.
- R. F. Frade and C. A. Afonso, Impact of ionic liquids in environment and humans: An overview, Hum. Exp. Toxicol., 2010, 29, 1038–1054 CrossRef CAS PubMed.
- J. M. Klein, E. Panichi and B. Gurkan, Potential dependent capacitance of [EMIM][TFSI], [N1114][TFSI] and [PYR13][TFSI] ionic liquids on glassy carbon, Phys. Chem. Chem. Phys., 2019, 21, 3712–3720 RSC.
- C. Yuan, X. Zhu, L. Su, D. Yang, Y. Wang, K. Yang and X. Cheng, Preparation and characterization of a novel ionic conducting foam-type polymeric gel based on polymer PVdF-HFP and ionic liquid [EMIM][TFSI], Colloid Polym. Sci., 2015, 293, 1945–1952 CrossRef CAS.
- O. Höfft, S. Bahr, M. Himmerlich, S. Krischok, J. A. Schaefer and V. Kempter, Electronic Structure of the Surface of the Ionic Liquid [EMIM][Tf2N] Studied by Metastable Impact Electron Spectroscopy (MIES), UPS, and XPS, Langmuir, 2006, 22, 7120–7123 CrossRef PubMed.
- W. M. Reichert, J. D. Holbrey, R. P. Swatloski, K. E. Gutowski, A. E. Visser, M. Nieuwenhuyzen, K. R. Seddon and R. D. Rogers, Solid-State Analysis of Low-Melting 1,3-Dialkylimidazolium Hexafluorophosphate Salts (Ionic Liquids) by Combined X-ray Crystallographic and Computational Analyses, Cryst. Growth Des., 2007, 7, 1106–1114 CrossRef CAS.
- M. Bühl, A. Chaumont, R. Schurhammer and G. Wipff, Ab Initio Molecular Dynamics of Liquid 1,3-Dimethylimidazolium Chloride, J. Phys. Chem. B, 2005, 109(39), 18591–18599 CrossRef PubMed.
- K. Wendler, M. Brehm, F. Malberg, B. Kirchner and L. Delle Site, Short Time Dynamics of Ionic Liquids in AIMD-Based Power Spectra, J. Chem. Theory Comput., 2012, 8, 1570–1579 CrossRef CAS PubMed.
- W. Kohn and L. J. Sham, Self-Consistent Equations Including Exchange and Correlation Effects, Phys. Rev., 1965, 140, A1133–A1138 CrossRef.
- R. Car and M. Parrinello, Unified Approach for Molecular Dynamics and Density-Functional Theory, Phys. Rev. Lett., 1985, 55, 2471–2474 CrossRef CAS PubMed.
- CPMD, copyright IBM Corp. (1990–2021), copyright MPI für Festkörperforschung Stuttgart (1997–2001). http://www.cpmd.org.
- N. Troullier and J. L. Martins, Efficient pseudopotentials for plane-wave calculations, Phys. Rev. B: Condens. Matter Mater. Phys., 1991, 43, 1993–2006 CrossRef CAS PubMed.
- N. Troullier and J. L. Martins, Efficient pseudopotentials for plane-wave calculations. II. Operators for fast iterative diagonalization, Phys. Rev. B: Condens. Matter Mater. Phys., 1991, 43, 8861–8869 CrossRef PubMed.
- A. D. Becke, Density-functional exchange-energy approximation with correct asymptotic behavior, Phys. Rev. A: At., Mol., Opt. Phys., 1988, 38, 3098–3100 CrossRef CAS PubMed.
- C. Lee, W. Yang and R. G. Parr, Development of the Colle-Salvetti correlation-energy formula into a functional of the electron density, Phys. Rev. B: Condens. Matter Mater. Phys., 1988, 37, 785–789 CrossRef CAS PubMed.
- P. L. Silvestrelli, van der Waals interactions in DFT made easy by Wannier functions, Phys. Rev. Lett., 2008, 100, 053002 CrossRef PubMed.
- T. Ikeda and M. Boero, Role of van der Waals corrections in first principles simulations of alkali metal ions in aqueous solutions, J. Chem. Phys., 2015, 143, 194510 CrossRef PubMed.
- S. Nosé, A molecular dynamics method for simulations in the canonical ensemble, Mol. Phys., 1984, 52, 255–268 CrossRef.
- S. Nosé, A unified formulation of the constant temperature molecular dynamics methods, J. Chem. Phys., 1984, 81, 511–519 CrossRef.
- W. G. Hoover, Canonical dynamics: Equilibrium phase-space distributions, Phys. Rev. A: At., Mol., Opt. Phys., 1985, 31, 1695–1697 CrossRef PubMed.
- J. Jacquemin, P. Husson, A. A. H. Padua and V. Majer, Density and viscosity of several pure and water-saturated ionic liquids, Green Chem., 2006, 8, 172–180 RSC.
- C. P. Fredlake, J. M. Crosthwaite, D. G. Hert, S. N. V. K. Aki and J. F. Brennecke, Thermophysical Properties of Imidazolium-Based Ionic Liquids, J. Chem. Eng. Data, 2004, 49, 954–964 CrossRef CAS.
- J. N. Canongia Lopes, J. Deschamps and A. A. H. Pádua, Modeling Ionic Liquids using a Systematic All-Atom Force Field, J. Phys. Chem. B, 2004, 108, 2038–2047 CrossRef.
- T. Köddermann, D. Paschek and R. Ludwig, Molecular Dynamic Simulations of Ionic Liquids: A Reliable Description of Structure, Thermodynamics and Dynamics, ChemPhysChem, 2007, 8, 2464–2470 CrossRef PubMed.
- R. J. Magyar, S. Root and T. R. Mattsson, Equations of state for mixtures: results from density-functional (DFT) simulations compared to high accuracy validation experiments on Z, J. Phys.: Conf. Ser., 2014, 500, 162004 CrossRef.
- R. Rousseau, M. Boero, M. Bernasconi, M. Parrinello and K. Terakura, Ab initio Simulation of Phase Transitions and Dissociation of H2S at High Pressure, Phys. Rev. Lett., 2000, 85, 1254–1257 CrossRef CAS PubMed.
- K. Rotnicki, A. Sterczyńska, Z. Fojud, M. Jażdżewska, A. Beskrovnyi, J. Waliszewski and M. Śliwińska-Bartkowiak, Phase transitions, molecular dynamics and structural properties of 1-Ethyl-3-methylimidazolium bis(trifluoromethylsulfonyl)imide ionic liquid, J. Mol. Liq., 2020, 313, 113535 CrossRef CAS.
- J. Galy and S. F. Matar, Electron Lone-Pairs Stereochemistry and Drastic van der Waals and Pressure Effects in AsF3 from First Principles, Condens. Matter, 2021, 6, 31 CrossRef CAS.
- G. Ori, F. Villemot, L. Viau, A. Vioux and B. Coasne, Ionic liquid confined in silica nanopores: molecular dynamics in the isobaric–isothermal ensemble, Mol. Phys., 2014, 112, 1350–1361 CrossRef CAS.
- J. C. Lassègues, J. Grondin, R. Holomb and P. Johansson, Raman and ab initio study of the conformational isomerism in the 1-ethyl-3-methyl-imidazolium bis(trifluoromethanesulfonyl)imide ionic liquid, J. Raman Spectrosc., 2007, 38, 551–558 CrossRef.
- J. D. Holbrey, W. M. Reichert and R. D. Rogers, Crystal structures of imidazolium bis(trifluoromethanesulfonyl)imide ‘ionic liquid’ salts: the first organic salt with a cis-TFSI anion conformation, Dalton Trans., 2004, 2267–2271 RSC.
- A. Noda, K. Hayamizu and M. Watanabe, Pulsed-Gradient Spin−Echo 1H and 19F NMR Ionic Diffusion Coefficient, Viscosity, and Ionic Conductivity of Non-Chloroaluminate Room-Temperature Ionic Liquids, J. Phys. Chem. B, 2001, 105, 4603–4610 CrossRef CAS.
- C. D’Agostino, M. D. Mantle, C. L. Mullan, C. Hardacre and L. F. Gladden, Diffusion, Ion Pairing and Aggregation in 1-Ethyl-3-Methylimidazolium-Based Ionic Liquids Studied by 1H and 19F PFG NMR: Effect of Temperature, Anion and Glucose Dissolution, ChemPhysChem, 2018, 19, 1081–1088 CrossRef PubMed.
- M. Sprik and G. Ciccotti, Free energy from constrained molecular dynamics, J. Chem. Phys., 1998, 109, 7737–7744 CrossRef CAS.
- R. F. W. Bader, A quantum theory of molecular structure and its applications, Chem. Rev., 1991, 91, 893–928 CrossRef CAS.
- G. Henkelman, A. Arnaldsson and H. Jónsson, A fast and robust algorithm for Bader decomposition of charge density, Comput. Mater. Sci., 2006, 36, 354–360 CrossRef.
- N. Marzari and D. Vanderbilt, Maximally localized generalized Wannier functions for composite energy bands, Phys. Rev. B: Condens. Matter Mater. Phys., 1997, 56, 12847–12865 CrossRef CAS.
- R. Resta, Quantum-Mechanical Position Operator in Extended Systems, Phys. Rev. Lett., 1998, 80, 1800–1803 CrossRef CAS.
- W. Moffitt, The Nature of the Sulphur-Oxygen Bond, Proc. R. Soc. London, Ser. A, 1950, 200, 409–428 CAS.
- D. O'Hagan, Understanding organofluorine chemistry. An introduction to the C–F bond, Chem. Soc. Rev., 2008, 37, 308–319 RSC.
- K. Wendler, S. Zahn, F. Dommert, R. Berger, C. Holm, B. Kirchner and L. Delle Site, Locality and Fluctuations: Trends in Imidazolium-Based Ionic Liquids and Beyond, J. Chem. Theory Comput., 2011, 7, 3040–3044 CrossRef CAS PubMed.
- J. Kiefer, J. Fries and A. Leipertz, Experimental Vibrational Study of Imidazolium-Based Ionic Liquids: Raman and Infrared Spectra of 1-Ethyl-3-methylimidazolium Bis(trifluoromethylsulfonyl)imide and 1-Ethyl-3-methylimidazolium Ethylsulfate, Appl. Spectrosc., 2007, 61, 1306–1311 CrossRef CAS PubMed.
- A. Eilmes, P. Kubisiak and M. Brela, Explicit Solvent Modeling of IR and UV-Vis Spectra of 1-Ethyl-3-methylimidazolium Bis(trifluoromethylsulfonyl)imide Ionic Liquid, J. Phys. Chem. B, 2016, 120, 11026–11034 CrossRef CAS PubMed.
- M.-M. Huang, Y. Jiang, P. Sasisanker, G. W. Driver and H. Weingärtner, Static Relative Dielectric Permittivities of Ionic Liquids at 25 °C, J. Chem. Eng. Data, 2011, 56(4), 1494–1499 CrossRef CAS.
- R. de and L. Kronig, On the theory of the dispersion of X-rays, J. Opt. Soc. Am., 1926, 12, 547–557 CrossRef.
- H. A. Kramers, La diffusion de la lumière par les atomes, Atti. Cong. Intern. Fisica., 1927, 2, 545–557 Search PubMed.
- D. A. Schmidt, R. Scipioni and M. Boero, Water Solvation Properties: An Experimental and Theoretical Investigation of Salt Solutions at Finite Dilution, J. Phys. Chem. A, 2009, 113, 7725–7729 CrossRef CAS PubMed.
Footnote |
| † Electronic supplementary information (ESI) available. See https://doi.org/10.1039/d2cp00741j |
| This journal is © the Owner Societies 2022 |