
 Open Access Article
 This Open Access Article is licensed under a Creative Commons Attribution-Non Commercial 3.0 Unported Licence
Statistical evaluation of simulated NMR data of flexible molecules†
Ulrich
Sternberg
 *ab and
Christophe
Farès
c
*ab and
Christophe
Farès
c
aResearch Partner of Karlsruhe Institute of Technology (KIT), Karlsruhe, Germany. E-mail: ulrich.sternberg@partner.kit.edu
bCOSMOS-Software, Jena, Germany Web: http://www.cosmos-software.de
cMax-Planck-Institut für Kohlenforschung, Kaiser-Wilhelm Platz 1, 45470 Mülheim an der Ruhr, Germany. E-mail: fares@mpi-muelheim.mpg.de
First published on 11th April 2022
Abstract
A new probability score—named χ-probability—is introduced for evaluating the fit of mixed NMR datasets to calculate molecular model ensembles, in order to answer challenging structural questions such as the determination of stereochemical configurations. Similar to the DP4 parameter, the χ-probability is based on Bayes theorem and expresses the probability that an experimental NMR dataset fits to a given individual within a finite set of candidate structures or configurations. Here, the χ-probability is applied to single out the correct configuration in four example cases, with increasing complexity and conformational mobility. The NMR data (which include RDCs, NOE distances and 3J couplings) are calculated from MDOC (Molecular Dynamics with Orientational Constraints) trajectories and are investigated against experimentally measured data. It is demonstrated that this approach singles out the correct stereochemical configuration with probabilities more than 98%, even for highly mobile molecules. In more demanding cases, a decisive χ-probability test requires that the datasets include high-quality NOE distances in addition to RDC values.
Introduction
Constitutional characterisation of organic molecules by NMR has long become routine and relies solely on semi-quantitatively evaluated NMR parameters (chemical shifts (CS) or internuclear correlations-based J-couplings (J) and cross-relaxation (NOEs)) that are easily available even using sub-milligram amount of samples. These very same parameters (J, CS, NOE) have also been universally used towards configurational and conformational interpretation, i.e., the determination of the stereoisomeric identity and of 3D-model structures of unknown compounds.1–3 However, compared to X-ray analysis, NMR remains an imperfect analytical tool as witnessed by the all too often revisions of assignment in the world of natural products assignments.4–7 This can be rationalized by the error-prone interpretation of NMR parameters due to their semi-quantitative and short-range nature, unfortunate signal overlaps, the presence of structural “blind-spots” (e.g. sections lacking 1H), parameter ambiguities and overall structural fluctuations. In recent years, orientation parameters, such as residual dipolar couplings (RDCs)8 and residual chemical shift anisotropy (RCSA),9 have been added to the arsenal of structural NMR data, but have not found widespread use.Thankfully, the last decades have witnessed the combination of spectroscopic and computational methods, which offers high potential to better streamline configurational analysis and conformational calculations and to circumvent interpretation pitfalls. The general strategy consists of computationally generating conformational models, back-calculating short-range (NOE, J and CS) or long-range (RDCs, RCSAs) NMR parameters and evaluating them against those measured experimentally. Density functional theory (DFT), the most frequently employed quantum mechanics (QM) modelling method, solves the Schrödinger equation on all nuclei and bonding electrons and is ideally suited to accurately predict chemical shifts and J-couplings on individual conformers.10–13 The many examples where this approach was used leave no doubt on the efficiency of this method. For molecules with large structural fluctuations due to dynamics and chemical interconversion, the use of DFT can quickly become prohibitively costly. The molecular mechanics (MM) approaches, on the other hand, make use of classical potential energy equations applied to all bonds and atoms and represent a robust strategy to efficiently sample vast energy landscapes even for larger molecular systems.
The advent of efficient methods to simulate or calculate NMR parameters from molecular models has prompted the need to develop better tools and metrics to evaluate the quality of the fit between data and simulation. In addition to the traditional metrics such as RMS (root mean square) deviation or MAE (mean absolute error), many methods have placed the emphasis on clearly delineating different models and in assisting the decision-making process, especially for choosing the correct stereochemical configuration.
Interesting are the scoring parameters used for evaluating orientation constraints such as RDCs used within specialized programs such as PALES,14 MSpin15 and MDOC.16,17 Here, special scoring parameters have been used, as for instance the Cornilescu's Q factor:18
 | (1) |
This score approaches zero if the differences between the calculated and experimental properties (qexp − qcalc) become small. However, because of the denominator, the Q-factor depends on the magnitude of the NMR parameter. This means, for instance, that parameter sets from stronger alignment media (i.e. larger RDCs) will generally score better.
A more appropriate score, n/χ2, based on the well-known statistical parameter χ2,
 | (2) |
 | (3) |
In recent papers from Navarro-Vázquez and colleagues,7,20–24 the χ2 parameter was also introduced into the computer-assisted 3D structural elucidation (CASE-3D) as a decision-making tool, which is derived from the Akaike Information Criterion (AIC).25 The aim of the AIC in CASE-3D is to maximize the fit while precluding the overfitting data by penalizing the use of large number of models. With k representing the number of independent variables (including the number of conformations), the AIC is used in the following form:
| AIC = χ2 + 2k | (4) |
In the CASE-3D protocol, the conformation model with the smallest AIC is thus selected.
In the study by Tzvetkova et al.,26 the successful MDOC simulation of the correct configuration is based on the more stringent criterion derived from the parameter χ2, applied to RDC datasets:
 | (5) |
Building upon the criterion n/χ2 ≥ 1, which requires that the simulated RDC data lie within the experimental error on average, this criterion (eqn (5)), which focusses on the data point with the largest deviation, precludes any outlier among the simulated data. In other words, if this criterion is larger than unity, then the simulation is a perfect representation of the experimental situation. For this approach, the datasets must be rigorously assessed: the dataset must be of high quality and experimental errors must be conservatively determined to represent maximum errors. On the other hand, the data must be extensive enough and the errors reasonably limited in order to ensure that only the correct configuration is fully consistent with the experimental RDC data.
In the case of flexible molecules, one must cope with molecules that populate several conformers and extensive rotamers, even including transient structures, which together contribute to the measured NMR parameters. It becomes evident that the basic set of orientational constraints (RDCs) alone, with their inherent ambiguities, cannot uniquely describe the complete conformational space, and would need to be complemented with other structural information, such as NOE distances and torsional angles from J-couplings. In these more complex cases with larger and mixed datasets, a small number of outliers cannot be completely avoided so that the “outlier test” eqn (5) would leave a user with no definitive answer at all. The problem of the outlier test comes from its “yes-or-no” binary outcome. It would instead be more desirable to numerically evaluate the probability for each candidate within a finite set of model structures to represent the correct answer, thus better guiding a configurational assignment.
A very successful approach in this regard is the statistical test of the calculated chemical shift data of molecules against experiments. The so-called DP4 probability as developed by Smith and Goodman27 has proved to be a valuable tool in assigning the stereochemistry of many small molecules, based only on 1H and 13C chemical shifts and J-couplings.28–30
Along the lines of statistical scoring schemes such as DP4, we propose here a Bayesian probability tool aimed at evaluating MDOC simulation models towards chiral assignments of flexible molecules and based for the first time on the parameter χ applied to large sets of mixed NMR parameters, including RDCs, NOE distances and 3J-couplings. The new method is supported by four cases of varying complexity.
Methods
MDOC simulations of NMR parameters
A typical MDOC trajectory contains 2000 or more coordinate snapshots that represent the distribution of conformers at a given temperature. Using BPT (Bond Polarization Theory, see e.g., Jakovkin et al.31) it is possible to calculate 13C or 15N chemical shifts for all molecular models of a trajectory – but the performance of the results depends on the type and bonding of the atom. When we optimize the geometry of the 2000 snapshots of a MDOC trajectory using CS constraints, the differences in the calculated CS values become too small to produce unambiguous results (using DP4 or the other scores) with respect to chirality in the case of very mobile molecules. Additionally, the approximations that have to be introduced into quantum chemical calculations must be taken into account when estimating the error and a total error Δqtotal = Δqexp + Δqcalc has to be used in χ2 score functions like eqn (2).In contrast, the RDCs act as a much better evaluation parameter since in MDOC simulations no extra approximations are introduced into their calculation. It has been demonstrated in several papers (for review see ref. 20) that RDCs are well suited for configuration determination of molecules with a low level of internal flexibility. One-bond residual dipolar couplings such as 1H–13C RDC depend nearly exclusively on the angle θ between the vector connecting the two nuclei and the z-axis of the external magnetic field. Still, this angular dependence is deemed ambiguous since all one-bond 1H–13C vectors along a double-cone with a semi-angle θ opening share the same RDC value. In an investigation of α- and β-D-cellobiose, Di Pietro et al.32 singled out the right configuration among 128 possible diastereomers in MDOC simulations using RDC values only – but in this case the authors extended their constraint dataset with13C–13C RDC values in addition to the 1H–13C RDC. In most cases, one-bond RDCs are not sufficient to conclusively determine a chiral configuration using the criteria in eqn (2) and (5). One example for this conundrum is oidolactone B studied by Tzvetkova et al.26 – this molecule contains two flexible six-membered lactone rings and a methoxy group with rotational freedom. An MDOC analysis with 14 1H–13C RDC as constraints provided two high-score configurations and the correct one could only be determined by comparing the experimental NOE distance with the mean NOE distance calculated from MDOC trajectories.
A number of publications underline the central role of NOE distances in determining the structure and configuration of molecules with internal mobility (see e.g. Kolmer et al.).33 Manifestly, it is possible to measure NOE intensities with high precision and to use these as distance restraints in MDOC simulations34 (for the methods see Vögeli35). Thus, meticulously interpreted NOE distances can be essential parameters in the assignment of chiral structures of mobile molecules. Since tensorial constraints (RDCs) are responsible for driving the rotational and conformational changes in MDOC simulations, distance parameters should be used at first to score the simulations.
The use of 3J-couplings characterizing torsion angles also represents an easily accessible and complementary constraining and evaluating parameter in MDOC simulations. The calculations of 3J-couplings using DFT are even more demanding than CS calculations but nevertheless, it has already been used in a DP4 like framework.36 In MDOC simulations, we used the much faster Altona-equation (Haasnoot et al.37) for 3JHH couplings and the equation of Palermo et al.38 for 3JCH couplings. These methods reached an RMS deviation to DFT calculations of about 0.6 Hz but in some cases, the differences can get higher. This uncertainty has to be added to the error of the experimental determination of 3J-couplings.
The χ-probability – a Bayesian measure
As the basis of our statistical analysis, we used the parameter χ because it is dimensionless and contains the information for how precisely a property in a given experiment could be measured. The definition of χ implies that it is distributed about the mean value zero. To obtain in analogy to Smith and Goodman27 the probability for obtaining a χ value we introduce the following steps:(i) First for every measured qexp and calculated value qtheo, a χi value is calculated: χi = (qexp − qtheo)/(Δqexp + Δqtheo). The larger the |χi| value, the more the calculated value deviates from the experimental value. We assume that the χi values follow a normal distribution around zero and calculate a standard deviation σ from all χ values.
(ii) We then calculate for every datapoint i the probability pi of obtaining value equal or larger than χi. This probability is expressed by pi = [1 − Φσ (|χi|)], where Φ is the cumulative density function of the normal distribution (CDF(Nσ), see also Fig. 1):
 | (6) |
 | ||
| Fig. 1 The blue curve is the probability density of normal distribution (PDF(Nσ), in this example with a standard deviation of σ = 1). The red area defines the probability for obtaining a |χ| value as large as |χi| or larger (in the example values above 1.5). The white area under PDF(Nσ) defines the cumulative distribution function CDF of the normal distribution Φ (see eqn (6)). | ||
(iii) The probability that a calculated set of data for one model fits to the experiment is product of all pi values Pm. To get a relative probability we have to divide product Pm by the sum of all Pm values.
This procedure can be condensed into eqn (7) for the probability P that a set of N data fits to one configuration (denoted with i) from a set of m structures or diastereomers:
 | (7) |
In eqn (7), CDF is the cumulative density function of the normal distribution Nσ(|χ|) (also see eqn 6) with the standard deviation σ and the argument 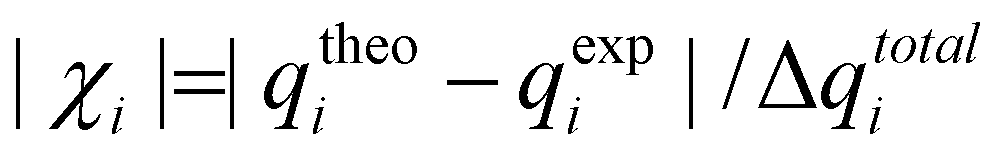 . In contrast to the DP4 method of Smith and Goodman,27 which uses the Student's t distribution mostly for practical reasons, standard deviation σ is calculated for all χ values of the m candidate structures. The numerator product of eqn (7) runs over all χ values of the structure i to be tested and this product is divided by the sum of the products over all candidate structures.
In this study, the χ values are calculated from theoretical MDOC simulations (qtheoi), omitting the first nanosecond of the simulation, during which the simulation reaches a steady state. RDCs, NOE distances and 3J-couplings are analyzed with conservatively estimated uncertainties such that the experimental values are with high probability within the error bounds. In Δqtotal we add up the experimental error and the uncertainty of the calculation procedure.
Results and discussion
Four structural elucidation cases (Scheme 1) of increasing size, flexibility, and complexity from the literature or from our group serve as the testing grounds for the new χ-probability evaluation score and highlight important aspects regarding the simulation and the datasets. These include a simple 1,4-diketone 1 with two chiral centers,39 two synthetic diastereomers 2p and 11-epi-2p related to a macrolide mandelalide A (later revised),40,41 the open-chain natural product sagittamide A 3![[thin space (1/6-em)]](https://www.rsc.org/images/entities/char_2009.gif) 42–44 and a synthetic precursor of the belizentrin A45,46 side chain 4.
42–44 and a synthetic precursor of the belizentrin A45,46 side chain 4.
 | ||
| Scheme 1 | ||
The simple case – a small molecule with torsional mobility
In a recent paper, 80 ns MDOC simulations of the two diastereomers 1-SR (C10-S and C12-R) and 1-SS (C10-S and C12-S) of the 1,4-diketone 1 (see Fig. 2a) have been performed. In the simulations, NOE distances and 3JHH were used as constraints in addition to 3 × 3 RDC tensors.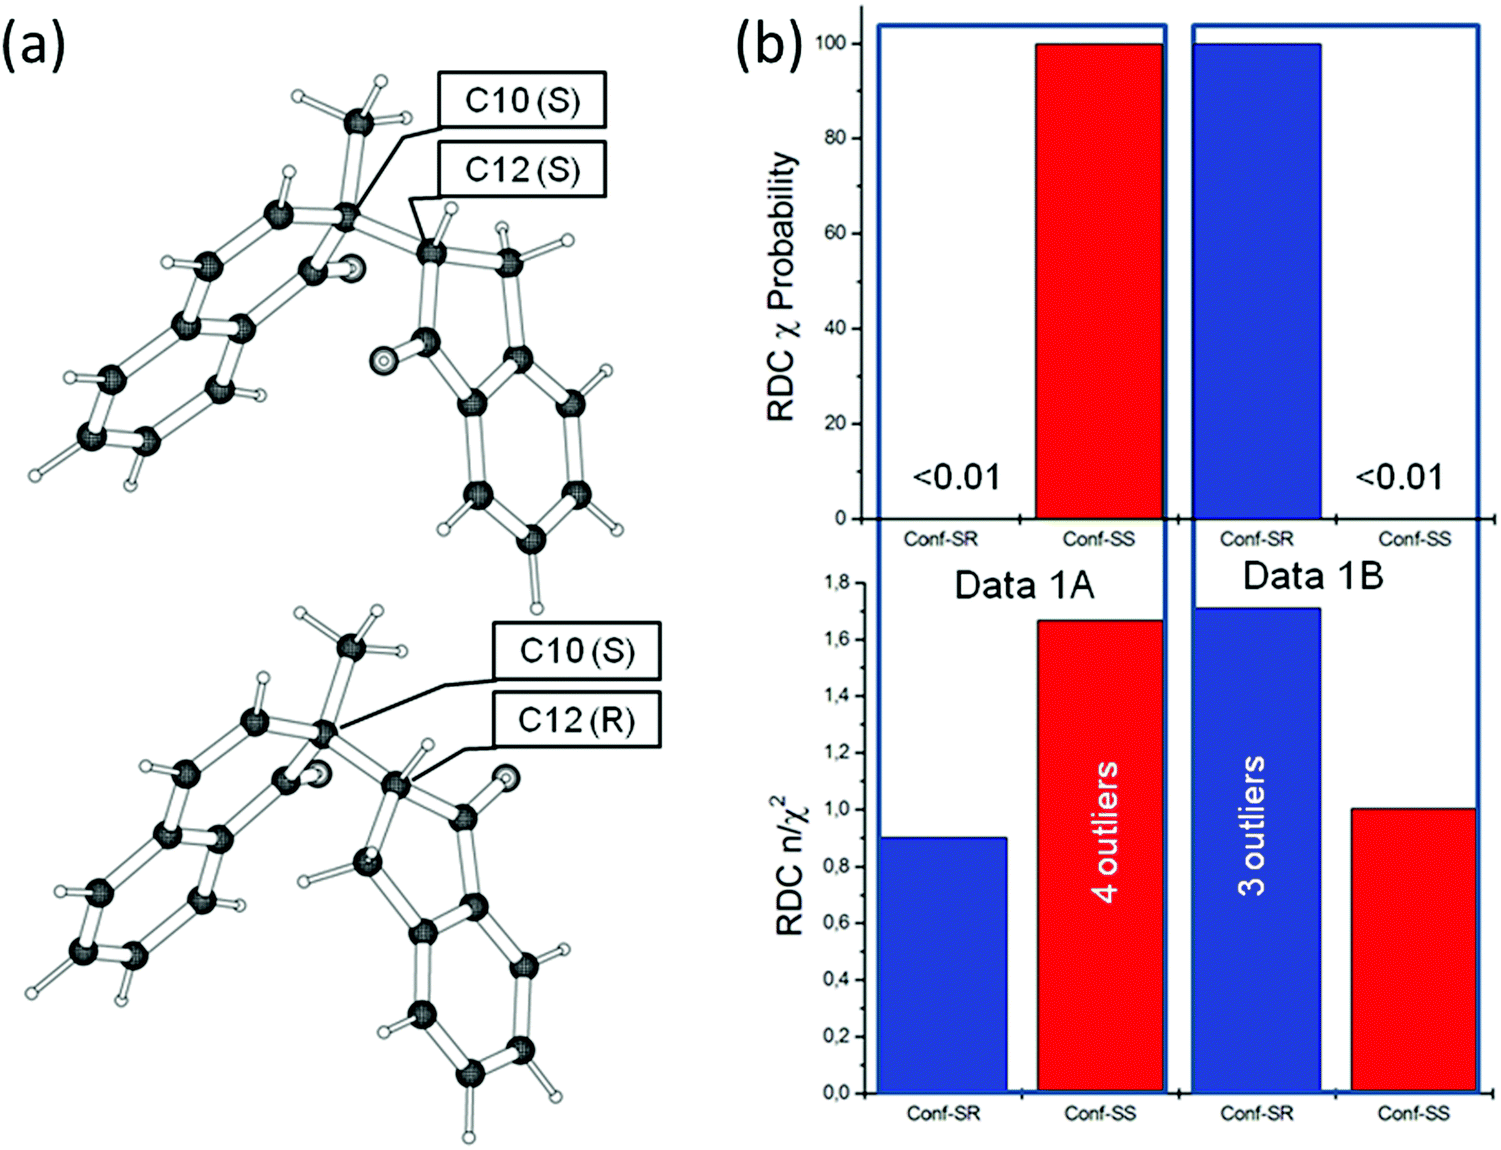 | ||
| Fig. 2 (a) Stereoisomers 1-SS (upper panel) and 1-SR (below) of 1,4-diketone. (b) Analysis of the four MDOC trajectories of the 1,4-diketone forms 1-SR and 1-SS using the two NMR datasets, 1A and 1B. In the lower panel the n/χ2 score for the RDC is given and in the upper panel the χ-probability according to eqn (6) is displayed. | ||
The MDOC trajectories have been analyzed by calculating the mean values over the simulated RDCs, NOE distances and 3J couplings omitting the first nanosecond. We calculated the total n/χ2 quality parameter for all constraints and the results for the RDCs are presented in Fig. 2b (bottom). A higher n/χ2 parameter for the 1-SS and 1-SR configurations to datasets 1A and 1B, respectively, validate the original assignment. For the correct configuration, the n/χ2 criterion is fulfilled, but not the outlier criterion (χmin−2, eqn (5)). In the case of data set 1A, the 24 RDCs, 13 NOE distances and three 3J couplings, were carefully evaluated and the estimated errors were conservatively set. Still, the simulation resulted in one outlier in NOE distances as well as to the four RDC outliers. Revisiting these outliers could not justify removing them or any other from the dataset. We believe that there are two major situations which could lead to inevitable outliers even in the case of well-assigned experimental data in flexible molecules: (i) the complexity of the molecular systems prevents a proper adjustment of the equilibria between the conformers or (ii) one set of NMR parameters interferes with another because their NMR mean values reflect very different time scales.
Do these outliers preclude a conclusive decision about the configuration based on MDOC results? Given that only two configurations are possible, we can at least calculate a statistical probability for each based on these results. The χ-probability parameter introduced in eqn (7) was evaluated for both datasets (see Fig. 2b). Remarkably, the χ-probability that each dataset corresponds to its assigned configuration (i.e., 1A to 1-SS and 1B to 1-SR) is about 99.99%, despite the presence of outliers. In other words, the χ-probability is able to provide an unambiguous result even in the case of an “imperfect” MDOC simulation with outliers. This unequivocal result can be rationalized by the fact that even a few larger deviations contribute strongly towards low probabilities thanks to the product series Π of eqn (7), and consequently, they are not “masked” by the large number of smaller deviations, as they would in the simple summation for χ2 in eqn (2).
The complicated case – a macrolide ring system
In the work by Farès et al.,34 several MDOC simulations were performed for diastereoisomers of the natural product mandelalide A. The structure and configuration of these macrocycles were ultimately determined by total synthesis of several diastereomers. At that time, a question was raised whether NMR in combination with MDOC simulations could have helped in the determination of the correct configuration from a single dataset. As a proof of principle, the authors made use of two sets of well-assigned NMR data (measured on known structures, denoted as 2p and 11-epi-2p) and tested those against four candidate structures (2p, 2r and the 11-epi form of both) for best-fit (Fig. 3). | ||
| Fig. 3 (a) Originally proposed 2p and (b) revised 2r isomers of the natural product mandelalide A. During the search for the right configuration, 11-epi-2p and 11-epi-2r were also synthesized, where the bond indicated in red was inverted from R to S. | ||
The macrolide system is much more demanding than 1,4-diketone, not only due to its size, but also because the energy barriers for conformational changes in the large ring system are much higher, leading to a large ensemble of possible twist states of the ring. Additionally, to a structure investigation of the ring system, a cross-validation of 2p and 11-epi-2p with 2r and 11-epi-2r structures was performed by running MDOC simulations with the 2p and 11-epi-2p NMR datasets applied to all four configurations. In Fig. 4a, the final n/χ2 quality results for the RDCs, NOE distances and 3J-couplings are displayed individually and in combination.
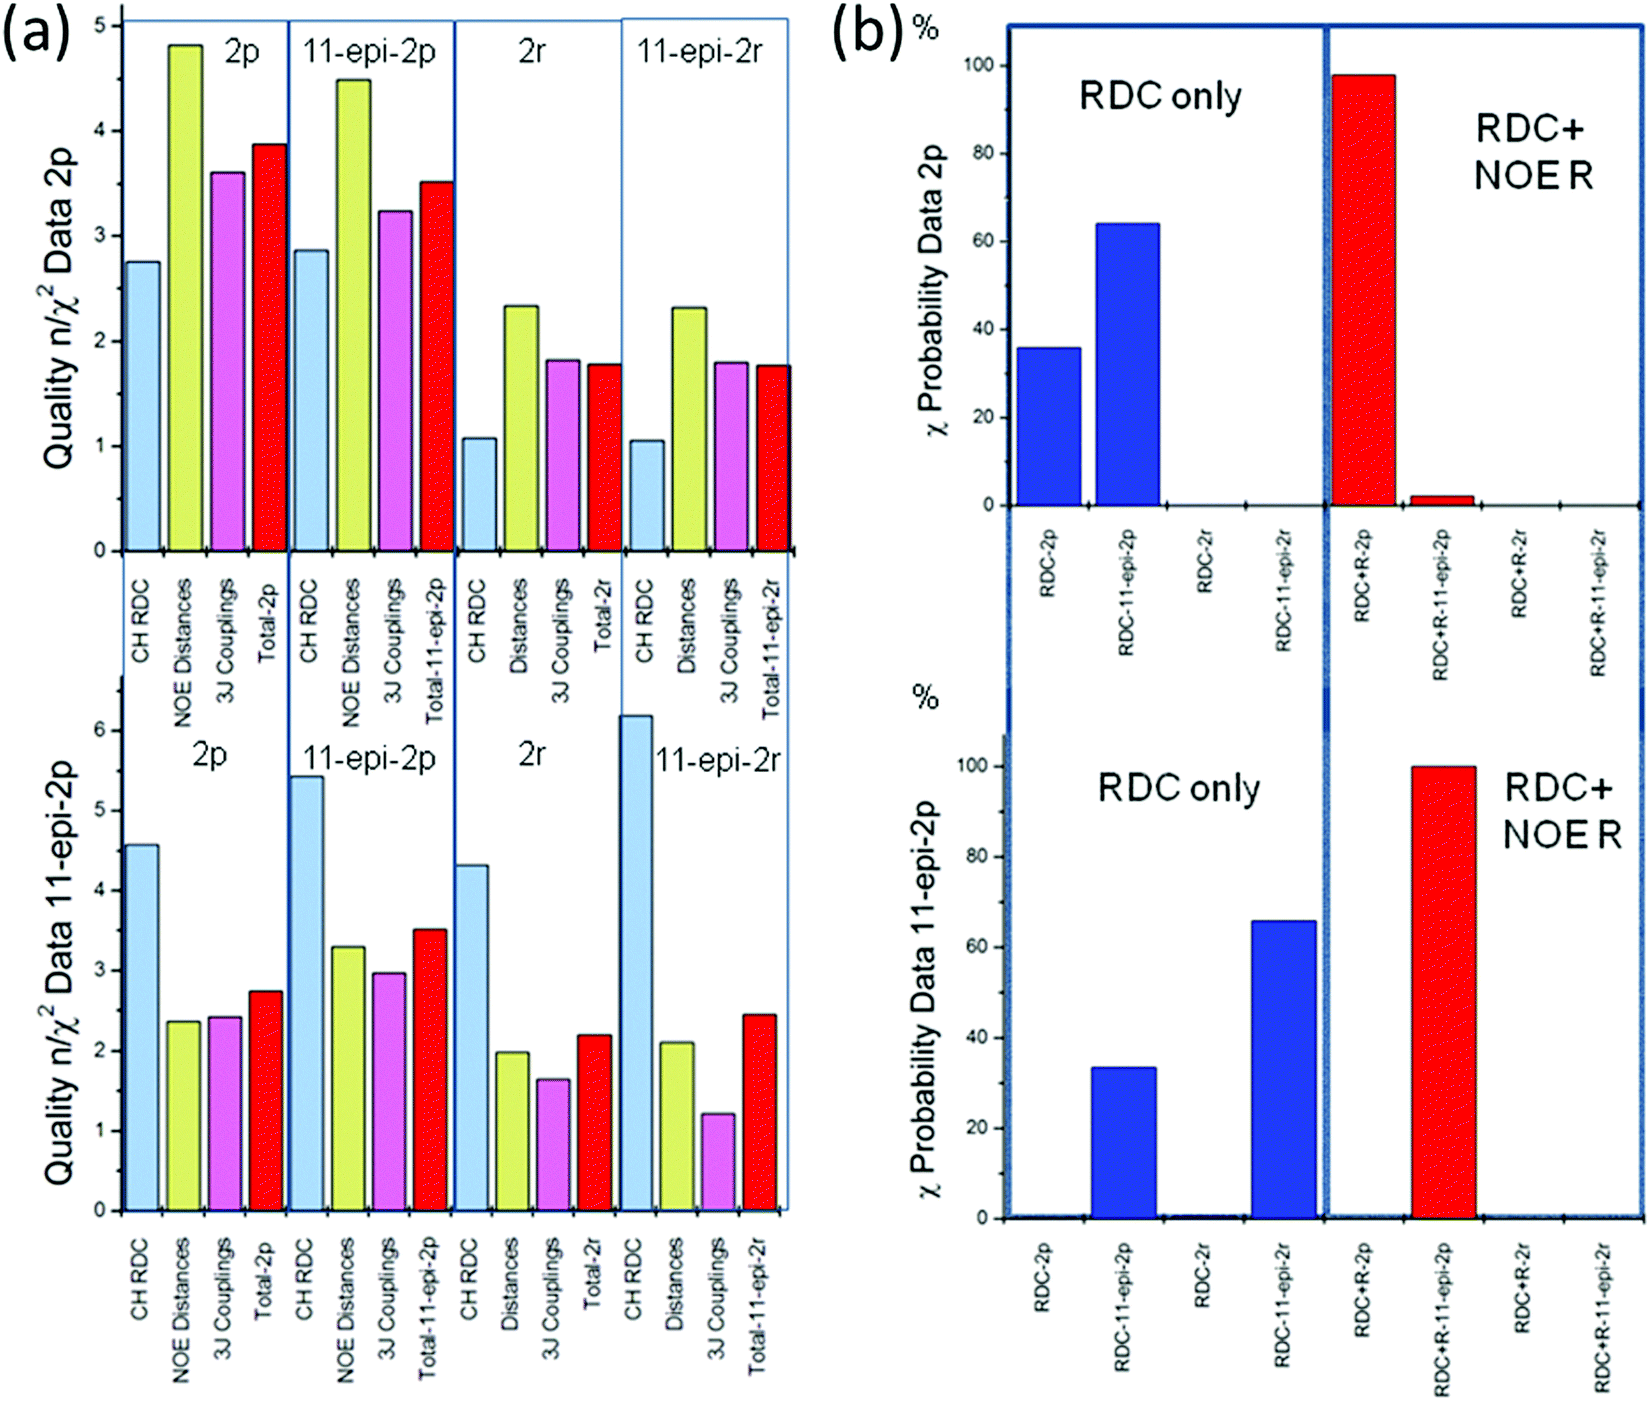 | ||
| Fig. 4 (a) Quality criteria n/χ2 for the four mandelalide structures 2p, 11-epi-2p, 2r and 11-epi-2r for different NMR data subsets (RDCs, NOEs, 3JHH and combined). The upper panel displays the MDOC simulated values for the NMR dataset 2p and the lower panel, those for the 11-epi-2p dataset. (b) The χ-probability for the mandelalide structures 2p, 11-epi-2p, 2r and 11-epi-2r are presented. In the upper panel the χ probabilities (see eqn (6)) are calculated from the MDOC simulation with the 2p dataset and the lower panel is obtained from the 11-epi-2p dataset. Left (blue) shows the probability for the RDC data only and right (red) the probability for RDC plus NOE distance data. | ||
Upon inspection of the n/χ2 values of the 2p-dataset (Fig. 4a, upper), it can be observed that all configurations have an overall good fit to the data (n/χ2 > 1). The NOEs (yellow), the J-couplings (pink) and the combined data (red) only marginally prefer the correct structure, whereas the RDC data alone (blue) even points to the incorrect structure. Still, a marked difference can be observed between the 2p and 2r (2.7 vs. 1.0) and less so between the 2p and 11-epi-2p (2.8 vs. 2.9) configurations. After combining all constraints, a logical score sequence between configurations is apparent but the differences between the values are still too subtle to warrant a definitive assignment. The outlier criterion χmin−2 does not improve the overall outcome of the demarcation between 2p and 11-epi-2p since their MDOC simulations feature four RDC outliers with χmin−2 = 0.216 and 0.256 when compared to the 2p-dataset. The cross-validation with the 11-epi-2p data (see lower part of Fig. 3a) is similarly misleading, since the RDC n/χ2 values show a small preference for the wrong structure. Only the sums over all constraints give the right sequence but the differences are again marginal. Overall, since the differences in n/χ2 and in χmin−2 are small, it is fair to say that this criterion allows only weak differentiation of the chiral assignment, at best.
In Fig. 4b, the dataset evaluation is presented using χ-probability according to eqn (7). The upper left part displays the probability using the RDC values only (blue columns). While the probability for the RDC values clearly differentiates between the 2p and 2r structures, it does not offer a significant delineation between the closely related diastereomers 2p and 11-epi-2p, even favoring the latter incorrect structure (2p with 35.9% vs.11-epi-2p with 64.1%). Even more surprising is the probability for the RDCs (blue columns) for the dataset 11-epi-2p. In this case, the widely different 11-epi-2r structure has a higher probability (65.8%) than the correct 11-epi-2p structure (33.5%). As a result, the RDC data alone do not allow reliable chiral differentiation.
The situation changes starkly if the evaluation dataset is complemented with the NOE distances. The product over k in eqn (7) runs then over the χ values calculated from the RDC and NOE distances combined. In the right part of Fig. 4b, these combined probabilities are presented as red columns. In the case of the 11-epi-2p dataset, the probability for the correct configuration reaches nearly exact 100% and in the case of the data set 2p a value of 97.9% is reached, whereas a residual probability of 2.1% is calculated for the 11-epi-2p structure. If the χ values of the 3J couplings are added to the probability the score for the 2p configuration rises to nearly exact 100%. The empty columns in Fig. 3 indicate probabilities of <0.01%, making a strong case for the correct assignment. Clearly in more demanding cases, the NOE distances are of crucial assistance to single out the right configuration.
A molecule with a highly mobile chain – sagittamide A
Sagittamide A is a natural product that was extracted from sea organisms called tunicates. The chiral part of sagittamide A consists of eight stereocenters, six of which are located in a per-acetylated 1,2,3,4,5,6-hexahydroxyhexane unit (C5–C10, see Fig. 5). The stereochemistry of this part of the molecule was studied using NMR by Schuetz et al.34 using primarily eight 13C–1H RDC couplings at positions C4 to C10. To support their RDC analysis, the authors provided additionally six 3JCH- and seven 3JHH-couplings and seven NOE distances. In their discussion, Schuetz et al.34 concluded that a is the correct configuration in the natural product, a result that was later confirmed by total synthesis by Seike et al.42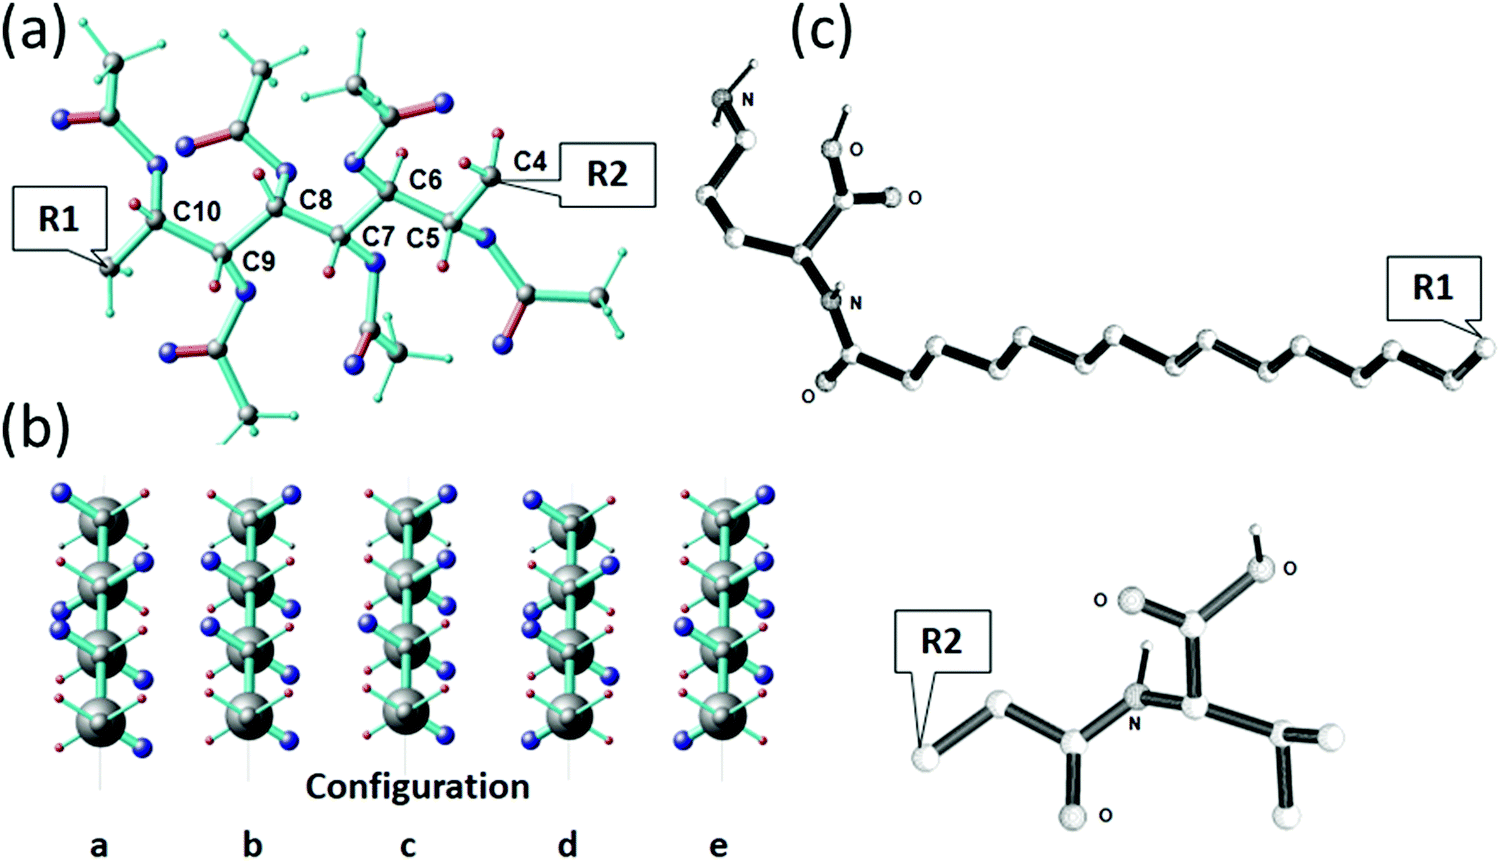 | ||
| Fig. 5 Configurations of sagittamide A. (a) The molecular model of the central part of sagittamide A in configuration a. The carbon numbering indicates positions for which NMR data were available. The bonds corresponding to the 1H–13C residual dipolar couplings are shown in red. (b) Newman projections of the central region (C4 to C11) of the 5 possible configurations a to e. The acetyl group position is shown in dark blue. The view presents the elongated chain projected along the C4–C5, C6–C7, C8–C9 and C10–C11 bonds pointing backwards (from bottom to top). (c) Elongated model representation of the unconstrained terminal groups at R1 and R2. | ||
Using all NMR data (RDC, NOE distances and 3J-couplings) provided by Schuetz et al.34 as constraints, an MDOC simulation was performed by Sternberg et al.44 Since only data from the central part of the molecule were available, no conclusions could be drawn on conformers or motion of the two chains R1 and R2 (see Fig. 5).
Fig. 5 presents the results concerning the quality n/χ2 and the χ-probability of five MDOC simulations to the NMR dataset. In Fig. 5(a), the red columns show that RDC values fulfill the requirement n/χ2 > 1 in all cases. Each of the configurations a, d and e also exhibit a single RDC outlier, which does not advance the accuracy of the assignment. If all three constraints RDC, NOE distances and 3J couplings are taken together into consideration (blue columns), a clearer tendency for configuration a emerges, offering the highest total quality n/χ2 and the lowest total number outliers (Fig. 5(a)). Still, the configurations c and d also show qualities n/χ2 > 1 and cannot be rejected based on this criterion alone.
The perspective changes from the χ-probability standpoint as revealed in Fig. 6(b). Considering the RDC χ values alone, a probability of nearly 82% is obtained for the configuration a, followed by configuration d with 13.7%. If the NOE distances are included (green columns in Fig. 6(b)), the probability for configuration a increases to 96% providing an even clearer assignment for this configuration. This score slightly improves if the 3JHH and 3JCHχ values are added (98%, blue columns in Fig. 6(b)).
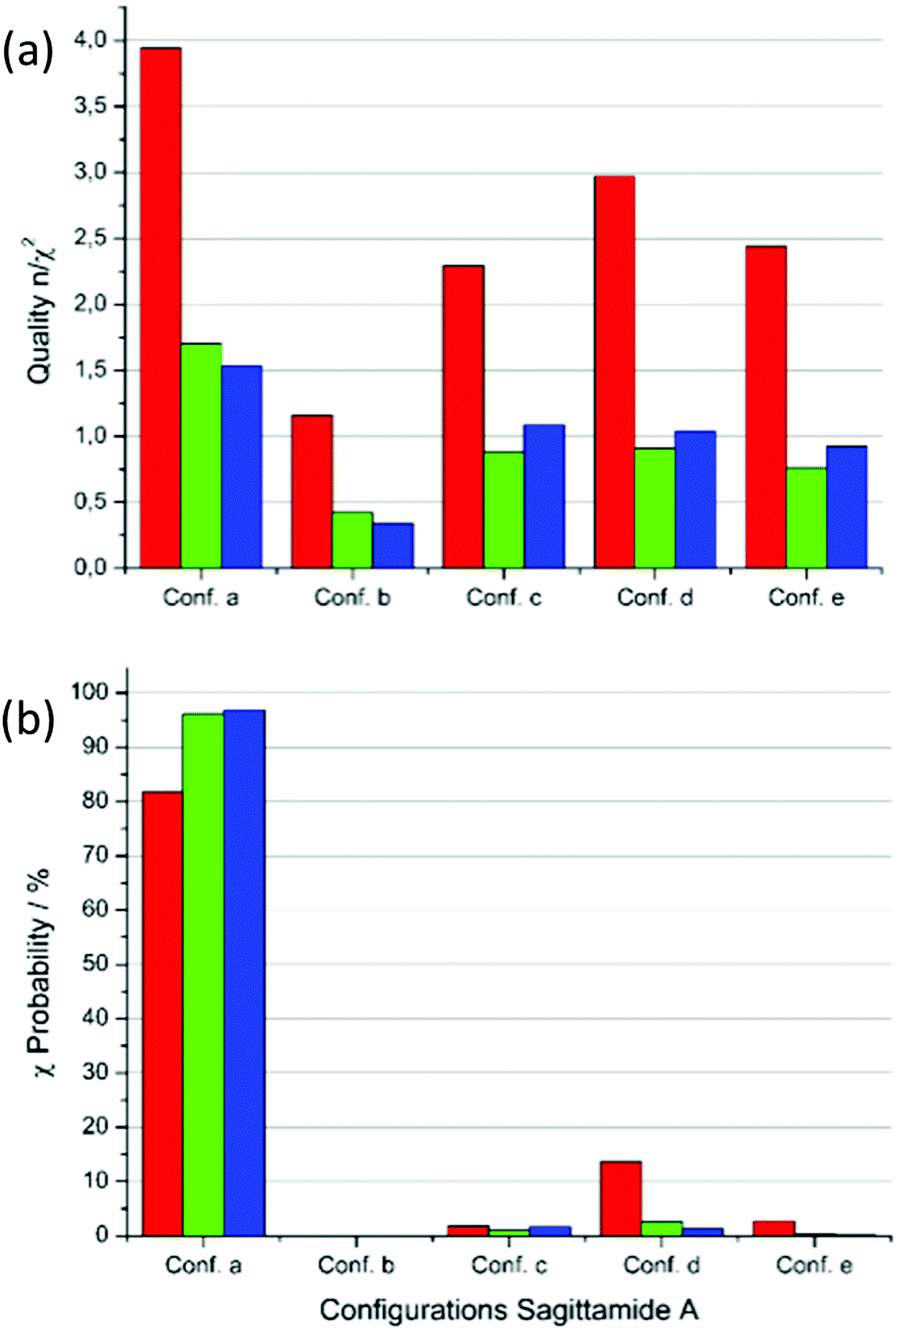 | ||
| Fig. 6 Quality n/χ2 and χ-probability for the MDOC simulations of sagittamide A configurations with the NMR dataset from Schuetz et al.34 (a) Quality n/χ2 for the five configurations a to e. Red: RDC data only, green: RDC and NOE distances and blue: RDC, NOE distances and 3J-couplings. (b) χ-probability for the configurations with the same color scheme as in (a). | ||
The highly demanding case – the linker of the triol precursor of belizentrin A
A recent synthetic campaign for the natural product belizentrin A encountered stereomeric assignment challenges.45,46 One of these was following the early construction of the triol at –positions 9–10–11 of the side chain assigned as 8S–9R–10S in the original report.47 To achieve the desired anti–anti configuration, the key precursor 3 was prepared via the Corey–Bakshi–Shibata (CBS) reduction of the enone followed by a Sharpless dihydroxylation. Though these robust stereoselective reactions should logically yield the desired configuration, its validation by classical NMR means was inconclusive and doubt persisted up to the final synthetic product, which exhibited non-negligible discrepancies in shifts and coupling pattern centered at this triol.The derivate of the belizentrin A precursor with the substituents R1, R2 and R3 as shown in Fig. 7 was investigated using NMR in solution and in oriented media. In addition to the 44 backbone NOEs, 48 NOEs involving CH2 and CH3 groups were quantitatively evaluated. From a 5 mg-sample in CDCl3 dispersed in a polysterol gel 24 CH RDCs and 8 HH RDCs of the backbone could be measured. To account for the motions of the substituents R1, R2 and R3 in MDOC simulations 27 RDC in the CH2 and CH3 groups of the substituents were analyzed. Additionally, 6 3JHH couplings were measured along the linker. RDCs provided tensorial constraints to drive whole-molecule and internal reorientations in MDOC simulations and the NOE distances and 3J couplings served as traditional scalar constraints.
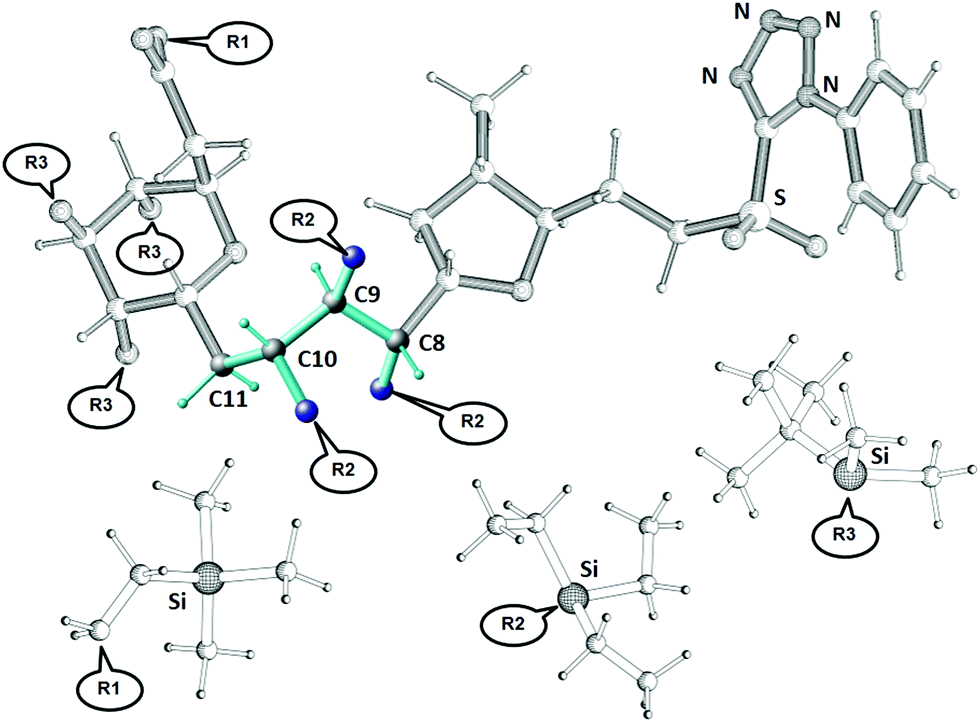 | ||
| Fig. 7 The structure of the belizentrin A precursor with R1, R2 and R3 = H. The NMR investigations in this paper were carried with protecting group substituents R1 ((trimethylsilyl)ethyl, TMS-ethyl), R2 (triethylsilyl, TES) and R3 (tert-butyldimethylsilyl, TBDMS) as displayed above (called GRX570). The linker configuration (in color) at C8, C9 and C10 could not be conclusively determined by classical NMR methods and needed additional validation. | ||
Using the modeling tools of the COSMOS Frontend 8 molecular models of the belizentrin A precursor (GRX570, see Fig. 7) were constructed with all eight possible combinations of the linker configuration C8–C9–C10. In addition, two CH2 sites at C11 and C17 were not amenable to a clear prochiral assignment and since their data (RDC, NOE, 3J) may influence the conformational outcome in the simulation, we decided to additionally include all possible prochiral combinations at each of these sites. With the eight R/S combinations of three linker atoms C8, C9 and C10 and the two prochiral assignments at C11 and C17, a final number of 32 MDOC simulations were necessary. Since these simulations are independent, they could be run in parallel.
Preliminary 10ns-MDOC simulations of the RRR linker configuration are performed to adjust the pseudo-force strengths and other simulation parameters (see ESI†). Then 20-ns MDOC simulations of all 32 possibilities are performed including all RDC tensors as orientational constraints as well as the NOE and 3JHH as internuclear distance and torsional constraints. These initial MDOC simulations revealed the following issues: (i) no agreeable RDC results (n/χ2 > 1) could be obtained giving a maximum n/χ2 of 0.72 for all 32 simulations and (ii) the quality of the linker was even worse giving a maximum n/χ2 of 0.33. The large RDC outliers of the glucopyranose 6-ring and especially of the linker carbons indicated that the motion of these molecular parts could not be adequately described in these 20 ns MDOC simulations. The molecular models reveal that the silylated side chains R1, R2 and R3 are entangled, and their interactions represent barriers for conformational changes of the linker and the glucopyranose ring. The reorientation of the crowded side chains consumes many MD steps and impedes conformational changes of the molecular backbone.
As in the sagittamide A example, we decided to concentrate our efforts on the description of the linker and performing the MDOC simulations only with constraints connected to this part of the molecule with the carbon atoms C8 to C11 and the three R2 side chains (see Fig. 7). The 20 ns MDOC simulations are performed with the same parameters as those used in the former cases (see supplementary information) and included 34 RDC values, 84 NOE distances and 6 3JHH-couplings as constraints. Because the linker contained only the C11 carbon atom with prochiral hydrogen atoms, the total number of simulations reduced to 16.
The statistical results of the 16 simulations are displayed in Fig. 8. The quality n/χ2 (Fig. 8(a)) for the RDC simulations (red columns) reaches in all cases values larger than 4.5 and, in all cases, at least one outlier was observed. The inclusion of NOE distances and J-couplings not only reduces the level of overall quality, but also evens out the outcome (4.0 < n/χ2 < 7.8 for all 16 cases). Clearly, in complex cases with a large dataset combined with large potential flexibility, the weight of key defining constraints is washed out by a large majority constraint that can easily be fulfilled within the simulation.
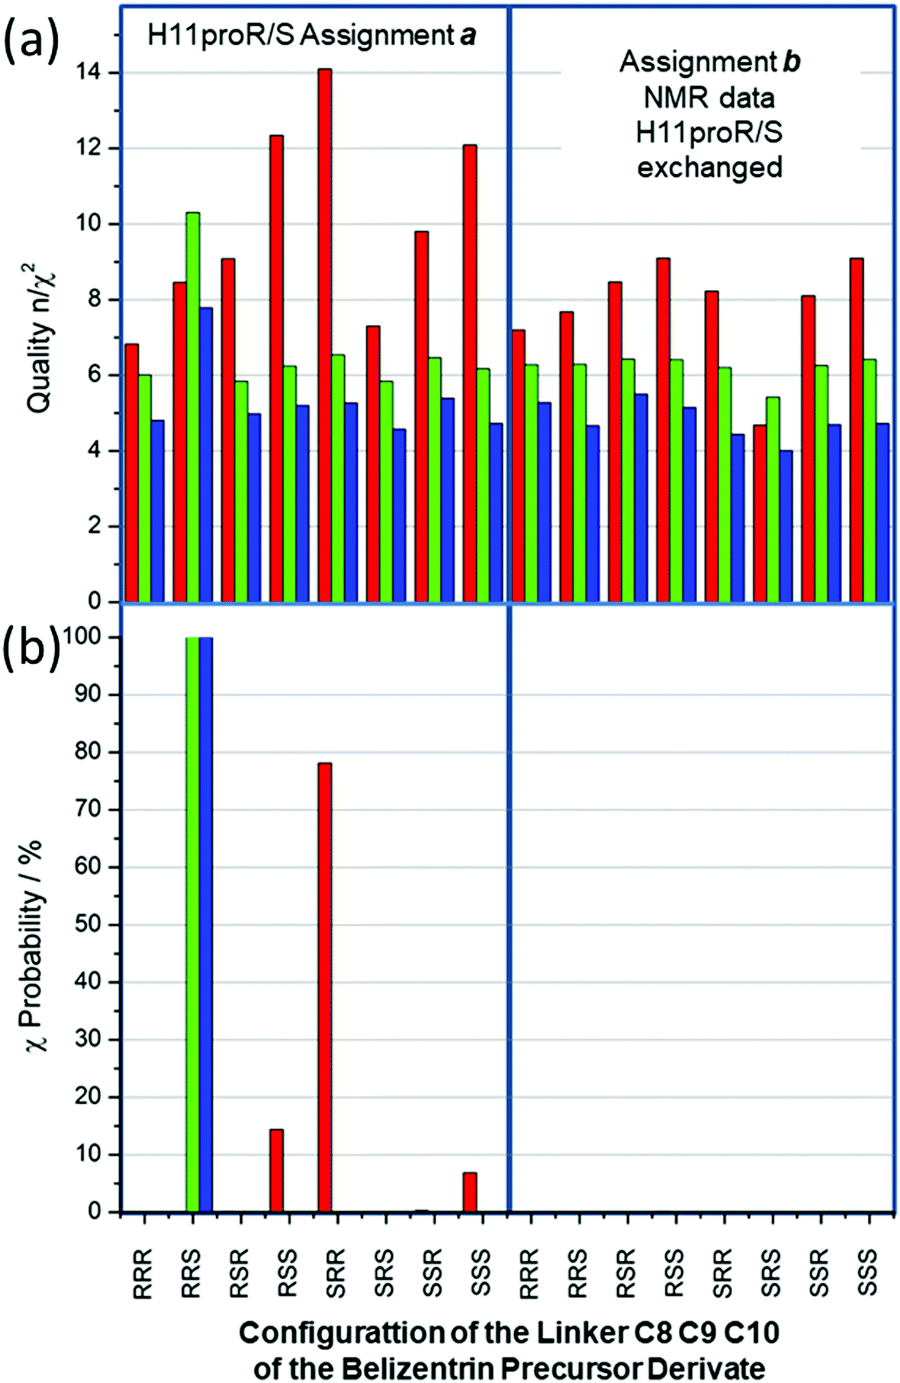 | ||
| Fig. 8 Quality and χ-probability of the belizentrin A precursor derivate. (a) Quality n/χ2 for 16 MDOC simulations of all stereochemical combination at the chiral centers C8–C9–C10 as well as the prochiral centers C11 (stereotopic assignments of methylene 1H, “a” and “b”). The columns represent the overall quality values of the RDC (red), the RDC + NOE distances (green) and the RDC + NOE distances + 3JHH-couplings (blue). (b) The χ-probability of the RDC values (red), the χ-probability of the RDC + NOE distances (green) and the χ-probability of the RDC + NOE distances + 3JHH-couplings (blue). | ||
Fig. 8(b) displays the χ-probability according to eqn (7) for the same subset combinations: red columns for RDC values, green columns RDC + NOE distances and finally blue ones for adding 3JHH-couplings to the former two data types. Strikingly, the RDC dataset alone (red columns) exhibits strong preference for the incorrect SRR configuration with a χ-probability of 78%; the next best configurations RSS and SSS, χ-probability values of 14% and 6% (all data are given in the supplementary information), are equally incorrect. However, the addition of NOE distances (84) and of 3JHH-coupling (6) constraints is the key to the assignment success; indeed, the χ-probabilities for the combined datasets reach almost 100% for the correct RRS configuration (Fig. 8(b), green and blue). It should be noted here that “a” assignment of the C11 prochiral methylene 1H is supported by all three NMR data subset: the χ-probability for the alternative assignment “b” is in all cases smaller than one.
In the case of mandelalide (see Fig. 4) the χ-probability calculated only from RDC values gave a wrong sequence for the preferred configuration but in the present case of the belizentrin A precursor the χ-probability calculated from RDC values for the preferred RRS configuration was far below 1% (see ESI†). In both cases the addition of NOE distances changed the picture and produced high probabilities for the right structures. This could be explained by the fact that the chiral centers in the linker are weekly coupled by C–C single bonds with large rotational freedom. As already stated in the methods section measured 1H–13C couplings describe only the directions of isolated CH bonds and not the relations to neighbor carbons. For the determination of its relative configuration, additional interactions between the chiral centers are necessary, and this requirement seems to be crucially mediated by long-range constraints like NOE distances or 3J couplings.
Conclusions
In this paper, a new statistical measure for the success in simulating molecular NMR data was introduced. This new measure, the χ-probability, is used – in addition to the n/χ2 criterion – to differentiate between molecular structures, configurations or data assignments. There is a principal difference between the quality criterion (n/χ2) and the χ-probability eqn (7): the first criterion represents an absolute measure for the validity of the calculated NMR data and provides a comparison between different experiments, data sets or configurations. The χ-probability, on the other hand, uses the unitless parameter |χ| applicable to any combination of experimental structural data and provides a probability that an NMR dataset fits to a molecular model from a finite set of possible structures. These two parameters provide complementary pictures and so a two-step process is proposed: in the first step n/χ2 is used to decide whether at least one of several simulations produced a valid result with n/χ2 > 1 and in a second step the χ-probability is used to select the right configuration or assignment between several simulations.The new criterion was tested on four examples with increasing complexity. In the first and simplest case we obtain a χ-probability of 99.99% for the right configuration calculated only from the RDC values. In more complex cases, it is recommended to calculate the joined χ-probability from the RDC values and NOE distances to obtain a conclusive answer. If a larger number of 3J couplings are available these values can be used to support the results obtained with the RDC and NOE distances; this was done in the case of third example sagittamide A. The 3J couplings are clearly the weakest aid to the χ-probability mainly because their calculation introduces additional uncertainty to the experiment.
In this paper the χ-probability was exclusively used in connection to NMR data simulations using MDOC. This does not mean that the method can only be used in connection with MDOC simulations but can be used in many other methods of NMR data predictions as well. Equipped with the χ-probability NMR data simulations attain an excellent fidelity in discriminating chiral configurations or elucidating assignments or structural differences.
Data availability
Program implementation: TheCOSMOS-NMR force field and the routines for MDOC simulations are implemented in the COSMOS-Frontend program that provides a graphical user interface (GUI) for MS Windows. The computational COSMOS routines for MS Windows and Linux operating systems (COSMOS-Backend) are freely available from the authors (please address requests to U. Sternberg, ulrich.sternberg@cosmos-software.de).This includes also Mathematica notebooks for the χ-probability and other tools for the analysis of MDOC trajectories.Conflicts of interest
There are no conflicts of interest to declare.Acknowledgements
We thank Thomas Gloge at Karlsruhe Institute of Technology (KIT) for supporting the MDOC simulations and providing tools for data analysis. U.S. thanks the support from KIT and its computational resource bwUniCluster funded by the Ministry of Science, Research and Arts and the universities of the State of Baden-Württemberg, Germany. C. F. acknowledges the MPI für Kohlenforschung for funding and support and especially its NMR department for NMR measurements and discussions.References
- T. F. Molinski, Curr. Opin. Biotechnol, 2010, 21, 819–826 CrossRef CAS PubMed.
- T. F. Molinski, Nat. Prod. Rep., 2010, 27, 321–329 RSC.
- A. J. Williams, G. E. Martin and D. Rovnyak, Modern NMR approaches to the structure elucidation of natural products, Royal Society of Chemistry, Cambridge, UK, 2016 Search PubMed.
- K. C. Nicolaou and S. A. Snyder, Angew. Chem., Int. Ed., 2005, 44, 1012–1044 CrossRef CAS PubMed.
- M. E. Maier, Nat. Prod. Rep., 2009, 26, 1105–1124 RSC.
- Z. C. Meng, S. M. Spohr, S. Tobegen, C. Fares and A. Furstner, J. Am. Chem. Soc., 2021, 143, 14402–14414 CrossRef CAS PubMed.
- A. Navarro-Vazquez, J. Nat. Prod., 2021, 84, 2043–2047 CrossRef CAS PubMed.
- V. Schmidts, Magn. Reson. Chem., 2017, 55, 54–60 CrossRef CAS PubMed.
- F. Hallwass, M. Schmidt, H. Sun, A. Mazur, G. Kummerlowe, B. Luy, A. Navarro-Vazquez, C. Griesinger and U. M. Reinscheid, Angew. Chem. Int. Ed., 2011, 50, 9487–9490 CrossRef CAS PubMed.
- G. L. Stoychev, A. A. Auer, R. Izsak and F. Neese, J. Chem. Theory Comput., 2018, 14, 619–637 CrossRef CAS PubMed.
- G. L. Stoychev, A. A. Auer and F. Neese, J. Chem. Theory Comput., 2018, 14, 4756–4771 CrossRef CAS PubMed.
- A. M. Teale, O. B. Lutnaes, T. Helgaker, D. J. Tozer and J. Gauss, J. Chem. Phys., 2013, 138 Search PubMed.
- D. Flaig, M. Maurer, M. Hanni, K. Braunger, L. Kick, M. Thubauville and C. Ochsenfeld, J. Chem. Theory Comput., 2014, 10, 572–578 CrossRef CAS PubMed.
- M. Zweckstetter and A. Bax, J. Am. Chem. Soc., 2000, 122, 3791–3792 CrossRef CAS.
- A. Navarro-Vazquez, Magn. Reson. Chem., 2012, 50, S73–S79 CrossRef CAS.
- U. Sternberg and R. Witter, J. Biomol. NMR, 2015, 63, 265–274 CrossRef CAS PubMed.
- U. Sternberg, R. Witter and A. S. Ulrich, J. Biomol. NMR, 2007, 38, 23–39 CrossRef CAS PubMed.
- G. Cornilescu, J. L. Marquardt, M. Ottiger and A. Bax, J. Am. Chem. Soc., 1998, 120, 6836–6837 CrossRef CAS.
- D. Intelmann, G. Kummerlowe, G. Haseleu, N. Desmer, K. Schulze, R. Frohlich, O. Frank, B. Luy and T. Hofmann, Chem. – Eur. J., 2009, 15, 13047–13058 CrossRef CAS.
- E. Troche-Pesqueira, C. Anklin, R. R. Gil and A. Navarro-Vazquez, Angew. Chem., Int. Ed., 2017, 56, 3660–3664 CrossRef CAS PubMed.
- A. Navarro-Vazquez, R. R. Gil and K. Blinov, J. Nat. Prod., 2018, 81, 203–210 CrossRef CAS PubMed.
- Y. Z. Liu, A. Navarro-Vazquez, R. R. Gil, C. Griesinger, G. E. Martin and R. T. Williamson, Nat. Protoc., 2019, 14, 217–247 CrossRef CAS PubMed.
- M. R. M. Koos, A. Navarro-Vazquez, C. Anklin and R. R. Gil, Angew. Chem., Int. Ed., 2020, 59, 3938–3941 CrossRef CAS.
- A. Navarro-Vazquez, Magn. Reson. Chem., 2020, 58, 139–144 CrossRef CAS PubMed.
- H. Akaike, IEEE Trans. Autom. Control, 1974, Ac19, 716–723 CrossRef.
- P. Tzvetkova, U. Sternberg, T. Gloge, A. Navarro Vazquez and B. Luy, Chem. Sci., 2019, 10, 8774–8791 RSC.
- S. G. Smith and J. M. Goodman, J. Am. Chem. Soc., 2010, 132, 12946–12959 CrossRef CAS PubMed.
- J. M. Goodman, S. G. Smith and S. C. H. Yuen, Abstr. Pap. Am. Chem. Soc., 2011, 242 Search PubMed.
- N. Grimblat, J. A. Gavin, A. H. Daranas and A. M. Sarotti, Org. Lett., 2019, 21, 4003–4007 CrossRef CAS PubMed.
- M. M. Zanardi and A. M. Sarotti, J. Org. Chem., 2021, 86, 8544–8548 CrossRef CAS PubMed.
- I. Jakovkin, U. Sternberg and A. S. Ulrich, Recent Adv. Biol. Biomed. Ser., 2010, 273–276 CAS.
- M. E. Di Pietro, U. Sternberg and B. Luy, J. Phys. Chem. B, 2019, 123(40), 8480–8491 CrossRef CAS PubMed.
- A. Kolmer, L. J. Edwards, I. Kuprov and C. M. Thiele, J. Magn. Reson., 2015, 261, 101–109 CrossRef CAS PubMed.
- C. Farès, J. B. Lingnau, C. Wirtz and U. Sternberg, Molecules, 2019, 24(23), 4417 CrossRef PubMed.
- B. Vogeli, Prog. Nucl. Magn. Reson. Spectrosc., 2014, 78, 1–46 CrossRef CAS.
- C. Hoeck, PhD, Technical University of Denmark, 2016.
- C. A. G. Haasnoot, F. A. A. M. Deleeuw and C. Altona, Tetrahedron, 1980, 36, 2783–2792 CrossRef CAS.
- G. Palermo, R. Riccio and G. Bifulco, J. Org. Chem., 2010, 75, 1982–1991 CrossRef CAS.
- S. L. Huang, L. Kotzner, C. K. De and B. List, J. Am. Chem. Soc., 2015, 137, 3446–3449 CrossRef CAS PubMed.
- J. Willwacher and A. Furstner, Angew. Chem., Int. Ed., 2014, 53, 4217–4221 CrossRef CAS PubMed.
- J. Willwacher, B. Heggen, C. Wirtz, W. Thiel and A. Furstner, Chem. – Eur. J., 2015, 21, 10416–10430 CrossRef CAS.
- H. Seike, I. Ghosh and Y. Kishi, Org. Lett., 2006, 8, 3865–3868 CrossRef CAS.
- A. Schuetz, J. Junker, A. Leonov, O. F. Lange, T. F. Molinski and C. Griesinger, J. Am. Chem. Soc., 2007, 129, 15114–15115 CrossRef CAS PubMed.
- U. Sternberg, P. Tzvetkova and C. Muhle-Goll, Phys. Chem. Chem. Phys., 2020, 22, 17375–17384 RSC.
- F. Anderl, S. Grössl, C. Wirtz and A. Fürstner, Angew. Chem., Int. Ed., 2018, 57, 10712–10717 CrossRef CAS PubMed.
- S. Grössl, PhD Dissertation, Technische Universität Dortmund, 2018.
- H. J. Dominguez, J. G. Napolitano, M. T. Fernandez-Sanchez, D. Cabrera-Garcia, A. Novelli, M. Norte, J. J. Fernandez and A. H. Daranas, Org. Lett., 2014, 16, 4546–4549 CrossRef CAS PubMed.
Footnote |
| † Electronic supplementary information (ESI) available. See DOI: 10.1039/d2cp00330a |
| This journal is © the Owner Societies 2022 |