
 Open Access Article
 This Open Access Article is licensed under a
 Creative Commons Attribution 3.0 Unported Licence
Property–activity relations of multifunctional reactive ensembles in cation-exchanged zeolites: a case study of methane activation on Zn2+-modified zeolite BEA†
Alexander A.
Kolganov
 a,
Anton A.
Gabrienko
a,
Ivan Yu.
Chernyshov
b,
Alexander G.
Stepanov
a and
Evgeny A.
Pidko
*cd
a,
Anton A.
Gabrienko
a,
Ivan Yu.
Chernyshov
b,
Alexander G.
Stepanov
a and
Evgeny A.
Pidko
*cd
aBoreskov Institute of Catalysis, Siberian Branch of the Russian Academy of Sciences, Prospekt Akademika Lavrentieva 5, Novosibirsk 630090, Russia
bTheoMAT Group, ChemBio Cluster, ITMO University, Lomonosova Street 9, Saint Petersburg, 191002, Russia
cInorganic Systems Engineering group, Department of Chemical Engineering, Faculty of Applied Sciences, Delft University of Technology, Van der Maasweg 9, Delft 2629 HZ, The Netherlands. E-mail: e.a.pidko@tudelft.nl
dTsyfroCatLab Group, University of Tyumen, Volodarskogo St. 6, Tyumen 625003, Russia
First published on 7th March 2022
Abstract
The reactivity theories and characterization studies for metal-containing zeolites are often focused on probing the metal sites. We present a detailed computational study of the reactivity of Zn-modified BEA zeolite towards C–H bond activation of the methane molecule as a model system that highlights the importance of representing the active site as the whole reactive ensemble integrating the extra-framework ZnEF2+ cations, framework oxygens (OF2−), and the confined space of the zeolite pores. We demonstrate that for our model system the relationship between the Lewis acidity, defined by the probe molecule adsorption energy, and the activation energy for methane C–H bond cleavage performs with a determination coefficient R2 = 0.55. This suggests that the acid properties of the localized extra-framework cations can be used only for a rough assessment of the reactivity of the cations in the metal-containing zeolites. In turn, studying the relationship between the activation energy and pyrrole adsorption energy revealed a correlation, with R2 = 0.80. This observation was accounted for by the similarity between the local geometries of the pyrrole adsorption complexes and the transition states for methane C–H bond cleavage. The inclusion of a simple descriptor for zeolite local confinement allows transferability of the obtained property–activity relations to other zeolite topologies. Our results demonstrate that the representation of the metal cationic species as a synergistically cooperating active site ensembles allows reliable detection of the relationship between the acid properties and reactivity of the metal cation in zeolite materials.
1. Introduction
Transition metal-containing zeolites are promising materials for a wide range of industrial and lab-scale catalytic applications.1 The catalytic reactivity of the metal-containing zeolites could be described by the synergistic action of both extra-framework (EF) metal cation and framework oxygen atom forming an MEFn+⋯OF2− Lewis acid–base pair.2 For instance, extra-framework Zn2+ cations confined in zeolite micropores could form highly reactive sterically hindered ZnEF2+···OF2− (EF = extra-framework, F = framework) Lewis acid–base pairs (FLPs) (Fig. 1a), capable of activating aliphatic C–H bonds.3 An FLP is a chemical entity containing a combination of a sterically encumbered Lewis acid and a Lewis base.4 Chemical systems of this type have been receiving a lot of attention in the homogeneous catalysis and molecular chemistry communities in the last decade since the pioneering work by Stephan and co-workers.4,5 The FLP concept is also applicable to heterogeneous catalysts, such as zeolites modified with zinc ions due to the possibility of creation of the sites with undercoordinated ZnEF2+ cations leading to excess charges on separated ZnEF2+ and OF2− sites (Fig. 1a).3 In molecular chemistry, the rules for the design and modification of molecular scaffolds to tune the reactivity of FLPs have been established.6–8 However, they are much less apparent in the more complex heterogeneous systems.9–11 Because of the high variety of possible structures, locations, and local geometrical environments of the active sites in zeolite-based systems, the construction of universal property–reactivity relationships in the confined space is particularly challenging.12–15 Even relatively straightforward relations between the acidity and reactivity of Brønsted acidic zeolites are not transferrable from one zeolite topology to another.16 Understanding how the nature and local zeolite environment of a ZnEF2+⋯OF2− site influence its reactivity towards methane activation is key to developing strategies for the rational design of zeolite-based catalysts for light alkane valorization.15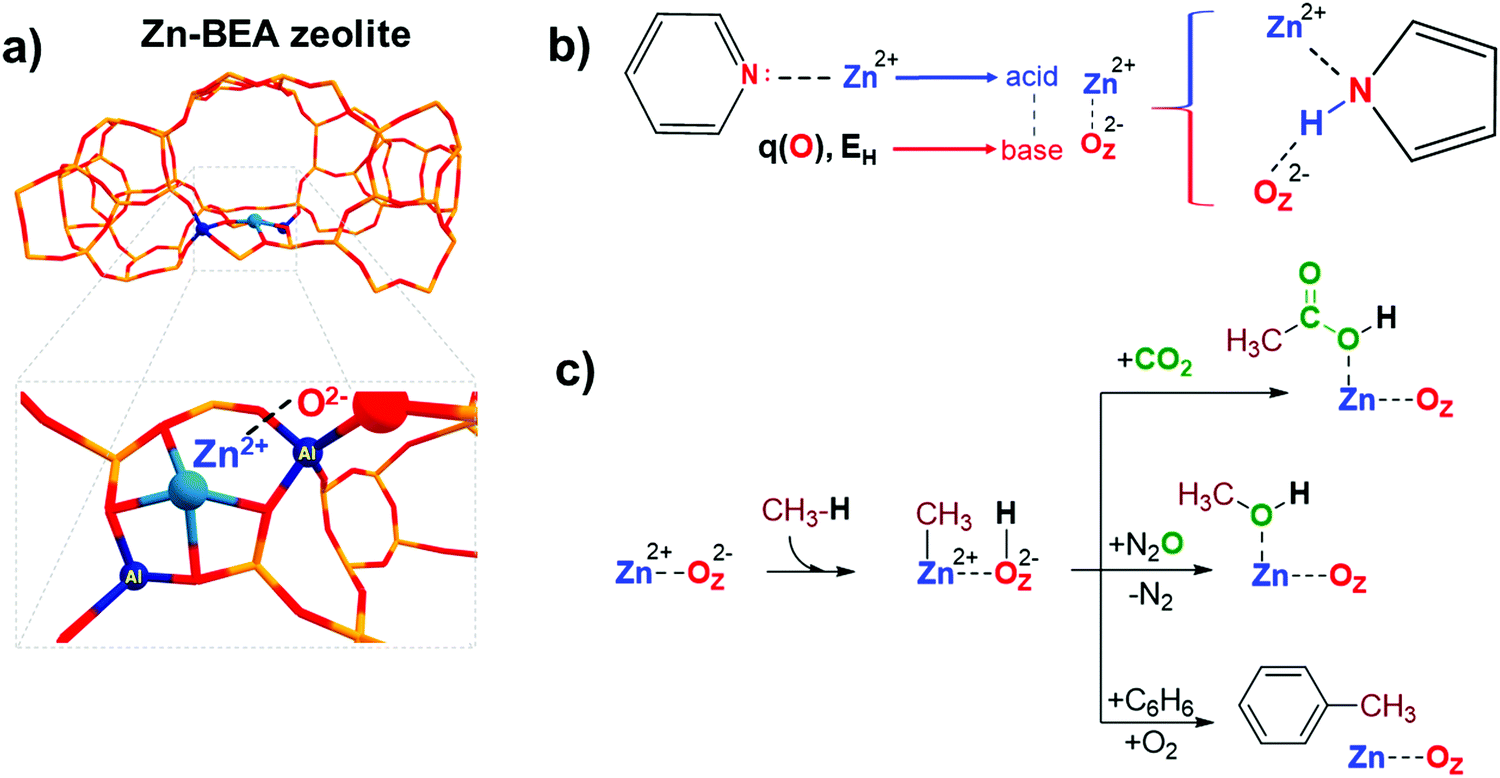 | ||
| Fig. 1 Structure of the ZnEF2+⋯OF2− active site in the BEA zeolite framework (a). A schematic representation of the ZnEF2+⋯OF2− Lewis acid–base pair reactivity descriptors (b). Possible pathways of the methane catalytic valorization for Zn-containing zeolites (c). q(O) and EH denote the charge on the oxygen atom and proton affinity, respectively. | ||
It is generally accepted that the Lewis acidity of the Zn2+ cations in the zeolite is the key driving force behind light alkane activation.17–19 In theoretical studies, the qualitative relationships between the partial charge on the Zn2+ cation and Zn-zeolite activity have been discussed.3,14,19 The acidity of the exchangeable cations can be assessed by the indirect response from experiments, e.g., by measuring the adsorption energy or the change in the spectral characteristics of basic adsorption probe molecules interacting with Mn+ cations.20–23
However, commonly used probes of a basic nature, such as CO or pyridine, are poor probes of the chemistry of the reactive environment and the adjacent basic sites represented by the MEFn+⋯OF2− Lewis acid–base pair reactive ensembles. Adding an extra descriptor for the basicity of the adjacent oxygen atom could be very useful for constructing the property–activity relationships.
The basicity of zeolite framework oxygen atoms can be characterized by adsorption of probe molecules,24 such as CO2,25 CH3OH,26–28 N2O4,29 propyne,30 and pyrrole.31,32 However, the interpretation of the resulting data and the quantification of the framework basicity in the real catalysts is much more challenging.26 The major complication arises from the fact that most of the molecular probes interact with both the metal site and the conjugated lattice basic oxygen atoms upon adsorption.26 For instance, pyrrole forms hydrogen bonds between its N–H group and the basic site on the framework, simultaneously interacting by the π-electron system with the conjugated Lewis-acidic ZnEF2+ site.
Electronic structure calculations provide an opportunity to investigate directly the fundamental properties of oxygen atoms by computing and analyzing the parameters of net atomic charges or proton affinity in various environments (Fig. 1b). On the other hand, if the reactivity is a function of the components of the entire reactive ensemble and the adsorbed molecules can probe all the components of the ensemble, we can anticipate a correlation between the parameters of the adsorption complexes of the probe molecules and the reactivity of the MEFn+⋯OF2− sites. Indeed, Sun et al. obtained good correlations between the adsorption enthalpy of CO2 and the activation barrier of heterolytic methane C–H bond dissociation on various La2O3 clusters using electronic structure calculations at the CCSD(T) level of theory.33 In this regard, it is of interest to compare the correlations between the key reactivity descriptors and the characteristics of probe molecules interacting simultaneously with MEFn+ and OF2− sites, compared to the probe molecules interacting solely with the metal cation Lewis sites.
Methane is an abundant and readily accessible feedstock34 for the production of various valuable liquid chemicals, such as oxygenated35–42 or aromatic compounds.43–47 Zn-Modified zeolites are promising catalysts for the activation and conversion of light alkanes.48–52 These materials feature highly reactive ZnEF2+⋯OF2− Lewis acid–base pairs that enable heterolytic cleavage of C–H bonds in alkanes to produce a Zn-alkyl intermediate and an adjacent Brønsted acid site under mild conditions.17,46,53–56 Such reactivity was first observed by Kazansky et al. with DRIFTS spectroscopy57 and was confirmed later with 13C MAS NMR spectroscopy.46,54,55,58,59 Room-temperature methane activation by Zn-containing zeolites has been experimentally observed.54,60,61 The reaction of the zeolite-stabilized Zn-methyl intermediates with such reactants as O2,52,61 CO2,56,62 propane (benzene),46,58 and N2O3 opens pathways for methane valorization to industrially relevant and highly valuable chemicals (Fig. 1c). Understanding the fundamental factors that control the reactivity and catalytic behavior of metal-containing zeolites is critical for their further optimization and the development of new zeolite-based catalysts.
In this work, we computationally analyze the correlations between the kinetic and thermodynamic parameters of different ZnEF2+⋯OF2− reactive ensembles in a Zn-BEA zeolite framework with the parameters (such as the shift of the infrared bands and adsorption energies) of adsorption complexes with representative molecular probes. We focus specifically here on Zn-BEA, whose reactivity towards light alkane activation was earlier investigated by some of us in a series of experimental solid-state NMR studies.48,49,51 We report a periodic DFT study on the property–reactivity relationships for methane activation by the ZnEF2+⋯OF2− Lewis acid–base pairs localized in between the different T-positions of the zeolite BEA framework.
2. Computational details
Models
Calculations were carried out using the full periodic BEA zeolite unit cell with lattice parameters of a = b = 12.61 Å, c = 26.32 Å, α = β = γ = 90° as optimized by DFT with an all-silica BEA polymorph A periodic model was used for the periodic DFT calculations.63 The optimized values are close to the experimental values of a = b = 12.63 Å and c = 26.19 Å. To compensate for the positive charge of the extra-framework Zn2+ cation, two framework Si atoms in the BEA unit cell were substituted by two aluminum atoms, resulting in a lattice Si/Al ratio of 31. The optimized local geometries for all configurations of the reactive ensembles considered in this study are summarized in Fig. S1 in the ESI.† The BEA lattice contains 9 inequivalent T sites, thus creating a great diversity of Al atom locations and therefore possible types of Zn2+ cations (Fig. S1, ESI†). In this study, 11 types of Zn2+ cations were considered (Fig. S1, ESI†). However, because of the highly symmetrical structure of the BEA framework, one pair of T-atoms may be present in different cation sites, providing distinctly different coordination environments to Zn2+ ions. To avoid ambiguity, we explicitly note that pairs “T2T6”–“T6T2” and “T2T3”–“T3T2” belong to different structures. The respective optimized periodic structures and their relative stabilities are summarized in Fig. S1 (ESI†), and the optimized coordinates are provided as supplementary material. The relative stabilities (ΔEZn-BEA) are defined as the energy difference between the given model and the most stable configuration (T6T6).Vibrational frequencies were calculated using the finite differences method (0.02 Å atom displacement applied to extra-framework atoms only) as implemented in VASP. To correct for the systematic errors in the computed IR frequencies, the respective values were scaled by νexp/νcalc, where νexp and νcalc correspond to the experimentally obtained and calculated frequencies of the gas-phase probe molecule, respectively. The scaling coefficients are listed in Table S1 (ESI†).
In brief, the bond order of an atom pair A and j is described as:
| BA,j = CEA,j + ΛA,j, | (1) |
The term CEA,j describes the electron exchange between atoms A and j in a material:
 | (2) |
![[small rho, Greek, vector]](https://www.rsc.org/images/entities/i_char_e137.gif) avgj is the average spherical electron density of atom j as a function of the atomic electron distribution and atomic spin magnetization density obtained through DDEC6-based partitioning of the electron density. The terms in the denominator belong to the sum of all
avgj is the average spherical electron density of atom j as a function of the atomic electron distribution and atomic spin magnetization density obtained through DDEC6-based partitioning of the electron density. The terms in the denominator belong to the sum of all  found in the material. The second term in eqn (1) is the dressed exchange hole delocalization term defined in eqn (3). This equation deals with the dressed exchange hole, which is an adjusted exchange hole (either more contracted or more diffuse) exchange hole to obtain more accurate bond orders.
| ΛA,j = χcoord.nr.A,jχpairwiseA,jχcon.A,j ≤ CEA,j, | (3) |
3. Results and discussion
3.1. Methane activation on different ZnEF2+⋯OF2− sites
To analyze the structure–activity factors driving the heterolytic dissociation of the C–H bond in methane, several distinct active site configurations formed by the Zn2+ cations stabilized at different sites of the BEA framework were considered (Fig. S1, ESI†).In general, the most efficient stabilization to Zn2+ cations is provided by the six-membered ring (T6T6, T6T8, T8T8) sites featuring a highly symmetrical square-planar coordination environment. The smaller five-membered ring sites feature tridentate coordination of the exchange Zn2+ cations and show on average longer Zn–O distances, giving rise to generally less stable configurations. The T2T3 model represents a charge-alternating site, in which the Zn2+ cation is directly interacting with only one lattice [AlO2]− anion, while the overall charge-neutrality is provided via an indirect charge-compensation by a distantly placed second lattice Al. Previous studies proposed such sites to be uniquely reactive towards light alkane activation.19,80
The highly constrained coordination environment of the four-membered ring sites in the T3T2 model gives rise to the least stable Zn2+ configurations. For ZnEF2+ cations, we consider two vicinal lattice oxygen atoms to form the reactive ZnEF2+⋯OF2− acid–base pairs (denoted as O1 or O2). The diverging reactivity of the resulting sites towards C–H activation is expected given the varied relative orientations of the respective Lewis acidic and proton-accepting base-sites.3 In this study, the reactivity of ZnEF2+⋯OF2− is probed by the intrinsic activation barrier of C–H activation.
A representative energy profile for methane activation by a ZnEF2+⋯OF2− Lewis acid–base pair along with the respective intermediates and transition state structures is shown in Fig. 2. The figure also defines the adsorption energies (ΔEads), the intrinsic (ΔE‡int), apparent (ΔE‡int) activation barriers, and the reaction energies (ΔEr).
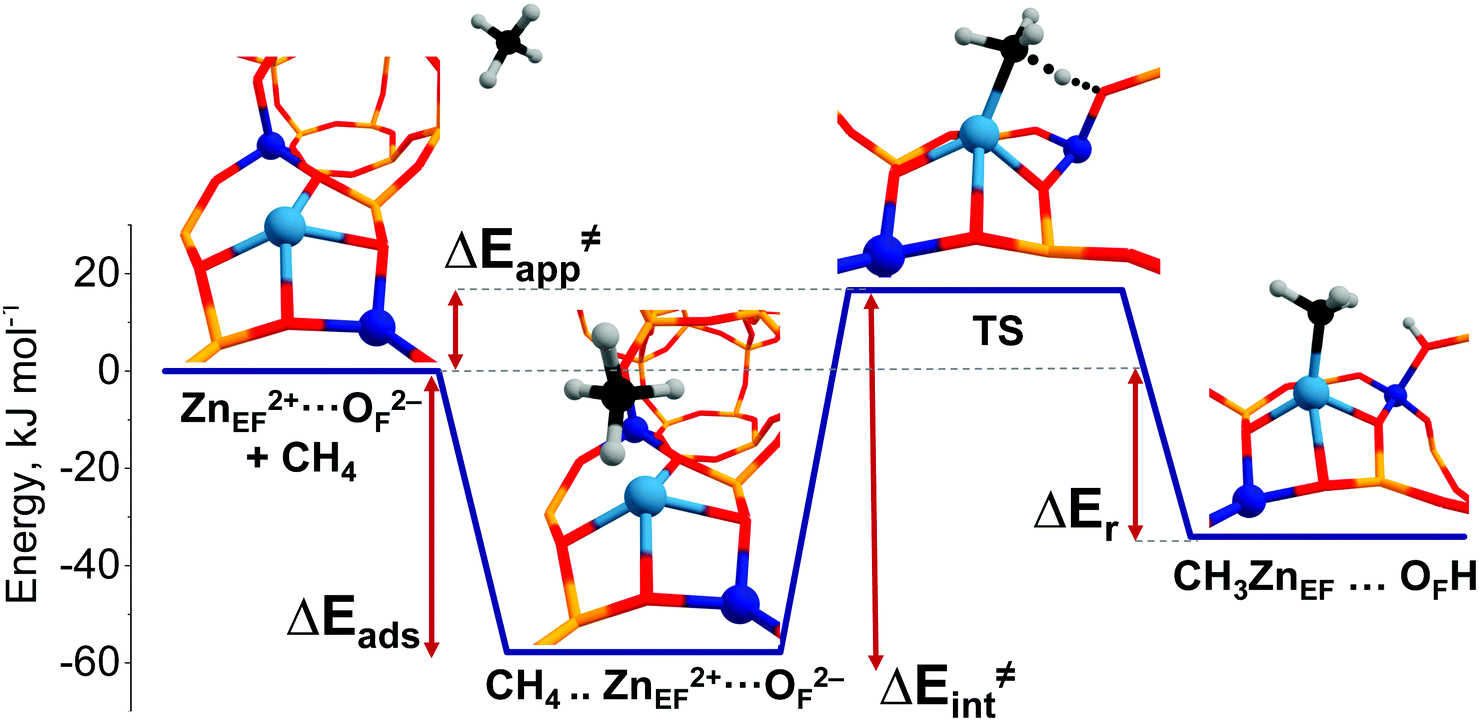 | ||
| Fig. 2 Energy profile for methane activation on a T4T7O1 ZnEF2+⋯OF2− FLP. | ||
The reference state (set as 0 kJ mol−1) denoted as “ZnEF2+⋯OF2− + CH4” is defined as the separate methane molecule and Zn-BEA. The adsorption complex of methane (ZnEF2+⋯OF2−⋯CH4) is formed by methane σ-orbital donation to the 4s orbital of Zn2+.3,81 Such an interaction polarizes and activates the adsorbed molecule and gives rise to the increased ∠H–C–H angles and C–H distances. Such perturbations of the adsorbed methane have been evidenced by infrared spectroscopy.48,53 The polarization of the C–H bond facilitates its heterolytic dissociation by the ZnEF2+⋯OF2− pair, resulting in a Zn–CH3 species and an adjacent Brønsted acid site (Si–O(H)–Al group).
Computed reaction energy diagrams for methane C–H bond cleavage over the selected Zn-BEA configurations are presented in Fig. 3. The figure provides selected results for the representative extra-framework site configurations, illustrating the pronounced variation in the kinetic and thermodynamics of methane activation by different ZnEF2+⋯OF2− active sites. The complete dataset for all reactive configurations considered in this study is summarized in Table S2 and Fig. S3–S5 of the ESI.† Computations reveal large variations in the activation barriers (ΔE‡int = 45–131 kJ mol−1) and reaction energies (ΔEr = 62 to −89 kJ mol−1) depending on the type of the Zn2+ site. We find that ΔEr correlates well with the relative stability of the Zn-BEA framework model (determination coefficient R2 = 0.93), whereas a much worse correlation is observed with ΔE‡int (R2 = 0.71) (Fig. S6a, ESI†).
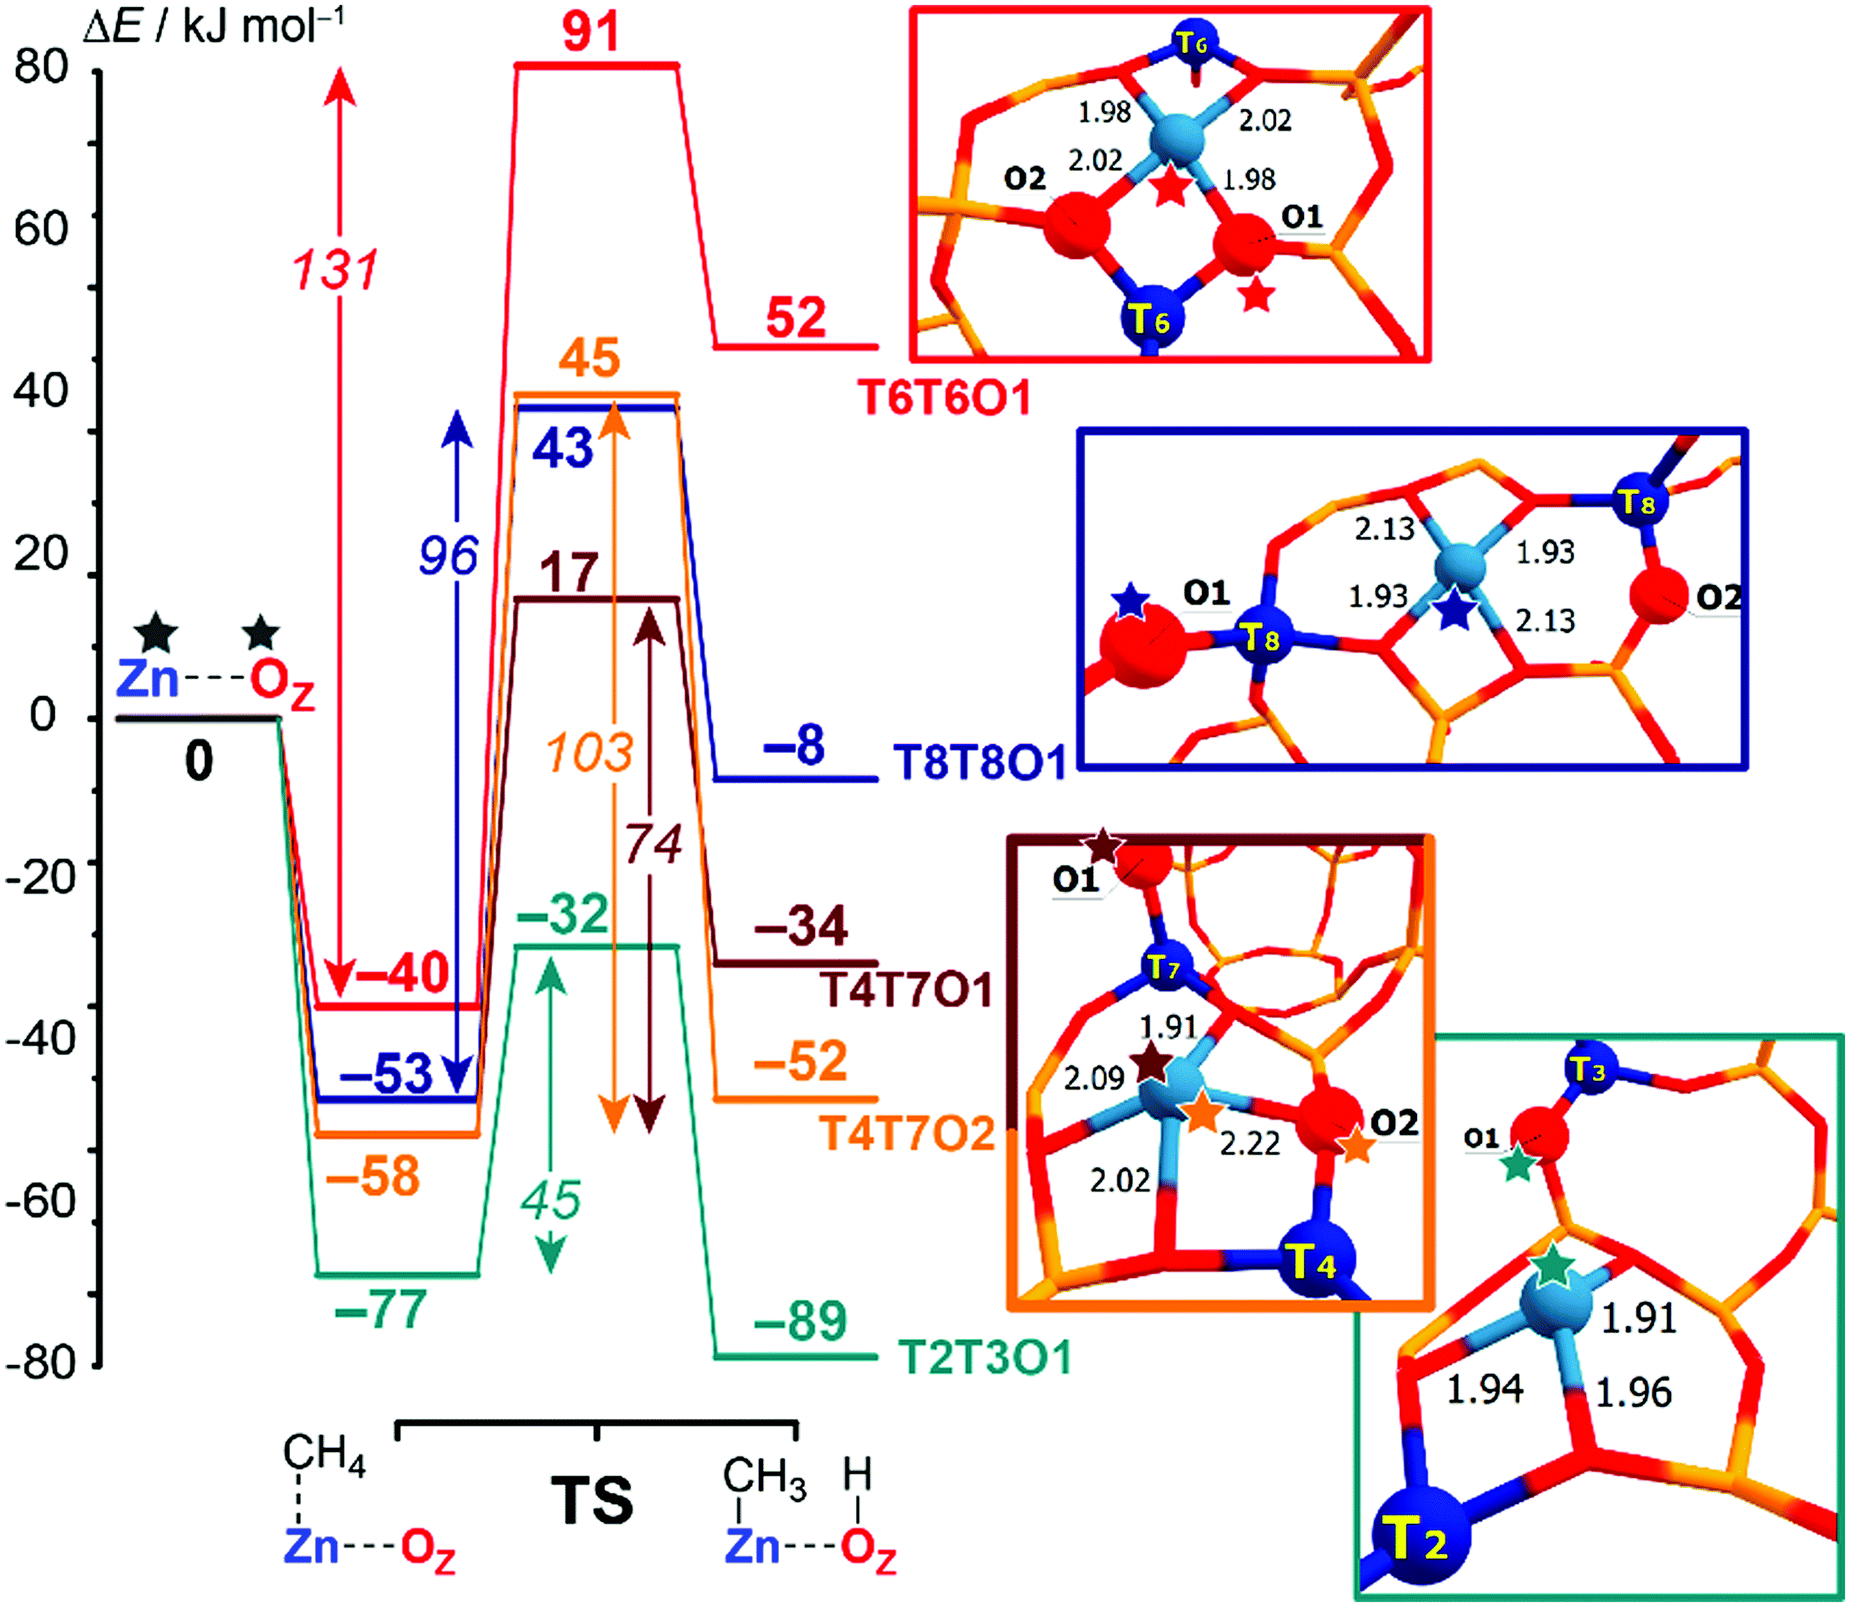 | ||
| Fig. 3 Computed reaction energy diagrams for the heterolytic dissociation of methane by representative T6T6O1, T8T8O1, T4T7O1, T4T7O2 and T2T3O1 Zn-BEA configurations. All computed reaction paths are shown in Fig. S2 (ESI†). | ||
Note that similar active site configurations provide multiple reaction pathways involving different proton-accepting sites on the zeolite framework with strongly varying energetics. The highest activation barrier of 131 kJ mol−1 is found for the most stable T6T6 ZnEF2+ cation and T6T6O1 ZnEF2+⋯OF2− Lewis pair. The lowest intrinsic barrier of 46 kJ mol−1 belongs to the least stable T2T3O1 FLP configuration with the “distantly stabilized” Zn2+ cation. The reaction is exothermic, except for the most stable configurations T6T6 and T6T8. The multisite nature of the reactive ensembles and their structural flexibility allowing for a substantial alteration in the geometry along the reaction coordinate give rise to substantial deviations from the expected linear Brønsted–Evans–Polanyi (BEP) relationships between ΔE‡int and ΔEr (R2 = 0.60, Fig. S6b, ESI†).
The BEP relationship directly relates the activation energies to the corresponding reaction energies for the particular reaction family: ΔE‡int = αΔEr + const, where parameter α reflects the position of the transition state along the reaction coordinate (0 < α <1).82–84 While the extreme values of ΔE‡int and ΔEr correspond to each other, the linear relations do not hold for the points in the middle of the BEP graph. For instance, CH4 dissociation on T4T7O1 configuration is more favorable kinetically than on T4T7O2 (ΔE‡int = 74 kJ mol−1vs. 103 kJ mol−1), while being less favorable thermodynamically (ΔEr = −34 kJ mol−1vs. −52 kJ mol−1). Therefore, the estimation of the activation energy of the C–H bond cleavage on MEFn+⋯OF2− pairs in varied zeolite confinements cannot be made unambiguously based on BEP-type relationships. A similar effect was observed earlier for homolytic CH4 activation by Fe-ZSM-5 catalysts.15 Thus, the additional screening of alternative and more complex reactivity descriptors for the ZnEF2+⋯OF2− pairs is needed to find better correlations.
3.2. ZnEF2+ Lewis acidity as the main reactivity descriptor
We further analyzed the Lewis acidity of ZnEF2+ as a potential activity descriptor, as this parameter was earlier proposed as the key driving force behind the facile activation of light alkanes by Zn-zeolites.17–19 Previous studies have shown that the activity and stability of the exchangeable Zn2+ cations in zeolite may correlate with their Lewis acidity.85–87 To probe Lewis acidity experimentally, the adsorption of basic probe molecules, such as carbon monoxide (CO),88 acetonitrile (CH3CN),89 and pyridine (C5H5CN),23,90 are often used. Kazansky and co-workers87,91 also suggested using methane and other light alkanes as suitable and highly specific probes for the reactivity and Lewis acidity of the exchangeable cations. In this case, the Lewis acidity is assessed by monitoring with FTIR spectroscopy the degree of probe molecule perturbation or the interaction strength upon probe adsorption on the exchangeable Zn2+ cations.In this regard, we have further investigated the possible correlations between the experimentally measurable responses of different adsorption probes and the intrinsic reactivity parameters of Zn2+ cations for methane C–H bond cleavage. Such molecular modeling was also motivated by the fact that no correlations were observed between the fundamental properties of Zn-sites, such as DDEC6 charges on the Zn cation, and methane activation barriers (Fig. S6c, ESI†). Adsorption energies (ΔEads) were defined as the relative energy of the adsorption complex with respect to the free optimized Zn-BEA and the probe in the gas phase: ΔEads = Eads – Ezeolite − Eprobe.
The representative geometries of the adsorption complexes of the selected probe molecules with Zn-BEA are shown in Fig. 4a. The geometry of the probe molecule changes considerably upon adsorption, resulting in a pronounced elongation of the C–O, C–H, and C–N bonds involved in the interaction with the Zn2+ site. The nature of the cation site does not impact strongly the perturbations of the probe itself but defines the interaction strength that is reflected in the ZnEF2+–probe molecule distances. The selected geometric parameters of the optimized adsorption complexes are listed in Table S5 (ESI†). The search for possible correlations between the adsorption strength and perturbations in the vibrational spectrum of the adsorbed probes revealed that, only in the case of methane, a relatively weak correlation between ν1(C–H) and Eads can be found (R2 = 0.59), suggesting that CH4 is the only probe capable of providing information on the Zn2+ Lewis acidity from the FTIR experiment (Fig. S7, ESI†). For an extended discussion related to the adsorption of the basic probe molecules, refer to ESI† (Fig. S8).
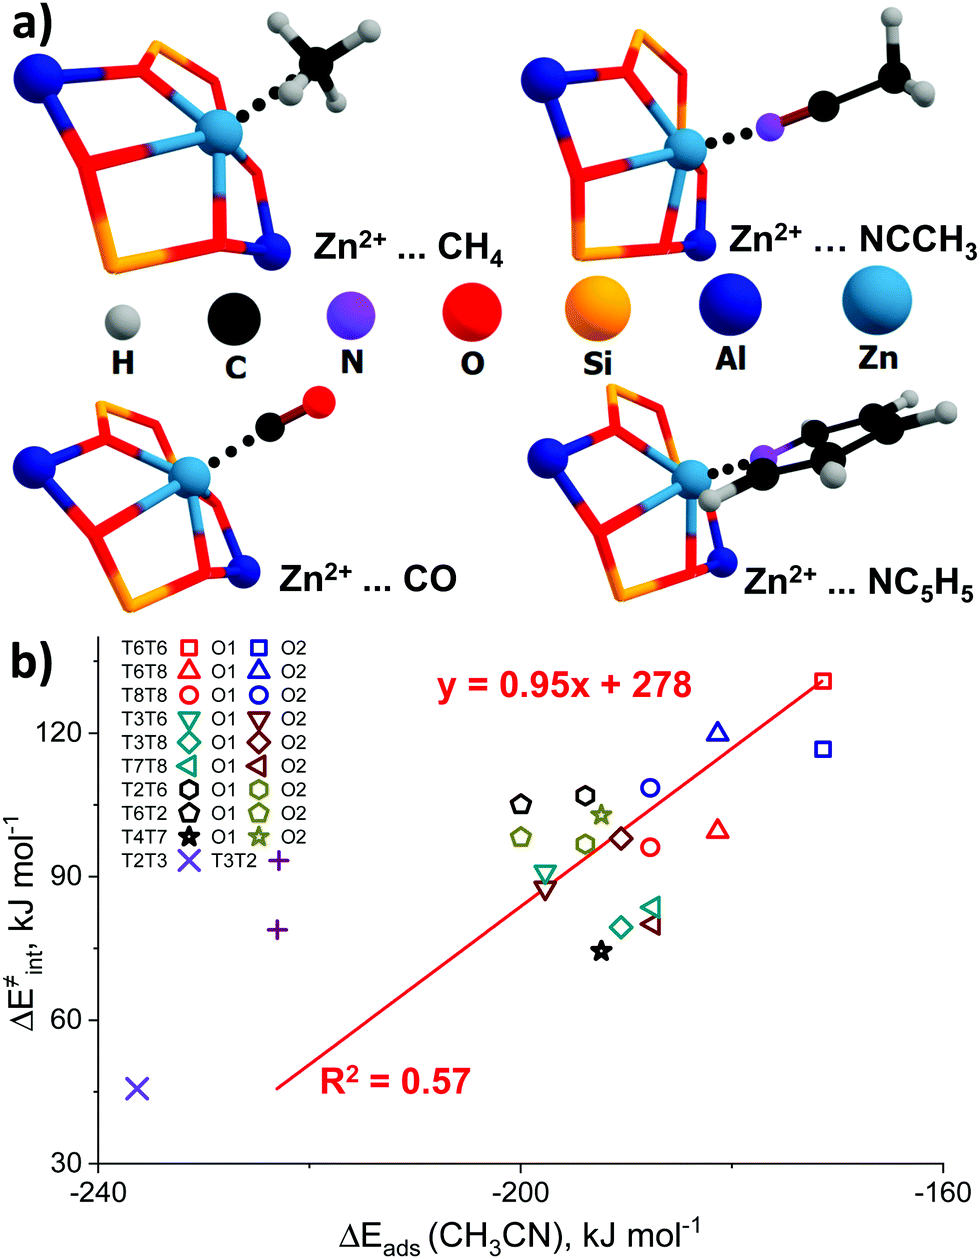 | ||
| Fig. 4 The interaction of basic molecular probes with Zn2+ cations in BEA zeolite. The representative geometries of the probe molecule adsorption complexes (a). The relationship between the activation barriers for methane C–H bond cleavage and ΔEads (CH3CN) (b). A complete summary of the adsorption energies is given in Table S4 (ESI†). | ||
To further analyze the role of Zn2+ Lewis acidity in the reactivity of various ZnEF2+⋯OF2− pairs, we investigated the relationships between the adsorption energies of the probes and the activation barriers of methane C–H bond dissociation. The representative results obtained for the case of CH3CN adsorption are shown in Fig. 4b. The results for CO, CH4, and C5H5N probes are summarized in Fig. S9 (ESI†). In all cases, rather weak linear correlations are obtained with R2 values in the range of 0.44–0.58. The best correlation is found between ΔE‡int and ΔEads for CH3CN. In this case, the complexes of the probe molecule with Zn2+ cations with the highest adsorption energies correspond to the configurations with the lowest activation energies for C–H bond cleavage and vice versa. These computational results indicate that the adsorption energies of commonly used molecular probes can be used as a rough approximation descriptor for C–H bond reactivity on Zn-modified zeolites.
We note that the deviations from the expected linearity in these correlations are not caused only by the presence of several activation pathways for each reactive configuration. The intrinsic reactivity of certain centers (e.g. T6T2, T7T8, T2T3, and T3T2) are not aligned with the common trend. Therefore, for the correct prediction of the activity of the MEFn+⋯OF2− sites, we have to inquire further into the role of the conjugated base (OF2−) in C–H bond activation. Therefore, we further analyze the basicity of OF2− as the second reactivity descriptor of the reactive ensemble to find out whether a combination of acidity and basicity of ZnEF2+⋯OF2− pairs explicitly defines its reactivity.
3.3 Lattice basicity as the secondary reactivity descriptor
The basicity of the zeolite framework oxygen atoms could be probed also by the adsorption of various probe molecules. The key problem with such an approach is the structure of the adsorption complex: the probe molecule can interact with both the exchangeable cation and the basic surface oxygen atom. However, computationally the intrinsic basicity can be more directly assessed through analysis of the atomic charges or hydrogen affinities (EH). EH was suggested by Latimer et al.92 as a universal descriptor for the reactivity of oxygen atoms for a wide range of heterogeneous materials for C–H bond activation. EH is defined as the energy difference between the formation energies of the reduced Zn-BEA with a hydrogenated oxygen atom and the initial zeolite model: EH = E(ZnEF2+⋯OFH) − E(ZnEF2+⋯OF2−) – 1/2E(H2O) + 1/4E(O2).13,92 Basicity can be also correlated with the atomic charges on the reactive oxygens. In this study, we consider the DDEC6-derived net atomic charges on the oxygen atoms as potential reactivity descriptors.We observed no correlations between the DDEC6-derived charges on the reactive O (qDDEC6(O)) atoms and the activation barriers (Fig. S10, ESI†). For EH, we obtained trends similar to those for the adsorption of basic probes, providing a weak linear correlation with an R2 of 0.55. In this correlation, the overall linearity is mostly contributed by the extreme values of the edge points on the graph representing the lowest and highest activation energies (Fig. 5a). Most of the points, however, are lying in the middle of the graph with EH values of 150–200 kJ mol−1. The oxygen basicity of the T2T3 FLP is lying completely on the trend line, which is to be expected because of its “indirectly stabilized” ZnEF2+ cation structure featuring the active OF2− atom with a substantial excess charge.93 The EH and qDDEC6(O) values for all sites are listed in Table S7 (ESI†).
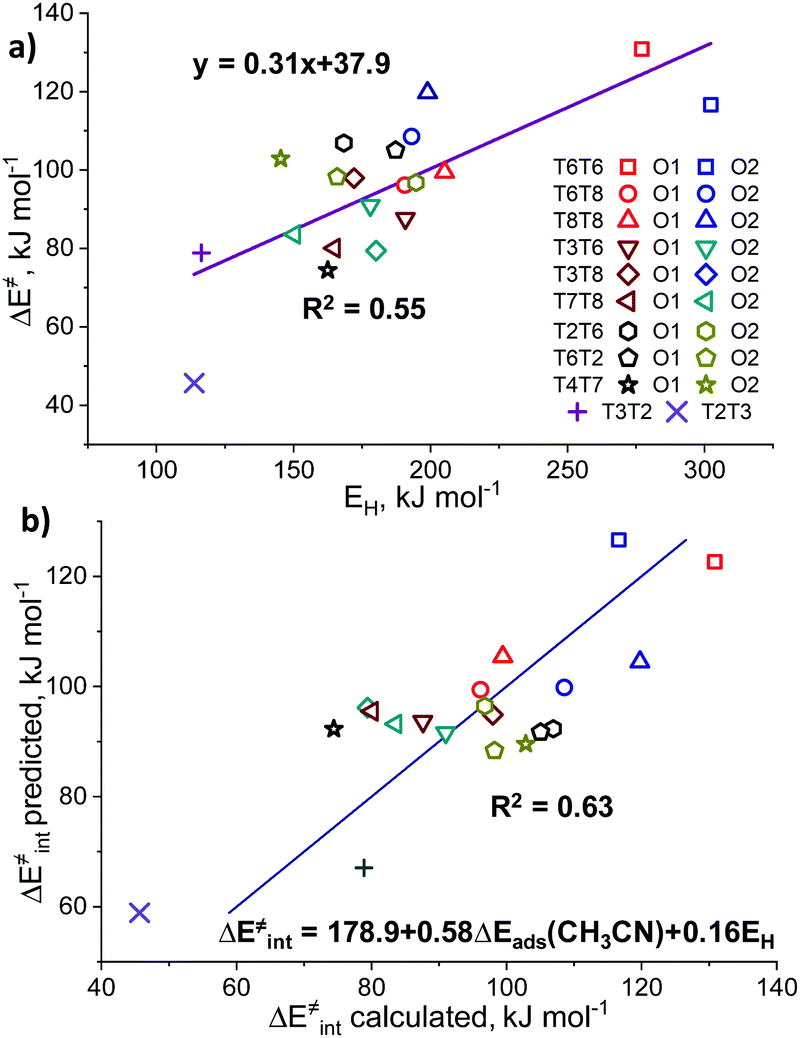 | ||
| Fig. 5 The applicability of a hydrogen affinity as a universal reactivity descriptor for Zn-zeolites. The direct correlation between ΔE‡int and hydrogen affinity (a). The two-dimensional correlations between ΔE‡int and a linear combination of EH and ΔEads(CH3CN) to account for the Lewis acidity of the Zn2+ site (b). “ΔE‡int predicted” is the activation energy value predicted using a linear combination of ΔEads(CH3CN) and EH, while “ΔE‡int calculated” refers to the DFT-calculated activation energy. | ||
Sun et al.33 previously observed the correlations (R2 = 0.80) between the activation energy of methane C–H bond cleavage on La2O3 clusters and the combined descriptor for both the Lewis acidity and basicity of the La3+⋯O2− pair. We have constructed a similar relationship based on ΔEads(CH3CN) and EH as the acidity and basicity descriptors, respectively (Fig. 5b). We constructed a parity plot of “ΔE‡int predicted” vs. “ΔE‡int calculated” where the former is the activation energy value predicted using the linear combination of ΔEads(CH3CN) and EH, while the latter refers to the DFT-calculated activation barrier. The results show that the use of such a descriptor combination gives rise to a slight improvement in the quality of the linear fit (R2 = 0.63). The coefficient values in the multiple linear regression model indicate that Zn2+ acidity plays a more significant role in the methane activation than the O2− basicity. We believe that the linear relations are breaking due to the effects of the local zeolite environment, previously formulated by Szécsényi et al.15 for homolytic methane activation on Fe-containing zeolites: the local confinement influences the transition state geometry and formation/breaking of H-bonds resulting in the stabilization/destabilization of the reaction intermediates. Indeed, different orientations of the ZnEF2+ and OF2− centers with respect to each other could either stabilize or destabilize the transition state geometry. Acid probes such as propyne and pyrrole could adsorb on both sites, making them descriptors for the combined acidity and basicity of the Lewis pair.
In addition, some interesting similarities can be observed from a comparison of the structure of the pyrrole adsorption complex and the transition state structure for methane C–H bond cleavage (Fig. 6a). We hypothesize that these probes could have potential sensitivity to both the acid–base properties of the ZnEF2+⋯OF2− pair and the whole reaction ensemble, including the local structure of the zeolite framework.
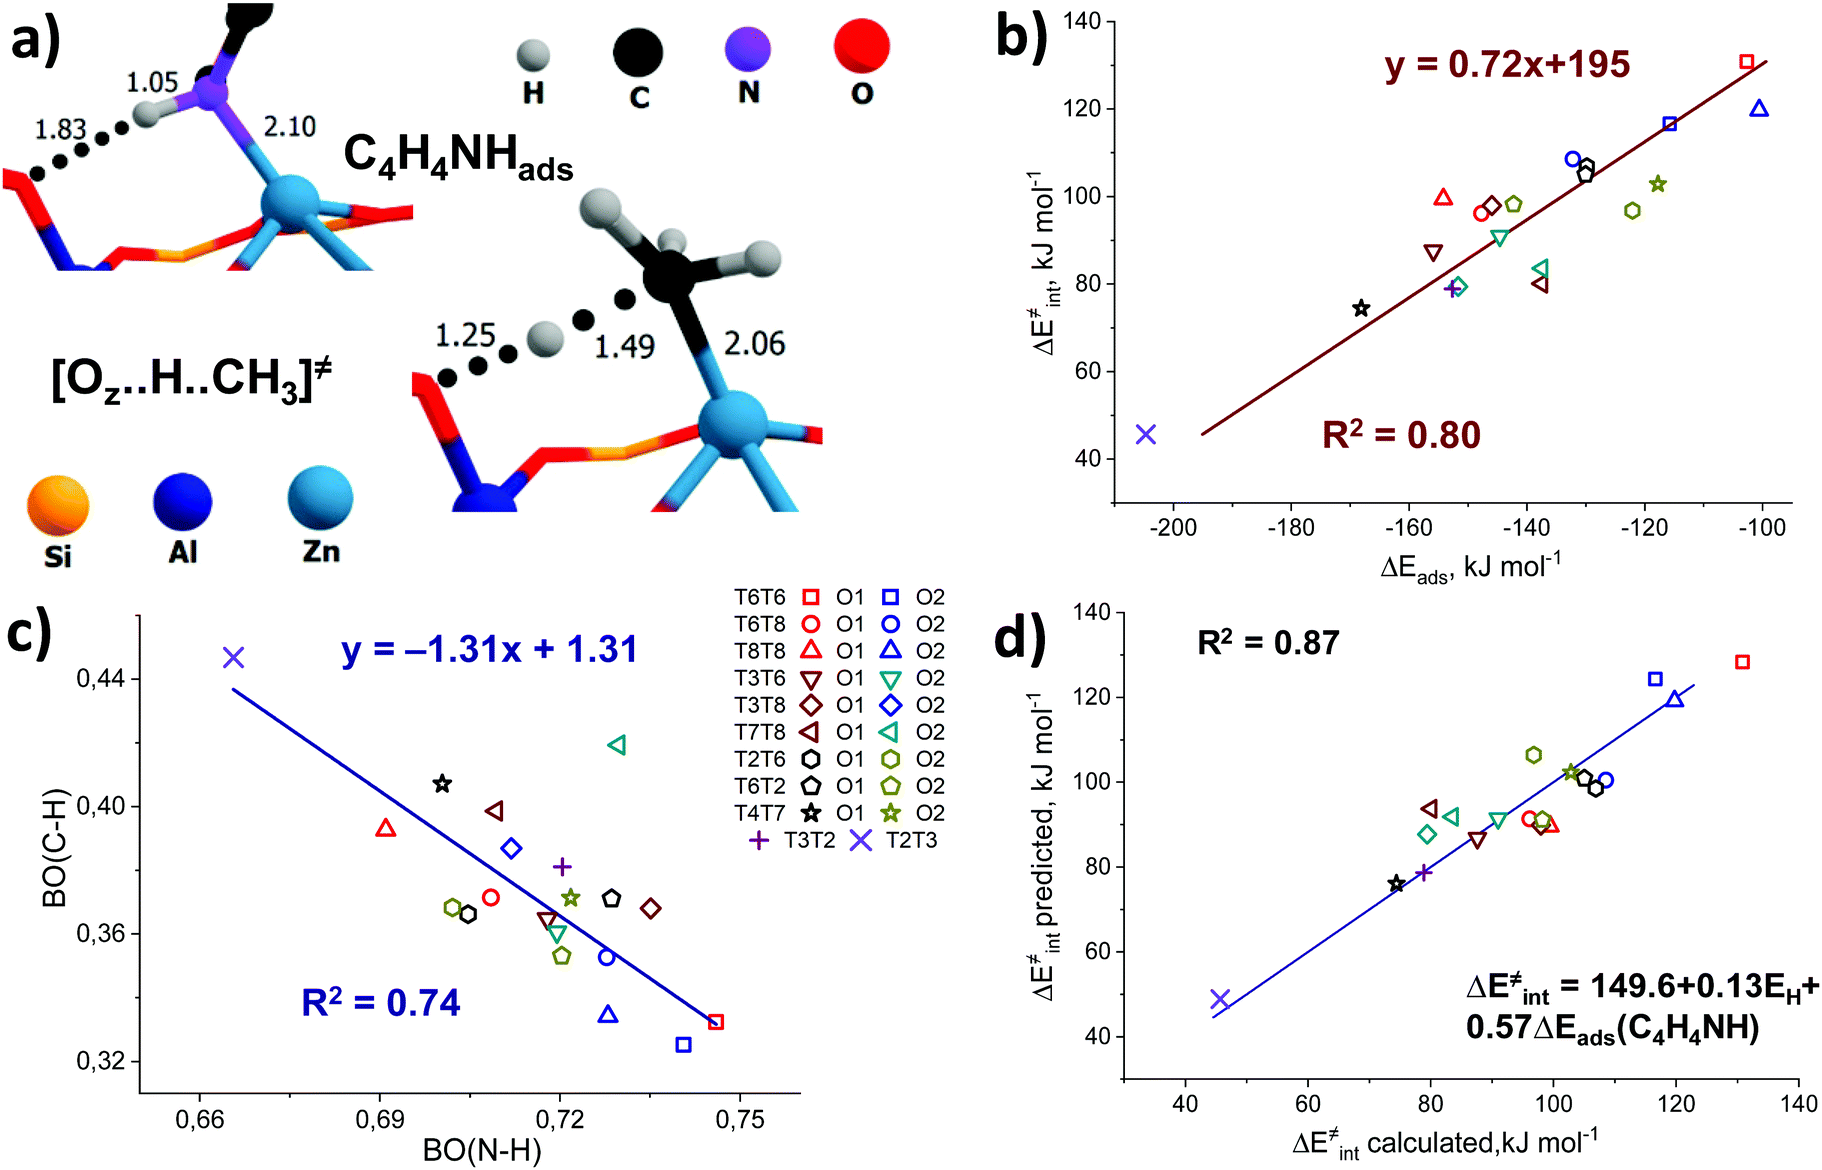 | ||
| Fig. 6 The use of pyrrole as a multifunctional adsorption probe for the reactivity of ZnEF2+⋯OF2− Lewis acid–base pairs. A comparison of the transition state for C–H cleavage and pyrrole adsorption complex geometries for the T8T8O1 configuration (a). Correlations between the intrinsic activation barrier and pyrrole adsorption energies (b). Correlation between bond orders of C–H and N–H in transition states and pyrrole adsorption complexes (c). Two-dimensional correlations between ΔE‡int and a linear combination of ΔEads(CH3CN) and EH (d). “ΔE‡int predicted” is the activation energy value predicted using the linear combination of ΔEads(C4H4NH) and EH, while “ΔE‡int calculated” refers to the DFT-calculated activation energy. | ||
3.4. Pyrrole adsorption energy as a comprehensive acid–base reactivity descriptor
Pyrrole and propyne are acid probe molecules with pKa values of 17.594 and ∼33,95 which have been used to experimentally assess the basicity of zeolite oxygen sites.30,31,96 The linear relationship with R2 = 0.69 between the adsorption energies of these probes on ZnBEA, which are directly linked to the acidity, indicates different sensitivities of the probe molecules towards local structures around Zn2+ cations (Fig. S11, ESI†). While pyrrole adsorption is substantially affected by the interactions with the zeolite framework, these interactions are much less important for propyne adsorption (Fig. S12, ESI†). An analysis of the pyrrole adsorption geometries shows substantial configurational differences for various T-sites (Fig. S13–S15, ESI†). Due to specific zeolite confinement and bonding of the adsorbed pyrrole molecule with both ZnEF2+ and OF2−, the configurational freedom of the probe is restricted. Therefore, the presented adsorption complexes herein are most stable. The interaction patterns range from weak adsorption on the ZnEF2+ cation, complemented by the very weak interaction of the acid proton and OF2− atom at a distance of ∼2.3 Å, to strong adsorption on both sites with strong hydrogen bonding at a distance of ∼1.8 Å. Upon adsorption, the ∠H–N–(pyrrole ring) angles change from 180° (gas phase) to 130° in the adsorption complexes. Some of the selected geometrical parameters of the adsorption complexes are listed in Table S8 (ESI†). Our calculations reveal that these probes provide substantial sensitivity to the orientation of the ZnEF2+ and OF2− sites with respect to each other in the intrazeolite reactive ensemble.Fig. 6b shows the relationship between the pyrrole adsorption energies and the activation barriers of C–H bond cleavage, featuring high linearity with R2 = 0.80. Table S8 (ESI†) summarizes the adsorption energies. In contrast, propyne adsorption energies produce a weak correlation with R2 = 0.46 (Fig. S16, ESI†). These data suggest that pyrrole could be a promising probe molecule for estimating the reactivity of the zeolite-confined ZnEF2+⋯OF2− pairs towards heterolytic C–H bond cleavage. Based on this relationship one can expect the lower activation energy of the C–H bond cleavage for the higher experimentally estimated heat of pyrrole adsorption. The effects of the dispersion corrections on the resulting correlations are estimated to be minor (Fig. S17, ESI†).
To analyze the origin of the good correlations between the ΔEads(pyrrole) and the activation barrier, we further investigated the changes in the DDEC6-derived bond orders (BO) of C–H and N–H in the transition state and the pyrrole adsorption complex, respectively. The C–H and N–H bond orders are listed in Tables S3 and S8 (ESI†), respectively. They form a good linear correlation with a negative slope (Fig. 6c): the increased reactivity of the ZnEF2+⋯OF2− site is reflected in the increased C–H bond order in the TS and increased polarization of the N–H bonds in the adsorbed pyrrole. With the exception of the T7T8O2 site, for which an exceptionally short C–H bond (1.40 Å) in TS (Fig. S3, excluded from the statistical analysis, ESI†) is found, a stable linear correlation with the determination coefficient R2 = 0.74 is observed between the bond orders of N–H and C–H. This indicates that the nature of the correlations between the activation energy of C–H bond cleavage and pyrrole adsorption energy could be related to the similarity of local geometry and electronic structure perturbations in the pyrrole adsorption complex and the TS for C–H bond cleavage.
Vibrational frequencies of pyrrole and propyne adsorption complexes were also calculated to assess whether the perturbations of the ν1 stretching vibration frequencies of X–H (X = N, C) could be used to assess the reactivity of the ZnEF2+⋯OF2− pair. No direct relationship between the vibrational frequencies and activation barriers was observed (Fig. S19, ESI†). The strongest redshift of the vibrational frequencies does not point to the most reactive sites but to the ZnEF2+⋯OF2− FLPs containing an oxygen atom above the Zn2+ cation, resulting in very strong OF⋯H hydrogen bonding in the adsorption complex. Such interactions give rise to the strong redshifts of ν1(N–H) in pyrrole adsorbed on T6T8O1, T8T8O1, T4T7O1, and T2T3O1 FLPs (Fig. S13–S15, ESI†), suggesting weak applicability of this probe for FTIR spectroscopic characterization of intrazeolite Zn2+ sites.
We next constructed multiple linear regressions using ΔEads(C4H4NH) in combination with other potential descriptors considered in this study to represent better the multifunctional nature of the intrazeolite active site and find possibilities for improvement of the property–activity correlations. Additional descriptors are included based on solid mechanistic considerations. It is possible that an extra term could improve the correlation since additional descriptors could better account for the specific intrinsic characteristics of the ZnEF2+–OF2− active site (acidity or basicity) compared to using pyrrole alone. In this regard, we analyzed the correlations of the intrinsic activation barrier ΔE‡int with a linear combination of ΔEads(C4H4NH) and ΔEads(CH3CN) or with a combination of ΔEads(C4H4NH) and EH. The combination of ΔEads(C4H4NH) and ΔEads(CH3CN) improves the fit only slightly (Fig. S20, ESI†). Better linearity is obtained for the correlation of ΔE‡int with ΔEads(C4H4NH) and EH with a determination coefficient R2 = 0.87. (Fig. 6d). Analyzing the p-values of the obtained correlation coefficients (Table S10, ESI†), we concluded that the inclusion of the ΔEads(CH3CN) descriptor does not have any statistical value. On the other hand, the coefficient before the EH term has statistical significance and could be included to improve the correlation quality significantly. This is not surprising because the adsorption of pyrrole is dominated by the interaction with the exchangeable cation, with a weaker interaction between the acid proton and the lattice oxygen. However, such a combination of descriptors seems to be of minor practical importance, because of the purely theoretical nature of the hydrogen affinity that can be derived only from electronic structure calculations.
We evaluated the predictive power of the correlations considered so far on alternative materials beyond the current zeolite system (Zn-BEA with Si/Al = 31, Zn-BEA-31). We first studied two additional zeolite models (Fig. S21, ESI†): namely, the Zn-BEA zeolite with Si/Al = 20 (Zn-BEA-20) and the Zn-MOR zeolite (Zn-MOR-SP-1).
For Zn-BEA-20 we consider the Zn2+ cation located in the six-membered ring with 3 Al atoms placed at T4, T6, and T8 positions. Despite it being unlikely that this kind of Al arrangement will be met within a real experiment, we aimed to show the possible transfer of our correlations to a model with a Zn2+ cation in a completely different local environment. In the case of Zn-MOR, the Zn2+ cation was stabilized at the γ-site of the “side-pocket” with Al atoms placed in T1 and T2 positions. The correlation of ΔE‡int with ΔEads(C4H4NH) established on Zn-BEA-31 provides predictions of the C–H bond dissociation barriers (Fig. 6b) that deviated by 9 kJ mol−1 from the DFT-computed ΔE‡int. The predictive power of the correlation for the determination of activation energy is improved when multiple linear regressions were applied to Zn-BEA-20 (Table S11, ESI†). However, all of the derived correlations failed to accurately predict the activation barrier over the Zn sites located at the different confinement environments of Zn-MOR. We, therefore, inferred that such purely energy-based property–activity relationships are reliably established only for the BEA zeolite topology. This is in line with a previous report by Liu et al.16 demonstrating that the scaling relations for H-zeolites were not transferrable from one zeolite framework to another. We calculated additional points for the MOR framework (Fig. S21, ESI†) to see the possibility of establishing calculations in the other zeolite lattices. The obtained results demonstrate that such correlations exist in the main channel and “side pocket” of the MOR topology. The results are shown in Fig. S22 (ESI†). The coefficients in these linear equations are very different from those obtained in the Zn-BEA zeolite. The transferability of the relationships can be improved by complementing the pure energy-based correlations with a geometrical descriptor accounting for the varied confined spaces.
3.5. Transferable reactivity models with local confinement descriptors
The predictive power of the obtained energy-based correlations was poor for the MOR topology, providing deviations of ca. 20 kJ mol−1 from the DFT-computed ΔE‡int, which is as bad as the worst outliers of the original correlation (Fig. 6b). This is attributed to the differences in confinement by different zeolite topologies. Confinement effects of the zeolite framework arise from the non-covalent interaction of the adsorbed molecules with the internal curvature of the internal zeolite surface. These effects are expected to be different for different zeolite frameworks because of the varied pore sizes and curvature.97 Effects of the zeolite confinement could be quantitively assessed by energy decomposition analysis98,99 or topological analysis of the electron density distribution.100 Szécsényi et al.15 accounted for the confinement by adding terms describing the effects of the interaction of the methyl fragment with nearby oxygen atoms to the purely energetic correlations. We followed a similar approach in this work.The geometries of the Zn–CH3⋯H⋯O–Al and Zn–Npyr–H⋯O–Si moieties are very similar in the MOR lattice, whereas pyrrole, in contrast to methane, forms several CH⋯O contacts with the zeolite wall surface. Thus, the deviation of the regression-predicted ΔE‡int to larger values can be interpreted as a decrease in the “effective” adsorption energy site due to noncovalent pyrrole–zeolite interactions. Indeed, the adsorption of pyrrole in the side-pocket of Zn-MOR (Fig. 7a) gives rise to a number of short CH⋯O contacts with D(H⋯O) < 2.5 Å, which are significantly shorter than the most probable CH⋯O distance Dmax(CH⋯O) = 2.81 Å.79 Furthermore, our analysis reveals that such multiple short CH⋯O contacts are almost exclusively formed in Zn-MOR models, while in most other systems such interactions were absent (Fig. 7b and Table S12, ESI†).
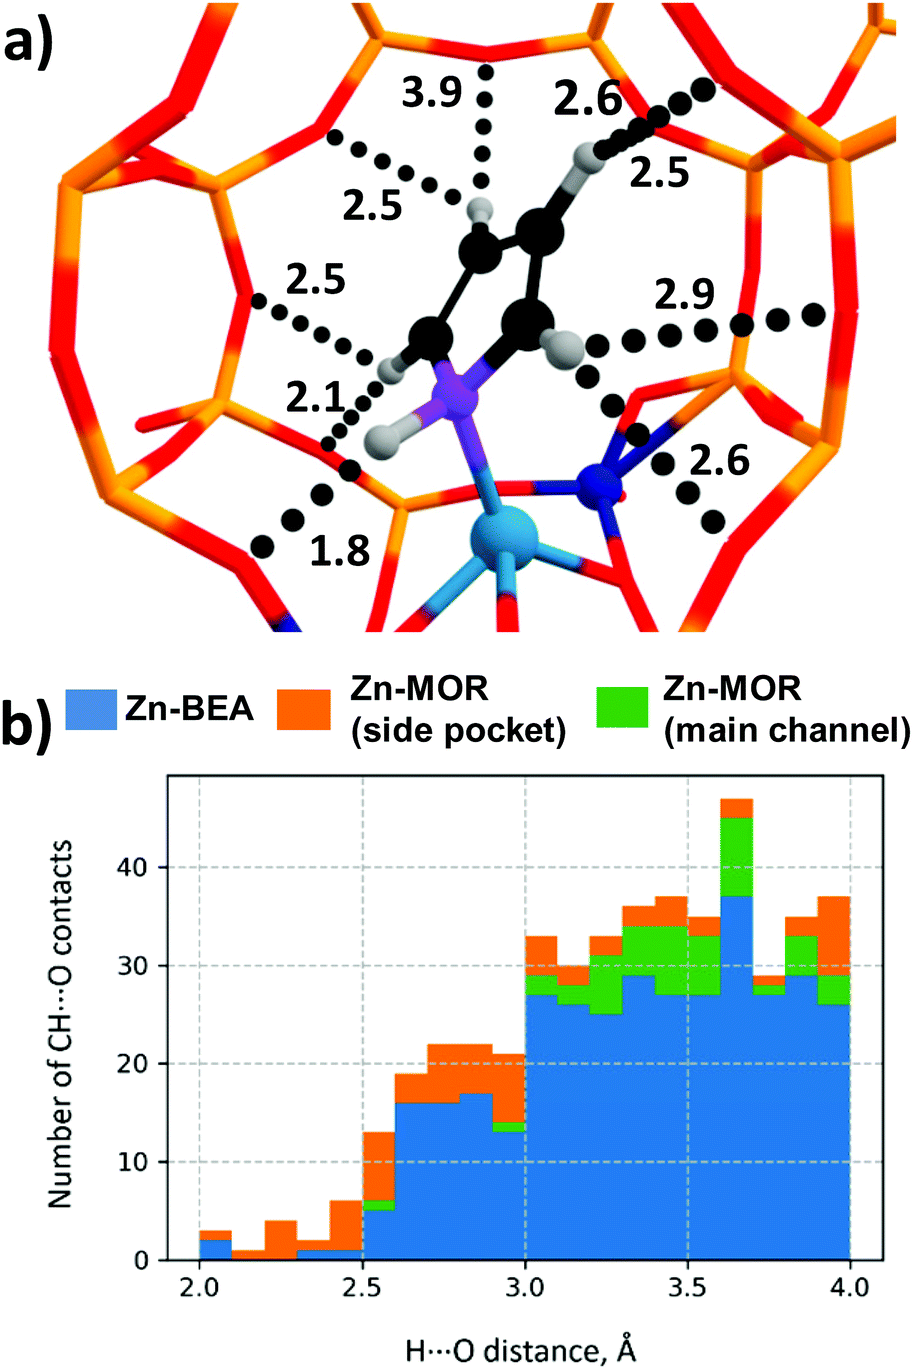 | ||
| Fig. 7 (a) Multiple CH⋯O contacts in the Zn-MOR-SP-1/pyrrole complex. (CH⋯O distances are given in Angstroms.) (b) Histogram of CH⋯O contact distances in Zn-zeolite/pyrrole systems. | ||
To quantitatively evaluate this hypothesis, we introduced the number of short CH⋯O contacts, n(CH⋯O), D(H⋯O) < 2.5 Å, as a confinement descriptor to the ΔE‡int ∼ ΔEads(C4H4NH) correlation. Because of the similar confinement effects exerted by the models of one zeolite topology, this additional descriptor was found to be statistically insignificant and it did not affect the ΔE‡int ∼ Eads(C4H5N) correlation established for a sub-set of 20 BEA systems (Fig. 8a and b). However, when applied to the complete set of systems, including seven additional Zn-MOR models, the resulting correlations showed a substantially increased R2 value from 0.57 to 0.68, and reduced error in predicted Ea (Fig. 8c and d). The “Zn-MOR-SP” notation refers to the structures in the MOR side pocket, while the “Zn-MOR-MC” notation refers to the structures in the MOR main channel. The effectiveness of using the simple confinement descriptor confirms the transferability of the ΔE‡int ∼ ΔEads(C4H4NH) correlation between zeolites characterized by different topologies. By complementing the pure energy-based correlation with such a simple structural descriptor to account for the varied confinement effects, we were able to improve its transferability between zeolites with different topologies. A further search for more complicated confinement descriptors could further improve the quality of the correlations, but such a search would require a substantial extension of the analyzed dataset that is not possible and is outside the scope of the current study.
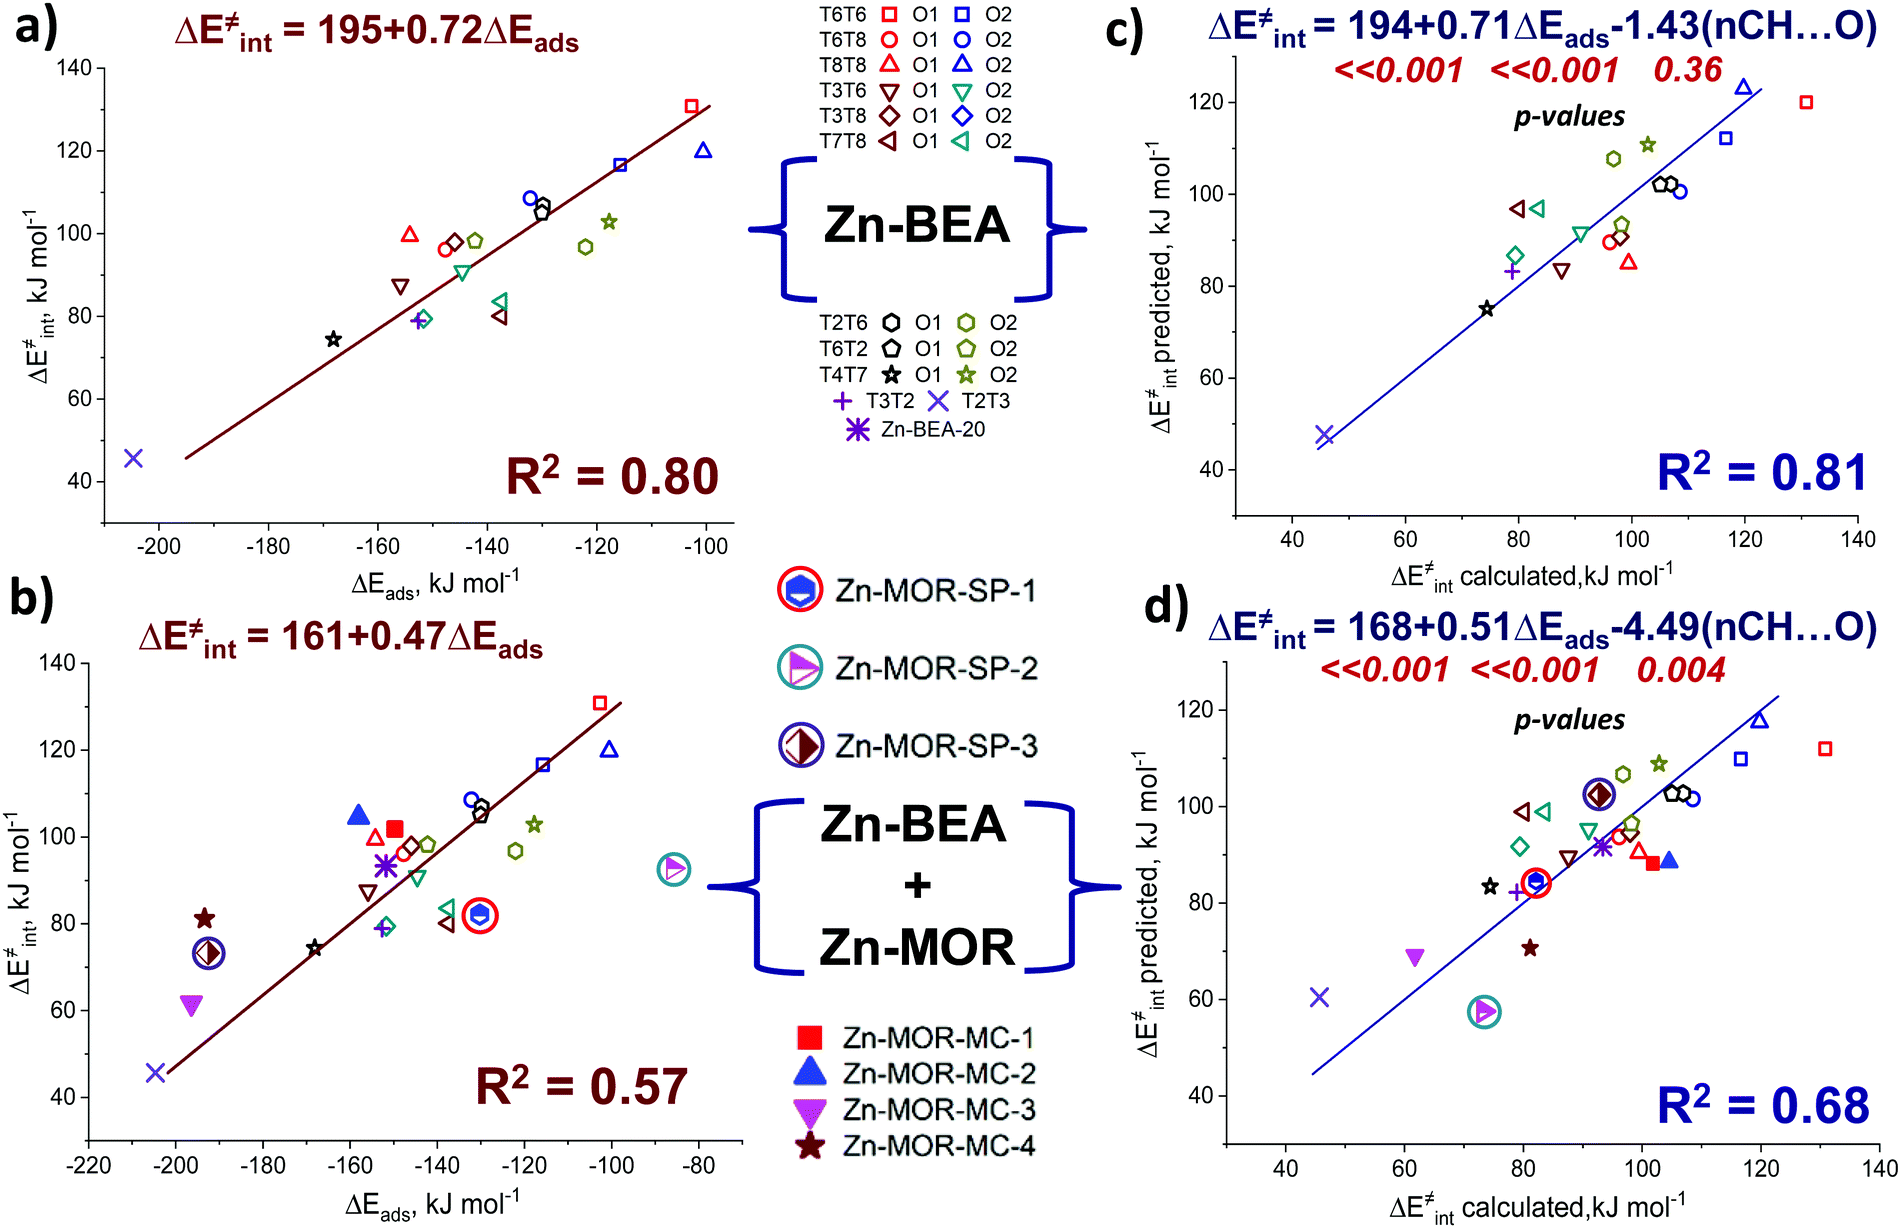 | ||
| Fig. 8 Correlations between pyrrole adsorption energies and activation energies for (a) Zn-BEA only and (b) combined Zn-BEA and Zn-MOR sets. Two-dimensional correlations between ΔE‡int and a linear combination of ΔEads[(C4H4NH)] and n(CH⋯O) for (c) Zn-BEA systems and combined Zn-BEA and Zn-MOR sets. “ΔE‡int predicted” is the activation energy value predicted using a linear combination of ΔEads(C4H4NH) and n(CH⋯O), while “ΔE‡int calculated” refers to the DFT-calculated activation energy. | ||
4. Conclusions
We have computationally studied the reactivity of the various ZnEF2+⋯OF2− sites in the Zn-BEA zeolite framework with respect to the cleavage of methane C–H bond as a model system that highlights the importance of the representation of the transition metal zeolites active sites as a reactive ensemble. Our calculations reveal the highly varied values of the activation barriers and reaction energies for ZnEF2+ sites stabilized at different cation-exchanged sites featuring various geometries and Al distributions within the BEA framework.The Lewis acidity of differently confined ZnEF2+ cations was approximated by the adsorption energies of a range of representative probe molecules widely used for the experimental characterization of intrazeolite active sites. Our computational analysis reveals only a weak correlation with determination coefficient R2 = 0.45–0.58 between the reactivity of ZnEF2+ sites towards methane C–H bond dissociation and adsorption energy of Lewis acidity probes (carbon monoxide, acetonitrile, pyridine, methane). Such molecular probes are suitable only for a rough assessment of the reactivity of cation-modified zeolites towards C–H bond activation in methane. These correlations of the C–H bond cleavage activation energy with both Lewis acid–base properties of the zeolite-confined ZnEF2+⋯OF2− pairs are slightly improved, compared to the correlations between the activation barrier and either the Lewis acidity of the cation or the basicity of the framework oxygen.
The analysis identifies pyrrole as the optimal probe molecule that simultaneously interacts with both the acidic and basic parts of the reactive site and, at the same time, allows us to effectively assess the local confined environment. This results in an improved correlation with a determination coefficient R2 = 0.80. Thus, we have obtained a fundamentally important structure–reactivity relationship bridging the reactivity of the Lewis acid–base (ZnEF2+⋯OF2−) pairs towards heterolytic C–H bond cleavage and pyrrole adsorption energies, making pyrrole a potentially useful probe molecule for the characterization of the reactivity of metal-containing zeolite towards light alkane activation. The relationship between the activation energy of C–H bond cleavage and pyrrole adsorption energies with R2 = 0.80 was explained by the structural similarity and correlations of the N–H bond orders in adsorption complexes with the C–H bond orders in the transition states. Therefore, the representation of the metal-containing zeolite active sites as a synergistically cooperating active site ensemble allows the observation of the linear property–reactivity relationship. Further analysis has demonstrated that the inclusion of simple geometrical descriptors allows us to further extend the applicability of the obtained property–activity relations outside the BEA zeolite topology. Large-scale in silico screening with modern data analysis tools of the sizeable set of zeolite topologies, active cations, and confinement descriptors would help to establish truly universal property–activity relationships.
Finally, we state that the correlations between the adsorption energies of the acidity probe molecules and the reactivity of the metal cation active sites could help guide the design and development of catalysts based on zeolites, modified with transition metal cations, for various catalytic applications.
Author contributions
The manuscript was written with the contribution of all authors. All authors have given their approval for the final version of the manuscript.Conflicts of interest
The authors declare no competing financial interests.Acknowledgements
DFT calculations in part were carried out using the national computer facilities supported by NWO Domain Science. AAK, AAG and AGS thank Ministry of Science and Higher Education of the Russian Federation for support through the project AAAA-A21-121011390053-4 for Boreskov Institute of Catalysis. EAP acknowledges the partial support from the Tyumen region within the framework of a grant to non-profit organizations no. 89-don.References
- N. Kosinov, C. Liu, E. J. M. Hensen and E. A. Pidko, Chem. Mater., 2018, 30, 3177–3198 CrossRef CAS PubMed.
- G. Li and E. A. Pidko, ChemCatChem, 2019, 11, 134–156 CrossRef CAS.
- M. H. Mahyuddin, S. Tanaka, Y. Shiota and K. Yoshizawa, Bull. Chem. Soc. Jpn., 2020, 93, 345–354 CrossRef CAS.
- D. W. Stephan, Acc. Chem. Res., 2015, 48, 306–316 CrossRef CAS PubMed.
- F. G. Fontaine and D. W. Stephan, Philos. Trans. R. Soc., A, 2017, 375, 20170004 CrossRef PubMed.
- F. G. Fontaine, M. A. Courtemanche, M. A. Legare and E. Rochette, Coord. Chem. Rev., 2017, 334, 124–135 CrossRef CAS.
- D. J. Scott, M. J. Fuchter and A. E. Ashley, Chem. Soc. Rev., 2017, 46, 5689–5700 RSC.
- J. Lam, S. Sampaolesi, J. H. W. LaFortune, J. W. Coe and D. W. Stephan, Dalton Trans., 2019, 48, 133–141 RSC.
- R. Ye, J. Zhao, B. B. Wickemeyer, F. D. Toste and G. A. Somorjai, Nat. Catal., 2018, 1, 318–325 CrossRef.
- Z. Q. Huang, T. Y. Zhang, C. R. Chang and J. Li, ACS Catal., 2019, 9, 5523–5536 CrossRef CAS.
- T. J. Yan, N. Li, L. L. Wang, W. G. Ran, P. N. Duchesne, L. L. Wan, N. T. Nguyen, L. Wang, M. K. Xia and G. A. Ozin, Nat. Commun., 2020, 11, 6095 CrossRef CAS PubMed.
- G. Li, P. Vassilev, M. Sanchez-Sanchez, J. A. Lercher, E. J. M. Hensen and E. A. Pidko, J. Catal., 2016, 338, 305–312 CrossRef CAS.
- C. Liu, G. Li and E. A. Pidko, Small Methods, 2018, 2, 1800266 CrossRef.
- S. C. Albarracin-Suazo, Y. J. Pagan-Torres and M. C. Curet-Arana, J. Phys. Chem. C, 2019, 123, 16164–16171 CrossRef CAS.
- A. Szecsenyi, E. Khramenkova, I. Y. Chernyshov, G. N. Li, J. Gascon and E. A. Pidko, ACS Catal., 2019, 9, 9276–9284 CrossRef CAS.
- C. Liu, I. Tranca, R. A. van Santen, E. J. M. Hensen and E. A. Pidko, J. Phys. Chem. C, 2017, 121, 23520–23530 CrossRef CAS PubMed.
- A. Oda, H. Torigoe, A. Itadani, T. Ohkubo, T. Yumura, H. Kobayashi and Y. Kuroda, J. Phys. Chem. C, 2013, 117, 19525–19534 CAS.
- V. Kazansky and A. Serykh, Microporous Mesoporous Mater., 2004, 70, 151–154 CrossRef CAS.
- E. A. Pidko and R. A. van Santen, J. Phys. Chem. C, 2007, 111, 2643–2655 CrossRef CAS.
- F. Benaliouche, Y. Boucheffa, P. Ayrault, S. Mignard and P. Magnoux, Microporous Mesoporous Mater., 2008, 111, 80–88 CrossRef CAS.
- E. A. Uslamin, B. Luna-Murillo, N. Kosinov, P. C. A. Bruijnincx, E. A. Pidko, B. M. Weckhuysen and E. J. M. Hensen, Chem. Eng. Sci., 2019, 198, 305–316 CrossRef CAS.
- B. Q. Zhang, X. S. Zhu, J. Gao, Y. L. Zhu and W. H. Ma, Chem. Phys., 2020, 539, 110983 CrossRef CAS.
- G. Fleury and M. B. J. Roeffaers, Catalysts, 2020, 10, 1331 CrossRef CAS.
- E. A. Pidko and R. A. van Santen, J. Phys. Chem. C, 2009, 113, 4246–4249 CrossRef CAS.
- R. Osuga, T. Yokoi and J. N. Kondo, J. Catal., 2019, 371, 291–297 CrossRef CAS.
- R. A. Schoonheydt, P. Geerlings, E. A. Pidko and R. A. van Santen, J. Mater. Chem., 2012, 22, 18705–18717 RSC.
- M. Rep, A. E. Palomares, G. Eder-Mirth, J. G. van Ommen, N. Rosch and J. A. Lercher, J. Phys. Chem. B, 2000, 104, 8624–8630 CrossRef CAS.
- G. N. Vayssilov, J. A. Lercher and N. Rosch, J. Phys. Chem. B, 2000, 104, 8614–8623 CrossRef CAS.
- O. Marie, N. Malicki, C. Pommier, P. Massiani, A. Vos, R. Schoonheydt, P. Geerlings, C. Henriques and F. Thibault-Starzyk, Chem. Commun., 2005, 1049–1051, 10.1039/b414664f.
- D. Mordenti, P. Grotz and H. Knozinger, Catal. Today, 2001, 70, 83–90 CrossRef CAS.
- M. Sanchez-Sanchez and T. Blasco, Chem. Commun., 2000, 491–492, 10.1039/b000609m.
- J. Kucera, P. Nachtigall, J. Kotrla, G. Kosova and J. Cejka, J. Phys. Chem. B, 2004, 108, 16012–16022 CrossRef CAS.
- C. Q. Chu, Y. H. Zhao, S. G. Li and Y. H. Sun, Phys. Chem. Chem. Phys., 2016, 18, 16509–16517 RSC.
- E. McFarland, Science, 2012, 338, 340–342 CrossRef CAS PubMed.
- V. L. Sushkevich, D. Palagin, M. Ranocchiari and J. A. van Bokhoven, Science, 2017, 356, 523–527 CrossRef CAS PubMed.
- J. S. Tian, J. Q. Tan, Z. X. Zhang, P. J. Han, M. Yin, S. L. Wan, J. D. Lin, S. Wang and Y. Wang, Nat. Commun., 2020, 11, 5693 CrossRef CAS PubMed.
- J. H. Lunsford, Catal. Today, 2000, 63, 165–174 CrossRef CAS.
- H. Schwarz, Angew. Chem., Int. Ed., 2011, 50, 10096–10115 CrossRef CAS PubMed.
- R. Pitchai and K. Klier, Catal. Rev., 1986, 28, 13–88 CrossRef CAS.
- M. Sun, E. Abou-Hamad, A. J. Rossini, J. Z. Zhang, A. Lesage, H. B. Zhu, J. Pelletier, L. Emsley, V. Caps and J. M. Basset, J. Am. Chem. Soc., 2013, 135, 804–810 CrossRef CAS PubMed.
- K. Narsimhan, V. K. Michaelis, G. Mathies, W. R. Gunther, R. G. Griffin and Y. Roman-Leshkov, J. Am. Chem. Soc., 2015, 137, 1825–1832 CrossRef CAS PubMed.
- M. Ravi, M. Ranocchiari and J. A. van Bokhoven, Angew. Chem., Int. Ed., 2017, 56, 16464–16483 CrossRef CAS PubMed.
- H. Jiang, L. S. Wang, W. Cui and Y. D. Xu, Catal. Lett., 1999, 57, 95–102 CrossRef CAS.
- M. S. Scurrell, App. Catal., 1987, 32, 1–22 CrossRef CAS.
- J. J. Guo, H. Lou and X. M. Zheng, J. Nat. Gas Chem., 2009, 18, 260–272 CrossRef CAS.
- M. V. Luzgin, V. A. Rogov, S. S. Arzumanov, A. V. Toktarev, A. G. Stepanov and V. N. Parmon, Angew. Chem., Int. Ed., 2008, 47, 4559–4562 CrossRef CAS PubMed.
- J. J. Spivey and G. Hutchings, Chem. Soc. Rev., 2014, 43, 792–803 RSC.
- A. A. Gabrienko, S. S. Arzumanov, A. V. Toktarev, I. G. Danilova, I. P. Prosvirin, V. V. Kriventsov, V. I. Zaikovskii, D. Freude and A. G. Stepanov, ACS Catal., 2017, 7, 1818–1830 CrossRef CAS.
- S. S. Arzumanov, A. A. Gabrienko, A. V. Toktarev, Z. N. Lashchinskaya, D. Freude, J. Haase and A. G. Stepanov, J. Phys. Chem. C, 2019, 123, 30473–30485 CrossRef CAS.
- A. A. Gabrienko, S. S. Arzumanov, A. V. Toktarev, D. Freude, J. Haase and A. G. Stepanov, J. Phys. Chem. C, 2019, 123, 27573–27583 CrossRef CAS.
- A. A. Gabrienko, S. S. Arzumanov, Z. N. Lashchinskaya, A. V. Toktarev, D. Freude, J. Haase and A. G. Stepanov, J. Catal., 2020, 391, 69–79 CrossRef CAS.
- A. G. Stepanov, S. S. Arzumanov and A. A. Gabrienko, Chemistry-Methods, 2021, 1, 224–230 CrossRef.
- V. B. Kazansky, A. I. Serykh and E. A. Pidko, J. Catal., 2004, 225, 369–373 CrossRef CAS.
- Y. G. Kolyagin, I. I. Ivanova, V. V. Ordomsky, A. Gedeon and Y. A. Pirogov, J. Phys. Chem. C, 2008, 112, 20065–20069 CrossRef CAS.
- Y. G. Kolyagin, I. I. Ivanova and Y. A. Pirogov, Solid State Nucl. Magn. Reson., 2009, 35, 104–112 CrossRef CAS PubMed.
- J. F. Wu, W. D. Wang, J. Xu, F. Deng and W. Wang, Chem. – Eur. J., 2010, 16, 14016–14025 CrossRef CAS PubMed.
- V. B. Kazansky and E. A. Pidko, J. Phys. Chem. B, 2005, 109, 2103–2108 CrossRef CAS PubMed.
- M. V. Luzgin, V. A. Rogov, S. S. Arzumanov, A. V. Toktarev, A. G. Stepanov and V. N. Parmon, Catal. Today, 2009, 144, 265–272 CrossRef CAS.
- S. S. Arzumanov, A. A. Gabrienko, D. Freude and A. G. Stepanov, Solid State Nucl. Magn. Reson., 2009, 35, 113–119 CrossRef CAS PubMed.
- J. Xu, A. M. Zheng, X. M. Wang, G. D. Qi, J. H. Su, J. F. Du, Z. H. Gan, J. F. Wu, W. Wang and F. Deng, Chem. Sci., 2012, 3, 2932–2940 RSC.
- A. A. Gabrienko, S. S. Arzumanov, M. V. Luzgin, A. G. Stepanov and V. N. Parmon, J. Phys. Chem. C, 2015, 119, 24910–24918 CrossRef CAS.
- J.-F. Wu, S.-M. Yu, W. D. Wang, Y.-X. Fan, S. Bai, C.-W. Zhang, Q. Gao, J. Huang and W. Wang, J. Am. Chem. Soc., 2013, 135, 13567–13573 CrossRef CAS PubMed.
- C. Baerlocher and L. B. McCusker, Database of Zeolite Structures. http://www.iza-structure.org/databases/ (accessed June 10, 2020) Search PubMed.
- G. Kresse and J. Hafner, Phys. Rev. B: Condens. Matter Mater. Phys., 1993, 48, 13115–13118 CrossRef CAS PubMed.
- J. P. Perdew, K. Burke and Y. Wang, Phys. Rev. B: Condens. Matter Mater. Phys., 1996, 54, 16533–16539 CrossRef CAS PubMed.
- S. Grimme, J. Antony, S. Ehrlich and H. Krieg, J. Chem. Phys., 2010, 132, 154104 CrossRef PubMed.
- S. Grimme, S. Ehrlich and L. Goerigk, J. Comput. Chem., 2011, 32, 1456–1465 CrossRef CAS PubMed.
- P. E. Blochl, Phys. Rev. B: Condens. Matter Mater. Phys., 1994, 50, 17953–17979 CrossRef PubMed.
- M. H. Mahyuddin, A. Staykov, Y. Shiota, M. Miyanishi and K. Yoshizawa, ACS Catal., 2017, 7, 3741–3751 CrossRef CAS.
- Á. Szécsényi, G. Li, J. Gascon and E. A. Pidko, ACS Catal., 2018, 8, 7961–7972 CrossRef PubMed.
- G. Henkelman, B. P. Uberuaga and H. Jonsson, J. Chem. Phys., 2000, 113, 9901–9904 CrossRef CAS.
- N. G. Limas and T. A. Manz, RSC Adv., 2018, 8, 2678–2707 RSC.
- T. A. Manz, RSC Adv., 2017, 7, 45552–45581 RSC.
- T. A. Manz and N. G. Limas, RSC Adv., 2016, 6, 47771–47801 RSC.
- N. G. Limas and T. A. Manz, RSC Adv., 2016, 6, 45727–45747 RSC.
- R. Y. Rohling, I. C. Tranca, E. J. M. Hensen and E. A. Pidko, ACS Catal., 2019, 9, 376–391 CrossRef CAS PubMed.
- R. Y. Rohling, I. C. Tranca, E. J. M. Hensen and E. A. Pidko, J. Phys. Chem. C, 2018, 122, 14733–14743 CrossRef CAS PubMed.
- R. Y. Rohling, I. C. Tranca, E. J. M. Hensen and E. A. Pidko, J. Phys. Chem. C, 2019, 123, 2843–2854 CrossRef CAS PubMed.
- I. Y. Chernyshov, I. V. Ananyev and E. A. Pidko, ChemPhysChem, 2020, 21, 370–376 CrossRef CAS PubMed.
- G. M. Zhidomirov, A. A. Shubin, V. B. Kazansky and R. A. Van Santen, Int. J. Quantum Chem., 2004, 100, 489–494 CrossRef CAS.
- A. Oda, H. Torigoe, A. Itadani, T. Ohkubo, T. Yumura, H. Kobayashi and Y. Kuroda, J. Phys. Chem. C, 2014, 118, 15234–15241 CrossRef CAS.
- M. G. Evans and M. Polanyi, Trans. Faraday Soc., 1938, 34, 11–24 RSC.
- J. N. Bronsted, Chem. Rev., 1928, 5, 231–338 CrossRef CAS.
- R. A. van Santen, M. Neurock and S. G. Shetty, Chem. Rev., 2010, 110, 2005–2048 CrossRef CAS PubMed.
- A. L. Yakovlev, A. A. Shubin, G. M. Zhidomirov and R. A. van Santen, Catal. Lett., 2000, 70, 175–181 CrossRef CAS.
- R. A. van Santen, G. M. Zhidomirov, A. A. Shubin, A. L. Yakovlev and L. A. M. M. Barbosa, Catalysis by Unique Metal Ion Structures in Solid Matrices: From Science to Application, NATO Science Series Volume 13, Prague-Pruhonice, Czech Republic, 2000.
- G. M. Zhidomirov, A. A. Shubin, V. B. Kazansky and R. A. van Santen, Theor. Chem. Acc., 2005, 114, 90–96 Search PubMed.
- L. M. Kustov, V. B. Kazanskii, S. Beran, L. Kubelkova and P. Jiru, J. Phys. Chem., 1987, 91, 5247–5251 CrossRef CAS.
- A. G. Pelmenschikov, R. A. van Santen, J. Janchen and E. Meijer, J. Phys. Chem., 1993, 97, 11071–11074 CrossRef CAS.
- W. R. Gunther, V. K. Michaelis, R. G. Griffin and Y. Roman-Leshkov, J. Phys. Chem. C, 2016, 120, 28533–28544 CrossRef CAS PubMed.
- L. Barbosa, G. M. Zhidomirov and R. A. van Santen, Phys. Chem. Chem. Phys., 2000, 2, 3909–3918 RSC.
- A. A. Latimer, A. R. Kulkarni, H. Aljama, J. H. Montoya, J. S. Yoo, C. Tsai, F. Abild-Pedersen, F. Studt and J. K. Norskov, Nat. Mater., 2017, 16, 225–229 CrossRef CAS PubMed.
- A. A. Shubin, G. M. Zhidomirov, V. B. Kazansky and R. A. Van Santen, Catal. Lett., 2003, 90, 137–142 CrossRef CAS.
- A. R. Katritzky, C. A. Ramsden, J. A. Joule and V. V. Zhdankin, in Handbook of Heterocyclic Chemistry (Third Edition), ed. A. R. Katritzky, C. A. Ramsden, J. A. Joule and V. V. Zhdankin, Elsevier, Amsterdam, 2010, pp. 383–472 DOI:10.1016/B978-0-08-095843-9.00009-4.
- M. V. Makarova, S. G. Semenov and R. R. Kostikov, J. Struct. Chem., 2018, 59, 43–46 CrossRef CAS.
- B. Moulin, L. Oliviero, F. Mauge, J. F. Groust, J. M. Krafft, G. Costentin and P. Massiani, Stud. Surf. Sci. Catal., 2008, 174, 861–864 CrossRef.
- G. Sastre and A. Corma, J. Mol. Catal. A: Chem., 2009, 305, 3–7 CrossRef CAS.
- B. Song, Y. Chu, G. Li, J. Wang, A.-Y. Lo, A. Zheng and F. Deng, J. Phys. Chem. C, 2016, 120, 27349–27363 CrossRef CAS.
- B. Song, A.-Y. Lo and J. Wang, Mol. Catal., 2017, 437, 47–56 CrossRef CAS.
- M. F. Zalazar, N. D. Cabral, G. D. Romero Ojeda, C. I. A. Alegre and N. M. Peruchena, J. Phys. Chem. C, 2018, 122, 27350–27359 CrossRef CAS.
Footnote |
| † Electronic supplementary information (ESI) available: Adsorption complexes and transition states data (PDF). Coordinates of all structures studied in this paper (ZIP). See DOI: 10.1039/d1cp05854a |
| This journal is © the Owner Societies 2022 |