
Photoelectron elliptical dichroism spectroscopy of resonance-enhanced multiphoton ionization via the 3s, 3p and 3d Rydberg series in fenchone
Sandra
Beauvarlet
,
Etienne
Bloch
,
Debobrata
Rajak
,
Dominique
Descamps
 ,
Baptiste
Fabre
,
Stéphane
Petit
,
Bernard
Pons
,
Yann
Mairesse
and
Valérie
Blanchet
*
,
Baptiste
Fabre
,
Stéphane
Petit
,
Bernard
Pons
,
Yann
Mairesse
and
Valérie
Blanchet
*
Université de Bordeaux - CNRS - CEA, CELIA, UMR 5107, F33405 Talence, France. E-mail: valerie.blanchet@u-bordeaux.fr
First published on 27th January 2022
Abstract
The resonance-enhanced multiphoton ionization of chiral molecules by elliptically polarized laser pulses produces photoelectron angular distributions that are forward/backward asymmetric with respect to the light propagation axis. We investigate this photoelectron elliptical dichroism in the (2 + 1)-photon ionization of fenchone molecules, using wavelength tunable femtosecond UV pulses. We show that the photoelectron elliptical asymmetry is extremely sensitive to the intermediate resonant states involved in the ionization process, and enables electronic couplings to be revealed that do not show up so clearly when using circularly polarized light.
1 Introduction
Chiral molecules are of particular interest in a broad range of scientific fields, from fundamental physics to biology. The two non-superimposable mirror forms of a chiral molecule, called enantiomers, interact differently with other chiral objects. Since all living organisms are formed of chiral building blocks, enantio-specificity is at the heart of biological processes and plays a fundamental role in pharmacology. From a spectroscopic point of view, the interaction between chiral molecules and circularly polarized light gives rise to a broad variety of phenomena referred to as Circular Dichroisms (CDs). These chiroptical processes are extensively used to distinguish enantiomers. Absorption CDs extend from the microwave to the ultraviolet range of the spectrum, probing rotational, vibrational and electronic transitions. They rely on the combination of magnetic dipole and electric quadrupole transitions and as such provide rather weak differential absorption, around 10−4 in relative. In 1976, Ritchie et al. predicted a purely electric-dipole effect giving chiral signals in the range of 1–10% when chiral molecules are photoionized by circularly polarized radiation.1 This PhotoElectron Circular Dichroism (PECD), confirmed in 2000 by theoretical calculations done by I. Powis,2 would manifest as a forward/backward asymmetry in the photoelectron yield with respect to the light propagation. Bowering et al. measured the first PECD in 2001, as a 3% asymmetry in the one-photon ionization of bromocamphor by vacuum ultraviolet radiation.3 Since then, this effect has been extensively investigated on different chiral targets ionized by Vacuum UltraViolet (VUV) or extreme-UV (XUV) synchrotron light, showing remarkable spectroscopic sensitivity to molecular orbitals, vibrations, chemical substitution and conformation.4–6One decade later, table-top PECD experiments arose, using resonance-enhanced multiphoton ionization (REMPI) by femtosecond UV laser pulses.7,8 They revealed a strong REMPI-PECD in camphor and fenchone molecules, in the 10% range, which could exceed the PECD observed in single photon ionization at the same electron kinetic energy.9 These pioneering experiments opened the way to the time-resolved investigation of chiral dynamics by PECD,10,11 as well as to the spectroscopic investigation of PECD in the multiphoton and strong-field ionization regimes.9,12
Compared to single-photon PECD, REMPI-PECD signals show two important additional features. First, increasing the number of photons N involved in the photoionization process produces more structured angular distributions. Indeed, as stated by Yang's theorem, the absorption of N photons produces a photoelectron distribution P that can be decomposed as a sum of Legendre polynomials – within the assumption of a cylindrical symmetry of the interaction – up to 2N:
 | (1) |
The second additional feature of REMPI-PECD is the impact of an intermediate resonance in the photoionization process. The M + K REMPI stands for a resonant excitation of electronic states by absorption of M photons, followed by absorption of K additional photons to overcome the ionization potential. In the present study, the resonant electronic states are Rydberg states populated with M = 2 and ionized with K = 1. Goetz et al.13 introduced a theoretical treatment of REMPI-PECD that decoupled the excitation and ionization. They showed that the anisotropic distribution of photoexcited molecules strongly affects the PECD, in particular by increasing the contributions of higher Legendre polynomials in the angular decomposition. This was confirmed experimentally by decoupling photoexcitation and photoionization in a two-color pump–probe scheme.10,11 These measurements showed that photoexciting molecules with linearly or circularly polarized light produces different PECDs, mainly due to the different subset of molecular orientations selected by the excitation process from an initial isotropic unexcited sample.
Indeed for M = 2, the anisotropy resulting from the photoexcitation of a molecular ensemble by linearly polarized light is expected to differ from that obtained by photoexciting with circularly polarized radiation. Controlling the proportion of circularly polarized photons, quantified by the third Stokes parameter S3 of the incoming light, thus offers a way to select the class of molecular orientations that is excited.
As important, the polarization state of the light is also expected to modify the two-photon absorption cross section (TPA). As a consequence, while in single-photon ionization the forward/backward photoelectron asymmetry is known to scale linearly with |S3|,4 in (2 + 1) REMPI, it can increase non-linearly with |S3|8,14 and even evolve non-monotonically.15,16 The sensitivity of this PhotoElectron Elliptical Dichroism (PEELD) to the anisotropy of excitation should make it very sensitive to the intermediate state, specifically revealing information about the excitation process.
In this paper, we investigate the (2 + 1)-REMPI of fenchone molecules by elliptically polarized 60–70 fs laser pulses tuned between 415 nm to 343 nm. We show that the angle- and energy-resolved PEELD maps, as well as their evolution with the polarization state and wavelength of the ionizing radiation, produce a multidimensional spectroscopy highlighting the importance of electronic couplings between excited states.
The paper is structured as follows: Section 2 summarizes our ab initio calculations and the Rydberg spectroscopy of fenchone. Section 3 describes the experimental set-up and the data processing. The data are presented in Section 4. Finally, we summarize our findings in Section 5.
2 State of the art
2.1 Rydberg spectroscopy of fenchone and ab initio calculations
Most of the electronic excitation of fenchone above 6 eV results from the promotion of an electron from the highest occupied molecular orbital (HOMO), localized on the carbonyl bond (n orbital) to virtual orbitals building Rydberg states. In the 5.9–7.22 eV energy range investigated here, the first three Rydberg series have to be considered. They are characterized by their principal quantum number n = 3 and their respective angular momentum l = 0, 1, 2. Their first assignment was performed by Pulm et al. relying on one-photon absorption CD measurements and DFT/SCI calculations.17 More recent calculations using TDDFT and an improved basis, d-Aug-cc-pDVZ,18–20 were performed by Singh et al.21 Note that the latter focused their attention on the n = 3 Rydberg states without considering the second valence state that was predicted to lie between the 3p and 3d Rydberg bands according to Pulm et al.17 We thus used the same method and basis of Singh et al. and calculated the state energies up to the 12th state, including the second valence state. The energies of the first excited states are in good agreement with the latest calculations (see Table 1). The second valence state, which mainly results from the excitation of the HOMO−1 σ-orbital located on the bicyclic part to a π unoccupied orbital located on the carbonyl group, is found to lie at 7.45 eV, just above the 4s Rydberg state. This is significantly higher than the predictions of previous calculations.17 The shape of the excited states are displayed in Fig. 1 in terms of 3D isodensity plots. Zooming on the nuclear structure reveals that the 3p3 and 3d5 states exhibit a π sizeable component on C![[double bond, length as m-dash]](https://www.rsc.org/images/entities/char_e001.gif) O. This indicates a mixing of Rydberg and second valence states, as already noted by Singh et al.21 This valence mixing is presently also noticeable in the structure of the 3p2 and 3d2,3 states. In this respect, the strong one-photon absorption CD observed around 7.2 eV has been assigned to the mixing of this second valence state and the 3d band.17
O. This indicates a mixing of Rydberg and second valence states, as already noted by Singh et al.21 This valence mixing is presently also noticeable in the structure of the 3p2 and 3d2,3 states. In this respect, the strong one-photon absorption CD observed around 7.2 eV has been assigned to the mixing of this second valence state and the 3d band.17
| State | Pulm et al.17 | Kastner et al. | Singh et al. | This work | ||||||
|---|---|---|---|---|---|---|---|---|---|---|
| Absorption | (2 + 1) REMPI | (2 + 1) REMPI | (2 + 1) REMPI | |||||||
| Meas. | Calc. | Meas. ns22 | Meas. fs23 | Meas. ns21 | Meas. ps24 | Calc.21 | Meas. fs | Calc. | ||
| a Indicates the possible mixing character of a pure Rydberg state with a valence one. All energies are expressed in eV and the calculations employ TDDFT25 with CAMB3LYP functional26 and underlying d-aug-cc-pVDZ Gaussian basis.18–20 | ||||||||||
| n → 3s | Ryd. | 6.10 | 6.28 | 5.953 ± 0.001 | 6.10 | 5.95 | 5.965 | 6.26 | 5.95 | 6.25 |
| n → 3pz | 6.67 | 6.4 | 6.403 | 6.69 | 6.67 | |||||
| n → 3py(b2) | Ryd. | 6.58 | 6.68 | 6.37 | 6.50 | 6.46 | 6.72 | 6.43 | 6.70 | |
| n → 3px(b1) | 6.77 | 6.76 | 6.74 | |||||||
| n → 3d1 | 7.18 | 7.16 | 7.14 | |||||||
| n → 3d2 | 7.25 | 7.23 | ||||||||
| n → 3d3 | Ryd. | 6.94a | 7.27 | 6.93a | 7.24 | |||||
| n → 3d4 | 7.29 | 7.26 | ||||||||
| n → 3d5 | 7.45 | 7.31 | 7.28 | |||||||
| σ → π* | Val. | 7.21 | 7.05–7.23 | 6.94a | 7.45 | |||||
 | ||
| Fig. 1 Shapes of the orbitals and excited states of fenchone, resulting from TDDFT25 with CAMB3LYP functional26 and underlying d-aug-cc-pVDZ Gaussian basis.18–20 For some of the Rydberg states, we zoom on the molecular structure to elicit possible mixing with the σ → π* valence state (lower row). | ||
We have also calculated the oscillator strengths and Two-Photon Absorption cross sections (TPA) of these excited states at the equilibrium geometry of neutral fenchone. The TPA are inherently different in linear (S3 = 0) and circular (|S3| = 1) polarizations. Fig. 2 shows how the electronic excitation is expected to change significantly by varying S3. For instance, it is expected that the 3d1 state should be preferentially populated through the absorption of two circularly polarized photons while the 3d2 state largely dominates its neighbours in the case of linear polarization. Varying S3 at the same time as the driving wavelength should thus allow us to turn on or off an intermediate resonance within the (2 + 1)-ionization process.
 | ||
| Fig. 2 (a) Oscillator strengths to the first excited states of fenchone. Two-photon absorption cross sections (TPA) calculated (b) in circular and (c) linear polarizations. The 3p1,2,3 are the 3pz,y,x identified by Singh et al. The axis are defined relatively to the local C2v (planar) geometry of the carbonyl group: x-axis normal to the plane of the C–CO–C group, and z-axis parallel to the CO bond. The calculations employ TDDFT25 with CAMB3LYP functional26 and underlying d-aug-cc-pVDZ Gaussian basis.18–20 | ||
2.2 Photoelectron spectroscopy
In 2017, Kastner et al. investigated the role of Rydberg states of fenchone in a (2 + 1)-REMPI scheme using tunable 45–60 fs pulses centered between 431 nm to 360 nm, reaching a two-photon excitation in the 5.75–6.9 eV range.23 They identified up to three distinct contributions in the Photoelectron Angular Distribution (PAD), progressively appearing with increasing two-photon excitation energy. These all presented a significant PECD signal, with different signs and amplitudes. The 3s and 3p channels, respectively located at 5.95 eV and 6.37 eV excitation energies, gave a negative sign of PECD for (S)-(+)-fenchone corresponding to a backward asymmetry. The third channel, appearing at 6.94 eV, was tentatively assigned to the π* ← σ valence state, from which a positive PECD-forward asymmetry-was observed for the same enantiomer. These PECD measurements further enabled separating two components arising from the 3p states, which were barely visible in the non-chiral part of the PAD. These measurements established that the sign of the PECD can switch depending on which intermediate electronic state is involved in the REMPI.Three years later, the same group conducted a higher energy resolution study, with nanosecond pulses between 420 and 375 nm, leading to an investigation of resonances lying between 5.9 to 6.62 eV.22 From this first high-resolution ns-REMPI spectra, they assigned the three dominant peaks lying between 6.37–6.55 eV to the 3p Rydberg states. They resolved the PECD associated with different vibrational levels of the 3s Rydberg state, and found a smooth decrease of the magnitude of the PECD with increasing vibrational excitation energy. The ns-REMPI-PECD of the 3p states were so weak that no reliable values were provided.
The comparison of the PES recorded in fs-REMPI and ns-REMPI reveals that the 3s/3p branching ratio in the PES strongly increases with the pulse duration. This drastic increase was assigned to an internal conversion taking place from the 3p and resulting in an increase of the 3s population. This population transfer to the 3s state was also confirmed at higher energy (6.9 eV).27 The bandwidths of the 3p components measured on the ns-REMPI spectra lead to an estimated lifetime of 30 fs for each of these sub-states.
In 2020, Singh et al.21 performed a joint experimental and theoretical investigation of the low-lying Rydberg states of fenchone. They measured the (2 + 1)-REMPI photoionization yield with a 1.3 ps pulse at wavelengths between 450 and 350 nm and determined an adiabatic ionization energy of IPa = (8.495 ± 0.01) eV. The results of their TDDFT calculations are presented in Table 1, together with the experimentally determined energies of the Rydberg states. These energies globally lie ∼0.3 eV below their computed ones. They also measured the dependency of the two-photon transitions as a function of the polarization state of the ionizing radiation. They found that for the 3s band, the absorption was ∼1.2–1.5 stronger in circular than in linear polarization, consistently with the TPA shown in Fig. 2. By contrast, the absorption of the 3p band was reduced by a factor of ∼2 from linear to circular, which is again consistent with our TPA calculation. Both the ns-REMPI and ps-REMPI schemes show an enhancement of the 3s state component in the photoelectron spectrum. This was attributed again to the prevalent internal conversion from the 3p series. In 2021, Singh et al.24 have investigated the (2 + 1) REMPI-PECD with a 17 cm−1–1.3 ps-UV pulse reaching the 5.95–6.75 eV two-photon energies. They concluded that the internal conversion from the 3p to the 3s state induced a switch of the PECD sign.
An important question which arises whenever Rydberg states are involved in the photoionization process is the influence of fast relaxation dynamics on the outcome of the measurement. An experimental time-resolved photoionization study in (1 + 1′)-configuration showed that the 3s state of fenchone relaxed in 3.3 ps, significantly affecting the PECD.10 While such measurements provide a straightforward insight into the process, they are not the only way to obtain information on the presence of relaxation dynamics. Indeed, several signatures of internal conversion from the 3p to 3s Rydberg states were observed in the investigation listed above. First, the increasing 3s/3p ratio with increasing pulse duration definitely provides a hint as to the relaxation dynamics. A second interesting observation reflecting the relaxation dynamics is the breakdown of the Δv = 0 propensity rule: when the 3s is populated through non-adiabatic coupling from the 3p, some photoelectrons appear at lower kinetic energies than expected for ionization of Rydberg states.21,24 In the following, we show that single-color (2 + 1)-fs-REMPI spectroscopy based on PEELD15 gives access to additional signatures of the internal conversion.
3 Experimental set-up and data processing
Our experiment was performed with the BlastBeat laser system (Tangerine SP from Amplitude) delivering 130 fs pulses at 1030 nm, with 300 μJ pulse−1 at 166 kHz (50 W average power). The second harmonic was used to pump an Optical Parametric Amplifier (OPA, Mango SP from APE). The prism-compressed OPA output was frequency doubled in a 100 μm BBO crystal. Typically, fs-REMPI was achieved with 500 nJ p−1 to 1 μJ p−1 and pulse durations between 55 to 75 fs, with a pulse bandwidth of ∼40 meV (corresponding to a Fourier-limited duration of ∼45 fs).We used 11 wavelengths ranging from 343 nm to 420 nm to photoionize fenchone molecules. The photon energy (from 2.9 to 3.6 eV) allowed us to proceed with two-photon excitation of Rydberg states lying between 5.9 and 7.2 eV followed by ionization using a third photon. The laser pulses were focused by a CaF2 lens with 300 mm focal length at an intensity around 4 × 10¹¹ W cm−2 into the interaction chamber of a VMIS, which recorded a 2D projection of the 3D photoelectron momentum distribution. Enantiopure (1S,4R)-(+)-fenchone molecules (Sigma Aldrich, further called S-(+)-fenchone) were introduced by a 200 μm nozzle heated at 90 °C, leading to a pressure in the interaction chamber of 2 × 10⁻⁶ mbar (with a background pressure of 7 × 10⁻⁸ mbar). To record the 2D projection (y,z) of the PAD, we used a set of two Micro-Channel Plates (MCP) coupled to a fast phosphor screen whose luminescence was recorded by an sCMOS camera with an exposure time of 1 s (166![[thin space (1/6-em)]](https://www.rsc.org/images/entities/char_2009.gif) 000 laser shots) and no dead time between images. Each image was binned by 2 × 2. The laser polarization state was controlled by rotating a superachromatic quarter waveplate (B. Halle) while continuously recording the VMIS images.
000 laser shots) and no dead time between images. Each image was binned by 2 × 2. The laser polarization state was controlled by rotating a superachromatic quarter waveplate (B. Halle) while continuously recording the VMIS images.
The PEELD analysis has been already fully described in ref. 15 and 16. The data were collected by rotating the quarter waveplate at the speed of 4° s−1 and recording movies of 1200 frames, covering 13 full waveplate rotations. Per turn of the quarter waveplate, S3 reaches zero value four times, twice S3 = 1 and twice S3 = −1. In the 13 full rotations of the quarter waveplate that builds the 1200-frame movie, 26 repetitions of the PEELD S3 features are expected.15 To mimick the (Left-Right) subtraction of the VMIS images that is usually done in the PECD studies, the paired images with the same |S3| but opposite helicities are subtracted to each other. The resulting differential image was (anti-)symmetrized along the z axis, symmetrized along y. Fourier analysis of the evolution of the images as a function of waveplate rotation was used to filter pixel per pixel the projections of PAD and PEELD varying as a function of S3. Finally, these projections were decomposed as a sum of Legendre polynomials Pi as follows:
 | (2) |
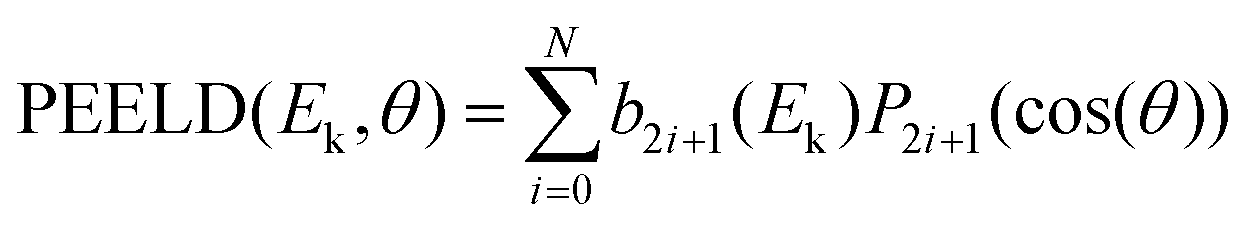 | (3) |
Fig. 3 shows the electron distributions obtained when S-(+)-fenchone is photoionized at 3 × 358 nm with resonances reached around 6.92 eV. We show the raw and fitted images for two polarizations: circular (S3 = −1, Fig. 3(a and c)) and elliptical close to linear (S3 = −0.2, Fig. 3(b and d)). In both cases, we observe three contributions in the PAD. The two inner ones result from the ionization from 3s and 3p Rydberg states. The third, weaker component at higher photoelectron kinetic energy was previously observed but not further discussed.23 Whereas the PADs recorded in circular and elliptical lights are very similar, the PEELDs are remarkably different. With S3 = −1, the PECD displays two contributions of opposite signs, reaching a few percents (∼2%). When the ionizing field is elliptically polarized with S3 = −0.2, additional contributions and very different angular distributions clearly appear in the PEELD image. This example illustrates the spectroscopic interest of PEELD investigation and its potential to reveal features that are not showcased by the usual PECD. In the following, we pursue this comparison between PECD and PEELD images by analyzing their evolution as a function of the ionizing laser wavelength.
 | ||
| Fig. 3 Normalized photoelectron angular distribution (PAD) of S-(+)-fenchone photoionized at 358 nm by (a) a circularly polarized field (S3 = −1) and (c) its corresponding antisymmetric signal, i.e. PECD. Upper half of each image is raw experimental data, that have been antisymmetrized with respect to the light propagation direction z. Lower half of each image is Abel inverted image. (b and d) are the same as (a and c) for a lower ellipticity (S3 = −0.2). The PAD are normalized by their maximal amplitudes (pixel value) which are also employed to normalize the PECD and PEELD images. | ||
4 The PEELD spectroscopy
4.1 Wavelength scan
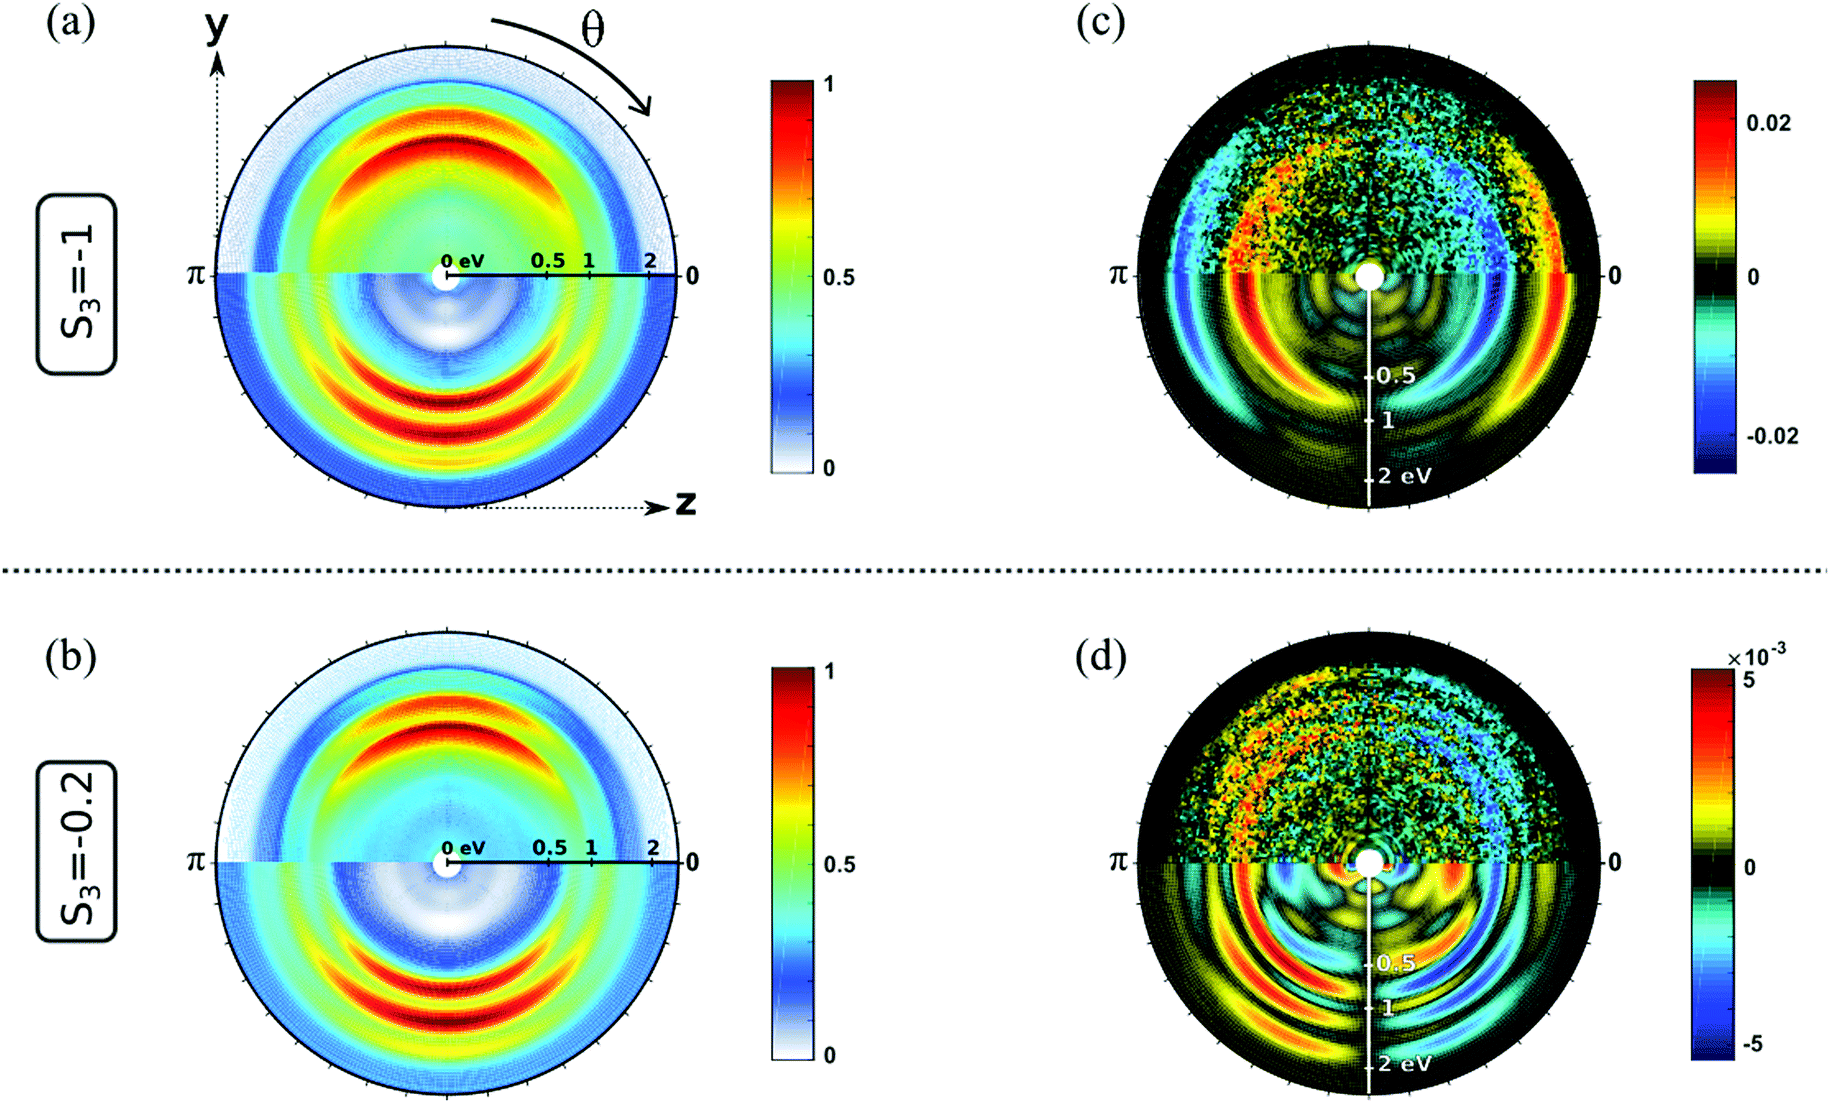
The sensitivity of REMPI-PEELD to the intermediate electronic state is better visualized through the evolution of the Legendre coefficients bi as a function of the two-photon energy and the ionization energy, as shown on Fig. 4. The ionization energy is defined as IE = 3 × ħω0 − Ek, where ω0 is the angular frequency of the ionizing photon and Ek is the kinetic energy of the photoelectron. The absorption of two photons leads to the population of a Rydberg state, with binding energy ER, which can be vibrationally excited with energy Evib such that 2ħω0 = ER + Evib. Assuming that the Rydberg and ion potential energy surfaces are parallel, the absorption of a third photon produces an ion whose vibrational energy is also Evib. This assumption is often called the Δv = 0 ionization propensity rule of Rydberg states. The expected ionization energy from a given Rydberg state then evolves as IE = IPa − ER + 2ħω0. The 2D-maps of Fig. 4 allows to highlight these Δv = 0 propensity rules for each Rydberg channel, represented by the white continuous lines. We further superimpose to the maps white dashed lines which correspond to ER listed in Table 1 and determined by Kastner et al.22,23 The identification of sub-states within 3p and 3d series is restrained by the driving laser bandwidth and the energy resolution of our VMIS. | ||
| Fig. 4 Legendre decomposition of the REMPI photoelectron signal as a function of the two-photon excitation energy and the ionization energy (IE = 3 × ħω0 − Ek = Ipa − ER + 2ħω0), for (a–c) a circular polarization with S3 = −1 and (d–f) an elliptical polarization with S3 = −0.2. (a and d) refers to b0, while (b and e) correspond to b1, and (c and f) to b3. The 11 excitation wavelengths used in this study are indicated on the right side of each graph and the five ones leading to remarkable transitions in the ionization dynamics are mentioned in nm. For each excitation wavelength, the coefficients are normalized to the maximum of b0. The 3s, 3p and 3d Rydberg series are identified by the continuous diagonal white lines corresponding to the Δv = 0 propensity rules of ionization with binding energies ER = 5.95 eV, 6.37 eV and 6.94 eV, respectively (see Table 1). The horizontal dashed lines indicate the thresholds of appearance of 3s, 3p and 3d bands on the PEELD maps. Note that the Legendre decomposition of (2 + 1)-REMPI PAD also involves a b5 coefficient which has been found negligible in all cases. | ||
The first striking observation that can be drawn from the evolution of the PES(b0) in Fig. 4 is the validity of the Δv = 0 Rydberg ionization propensity rule. The local extrema appearing in the b1,3 maps are slightly shifted in energy with respect to the maxima of the PES, depending on the ionization channel and S3. Such an energy shift is common in PECD measurements, and usually assigned to the kinetic energy dependency of the phase shifts of the ionization partial waves defining the photoelectron asymmetry.29
We start by analyzing the case of photoionization by circularly polarized light (S3 = −1, Fig. 4(a–c)). At low photon energy, only the 3s Rydberg state is accessible and shows a negative asymmetry. When the two-photon energy reaches ∼6.4 eV, photoelectrons associated with ionization from the 3p band appear at lower ionization energy. The 3s contribution remains important until the two-photon energy reaches ∼7 eV. At this third threshold, the 3d intermediate states take the lead of the PES(b0). The ratio between the contributions from the 3s and 3p states in our measurements differs from that of Kastner et al.23 who observed a larger photoelectron yield from the 3p states than from the 3s using ∼50 fs laser pulses. On the other hand, our results are more consistent with the ones recorded with picosecond21,24 or nanosecond pulses.22 This underscores that the few additional tens of femtoseconds of our pulses (70 fs) compared to those of Kastner et al.23 (50 fs) are enough to induce a larger sensitivity to non-adiabatic couplings (NAC) at play between the Rydberg states. Focusing on the forward/backward asymmetric signal, decomposed in the b1 and b3 maps (Fig. 4(b and c)), it is clear that the chiral response is dominated by the contribution of the 3s state for S3 = −1, throughout the whole range of photon energies scanned. As already observed in the ref. 22 and 23, we confirm that b1(3s) does not change sign as a function of vibrational excitation but experiences a smooth decay. As we will discuss further, the sign change of the b3(3s) coefficient in Fig. 4(c) above ∼6.5 eV is related to the change of the anisotropy of excitation that is then imposed by the 3p electronic transition. The asymmetric signatures of the 3p or 3d states are more noticeable through the b3 map (Fig. 4(c)) than through the b1 map (Fig. 4(b)).
We have seen in Fig. 3 that chiral photoionization by circularly and elliptically polarized light could produce dramatically different angular distributions. To evaluate the generality of this statement, we now turn our attention to the b0, b1 and b3 maps recorded at S3 = −0.2 (Fig. 4(d–f)). The overall evolution of the b0 map closely resembles the one measured in circular polarization, but the relative weight of the contributions from the different Rydberg states differs: the 3p state is stronger, and as soon as the 3d state is energetically accessible, this latter band dominates the whole spectrum. This is consistent with the two-photon absorption probabilities shown in Fig. 2. The TPA to the 3p and 3d bands are indeed expected to strongly increase when going from circular to (quasi-)linear polarization. Regarding the chirosensitive b1 and b3 coefficients, the most striking difference with respect to the circular case is the appearance of a strong b1 contribution from the 3p state. Above 6.2 eV excitation energy, the b1 and b3 components from the 3s state split in two parts of opposite signs. A clear transition also lies within the 3d region around 7 eV, showing a sharp sign switch of b1 and b3, and almost no more signal from the other channels.
The evolution of the chiral signal from the three intermediate states can be further studied by spectral integration over respectively 450 meV, 630 meV and 830 meV around the white continuous lines depicted in Fig. 4 for 3s, 3p and 3d bands. The PECD, defined as twice the difference between the number of electrons emitted in the forward and backward hemispheres, normalized by the mean signal per hemisphere,30 is given by:7,31
 | (4) |
 | (5) |
 | ||
| Fig. 5 Observed values of forward/backward dichroism spectrally integrated over 450 meV, 630 meV and 830 meV over each of the three ionization bands, related each to populations in the Rydberg states 3s, 3p and 3d (called s, p, d). The photoelectron dichroism is displayed as a function of the two-photon excitation energy for two specific ellipticities S3 = −1 (on the left) and S3 = −0.2 (on the right). The lines joining the stars are just guidelines. | ||
With S3 = −1, the PECD from the three channels shows an overall monotonous trend with the excitation energy. At 5.9 eV, the PECD from the 3s state reaches −13.2%, in agreement with the previous PECD investigations.22–24 The 3s PECD reaches a maximum amplitude of −16% at 6.17 eV two-photon energy (402 nm driving wavelength) before progressively decreasing down to − 3%. The PECD from the 3p channel remains between ±2% on the whole two-photon energy range, which is also in accordance with the values reported by Kastner et al.23 but slightly lower than the ones recorded in ps-(2 + 1) REMPI.24 Regarding the 3d state contribution, we observe a sign change of the PECD, starting from 2% at 6.92 eV (358 nm) and reaching −4.6% at 7.23 eV (343 nm).
When the ionizing radiation is elliptically polarized with S3 = −0.2, the evolution of the PEELD with excitation energy shows an overall similar trend for the 3s band, but also displays some sharp features especially for the 3p and the 3d bands. For the 3s channel, the PEELD is very weak at 5.9 eV, reaching about −1% after normalization by |S3| whereas it was −13.3% in circular polarization. Increasing the photon energy results in an abrupt increase of the magnitude of PEELDnorm which reaches −26.3% at 6.17 eV (402 nm). Even more impressive is the PEELDnorm recorded for the 3p band, which shows a huge enhancement with respect to the PECD. Indeed, the raw PEELD reaches ∼−6% at 6.5 eV (382 nm), more than five times the value of the PECD at this photon energy. This is remarkable since the light producing the PEELD contains five times less circularly polarized photons than the one producing the PECD. The PEELDnorm reaches thus −30%. This enhancement underscores how the ensemble of aligned molecules selected by the quasi-linearly polarized pulses from the original isotropic distribution is very different from the one selected in a circular radiation, and how this anisotropy results in a very strong chiroptical response in ionization. Last, the PEELD from the 3d state reaches high values and is very sensitive to the excitation wavelength, showing abrupt variations and changes of sign.
To get a deeper insight into the transitions in this REMPI regime investigated by PEELD, we focus on a few specific photon energies in the following sections to show the kinetic energy dependencies of the b1 and b3 parameters with |S3|.
4.2 Transition between 3s and 3s–3p excitation
We start by investigating the influence of the 3p threshold in the REMPI process. Fig. 6(a) shows the photoelectron angular distributions and PEELD recorded when only the 3s state is accessible at 5.98 eV two-photon excitation energy, using circularly (S3 = −1) or elliptically (S3 = −0.2) polarized light. A single kinetic energy component characterizes the ionization. The angular distributions can be analyzed by plotting their decomposition onto the first Legendre polynomials (Fig. 6(b)). The analysis of the raw data includes Legendre polynomials up to 6, but we focus here on the first dominant terms b0,1,3. To extract error bars on the b1,3, we used a series of 6 to 21 consecutive measurements, each of them corresponding to 100 images with 1 second exposure time. We Fourier-filtered these measurements to extract the PAD and PEELD, and used pBasex4 to extract the b0,1,3(E,|S3|). We then conducted a statistical analysis of the results of the pBasex fittings, to extract 68% confidence intervals using Student's statistics. These confidence intervals are used to define the error bars in Fig. 6(b). | ||
| Fig. 6 2D PAD and PEELD recorded in (2 + 1) REMPI at 415 nm (a–c) and 382 nm (d–f). (a and d) Abel-inverted PAD and PEELD images recorded with S3 = −1 and S3 = −0.2. The PAD is normalized to its own maximum and the PEELD to the PAD maximum. (b and e) Kinetic energy distributions of the Legendre coefficients b0 (in grey), b1/|S3| (in red) and b3/|S3| (blue) for these two ellipticities. The b1,3(E)/|S3| coefficients are normalized to b0(E,|S3|). (c and f) bi/|S3| parameters as a function of |S3| and the kinetic energy. Both b1,3(E,S3)/|S3| are normalized to the maximum value of b0(E,|S3|). b0(E,S3) is normalized to its own maximum over all the S3 recording. In the (c and f) panels, the horizontal lines indicate the kinetic energies expected from Ek = ħω0 − IPa + ER for 3s and 3p bands using the ER binding energies listed in Table 1. The white dashed line is for 3s and the white-gray one for the 3p band. | ||
At that wavelength, switching the ellipticity from circular (S3 = −1) to S3 = −0.2 does not drastically affect the PAD and PEELD. The continuous evolution of the Legendre coefficients as a function of |S3| is shown in Fig. 6(c). The ionization yield, visible through b0, maximizes when the ionizing pulses are circularly polarized. This is due to a favored TPA in circular polarization as shown in Fig. 2 and as already observed by Singh et al.21
With an isotropic excitation as stemmed for a s state, we expect the b1,3/|S3| ratios to be constant with respect to S3. In a previous investigation of (1 + 1′) TR-PECD in fenchone, the time-dependency of the b3 was found to follow the decay of the anisotropy of excitation.10 In Fig. 6(c), for a 3s excitation, b1/|S3| maximizes slightly in circular polarization and b3/|S3| is rather weak. This very weak b3/|S3| observed for all S3 values thus likely results from the very weak anisotropy of excitation to the 3s state.
As soon as the 3p state is energetically accessible, as illustrated in Fig. 6(d) for 382 nm laser wavelength, the angular distributions recorded with S3 = −0.2 are characterized by a rather strong PEELD asymmetry from the 3p contribution. We further observe a splitting of the 3s asymmetry into two components of opposite sign. Both features disappear in circular polarization with a single contribution from the 3s state, leading to PECD pictures quite similar to the ones recorded at lower two-photon energy. In Fig. 6(f), the evolution of the Legendre coefficients with |S3| reveals the complexity of the underlying mechanisms which are at play in this excitation range. For instance, the photoionization yield b0 is now stronger in linear polarization for both 3s and 3p ionization channels. This is expected from the TPA calculations for the 3p states, but not for the 3s (see Fig. 2). The asymmetry coefficients follow the same trend, also maximizing close to linear polarization. The kinetic energy splitting of the b1(3s) coefficient in two opposite components appears as soon as |S3| < 0.5, which matches the appearance of an asymmetry in the 3p band. This similarity of the S3 dependencies of both b1/|S3| and b3/|S3| for the 3s and 3p channels reveals that a decay of some of the 3p sub-states into the 3s state occurs before the absorption of the third (ionizing) photon.
In an adiabatic picture, all these Rydberg states are not coupled to each other. Non-adiabatic coupling(s) are thus at play, and are sufficiently strong to get an efficient population transfer from the 3p band to the 3s state within the 70 fs pulse duration. One has to underscore that in the past, the presence of this 3p–3s NAC had not been drawn from PECD measurements but by comparing the PES(b0) recorded with different pulse duration (ns versus fs).22 Here, the PEELD maps of Fig. 6(f) shows a clear signature of such 3p–3s NAC at low |S3|, which is not revealed with circularly polarized ionizing radiation.
The importance of the NAC in the experiment can be quantified by using the calculations performed by Singh et al.21 They show that at 6.5 eV, the direct excitation of the 3s state induced by the absorption of linearly polarized photons is only ∼17%, due to small Franck–Condon factors. The indirect population of the 3s state through intermediate 3p states is thus of paramount importance. This indirectly populated 3s state has an anisotropy of excitation fixed then by the 3p band. On the other hand, the 3p1 TPA cross section is smaller than its 3p2,3 counterparts, especially when S3 = 0 (see Fig. 2), so that the 3p1 state can be depreciated within the 3p manifold. By combining our TPA cross-sections moments with the 3p2 and 3p3 Franck–Condon profiles calculated by Singh et al., we find that the 3p2/3p absorption ratio is ∼90% for both |S3| = 0 and 1. This indicates that the 3p2 state should play the major role among all the 3p states. It probably monitors the indirect population of the 3s state at small |S3| through the associated 3p2–3s NAC coupling. Meanwhile the 3s/3p2 TPA ratio is ∼17% in linear polarization and increases to ∼42% in the case of circular radiation. The relative weight of direct and indirect 3s population pathways thus significantly varies with |S3|, which explains the variations of b1/|S3| and b3/|S3| associated to the 3s state around |S3| = 0.5 in Fig. 6(f). These asymmetry patterns are stronger at small |S3|, where the indirect pathway is dominant and involves an intermediate 3p state whose anisotropy of excitation enhances the asymmetry.
Importantly, the variation of the 3s-state population with |S3| clearly depends on the occurrence of 3p–3s NAC: we can expect that ionisation taking place from the 3s channel involves two different vibrational wavepackets, one created from a direct TPA to the 3s dominant at large |S3| and another one created by the ultrafast NAC from the 3p band dominant at low |S3|. The different vibrational content of the 3s-wavepacket has been very recently investigated in the ps-REMPI-PECD.24 On that ps time-scale proper to a more complete vibrational relaxation, the photoelectrons breaking the Δv = 0 propensity rule of photoionization show a reversed PECD compared to the ones fulfiling it. The possible eventual interference between these two vibrational wavepackets could explain the feature observed on b1/|S3| around |S3| = 0.7 in Fig. 6(f). This opens the door to femtochemistry with elliptical fields, aiming at picturing the role and dynamics of NAC.
The signal recorded at 6.7 eV excitation energy is shown in Fig. 7(a–c). It is very similar to the one obtained at 6.49 eV (Fig. 6(d–f)), apart from a slightly stronger b0 contribution in the 3p ionization channel and a splitting of its b3 parameter. This shows that the kinetic energy of the ejected electrons does not significantly affect the PECD and PEELD in this excitation range.
 | ||
| Fig. 7 Same as Fig. 6 but for two-photon excitation energies reaching the 3d band. A (2 + 1) REMPI at (a-c) 370 nm, (d-f) 358 nm, (g-i) 352 nm. In the (c, f and i) panels, the horizontal lines indicate the kinetic energy expected from Ek = ħω − IPa + ER for 3s, 3p and 3d bands using the ER binding energies listed in Table 1. The white dashed line is for 3s state, the white-gray one for the 3p band and the dot white-gray line for the 3d band. | ||
4.3 Reaching the 3d excitation threshold
The second transition focuses on the appearance of the 3d states in the photoelectron spectrum. When the excitation energy reaches 6.93 eV, an additional photoelectron peak appears around 1.9 eV kinetic energy. We assign this third contribution to the 3d Rydberg band since its kinetic energy follows nicely the Δv = 0 propensity rule shown in Fig. 4. Its ER = 6.93 eV is also in agreement with the (2 + 1)-fs-REMPI spectra recorded by Kastner et al. The signal from this peak slightly increases as |S3| increases from 0 to 0.5 as shown in Fig. 8, before slightly decaying. This is consistent with our TPA calculations (Fig. 2): the only 3d substate whose population maximizes in circular polarization is 3d1 which also presents the lowest ER. We thus assign this peak to this sub-state.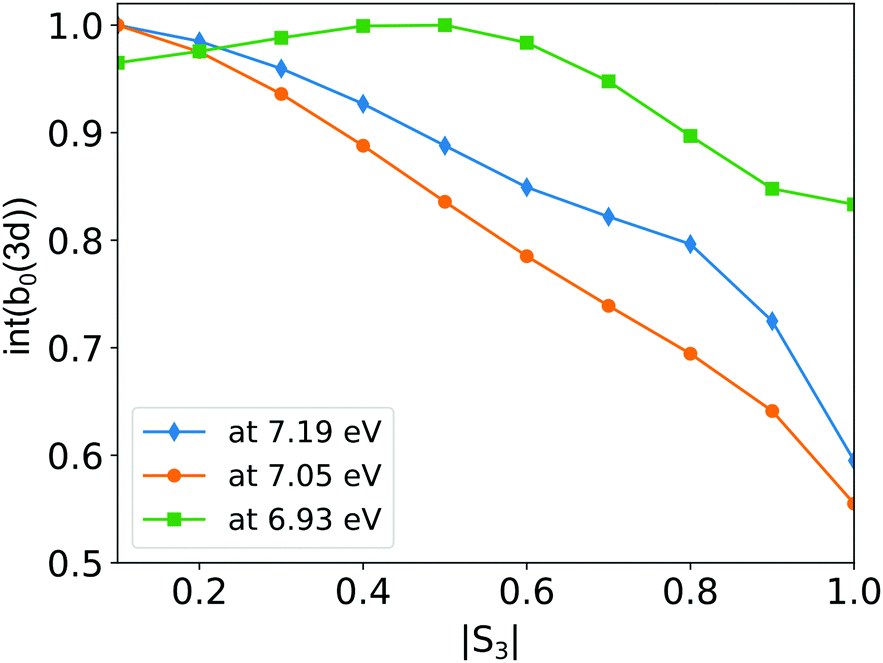 | ||
| Fig. 8 The PES is fitted by three Gaussian in order to extract the electron yield in the 3d channel as a function of |S3|, for different two-photon excitation energies. For each energy, the electron yield is normalized to its own maximum. | ||
In circular polarization, the 3d peak shows weak positive b1 and b3 asymmetry parameters. At S3 = −0.2, b1 is negative, reaching a value of b1/|S3| ∼ −5%, while b3 remains positive. The PEELD map shown on Fig. 7(f) reveals that the sign change in b1 occurs around |S3| = 0.5 for the 3d1 state and is associated with a slight shift in kinetic energy. The two lower photoelectron components, associated to the 3s and 3p ionization channels, show asymmetry parameters which behave as a function of |S3| similarly as at lower excitation energy. The only change that is observed concerns the 3s/3p branching ratio in the PES(b0) which does not vary as drastically as before as a function of |S3|. These results demonstrate that the 3p and 3s channels are not significantly affected by the population of 3d1 state. This suggests that no NAC from the 3d1 to the 3s or 3p bands takes place in this energy range over the 70 fs timescale of the experiment.
4.4 Excitation above the 3d threshold
As the excitation energy increases to 7.05 eV (352 nm pulses, Fig. 7(g–i)), which represents only a 120 meV increase with respect to the case of Fig. 7(d–f), the photoelectron spectrum drastically changes, showing an inversion of the excited state balance. The 3s channel becomes the weakest band while the 3d one dominates, especially at low |S3| (Fig. 7(h)). Interestingly, the ellipticity dependence of the PES also changes across this transition: while it was maximizing with S3 = 0.5 at 6.93 eV, the signal is maximum in linear polarization at 7.05 eV as shown in Fig. 8. This behavior is consistent with our TPA calculations, where the absorption to the 3d2 state, predicted about 100 meV above the 3d1 state, becomes very strong in linear polarization (Fig. 2(c)). We thus propose that the 3d1 state is populated at 6.93 eV, while the 3d2 state is reached at 7.05 eV and dominates the absorption, in particular close to linear polarization.At 7.05 eV two-photon energy, the PEELD maps are dominated by the 3d contribution (Fig. 7(i)). Interestingly, for this component we observe a sign inversion of b1 and b3 at low |S3| compared to the 6.93 eV excitation case. This inversion is also present for the signal originating from the 3p. The transition along |S3| now occurs beyond |S3| = 0.7 for the three ionization channels. This behavior suggests that while the 3d1 state was showing no sign of non-adiabatic coupling to 3s and 3p, the 3d2 state is significantly coupled to the 3p band.
As the excitation energy further increases, higher 3d states can be reached. The measurements show that exciting at 7.19 eV (343 nm pulses) does not significantly modify the ratio between the different components of the photoelectron spectrum, but strongly affects the chiroptical response, as shown in Fig. 9(f and i). The asymmetry is drastically lower (6 × 10⁻³versus 4 × 10⁻²) and does not show any clear transitions as a function of S3. We attribute this effect to the simultaneous excitation of the different 3d states, whose dichroisms could cancel each other. The PEELD from the 3p band almost completely vanishes at all |S3|, while the 3s band shows an almost constant, pure b1 contribution. This raises the question of the origin of this 3s band. Indeed, at such high excitation energy, direct excitation to the 3s and 3p is extremely unlikely.
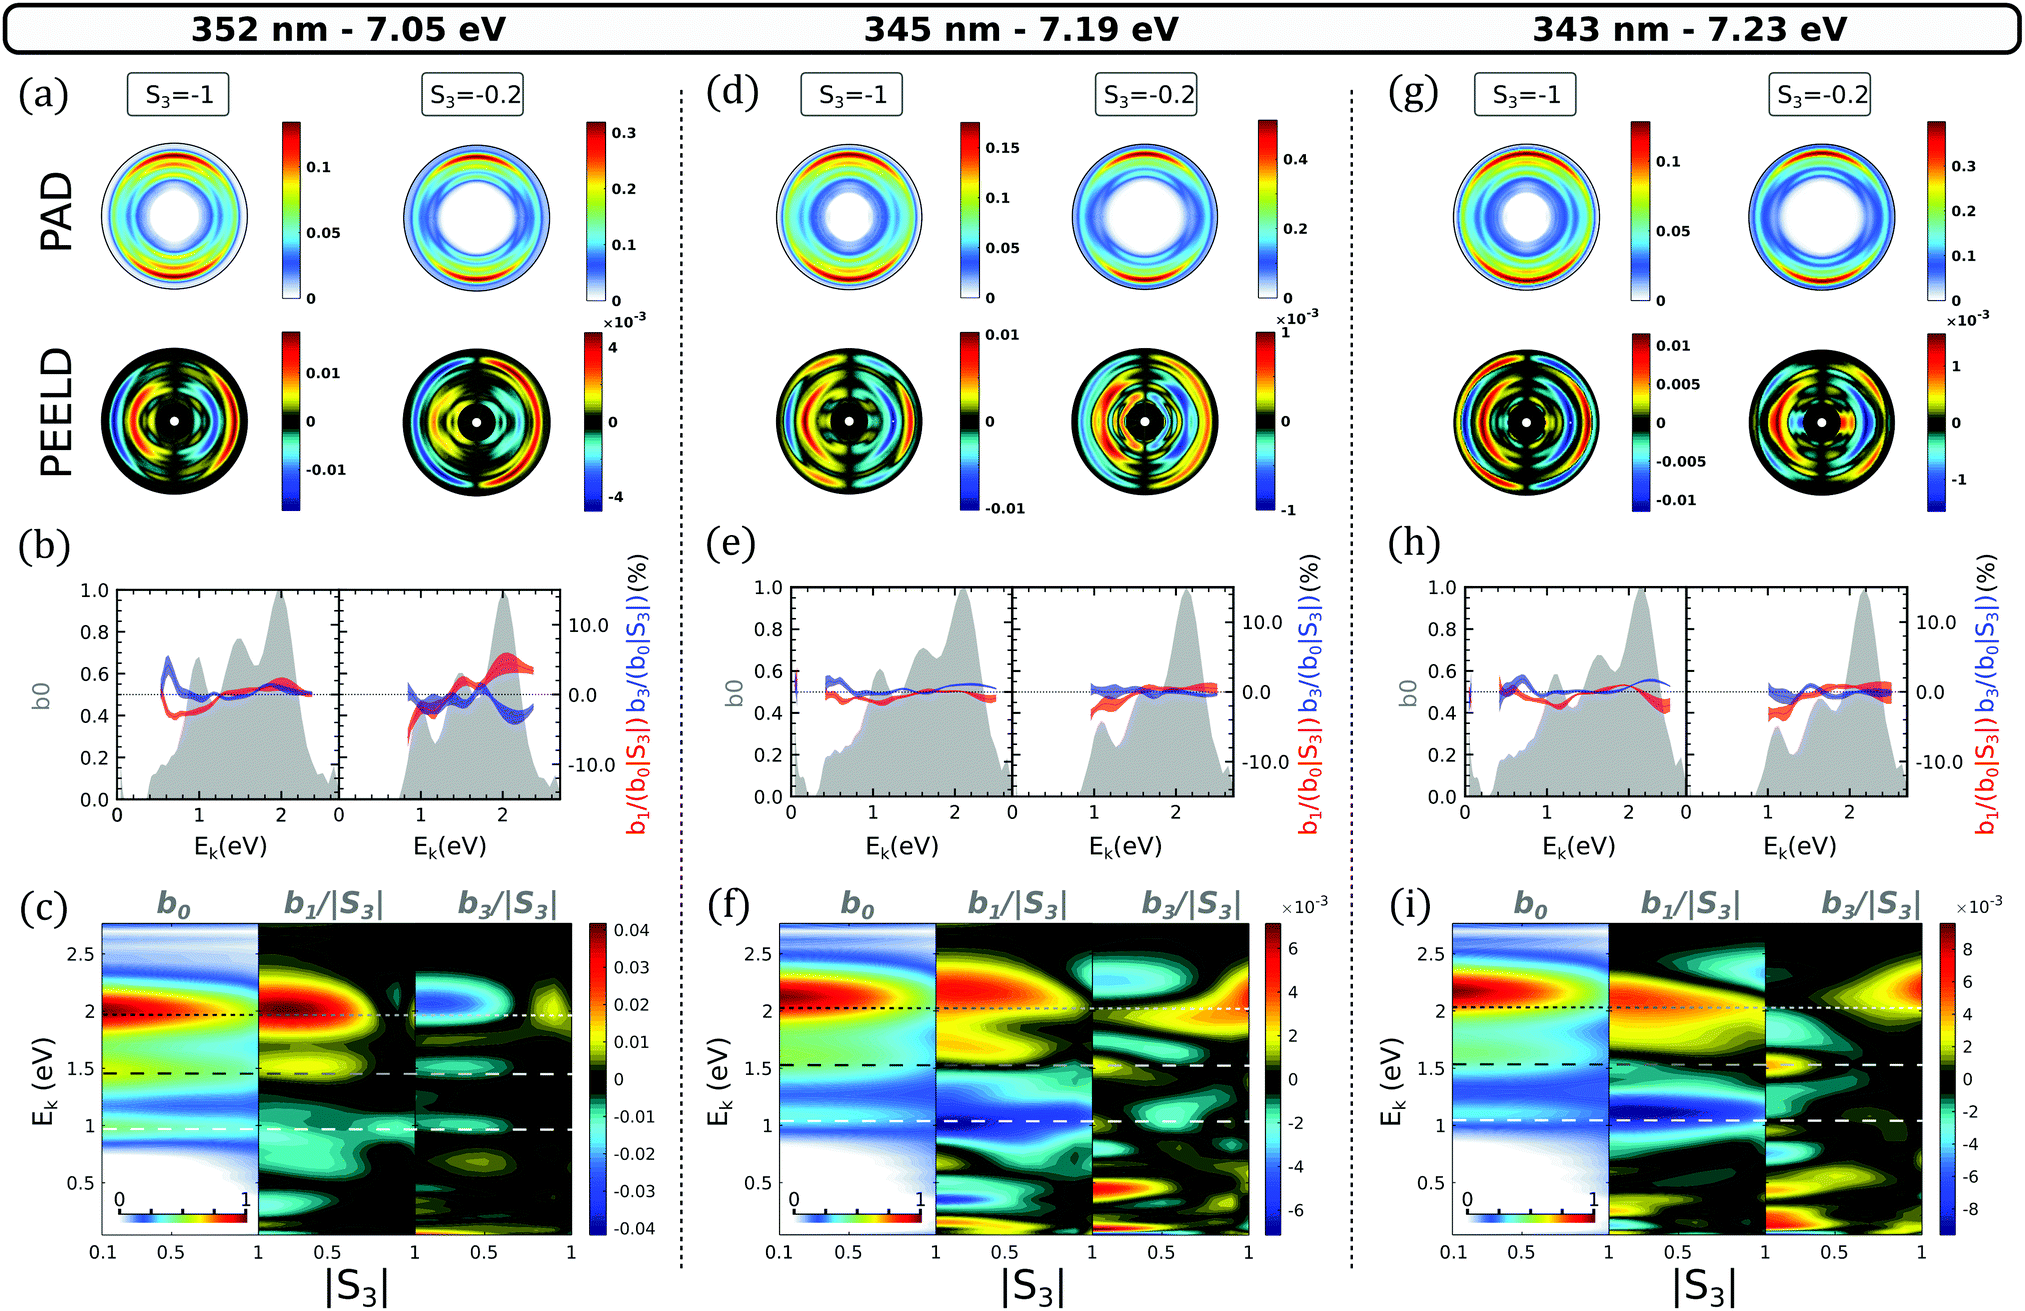 | ||
| Fig. 9 Same as Fig. 6 for two-photon excitation energies within the 3d band. | ||
We have identified at lower excitation energies the 3d2 → 3p and 3p2 → 3s NACs. Therefore, the 3d → 3p → 3s NAC cascade is a highly probable route to 3s population at high excitation energies. On the other hand, transitions from the 3d states to the excited σ → π* valence should also operate in this high energy range – Pulm et al.17 have demonstrated that this valence state efficiently mix with the 3d band. Internal conversion from this valence state to the 3s state, mediated by NACs, could also contribute to the present observations. Disentangling the contributions of each initial state and subsequent dynamics is difficult in this dense energy range and requires further experimental measurements with high resolution.
4.5 Usefulness of a continuously varied |S3| for fs-REMPI with M ≥ 2
Beyond the investigation of excitation and relaxation in chiral molecules, we think that a measured photoelectron spectra as a function of the ellipticity of the light as done in the present experiment could alleviate many of the challenges faced when several electronic states enter in the wavepacket composition created by the pump pulse. Indeed varying |S3| in a M ≥ 2 pump transition allows to vary the electronic content of the wavepacket, providing an additional easy way to test ab initio simulations of TR-PES and its consecutive assignments of specific spectral-temporal features. Fig. 10 that shows the variation of the PES(b0)-an achiral observable- as a function of the excitation energy in the 3s–3p range illustrates this point. The PES have been fitted by several Gaussian functions to extract the |S3| dependency of each channel as well as their bandwidth variation. The impact of the TPA dependency with |S3| for the 3p channel is apparent on Fig. 10(b), while the one for a direct excitation of the 3s is only visible for an excitation taking place below 6.4 eV (Fig. 10(a)). At higher energy, the |S3| dependency of the 3s channel reveals again the 3p–3s NAC at play. As the excitation energy increases, the 3s contribution shown in Fig. 10(c) is clearly decreasing, showing that the 3p–3s NAC efficiency is energy dependent. The NAC impact is also apparent on the bandwidth of the 3s that is more dependent on |S3| once the 3p band is resonant. In a more general context than chirality, Fig. 10 as well as Fig. 8 illustrate both how a |S3| continuous variation with Fourier-filtering could be used as an additional dimensionality in time-resolved photoelectron imaging used usually in femtochemistry. This constitutes a continuous and enriched version of the circular-linear dichroism, whose interest was recently pointed out by Singh et al.21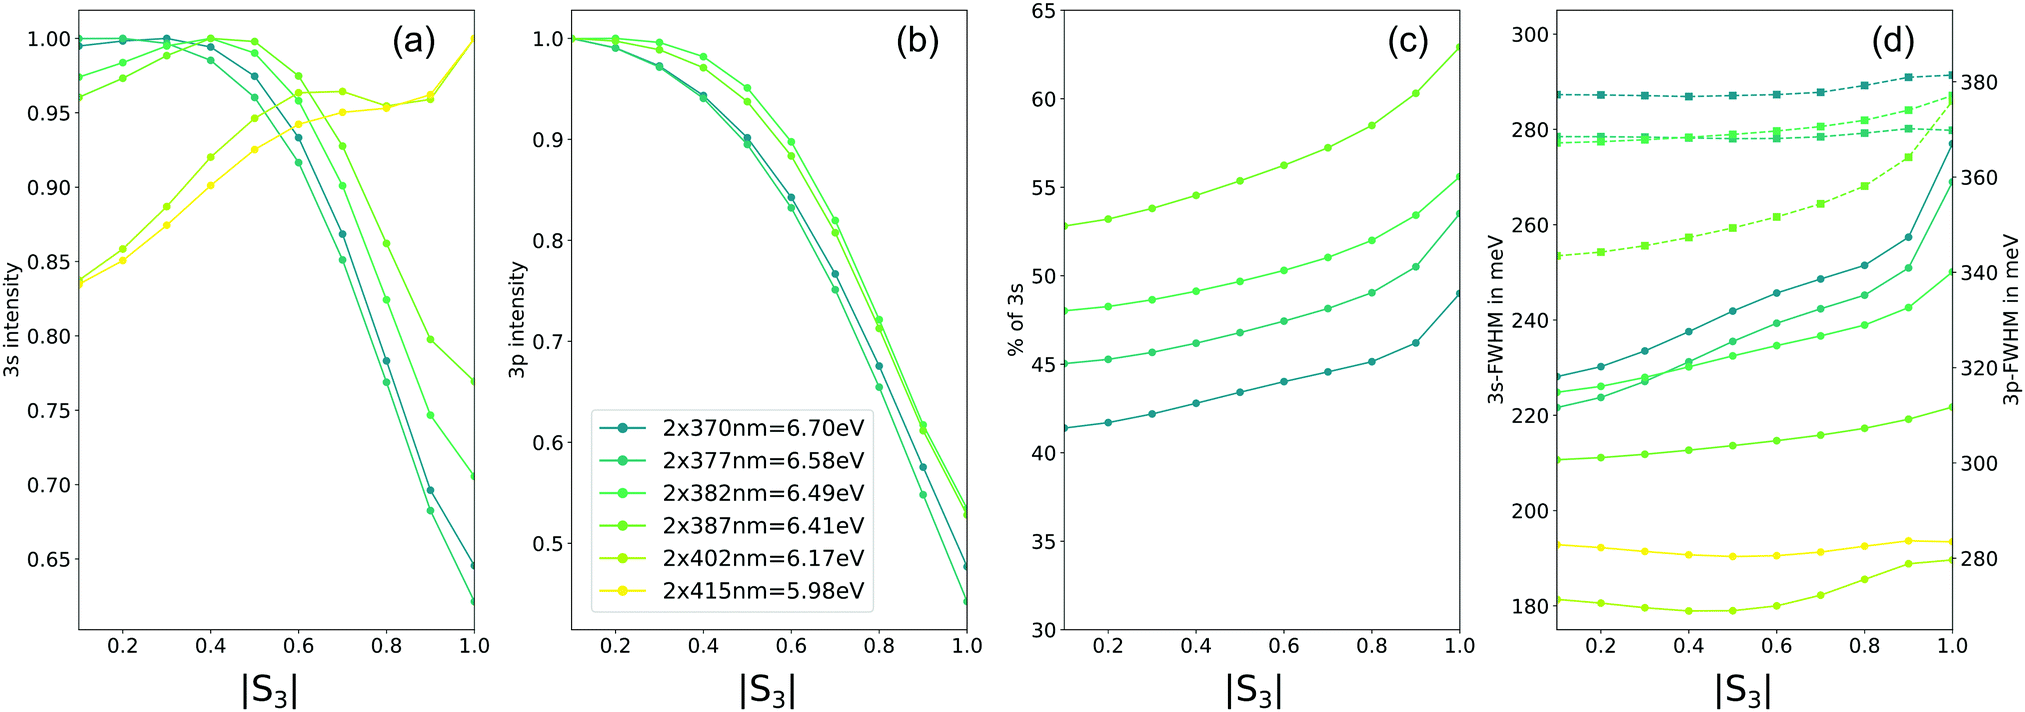 | ||
| Fig. 10 The PES(b0) has been fitted by a sum of Gaussians for each |S3| and wavelength to monitor at which |S3| the electron yield of (a) the 3s channel maximizes, (b) the 3p channel, or (c) the percentage of the 3s/(3s + 3p) in the PES, as well as (d) Bandwidths of 3s-mediated (full lines, left scale) and 3p-mediated (dashed lines, right scale) of these photoelectron bands. | ||
5 Conclusions
Using elliptically polarized laser pulses in resonance-enhanced multiphoton ionization enables modifying the anisotropy of excitation as well as the multiphoton absorption probabilities. Scanning the ellipticity thus considerably enriches the photoelectron spectroscopy. By revisiting the (2 + 1)-REMPI of fenchone molecules, we have shown that PEELD provides a higher sensitivity, revealing states that were almost dark in PECD signals. We have confirmed through the wealth of PEELD information that the 3s and 3p Rydberg states are strongly dynamically coupled, which results in the appearance of a second component of the 3s band in the photoelectron asymmetry. This effect could not be revealed in circularly polarized light. Several estimates of the duration of this process come from previous high-resolution work. We have taken a step further by experimentally reducing the upper bound of the time scale over which the non-adiabatic coupling takes place – it occurs in less than 70 fs. In the 3d band, the PEELD technique allowed us to highlight the role of different intermediate states in the asymmetry separated by only 120 meV. The forward/backward asymmetry in the electrons ejected through the 3d1 and 3d2 states are of opposite signs in elliptically polarized light, while they are of the same sign in circularly polarized light. Higher excitation of the 3d states leads to more complex relaxation dynamics, which cannot be safely assigned using the current results. Extending this study to higher photon energy could help us to better understand which states and couplings are involved. Performing time-resolved PEELD would provide a complete picture of the relaxation process. The use of high repetition rate Yb-based laser systems makes this goal achievable in a reasonable acquisition times. We thus believe that TR-PEELD could become a standard pump–probe technique to investigate chiral femtochemistry.Conflicts of interest
There are no conflicts to declare.Acknowledgements
We acknowledge Florent Guichard – Amplitude et Marcus Buetler – APE Angewandte Physik & Elektronik GmbH for experimental assistance, and Rodrigue Bouillaud, Nikita Fedorov and Laurent Merzeau for technical assistance. This project has received funding from the European Research Council (ERC) under the European Union's Horizon 2020 research and innovation program no. 682978 – EXCITERS and from 871124 – Laserlab-Europe. We acknowledge the financial support of the Région Nouvelle Aquitaine (RECHIRAM).Notes and references
- B. Ritchie, Phys. Rev. A: At., Mol., Opt. Phys., 1976, 13, 1411–1415 CrossRef.
- I. Powis, J. Chem. Phys., 2000, 112, 301–310 CrossRef CAS.
- N. Böwering, T. Lischke, B. Schmidtke, N. Müller, T. Khalil and U. Heinzmann, Phys. Rev. Lett., 2001, 86, 1187–1190 CrossRef PubMed.
- G. A. Garcia, L. Nahon, M. Lebech, J.-C. Houver, D. Dowek and I. Powis, J. Chem. Phys., 2003, 119, 8781–8784 CrossRef CAS.
- U. Hergenhahn, E. E. Rennie, O. Kugeler, S. Marburger, T. Lischke, I. Powis and G. Garcia, J. Chem. Phys., 2004, 120, 4553–4556 CrossRef CAS PubMed.
- L. Nahon, G. A. Garcia and I. Powis, J. Electron Spectrosc. Relat. Phenom., 2015, 204, 322–334 CrossRef CAS.
- C. S. Lehmann, N. B. Ram, I. Powis and M. H. M. Janssen, J. Chem. Phys., 2013, 139, 234307 CrossRef PubMed.
- C. Lux, M. Wollenhaupt, C. Sarpe and T. Baumert, ChemPhysChem, 2014, 16, 115–137 CrossRef PubMed.
- S. Beaulieu, A. Comby, B. Fabre, D. Descamps, A. Ferré, G. Garcia, R. Géneaux, F. Légaré, L. Nahon, S. Petit, T. Ruchon, B. Pons, V. Blanchet and Y. Mairesse, Faraday Discuss., 2016, 194, 325–348 RSC.
- A. Comby, S. Beaulieu, M. Boggio-Pasqua, D. Descamps, F. Légaré, L. Nahon, S. Petit, B. Pons, B. Fabre, Y. Mairesse and V. Blanchet, J. Phys. Chem. Lett., 2016, 7, 4514–4519 CrossRef CAS PubMed.
- V. Blanchet, D. Descamps, Y. Petit, S. Mairesse, B. Pons and B. Fabre, Phys. Chem. Chem. Phys., 2021, 23, 25612–25628 RSC.
- C. Lux, M. Wollenhaupt, C. Sarpe and T. Baumert, ChemPhysChem, 2015, 16, 115–137 CrossRef CAS PubMed.
- R. E. Goetz, C. P. Koch and L. Greenman, Phys. Rev. Lett., 2019, 122, 013204 CrossRef CAS PubMed.
- J. Miles, D. Fernandes, A. Young, C. Bond, S. Crane, O. Ghafur, D. Townsend, J. Sá and J. Greenwood, Anal. Chim. Acta, 2017, 984, 134–139 CrossRef CAS PubMed.
- A. Comby, E. Bloch, C. M. M. Bond, D. Descamps, J. Miles, S. Petit, S. Rozen, J. B. Greenwood, V. Blanchet and Y. Mairesse, Nat. Commun., 2018, 9, 5212 CrossRef CAS PubMed.
- A. Comby, C. M. Bond, E. Bloch, D. Descamps, B. Fabre, S. Petit, Y. Mairesse, J. B. Greenwood and V. Blanchet, Chirality, 2020, 32, 1225–1233 CrossRef CAS PubMed.
- F. Pulm, J. Schramm, J. Hormes, S. Grimme and S. D. Peyerimhoff, Chem. Phys., 1997, 224, 143–155 CrossRef CAS.
- T. H. Dunning, J. Chem. Phys., 1989, 90, 1007–1023 CrossRef CAS.
- R. A. Kendall, T. H. Dunning and R. J. Harrison, J. Chem. Phys., 1992, 96, 6796–6806 CrossRef CAS.
- D. E. Woon and T. H. Dunning, J. Chem. Phys., 1994, 100, 2975–2988 CrossRef CAS.
- D. P. Singh, N. De Oliveira, G. A. Garcia, A. Vredenborg and I. Powis, ChemPhysChem, 2020, 21, 2468–2483 CrossRef CAS PubMed.
- A. Kastner, G. Koumarianou, P. Glodic, P. C. Samartzis, N. Ladda, S. T. Ranecky, T. Ring, S. Vasudevan, C. Witte, H. Braun, H.-G. Lee, A. Senftleben, R. Berger, G. B. Park, T. Schäfer and T. Baumert, Phys. Chem. Chem. Phys., 2020, 22, 7404–7411 RSC.
- A. Kastner, T. Ring, B. C. Krüger, G. B. Park, T. Schäfer, A. Senftleben and T. Baumert, J. Chem. Phys., 2017, 147, 013926 CrossRef PubMed.
- D. P. Singh, J. O. F. Thompson, K. L. Reid and I. Powis, J. Phys. Chem. Lett., 2021, 11438–11443 CrossRef CAS PubMed.
- E. Runge and E. K. U. Gross, Phys. Rev. Lett., 1984, 52, 997–1000 CrossRef CAS.
- T. Yanai, D. P. Tew and N. C. Handy, Chem. Phys. Lett., 2004, 393, 51–57 CrossRef CAS.
- A. Kastner, T. Ring, H. Braun, A. Senftleben and T. Baumert, ChemPhysChem, 2019, 20, 1–5 CrossRef.
- G. A. Garcia, L. Nahon and I. Powis, Rev. Sci. Instrum., 2004, 75, 4989–4996 CrossRef CAS.
- H. Ganjitabar, G. A. Garcia, L. Nahon and I. Powis, J. Chem. Phys., 2020, 153, 034302 CrossRef CAS PubMed.
- L. Nahon, G. A. Garcia, C. J. Harding, E. Mikajlo and I. Powis, J. Chem. Phys., 2006, 125, 114309 CrossRef PubMed.
- C. Lux, M. Wollenhaupt, T. Bolze, Q. Liang, J. Köhler, C. Sarpe and T. Baumert, Angew. Chem., Int. Ed., 2012, 51, 5001–5005 CrossRef CAS PubMed.
| This journal is © the Owner Societies 2022 |