 Open Access Article
Creative Commons Attribution 3.0 Unported Licence
Influence of the coffee-ring effect and size of flakes of graphene oxide films on their electrochemical reduction†
Yiqing
Wang
and
Siegfried
Eigler
 *
*
Institute of Chemistry and Biochemistry, Freie Universität Berlin, Takustraße 3, 14195 Berlin, Germany. E-mail: siegfried.eigler@fu-berlin.de
First published on 9th March 2022
Abstract
Electrodes for electrochemical reduction of graphene oxide (GO) are coated with thin films using drop-casting and evaporation-assisted self-assembly. The influence of loading, the size of the flakes of GO, and the macroscopic coffee-ring effect occurring during drying are investigated. The effective transfer of protons and electrons in the electrochemical reduction of GO is decisive.
Electrochemically reduced graphene oxide (ERGO) can be generated facilely and be widely used for various electrochemical sensors.1 ERGO-modified electrodes are primarily prepared as thin-film materials on conducting substrates by drop-casting in basic and applied research.2–4 Thus, ERGO has been studied as an electrochemically active material.5–11 Moreover, the electrochemical reduction of GO was studied under acidic and basic pH and in organic media. The C/O ratios determined by XPS were identified to be 3.8, 7.8, and 1.8, respectively. The presence of protons in acidic and alkaline media and water as a proton donor make the reduction more efficient. The role of protons (H+) plays an essential role in the reduction mechanism of GO.12 In another study, the essential role of H+ in the electrochemical reduction was identified by recording linear sweep voltammograms by lowering the pH values. Thus, the potentials of the reduction peaks shifted negatively with increasing pH values.13 ERGO can generally be obtained by cyclic voltammetry and chronoamperometry.14 Some reports use cyclic voltammetry and identify the reduction of different kinds of oxygen functional groups at different potentials.15 However, generally speaking, the surfaces of GO and oxo-functionalized graphene (oxoG: derivative of GO with defined structures), respectively, are decorated mainly with hydroxyl groups that formally need one electron and one proton for reduction and epoxy groups that require two electrons and two protons for reduction, since they must first be opened for transformation into hydroxyl groups.
These reactions may not only be influenced by the applied voltage but also by the GO itself, such as the degree of oxidation, the size of the flakes, the amount of loading, etc. Bonanni et al. showed that oxidative debris in GO determined the inherent electrochemical activity.6 It was reported that the thickness of GO films influenced the performance of electrodes, as defined by the amount of loading. Thus, with increasing GO loading, the reduction rate decreased. A possible reason reported was that functional oxo-groups blocked the electron pathway between the sp2 carbon regions, preventing carrier transport, thus leading to a decrease in reduction rate.5 It was shown in recent studies that the size of the flakes of GO and the thickness of the films had a significant effect on the permeability of water, ions, and organic molecules,16,17 and it was noted that the mechanism of electrochemical reduction was not fully understood and must be further studied.18
Here we show that the electrochemical potential and thus the reduction rate needed to reduce oxoG are determined by the interaction with the electrolyte, loading of oxoG, coffee-ring effect, and size of the flakes. We use oxoG in this study, instead of common GO, which is a derivative of GO with defined surface chemistry and density of lattice defects, as described in detail in recent studies.19,20 Different sizes of flakes were obtained by ultrasonication. The obtained materials were dropped on the surface of a glassy carbon electrode (GCE) for electrochemical reduction. First, we use different sizes of flakes (from 18.2 to about 0.1 μm) with the same loading; then, we change the loading (from 40 to 6 μg) with the same flake size. From the areas of the reduction peaks and X-ray photoelectron spectroscopy (XPS) spectra, we conclude that the size of the flakes and the loading have significant impacts on the electrochemical reduction.
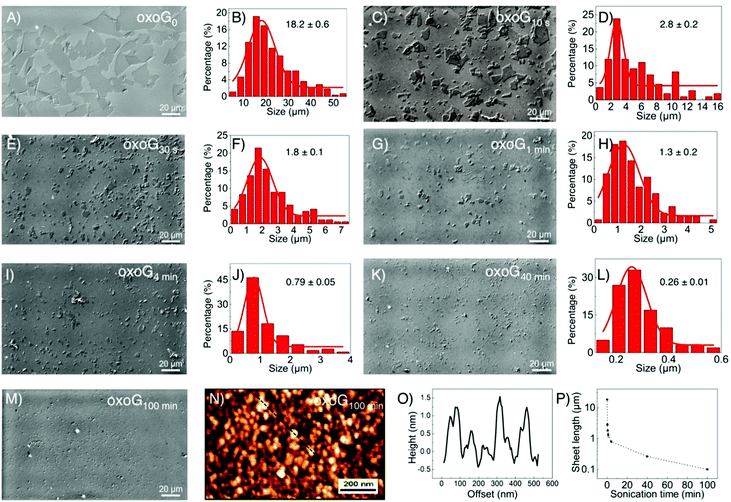
First, oxoG was synthesized according to our previously described procedures, as described in brief in the ESI.† As shown in Fig. 1A and B, the lateral dimension of the initial flakes of oxoG obtained after centrifugation is 18.2 μm (oxoG0). Different times of sonication were used to produce flakes of oxoG with different sizes of flakes, and the samples are denoted according to the various times of sonication as oxoGx (index: sonication time, between 10 s and 100 min). Accordingly, electrochemically reduced oxoG with varying times of sonication is termed as ERoxoGx. In Fig. 1C–L, the optical microscopy images of the oxoG series of flakes and the histograms of the size distributions are presented. Some tiny particles can be observed in the optical microscopy image of oxoG100 min, Fig. 1M. The AFM image in Fig. 1N reveals at least small particles, <100 nm, including plausibly oxidative debris. The corresponding height profiles are depicted in Fig. 1O. Thus, the sonication process yields flakes with average lateral dimensions of 2.8, 1.8, 1.3, 0.79, 0.26 μm, and less than 0.1 μm, respectively. The different sizes of flakes of oxoG obtained after sonication versus time are also shown in Fig. 1P, basically following the rational findings, which we identified before, taking the mechanical force during sonication into account.21,22 Only ten seconds of sonication are needed to reduce the mean lateral dimensions of the flakes to 5 μm, and after five minutes of sonication, the sizes of the flakes are below 1 μm. To ensure the reproducibility of the sonication process, we fixed a vial with an aqueous dispersion with a content of 1 mg mL−1 of oxoG0 in the same position of the sonicator.
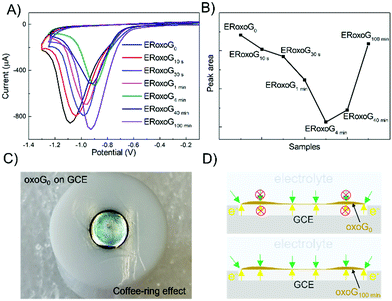
For electrochemical reduction, 6 μg of oxoG were deposited on the surface of a GCE. The electrochemical reduction of oxoG100 min was accomplished under a pH of 7.4 for reference by cyclic voltammetry and the obtained graph is shown in Fig. S1 (ESI†). The black line represents the first scan, and the red lines show the remaining 4 scans, indicating the complete reduction after the first cycle. Further cycling of the potential reveals no additional reduction peak, indicating that the removal of oxo-groups of oxoG100 min is complete after the first scan.23 The cyclic voltammetry (CV) curves of all the samples are depicted in Fig. 2A, and the areas of the reduction peaks are shown in Fig. 2B. We obtained the total charge passed during the reduction process by integration of the areas of the reduction peaks.
The electrochemical reduction process can be expressed as follows:
| GO + aH+ + ne− → ERoxoG + bH2O |
where n is the number of moles of electron transfer, Q is the overall charge, obtained from the reduction peak of Fig. 2A, F is the Faraday constant, and z is the number of exchanged electrons per oxo-group. Therefore, we use the area of the reduction peak to conclude the amount of reduced oxo-groups. It can be seen from Fig. 2A that as the flake size decreases, the reduction peak gradually shifts to less negative potentials (from −1.1 V to −0.9 V), while the area of the reduction peak first decreases and then increases. The gradual shift of the reduction peak to the right means that the reduction rate of small-sized oxoG is increased. However, the reduction peak area of oxoG100 min, which owns the smallest flakes is much larger than that of oxoG40 min, which is almost equivalent to that of oxoG0. This means that the reducible oxo-groups of the oxoG film increased after sonication with decreasing size of the flakes. It has been reported that ultrasonication can increase the oxidation degree of GO when the GO has a weak oxidation degree.24 However, we found that it is not the sonication process that increases the degree of oxidation of oxoG100 min and it is thus not responsible for the increased reduction peak. We investigated by XPS measurement the effect of functionalization as a result of sonication time for the samples of oxoG0 and oxoG100 min, which have almost the same reduction peak, and oxoG4 min, which has the smallest reduction peak area.
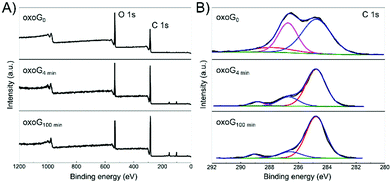
Fig. 3A illustrates the XPS survey spectra of oxoG0, oxoG4 min, and oxoG100 min. The C/O ratio of oxoG is 2.1 and changes to 3.1 for oxoG4 min and 3.2 for oxoG100 min. It can be seen that the oxygen content first decreases with sonication. However, as the sonication time is extended, the C/O ratio remains almost the same. High-resolution C 1s XPS spectra of all the samples can be deconvoluted into three peaks (Fig. 3B). The peak at binding energies of 284.8 eV corresponds to C![[double bond, length as m-dash]](https://www.rsc.org/images/entities/char_e001.gif) C sp2 bonds. For the rest of the peaks, especially the C–O peak intensity at a binding energy of 286.7 eV decreases obviously with the prolongation of the ultrasonication time, which may be a consequence of local energy not dissipating using a sonication bath.6,23,25 When the size of the flakes and the degree of oxidation is reduced, the corresponding materials (e.g., oxoG100 min) can be further reduced electrochemically. From the reported permeability studies of GO films, we speculate that this is related to the permeability of the oxoG film to water formed by drop casting.26,27 GO films produced by evaporation-assisted self-assembly have a random morphology with some ring-shaped patterns (coffee-ring effect) (Fig. 2C) and the films have a very low pervaporation performance.3,26,28,29 As shown in Fig. 2D, for the coffee-ring, the ring area is thicker than the edge. However, we hypothesize that for a membrane composed of small flakes (oxoG100 min), the electrolyte permeability is better at the ring than for larger flakes (oxoG0), and the rate of reduction thus increases.
C sp2 bonds. For the rest of the peaks, especially the C–O peak intensity at a binding energy of 286.7 eV decreases obviously with the prolongation of the ultrasonication time, which may be a consequence of local energy not dissipating using a sonication bath.6,23,25 When the size of the flakes and the degree of oxidation is reduced, the corresponding materials (e.g., oxoG100 min) can be further reduced electrochemically. From the reported permeability studies of GO films, we speculate that this is related to the permeability of the oxoG film to water formed by drop casting.26,27 GO films produced by evaporation-assisted self-assembly have a random morphology with some ring-shaped patterns (coffee-ring effect) (Fig. 2C) and the films have a very low pervaporation performance.3,26,28,29 As shown in Fig. 2D, for the coffee-ring, the ring area is thicker than the edge. However, we hypothesize that for a membrane composed of small flakes (oxoG100 min), the electrolyte permeability is better at the ring than for larger flakes (oxoG0), and the rate of reduction thus increases.
 | ||
| Fig. 3 (A) XPS survey spectra and (B) high-resolution C 1s XPS spectra of oxoG0, oxoG4 min, and oxoG100 min showing the changes of oxygen functional groups after sonication. | ||
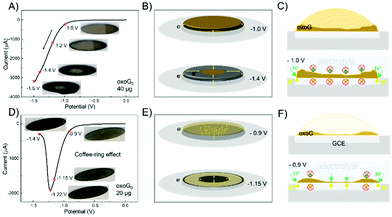
To confirm the above speculation, we increased the loading of oxoG0 from 6 μg for recording CVs shown in Fig. 2B to 40 μg, as depicted in Fig. 4A, and 20 μg in Fig. 4D to capture the influence of the film surface during the reduction (insets are taken from Videos S1 and S2, ESI†). In Fig. 4A and C, with 40 μg of oxoG on the surface of the GCE, a thick film is generated (concentration of oxoG solution was around 5 mg mL−1 to reduce the coffee-ring effect). The voltage range is from 0 to 1.5 V, with a scan rate of 50 mV s−1. A progressively larger black ring can be observed from the inset images when the voltage is driven from −1.0 to −1.5 V. Only the edge of the film is directly and simultaneously in contact with the electrolyte and electrode surface at the potential of −1.0 V (bottom of Fig. 4C). It can be observed that the reduction advances slowly from the edge of the film to the center (Fig. 4B). So, we can speculate that the water and H+ cannot penetrate the film, and the H+ required for the reduction reaction comes from the water adsorbed in the oxoG layer.9,30 The curve in Fig. 4D shows the completion of the reduction process at −1.4 V. To facilitate the observation of the whole reduction process, the sweep speed is set to 50 mV s−1. No significant change of the colour of the film's surface is observed before reaching the potential of −0.9 V, as the inset photographs show. In the course of reduction, a black central area and edge area appear at the potential of −1.15 V, indicating that some of the areas had been reduced. When the voltage reaches −1.22 V, the black area on the film's surface expands simultaneously from the center to the edge and from the edge to the center. This phenomenon is explained in the schematic of Fig. 4E. Fig. 4F shows the cross-sectional view of the film formation process on the glassy carbon electrode and the cross-sectional view at -0.9 V. It is difficult to use the camera to observe the changes in the electrode surface clearly when the loading is 6 μg. In order to increase the clarity of the video, we use a 20 μg loading to detect the coffee-ring effect of Fig. 4D (the concentration of the oxoG solution was 1 mg mL−1). Fig. 4D shows the results with a loading of 20 μg. The film derived from the coffee-ring effect is not uniform (Fig. 4F, top). The water and H+ can only penetrate the thinner central area. Therefore, the permeable central area and the edge of the film can be reduced through the electrolyte. Thus, the required H+ for reduction is delivered from the electrolyte. In contrast, the reduction of other areas requires H+ from water in the oxoG layer, a highly pH-sensitive process, requiring more negative potentials at the pH of 7.4, as used here. Based on the above findings, we conclude that when the loading is small, the coffee-ring effect is more obvious, and the part of the film near the edge is thicker than that of the center, which makes it impermeable for the H+ and water, leading to a reduced reduction rate and efficiency of electrochemical reduction.
 | ||
| Fig. 4 (A) Cyclic voltammograms obtained from the electrochemical reduction of oxoG0 scanned over the full range from 0 to −1.5 V. The loading of the GCE is 40 μg. Scan rate: 50 mV s−1. Insets: Images of the film on the GCE at the potentials of −1.0, −1.2, −1.4, and −1.5 V. (B) Schematics of electron transfer for oxoG0 reduction at the potentials of −1.0 and −1.4 V (loading: 40 μg). (C) Top: cross-sectional view of the film formation process on the glassy carbon electrode; bottom: cross-sectional views at −1.0 V in Fig. 4A and B. (D) Cyclic voltammograms obtained by the electrochemical reduction of oxoG0 scanned over the range from 0 to −1.4 V; the loading of the GCE is 20 μg. Scan rate: 50 mV s−1. Insets: Images of the film on the GCE at the potentials of −0.9, −1.15, −1.22, and −1.4 V. (E) Schematics of electron transfer for oxoG0 reduction at the potentials of −0.9 and −1.15 V (loading: 20 μg). (F) Top: cross-sectional view of the film formation process on the glassy carbon electrode; bottom: cross-sectional views at −0.9 V in (D) and (E). All starting potentials are relative to the Ag/AgCl reference electrode. | ||
In Fig. 2A, the reduction efficiency and rate are improved when the flakes are small, especially for oxoG100 min. Thus, the film composed of small-size flakes has a better permeability to electrolytes.
Overall, we investigated the reduction of films of flakes of oxoG on a GCE with lateral dimensions between 18 μm and less than 100 nm. Drop casting a small amount of oxoG solution on a GCE will cause the coffee-ring effect. In this case, the electrochemical reduction is divided into two processes: the electrolyte can directly provide H+ for the reduction, when the electrolyte can penetrate the film. The process occurs at the central area and edge of the film. When the film is impermeable, the H+ stems from the water adsorbed on oxoG, at a pH of 7.4. The oxoG film composed of small flakes (oxoG100 min) has good permeability and can weaken the drawback of the coffee-ring effect on the electrochemical reduction. Consequently, the electrochemical reduction of oxoG is affected by both the size of the flakes and the loading. This work provides inspiration for the electrochemical functionalization of two-dimensional (2D) materials and the design of 2D composite materials. It is shown that the reduction of oxoG may occur at very different potentials, although the materials compositions are very similar, however, with varying sizes of flakes. We further conclude that the permeability of the films has a very important effect on the reduction potentials. Thus, if the 2D materials are used as an electrocatalyst or sensing material, the performance will alter with the morphology, as quantified by reducing oxoG in this study. Thus, the results indicate that they appear beneficial for applications, since the composite materials containing GO are permeable to electrolyte molecules to increase electrode performance.
Conflicts of interest
There are no conflicts to declare.Acknowledgements
This research is supported by the China Scholarship Council (CSC). This research was funded by the Deutsche Forschungsgemeinschaft (DFG, German Research Foundation, project number 392444269). R. T. Qie and P. Zhu from the Technical University of Denmark are acknowledged for conducting XPS measurements.Notes and references
- A. Ambrosi, C. K. Chua, N. M. Latiff, A. H. Loo, C. H. Wong, A. Y. Eng, A. Bonanni and M. Pumera, Chem. Soc. Rev., 2016, 45, 2458–2493 RSC.
- A. Kaliyaraj Selva Kumar, Y. Zhang, D. Li and R. G. Compton, Electrochem. Commun., 2020, 121, 106867 CrossRef CAS.
- H. Li, D. Buesen, R. Williams, J. Henig, S. Stapf, K. Mukherjee, E. Freier, W. Lubitz, M. Winkler, T. Happe and N. Plumere, Chem. Sci., 2018, 9, 7596–7605 RSC.
- Y. Wang, F. Yu, M. Zhu, C. Ma, D. Zhao, C. Wang, A. Zhou, B. Dai, J. Ji and X. Guo, J. Mater. Chem. A, 2018, 6, 2011–2017 RSC.
- Y. Zhang, H. Hao and L. Wang, Appl. Surf. Sci., 2016, 390, 385–392 CrossRef CAS.
- A. Bonanni, A. Ambrosi, C. K. Chua and M. Pumera, ACS Nano, 2014, 8, 4197–4204 CrossRef CAS PubMed.
- J. Kauppila, P. Kunnas, P. Damlin, A. Viinikanoja and C. Kvarnström, Electrochim. Acta, 2013, 89, 84–89 CrossRef CAS.
- A. Viinikanoja, Z. Wang, J. Kauppila and C. Kvarnstrom, Phys. Chem. Chem. Phys., 2012, 14, 14003–14009 RSC.
- K. W. Silverstein, C. E. Halbig, J. S. Mehta, A. Sharma, S. Eigler and J. M. Mativetsky, Nanoscale, 2019, 11, 3112–3116 RSC.
- X. Feng, W. Chen and L. Yan, RSC Adv., 2016, 6, 80106–80113 RSC.
- A. G. Marrani, R. Zanoni, R. Schrebler and E. A. Dalchiele, J. Phys. Chem. C, 2017, 121, 5675–5683 CrossRef CAS.
- J. A. Quezada-Renteria, C. O. Ania, L. F. Chazaro-Ruiz and J. R. Rangel-Mendez, Carbon, 2019, 149, 722–732 CrossRef CAS.
- M. Zhou, Y. Wang, Y. Zhai, J. Zhai, W. Ren, F. Wang and S. Dong, Chem. – Eur. J., 2009, 15, 6116–6120 CrossRef CAS PubMed.
- A. Y. Eng, A. Ambrosi, C. K. Chua, F. Sanek, Z. Sofer and M. Pumera, Chem. – Eur. J., 2013, 19, 12673–12683 CrossRef CAS PubMed.
- M. Gao, Y. Xu, X. Wang, Y. Sang and S. Wang, Electroanalysis, 2016, 28, 1377–1382 CrossRef CAS.
- K. G. Zhou, K. S. Vasu, C. T. Cherian, M. Neek-Amal, J. C. Zhang, H. Ghorbanfekr-Kalashami, K. Huang, O. P. Marshall, V. G. Kravets, J. Abraham, Y. Su, A. N. Grigorenko, A. Pratt, A. K. Geim, F. M. Peeters, K. S. Novoselov and R. R. Nair, Nature, 2018, 559, 236–240 CrossRef CAS PubMed.
- R. Joshi, P. Carbone, F.-C. Wang, V. G. Kravets, Y. Su, I. V. Grigorieva, H. Wu, A. K. Geim and R. R. Nair, Science, 2014, 343, 752–754 CrossRef CAS PubMed.
- M. Pumera, Chem. Soc. Rev., 2010, 39, 4146–4157 RSC.
- C. E. Halbig, R. Lasch, J. Krull, A. S. Pirzer, Z. Wang, J. N. Kirchhof, K. I. Bolotin, M. R. Heinrich and S. Eigler, Angew. Chem., Int. Ed., 2019, 58, 3599–3603 CrossRef CAS PubMed.
- Y. Hu, Q. Cao, C. Neumann, T. Lehnert, F. Börrnert, Y. Wang, U. Kaiser, A. Turchanin and S. Eigler, Carbon, 2021, 185, 568–577 CrossRef CAS.
- T. J. Nacken, C. E. Halbig, S. E. Wawra, C. Damm, S. Romeis, J. Walter, M. J. Tehrani, Y. Hu, Y. Ishii, S. Eigler and W. Peukert, Carbon, 2017, 125, 360–369 CrossRef CAS.
- C. E. Halbig, T. J. Nacken, J. Walter, C. Damm, S. Eigler and W. Peukert, Carbon, 2016, 96, 897–903 CrossRef CAS.
- Y. Wang, F. Grote, Q. Cao and S. Eigler, J. Phys. Chem. Lett., 2021, 12, 10009–10014 CrossRef CAS PubMed.
- X. Qi, T. Zhou, S. Deng, G. Zong, X. Yao and Q. Fu, J. Mater. Sci., 2013, 49, 1785–1793 CrossRef.
- Y. Wang, C. Neumann, M. Hußmann, Q. Cao, Y. Hu, O. Garrity, P. Kusch, A. Turchanin and S. Eigler, Adv. Mater. Interfaces, 2021, 8, 2100783 CrossRef CAS.
- C.-H. Tsou, Q.-F. An, S.-C. Lo, M. De Guzman, W.-S. Hung, C.-C. Hu, K.-R. Lee and J.-Y. Lai, J. Membr. Sci., 2015, 477, 93–100 CrossRef CAS.
- L. Nie, K. Goh, Y. Wang, J. Lee, Y. Huang, H. E. Karahan, K. Zhou, M. D. Guiver and T.-H. Bae, Sci. Adv., 2020, 6, eaaz9184 CrossRef CAS PubMed.
- D. S. Eom, J. Chang, Y. W. Song, J. A. Lim, J. T. Han, H. Kim and K. Cho, J. Phys. Chem. C, 2014, 118, 27081–27090 CrossRef CAS.
- P. Su, F. Wang, Z. Li, C. Y. Tang and W. Li, J. Mater. Chem. A, 2020, 8, 15319–15340 RSC.
- H. Bi, K. Yin, X. Xie, J. Ji, S. Wan, L. Sun, M. Terrones and M. S. Dresselhaus, Sci. Rep., 2013, 3, 2714 CrossRef PubMed.
Footnote |
| † Electronic supplementary information (ESI) available: General methods, and cyclic voltammetry. See DOI: 10.1039/d1cp05015j |
| This journal is © the Owner Societies 2022 |


