 Open Access Article
Dual-photofunctional organogermanium compound based on donor–acceptor–donor architecture†
Aleksandra
Nyga‡
 a,
Takahito
Kaihara‡
b,
Takumi
Hosono
b,
Massimiliano
Sipala
a,
Patrycja
Stachelek
c,
Norimitsu
Tohnai
b,
Satoshi
Minakata
a,
Takahito
Kaihara‡
b,
Takumi
Hosono
b,
Massimiliano
Sipala
a,
Patrycja
Stachelek
c,
Norimitsu
Tohnai
b,
Satoshi
Minakata
 b,
Leonardo Evaristo
de Sousa
 d,
Piotr
de Silva
 *d,
Przemyslaw
Data
 *a and
Youhei
Takeda
 *b
*b
aFaculty of Chemistry, Silesian University of Technology, M. Strzody 9, 44-100, Gliwice, Poland. E-mail: przemyslaw.data@polsl.pl
bDepartment of Applied Chemistry, Graduate School of Engineering, Osaka University, Yamadaoka 2-1, Suita, Osaka 565-0871, Japan. E-mail: takeda@chem.eng.osaka-u.ac.jp
cChemistry Department, Durham University, South Road, Durham DH1 3LE, UK
dDepartment of Energy Conversion and Storage, Technical University of Denmark, Anker Engelunds Vej 301, 2800 Kongens Lyngby, Denmark. E-mail: pdes@dtu.dk
First published on 20th April 2022
Abstract
A dual-photofunctional organogermanium compound based on a donor–acceptor–donor architecture that exhibits thermally activated delayed fluorescence and mechano-responsive luminochromism has been developed. The developed compound was successfully applied as an emitter for efficient organic light-emitting diodes.
Organogermanes have attracted attention in a wide variety of research fields such as organometallic chemistry,1 biology,2 and catalysis.3 In sharp contrast, the utilization of organogermanium compounds and polymers as optoelectronic materials has been rarely exploited.4–6 For example, tetraaryl germanes and related polymers have been used as host materials for organic light-emitting diodes (OLEDs), by utilizing the high triplet energy and adequate carrier transport capability.4 Also, a systematic study of blue-emitters based on phenothiaborin-connected acridan analogues with group 14 elements including germanium for non-doped efficient OLEDs has been reported.5 Given unique characteristics of organogermanes such as a large atomic radius (122 pm), electropositive nature (χp = 2.01), and capability of σ–π conjugation, the development of novel Ge-containing organic functional materials would offer us great opportunities to cultivate design principles for a new class of functional materials. Specifically, the diminished σ–π conjugation ability of Ge element when compared with Si allows for higher-energy triplet excited states than the corresponding silicon compounds.4 Since the triplet energy is a limiting factor for determining the emission color of thermally activated delayed fluorescent (TADF),7 donor–acceptor (D–A) type organogermanes are promising for realizing high-energy TADF (blue to green).5
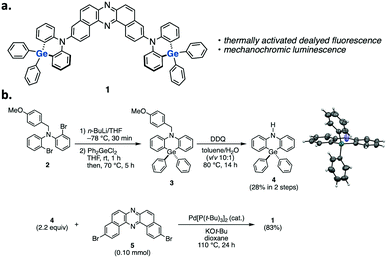
Herein, we disclose the development of a dual-photofunctional Ge-containing donor–acceptor–donor (D–A–D) type compound 1 (Fig. 1a). Notably, the developed compound represents a rare example of luminescent organogermanium compounds,5,8 and it nicely shows dual photofunctionality of TADF and mechano-responsive luminochromism.9 Furthermore, compound 1 serves as the first example of green-TADF emitter based on organogermanium for an efficient OLED device.
The synthetic route to compound 1 is shown in Fig. 1b (for the details, see the ESI†). We initially developed a synthetic method for dihydrophenazagermine 4, starting from N-protected dibromo diarylamine 2. Dilithiation of 2 followed by trapping with Ph2GeCl2 and detaching the N-p-methoxybenzyl (PMB) group with DDQ afforded 4. The X-ray diffraction analysis of the single crystal 4 revealed that the angle between two phenylene planes is 173° (the inset figure in Scheme S1, for the details, see Table S1, ESI†), which is larger than that of its Si analogue (ca. 133°) in a D–A system.5 This planar structure of the donor would be ascribed to the longer Ge–C bond (ca. 1.93 Å) when compared to Si–C bond (ca. 1.85 Å).5 D–A–D compound 1 was successfully synthesized through a Pd-catalyzed Buchwald–Hartwig amination of 3,11-dibromo-dibenzophenazine 510 with donor 4 (Fig. 1b).
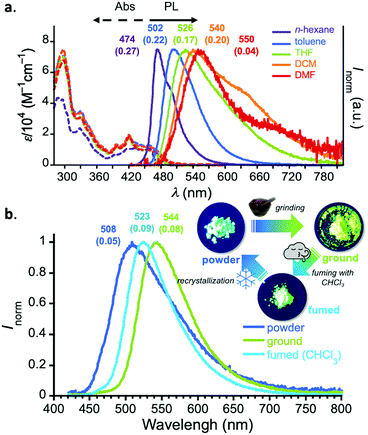
The steady-state UV-vis absorption spectra of diluted solutions (c = 10−5 M) of 1 displayed a π–π* absorption at λabs 300–350 nm and weak vibronic absorption ascribed to the acceptor core at λabs 380–420 nm (Fig. 2a). Also, in the lower-energy region, a broad and weak absorption ascribed to charge-transfer (CT) transition was observed. In a non-polar solvent (n-hexane), compound 1 displayed a vibronically-shaped emission spectrum (λem 474 nm) with a moderate photoluminescence quantum yield (PLQY), which is ascribed to the emission from the locally excited state (1LE). In contrast to the absorption spectra, the PL spectrum significantly red-shifted as a function of solvent polarity (Fig. 2a), suggesting the CT character of the excited states in those solvents. The Mataga–Lippert plot analysis corroborated the hybridized local and charge-transfer (HLCT) nature of compound 1 (Fig. S3, ESI†). An interesting phenomenon other than solvatochromism involves dual-emission in a polar solvent such as dichloromethane (DCM) and DMF (Fig. 2a). Comparison with a known D–A system having a phenazagermin donor allows us to notice that the contribution of the emission ascribed to axial-axial conformer is little in our system.5 The exclusive population of equatorial-equatorial conformer of compound 1 was supported by the theoretical calculations (vide infra).
It is noted that D–A–D compound 1 exhibited a significant change in emission color in the solid states, responding to external stimuli (Fig. 2b). When as-prepared powdery solid (“powder”) was ground with a pestle and mortar (“ground”), the emission peak significantly shifted to the lower-energy regime (Δλ 1303 cm−1). In contrast, when the ground was fumed with organic vapor such as CHCl3 and CH2Cl2, the emission spectrum slightly reverted back (Δλ 738 cm−1). The initial powder state was recovered by recrystallization. The powder X-ray diffraction (PXRD) analyses of the solids revealed that only the peak at 2θ = 23.4° (d = 3.8 Å) significantly decreased upon grinding and its intensity was reverted back upon exposing to chloroform vapor (Fig. S4, ESI†). This would suggest that the emission color change in response to stimuli would be ascribed to the fluctuation of intermolecular electronic interaction.11 It is noted that such dual photofunctionality of TADF and mechano-responsive emission color change would offer opportunities for sensing applications.12
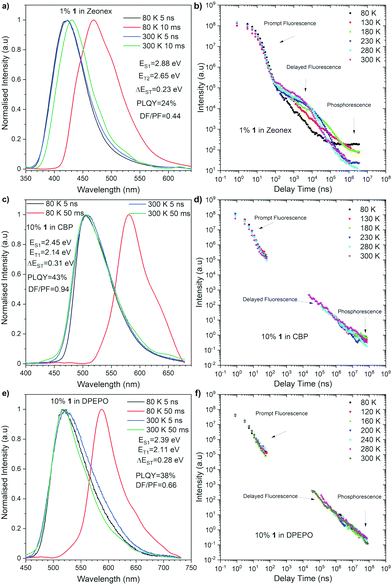
Time-resolved luminescence spectroscopy of compound 1 was performed in both inert non-polar cyclo olefin polymer host Zeonex®, 4,4′-bis(N-carbazoyl)-1,1′-biphenyl (CBP), and bis[(2-diphenylphosphino)phenyl]ether oxide (DPEPO) hosts, the latter two of which were used to mimic the chemical environment within an OLED device. Each material showed emission within two distinct time regions within all the hosts. The first, decaying with a lifetime within the nanosecond time regime in all materials, is attributed to prompt emission from the singlet excited state due to its temperature independence (Fig. 3). In all cases, spectral inspection at time delays (TD) = 5 ns shows a Gaussian charge transfer (1CT) singlet peak that decays over longer times.
At longer delay times, in the microsecond/millisecond delay time regions, delayed emission was observed (Fig. 3). Depending upon the experimental temperature, both the singlet state delayed emission and triplet state emission was observed on similar millisecond timescales, and therefore, the emission from each state is most easily elucidated upon spectral inspection at different temperatures (Fig. 3). At room temperature (300 K), the delayed emission spectrum had the same shape and onset energy as the prompt emission in both CBP and DPEPO (Fig. 3c and e). Therefore, the delayed emission was identified as TADF. But, the delayed emission in Zeonex® was observed in a slightly lower-energy region (Fig. 3a), probably due to the structural relaxation in the excited state. Intriguingly, the triplet excited state emissions observed at low temperatures showed quite varied energies: 2.65 eV in Zeonex®, 2.14 eV in CBP, and 2.11 eV in DPEPO hosts (Fig. 3a, c, and e). Such fluctuation in the triplet energy is unusual for dibenzo[a,j]phenazine-cored D–A–D systems.13 This observation could suggest a higher triplet state (T2) was involved in the emission in Zeonex®. Such a scenario was partly supported by the theoretical calculations (vide infra). Such complications cause much weaker TADF emission in the CBP and DPEPO matrices and a much lower rISC contribution than it was observed in the Zeonex® matrix. The polarity of the host affects the energy of both singlet and triplet excited states. Therefore, as the polarity increases, the ΔEST of the materials increases from 0.23 eV in Zenex® to 0.31 eV in CBP, and 0.28 in DPEPO, which weaken the rISC process. When compared with the photophysical properties of a phenothiaborine-connected phenazagermine compound5 in a phosphineoxide host (diphenylphosphoryl)dibenzo[b,d]furan: PPF, the λem for 1 in DPEPO (518 nm) locates at the lower-energy region than that for the D–A dyad (468 nm), while the ΔEST of 1 (0.28 eV) is larger than that for the D–A dyad (0.11 eV).
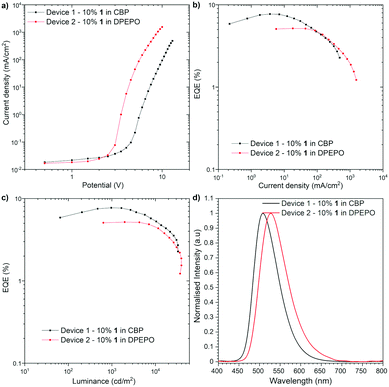
The OLED devices were fabricated to investigate whether the Ge-containing compound is applicable to optoelectronic applications (Fig. 4). The HOMO and LUMO energy levels of 1 were determined by cyclic voltammetry (CV) to be −5.65 eV and −3.34 eV, respectively (Fig. S1, ESI†). Since the thermogravimetric analysis (TGA) indicated the high thermal stability of compound 1 [Td (5 wt% loss under N2) = 466 °C] (Fig. S2, ESI†), the devices were fabricated with thermal evaporation technique. As a result of an optimization study, the optimal configuration was obtained as follows: Device 1 [ITO/N,N′-di(1-naphthyl)-N,N′-diphenyl-(1,1′-biphenyl)-4,4′-diamine (NPB) (40 nm)/10% 1 in CBP (25 nm)/2,2′,2′′-(1,3,5-benzinetriyl)-tris(1-phenyl-1H-benzimida-zole) (TPBi) (40 nm)/LiF (1 nm)/Al (100 nm)], Device 2 [ITO/NPB (40 nm)/tris(4-carbazoyl-9-ylphenyl)amine (TCTA) (10 nm)/10% 1 in DPEPO (20 nm)/TPBi (60 nm)/LiF (1 nm)/Al (100 nm)] (Fig. 4). The characteristics of the OLED structures revealed a good efficiency of Ge-containing TADF emitter 1 in CBP host OLED device (EQE ca. 7.7%, Fig. 4b), which exceeds the theoretical maximum of the OLED device fabricated with prompt fluorescent emitter (ca. 5%). On the one hand, the DPEPO host-based device showed lower efficiency (EQE ca. 5.1%). The luminance of the device in both hosts is quite high (more than 32![[thin space (1/6-em)]](https://www.rsc.org/images/entities/char_2009.gif) 000 cd m−2 in CBP and 39
000 cd m−2 in CBP and 39![[thin space (1/6-em)]](https://www.rsc.org/images/entities/char_2009.gif) 000 cd m−2 in DPEPO), which suggests good charge recombination in the device. The turn-on voltage was around 2.5 V in DPEPO and 4.0 V in CBP. In both structures, the OLED characteristic showed a moderate roll-off dependency (Fig. 4b and c). It is worth noting that the Ge-containing TADF emitter for OLEDs is quite limited so far,5 and compound 1 represents the first example of green-TADF emitter based on organogermanium compound.
000 cd m−2 in DPEPO), which suggests good charge recombination in the device. The turn-on voltage was around 2.5 V in DPEPO and 4.0 V in CBP. In both structures, the OLED characteristic showed a moderate roll-off dependency (Fig. 4b and c). It is worth noting that the Ge-containing TADF emitter for OLEDs is quite limited so far,5 and compound 1 represents the first example of green-TADF emitter based on organogermanium compound.
To obtain further insight into the behavior of compound 1, density functional theory (DFT) calculations were performed and the nuclear ensemble method was used to estimate photophysical rates14 (see the ESI† for details). A conformational analysis of 1 was conducted, revealing that the equatorial-equatorial conformation is the most stable one in ground, S1 and T1 states. A fluorescence spectrum simulation of compound 1 (Fig. S3, ESI†) predicts an emission peak at 516 nm (2.40 eV) and an emission rate of 1.2 × 10⁷ s−1 (Table S5, ESI†), which matches well the experimental value (502 nm) in toluene (Fig. 2) but underestimates the S1 emission energy in Zeonex® (Fig. 3a), though toluene and Zeonex® share similar dielectric constants (ca. 2.3). This suggests that the S1 emission in this case could result from another conformer being preferentially locked in place by solid-state effects specific to this host matrix, a hypothesis that is corroborated by emission energies of 2.83 eV and 2.75 eV calculated for the axial–axial and equatorial–axial conformers, respectively.
Estimated rates for ISC from S1 (Table S4, ESI†) indicate that the preferred process takes place between the S1 and T2 states, due to a lower average energy gap (0.012 eV between S1 and T2versus 0.421 eV between S1 to T1). The simulated phosphorescence spectra from T1 and T2 (Fig. S6 and Tables S4–S6, ESI†) predict one order of magnitude higher emission rate from T2 than from T1 with a T1 peak at 579 nm (2.14 eV) and a T2 peak at 475 nm (2.61 eV). The predicted energy of T2 matches the phosphorescence energy measured in Zeonex® (2.65 eV), providing further evidence for the S1 to T2 ISC hypothesis. The T1 energy, in turn, agrees well with phosphorescence energies in CBP and DPEPO (Fig. 3c and e), suggesting that in these host matrices, transfers to T1 from S1 may be more efficient due to higher solvatochromic shift or that internal conversion from T2 can play an important role. In toluene, calculations indicate an average T1–T2 gap of 0.44 eV (Table S7, ESI†), enough to prevent rapid depopulation to T1 if the competing processes (rISC, phosphorescence) are efficient enough. Calculated rISC rates from T1 and T2 states (Tables S5 and S6, ESI†) reveal that rISC to S1 is the preferred transfer for both triplet states. The rISC rate from T2 to S1 is orders of magnitude higher than that from T1, indicating more efficient TADF when T2 is the state involved in the triplet harvesting mechanism. This agrees with the observed decrease in TADF performance in CBP and DPEPO, which, as mentioned above, have larger T1 involvement.
Fig. 5 summarizes the proposed TADF mechanism based on the probabilities of each process (Table S8, ESI†). Natural transition orbitals (NTOs) for the S1, T1 and T2 states have mostly localized character, explaining the mild red shift observed from CBP to DPEPO. On the other hand, stronger shifts in solution may result from the fact that vibrational effects can alter the electronic character of the excited states,15,16 (see example of CT S1 in Fig. 5) such that the actual picture is not fully captured by NTOs on optimized structures. In fact, this effect should be more prominent in solution than in solid-state, as the vibrational motion may be hindered in the latter case.
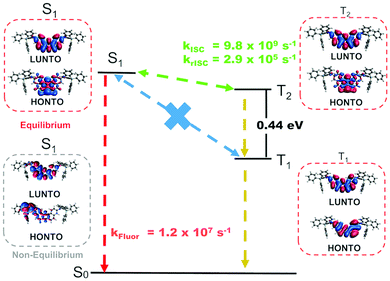 | ||
| Fig. 5 NTOs for the S1, T1 and T2 states and schematics of the TADF mechanism in compound 1 with DFT estimated rates in toluene. A CT S1 state calculated at a non-equilibrium geometry is also shown. | ||
In summary, we have developed a dual-photofunctional organogermanium compound that exhibits TADF and mechanochromic behavior. The compound represents the first example of green-TADF emitter using organogermanium scaffold for efficient OLED devices. Theoretical calculations shed light on the importance of the higher triplet excited state to yield TADF via rISC process. This work opens up a new avenue for organogermanium-based multi-photofunctional materials in the future.
This work was partly supported by KAKENHI (JP19H05716, JP20H02813, and JP21K18960 to Y. T.), a grant from VILLUM FONDEN (00028053 to P. de Se. and L. E. S.) and the First Team program (POIR.04.04.00-00-4668/17-00 to P. D.). The full list for acknowledgement is included in the ESI.†
Conflicts of interest
There are no conflicts to declare.Notes and references
- C. S. Weinert, Encycl. Inorg. Bioinorg. Chem., 2015, 1–18 CAS.
- (a) J. S. Thayer, Appl. Organomet. Chem., 1987, 1, 227–234 CrossRef CAS; (b) L. G. Menchikov and M. A. Ignatenko, Pharm. Chem. J., 2013, 46, 635–638 CrossRef CAS.
- C. Fricke and F. Schoenebeck, Acc. Chem. Res., 2020, 53, 2715–2725 CrossRef CAS PubMed.
- (a) C. Yao, Q. Cui, J. Peng, X. Xu, R. Liu, J. Wang, Y. Tian and L. Li, J. Mater. Chem. C, 2015, 3, 5017–5025 RSC; (b) C. Yao, Y. Yang, L. Li, M. Bo, C. Peng and J. Wang, J. Mater. Chem. C, 2018, 6, 6146–6152 RSC; (c) M.-K. Hung, K.-W. Tsai, S. Sharma, J.-Y. Wu and S.-A. Chen, Angew. Chem., Int. Ed., 2019, 58, 11317–11323 CrossRef CAS PubMed; (d) M.-K. Hung, K.-W. Tsai, S. Sharma, J. Lei, J.-Y. Wu and S.-A. Chen, ACS Appl. Mater. Interfaces, 2019, 11, 36895–36904 CrossRef CAS PubMed.
- K. Matsuo and T. Yasuda, Chem. Sci., 2019, 10, 10687–10697 RSC.
- (a) N. Allard, R. B. Aïch, D. Gendron, P.-L. T. Boudreault, C. Tessier, S. Alem, S.-C. Tse, Y. Tao and M. Leclerc, Macromolecules, 2010, 43, 2328–2333 CrossRef CAS; (b) J. Ohshita, Y.-M. Hwang, T. Mizumo, H. Yoshida, Y. Ooyama, Y. Harima and Y. Kunugi, Organometallics, 2011, 30, 3233–3236 CrossRef CAS; (c) C. M. Amb, S. Chen, K. R. Graham, J. Subbiah, C. E. Small, F. So and J. R. Reynolds, J. Am. Chem. Soc., 2011, 133, 10062–10065 CrossRef CAS PubMed.
- H. Uoyama, K. Goushi, K. Shizu, H. Nomura and C. Adachi, Nature, 2012, 492, 234–238 CrossRef CAS PubMed.
- (a) J. Ohshita, K. Murakami, D. Tanaka, Y. Ooyama, T. Mizumo, N. Kobayashi, H. Higashimura, T. Nakanishi and Y. Hasegawa, Organometallics, 2014, 33, 517–521 CrossRef CAS; (b) H. Arii, Y. Iwanami, D. Nakane, H. Masuda, J. Matsumoto, T. Shiragami, K. Mochida and T. Kawashima, Organometallics, 2021, 40, 1363–1370 CrossRef CAS.
- Y. Sagara, S. Yamane, M. Mitani, C. Weder and T. Kato, Adv. Mater., 2016, 28, 1073–1095 CrossRef CAS PubMed.
- Y. Takeda, M. Okazaki and S. Minakata, Chem. Commun., 2014, 50, 10291–10294 RSC.
- S. Goto, Y. Nitta, N. O. Decarli, L. E. de Sousa, P. Stachelek, N. Tohnai, S. Minakata, P. de Silva, P. Data and Y. Takeda, J. Mater. Chem. C, 2021, 9, 13942–13953 RSC.
- P. Data and Y. Takeda, Chem. – Asian J., 2019, 14, 1613–1636 CrossRef CAS PubMed.
- Y. Takeda, P. Data and S. Minakata, Chem. Commun., 2020, 56, 8884–8894 RSC.
- L. E. de Sousa and P. de Silva, J. Chem. Theory Comput., 2021, 17, 5816–5824 CrossRef CAS PubMed.
- L. E. de Sousa and P. de Silva, ChemRxiv, 2022 DOI:10.26434/chemrxiv-2022-pq978.
- P. de Silva, C. A. Kim, T. Zhu and T. Van Voorhis, Chem. Mater., 2019, 31, 6995–7006 CrossRef CAS.
Footnotes |
| † Electronic supplementary information (ESI) available: Experimental procedures for the syntheses of materials, spectroscopic data of new compounds, single crystal X-ray crystallographic data, cyclic voltammogram, thermogravimetric analysis (TGA) profiles, the copies of NMR spectra of new compounds, and theoretical calculation details. CCDC 2153796. For ESI and crystallographic data in CIF or other electronic format see DOI: https://doi.org/10.1039/d2cc01568d |
| ‡ These authors contributed equally to this work. |
| This journal is © The Royal Society of Chemistry 2022 |

