
 Open Access Article
 This Open Access Article is licensed under a
 Creative Commons Attribution 3.0 Unported Licence
Tuning the photophysical properties of luminescent lanthanide complexes through regioselective antenna fluorination†
Daniel
Kocsi
,
Andreas
Orthaber
 and
K. Eszter
Borbas
*
and
K. Eszter
Borbas
*
Department of Chemistry, Ångström Laboratory, Uppsala University, Lägerhyddsvägen 1, 75120, Uppsala, Sweden. E-mail: eszter.borbas@kemi.uu.se
First published on 18th May 2022
Abstract
Carbostyrils monofluorinated in the 3, 5, or 6 positions were synthesised from olefinic precursors via a photochemical isomerisation-cyclisation route, and incorporated into octadentate cyclen triacetate ligands that formed luminescent complexes with Tb(III) and Eu(III). The photophysical properties of the emitters were strongly dependent on the position of the fluorination.
The luminescence of the trivalent lanthanide (Ln) ions is applied in diverse biological and industrial settings ranging from the monitoring of the components of living cells to the thermometric analysis of materials.1,2 Ln(III) luminescence is often sensitised by a light-harvesting antenna to avoid the need for direct excitation of the Laporte-forbidden 4f–4f transitions.3 Optimisation of energy transfer (EnT) to the Ln(III) and elimination of processes that quench the antenna and Ln(III) excited states are essential for bright emitters.
Photoinduced electron transfer (PeT) from the excited antenna to Ln(III) is feasible for several Lns,4,5 and for Eu(III) emission it can be an effective luminescence quenching process.6 PeT is suppressed when the antenna is less reducing. Antenna substitution with electron-withdrawing groups (e.g. with CF3, Fig. 1)4,5 or protonation7,8 can increase the Eu(III) luminescence quantum yield, but may have unintended consequences on the antenna excited state energies.5,9,10 Ln sensitisation commonly takes place via the antenna singlet (S1) and triplet excited states (T1). Even subtle changes to the antenna may alter the S1 and T1 energies and EnT. In the previous examples both antenna trifluoromethylation4,5 and protonation proved detrimental to Tb(III) emission.8
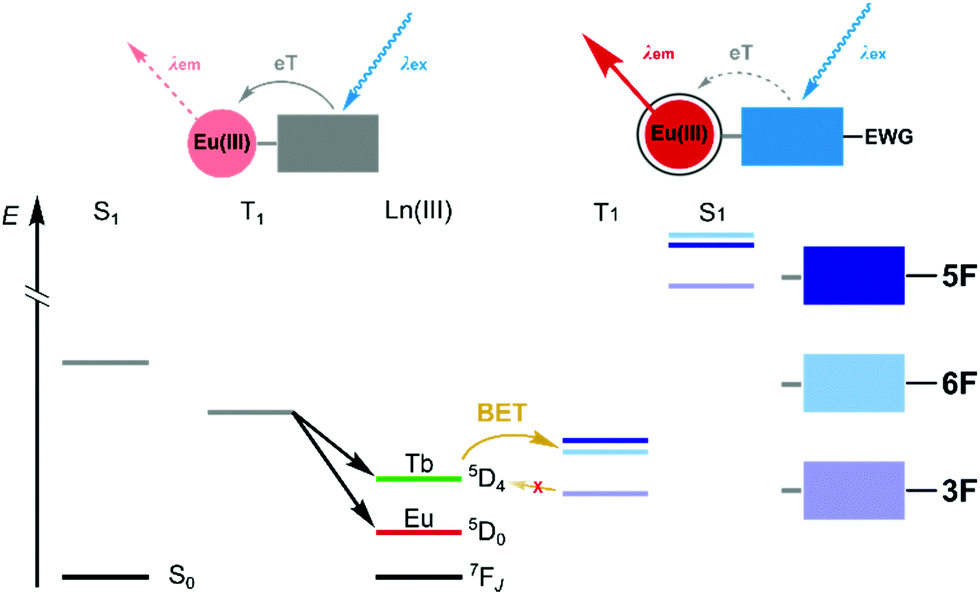 | ||
| Fig. 1 Decreased PeT quenching of Eu(IIII) luminescence through antenna substitution with electron-withdrawing group(s) (EWG), and its effects on the S1 and T1 energies. | ||
Here, we have prepared three monofluorinated 7-aminocarbostyril regioisomers. Electronegative fluorine was expected to decrease PeT by making the antenna less reducing, a strategy that complements the use of C–F bonds to replace the more efficiently quenching C–H oscillators.11 Fluorination has additional potential benefits. Fluorine is a hydrogen isostere conferring metabolic stability, H-bond acceptor ability, and altered lipophilicity on pharmaceuticals.12 Diagnostic applications of fluorinated probes include multimodal13 and responsive14 systems. 19F-MRI is a promising low-background technique,15 and 18F is an attractive PET label.16,17
Fluorinated carbostyrils were incorporated into do3a (1,4,7,10-tetraazacyclododecane-1,4,7-triacetate)-based octadentate ligands to enable comparison with previously reported structures.4,5 The Eu(III), Tb(III), and Gd(III) chelates of the ligands were characterised using 1H NMR spectroscopy, cyclic voltammetry, and UV-vis absorption and steady-state and time-resolved emission spectroscopies. Our results show fluorination meaningfully impacts the antenna and Ln(III) photophysical properties, and substitution at a remote antenna position could even influence the excited state behaviour of the Ln(III).
Fluorinated antennae were synthesised as shown in Scheme 1 and Schemes S1–S6 (ESI†). The procedures were robust, scalable (e.g. 466 mg of CS6F was obtained in one experiment), and reproducible. Olefins 5F were prepared from commercially available starting materials as the Z isomers with excellent selectivity due to the steric clash between the ester group and the aromatic ring.18 The stereochemical assignment was based on the 3JHF = 33–38 Hz and 3JHH = 15–16 Hz coupling constants. The key photochemical olefin isomerisation-cyclisation was carried out by irradiating a 100 mM solution of 5 in MeOH or EtOH with 254 nm-UV light, giving CS3F, CS5F, and CS6F in good to excellent yield. Regioisomer identities were confirmed by 1D and 2D NMR spectroscopy and single-crystal X-ray crystallography (Fig. S1–S6 and Tables S1–S3, ESI†). The analogous CS4F could not be accessed via similar routes due to the instability of the intermediates (Schemes S3–S5, ESI†). CS/CSF was acetylated with Ac2O or chloroacetyl chloride to yield reference compounds AcCS/AcCSF, or the reactive antennae 6, respectively. 6 were incorporated into LnL (Ln = Gd, Eu, Tb) using procedures previously developed for similar compounds. Synthetic details, compound characterisations, and the attempted syntheses of CS4F are given in the ESI.† Analytical data were fully consistent with the assigned structures.
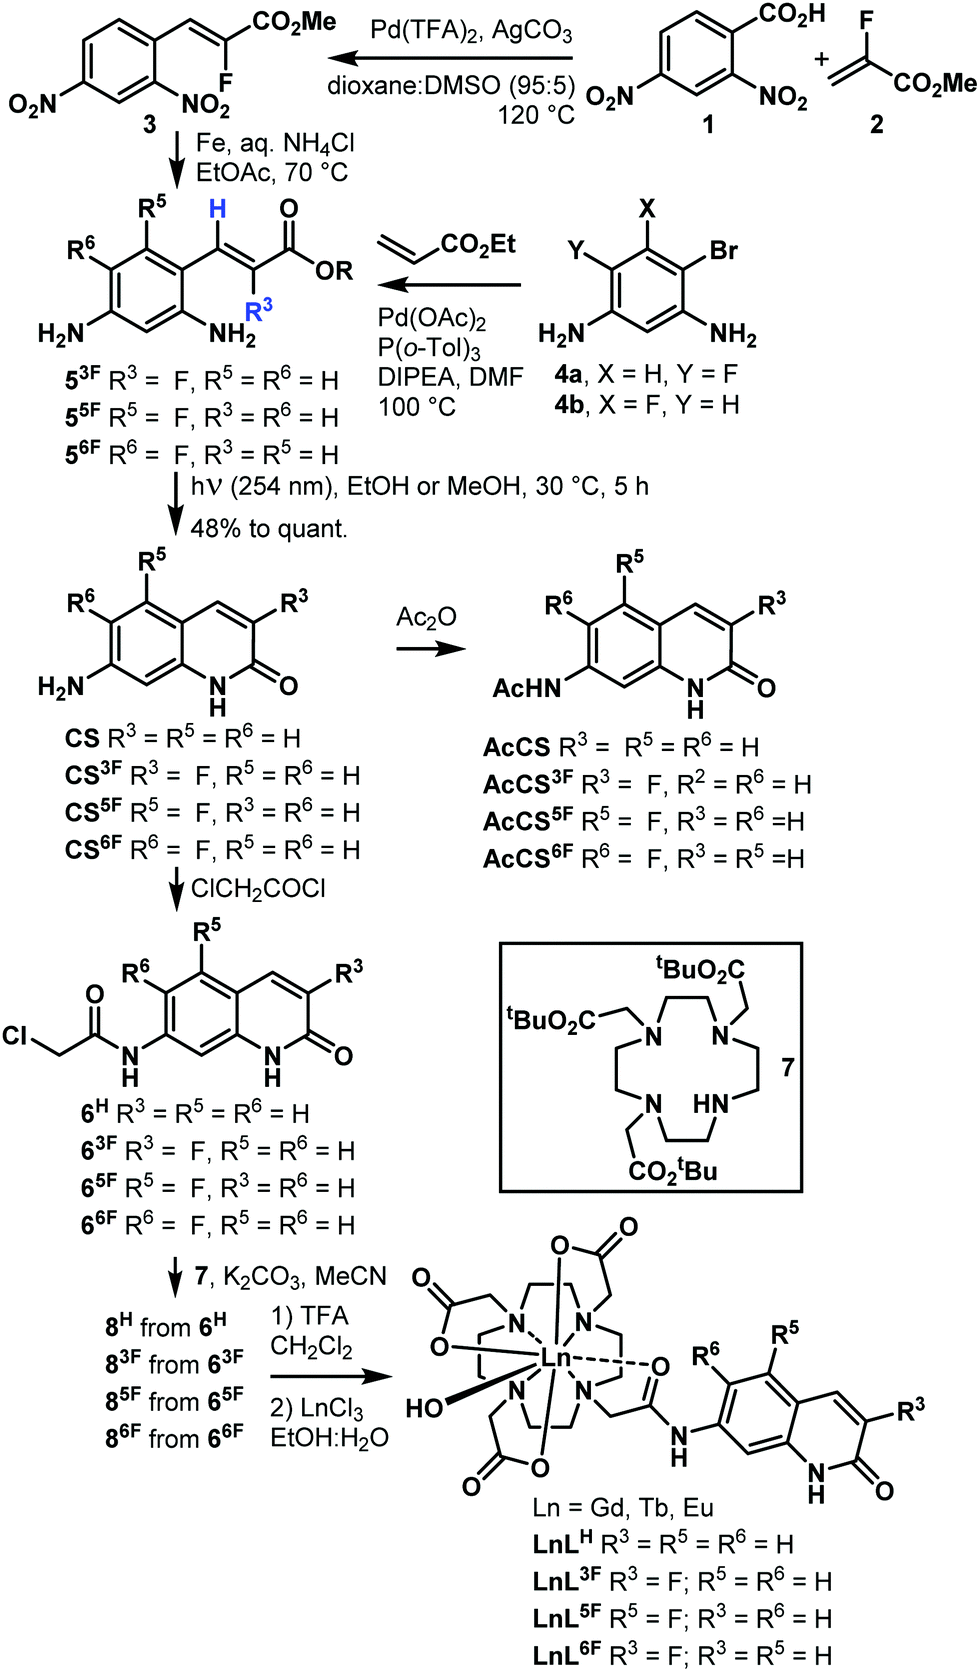 | ||
| Scheme 1 Preparation of CSF, AcCS, AcCSF, and LnLF. | ||
Solution structures of EuLF were studied by paramagnetic 1H and 19F NMR spectroscopy. In CD3OD at r.t. the 1H NMR spectra of EuL3F, EuL5F, EuL6F, and EuLH, were similar (Fig. S7–S10, ESI†). The major isomer had square antiprismatic geometry (4 peaks at >32 ppm). Trace amounts of the twisted square antiprismatic isomer were also present (signals at 12–16 ppm). 19F NMR spectra supported this interpretation, showing a single peak at −133.8, −118.8, and −134.1 ppm for EuL3F, EuL5F, and EuL6F, respectively (Fig. S11–S13, ESI†). These data are consistent with the ligands imposing similar geometries on the Ln(III) ions in solution in the ground state, and is similar to what has been observed for other do3a-complexes carrying carbostyril antennae.6 This was expected as fluorine is small, and the fluorination sites are quite distant from the Ln(III).
The photophysical properties of CS and CSF were recorded in acetonitrile due to their low aqueous solubility. The lowest-energy bands in the absorption spectra were assigned to π–π* transitions, and were located at 320–360 nm with λmax = 335, 332, and 339 nm for CS3F, CS5F, and CS6F, respectively (Fig. S18–S22, ESI†), non-fluorinated CS had λmax = 337 nm. CS, CS3F, CS5F, and CS6F excitation at λmax resulted in fluorescence emission maxima at λem = 384, 400, 387, and 382 nm, respectively (Table 1 and Fig. S23–S27, ESI†). CS3F had the highest fluorescence quantum yield, ΦL = 56%. Fluorination in the 5-position had minimal effect on ΦL compared to CS (ΦL = 25 and 27%, respectively), while substitution in the 6-position lowered ΦL to 10%. CSF fluorescence lifetimes (τfl) mirrored the observations made for ΦL (Table 1). CS3F had the longest τfl (2.84 ns), and CS6F the shortest, τfl = 0.41 ns. CS and CS5F had very similar τfl, 1.15 and 1.09 ns, respectively (Table S5 and Fig. S49–S56, ESI†).
| λ max (nm) | λ em (nm) | S 1 (cm−1) | T 1 (cm−1) | Φ L (%) | τ fl (ns) | |
|---|---|---|---|---|---|---|
| a In acetonitrile at 10 μM concentration. b In aqueous PIPES buffer (10 mM), pH 6.5, at 10 μM complex concentrations. c λ ex = 332 nm (CS3F), 331 nm (CS5F), 338 nm (CS6F), 335 nm (GdL6F), 327 nm (GdL5F), 325 nm (GdL3F). d Calculated from the 0–0 transitions of the Gd-complexes recorded at 77 K. e Relative to quinine sulfate (Φ = 0.59) in H2SO4 (0.05 M).23 | ||||||
| CS | 337 | 384 | — | — | 27 | 1.15 (5) |
| CS3F | 335 | 400 | — | — | 56 | 2.84 (6) |
| CS5F | 332 | 387 | — | — | 25 | 1.09 (2) |
| CS6F | 339 | 382 | — | — | 10 | 0.41 (6) |
| GdLH | 330 | 369 | 28![[thin space (1/6-em)]](https://www.rsc.org/images/entities/char_2009.gif) 700 700 |
22500 |
7.6 | 0.34 (3) |
| GdL3F | 325 | 364 | 29200 |
22100 |
13 | 0.60 (5) |
| GdL5F | 327 | 367 | 28900 |
22400 |
6.1 | 0.44 (8) |
| GdL6F | 337 | 380 | 28100 |
22300 |
5.9 | 0.36 (4) |
LnL absorption spectra were collected in aqueous solutions (0.01 M PIPES buffer, pH = 6.5). Absorption maxima were blue-shifted relative to the corresponding CS with λmax = 325, 327, 337, and 330 nm for LnL3F, LnL5F, LnL6F, and LnLH, respectively (Fig. 2 and Fig. S28–S32, ESI†).
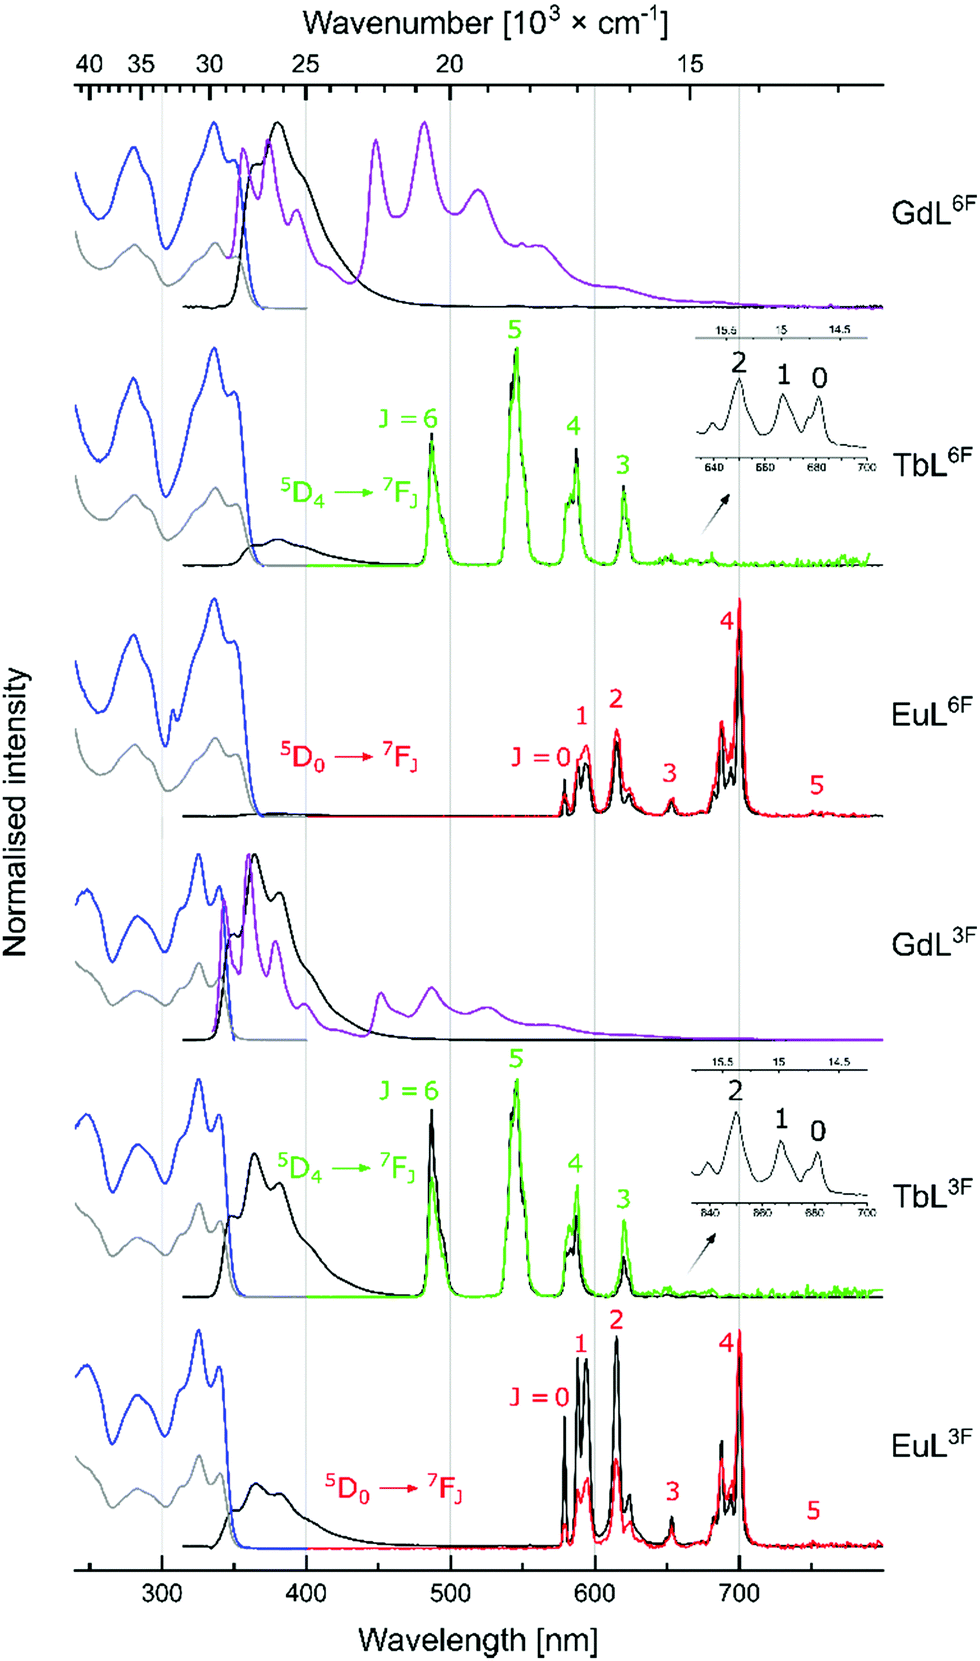 | ||
| Fig. 2 Normalised absorption (grey, 298 K), excitation [blue, λem = 380 nm (GdL6F), λem = 364 nm (GdL3F), λem = 546 nm (Tb), λem = 615 nm (Eu), 298 K], steady-state emission at 298 K [black, λex = 335 nm (LnL6F), λex = 325 nm (LnL3F)], steady-state emission at 77 K [purple, λex = 335 nm (LnL6F), λex = 325 nm (LnL3F)] and time-resolved emission [green (Tb), red (Eu), λex = 335 nm (LnL6F), λex = 325 nm (LnL3F), 298 K] spectra of LnLF. | ||
Gd(III) excited states are too high to accept energy from the antennae, therefore, GdL are useful for determining the antenna photophysical properties in LnL without interference from photo- or redox-active Ln(III). Carbostyril excitation in GdL returned antenna fluorescence that was blue-shifted and less intense than that of the corresponding 7-aminocarbostyril (Fig. S33–S36, ESI†). ΦL was largest for GdL3F (13%) and smallest for GdL6F (5.9%), with ΦL(GdL5F) = 6.1% and ΦL(GdLH) = 7.6% in between. Steady state emission spectra were recorded at 77 K to determine the antenna T1 (Fig. S45–S48, ESI†). Notably, fluorination in all three investigated positions lowered the antenna T1 from 22500 cm−1 in GdLH. GdL3F had the lowest energy T1 (22100 cm−1), and GdL5F had the highest, at only 300 cm−1 higher energy. These are small but impactful differences. The 5D4 emitting level of Tb(III) is located at 20400 cm−1, and the antenna T1 must be at least ∼2000 cm−1 higher energy to avoid thermal back energy transfer (BET). Thus, TbL3F and possibly even TbL6F (but likely not TbL5F) may be susceptible to BET. Tb(III) complexes that undergo BET are oxygen sensitive, and are useful for O2-sensing and cytotoxic singlet oxygen generation.19,20 T1 are ∼5000 cm−1 higher than the emissive 5D0 level of Eu(III), which is suitable for Eu(III) sensitization.21 T1 in LnLF are closer to the accepting 5D2 Eu(III) level (21500 cm−1) than in LnLH, which may result in better energy transfer in the fluorinated complexes.21,22
Excitation of TbL and EuL at λmax yielded green and red Ln(III) luminescence, respectively (Fig. 2 and Fig. S37–S44, ESI,†Table 2), with residual antenna fluorescence. TbL had slightly lower ΦL than the analogous GdL likely due to some antenna S1-mediated EnT to Tb(III).6EuL had drastically diminished ΦL, which may be due to a combination of EnT from S1, and depopulation of S1 by PeT. AcCSF oxidation potentials (Eox) were found by cyclic voltammetry as +1.73, +1.86, and +1.77 V (vs. NHE, for AcCS3F, AcCS5F, AcCS6F, respectively); only 5-fluorination made antenna oxidation more difficult than in AcCS (Eox = +1.81 V). PeT was calculated to be slightly less thermodynamically favoured in EuL5F, and EuL6F than in EuLH, and more favoured in EuL3F (ΔG(PeT) = −1.01, −1.14, −0.98, and −0.97 eV, for EuLH, EuL3F, EuL5F, and EuL6F, respectively (see ESI† for details)). Thus, the effects of fluorination on the antenna S1, T1 and Eox, and in turn on ΔG(PeT) can be difficult to predict.
| Φ L (%) | τ fl (ns) | Φ Ln (%) | τ rad (ms) | Φ LnLn (%) | η sens (%) | |
|---|---|---|---|---|---|---|
| a [LnL] = 10 μM in 10 mM PIPES buffered H2O, pH 6.5. b Determined using the method in ref. 26.Itot/IMD: integral ratio of total Eu-centred corrected emission spectrum (570–800 nm) and 5D0 → 7F1 band (582–603 nm), AMD,0 = 14.65 s−1, n = 1.333 (refractive index),27τobs = τH2O. c Relative to quinine sulfate (Φ = 0.59) in H2SO4 (0.05 M).23 d In parentheses: compared to GdL analogue. e Biexponential fit better based on χ2. f Too short to measure. g Calculated from the steady-state emission spectra. h Calculated from the time-resolved emission spectra. | ||||||
| TbLH | 5.1 (67%) | 0.21(4) | 22.5 | — | — | — |
| TbL3F | 8.1 (63%) | 0.39(2) | 5.6 | — | — | — |
| TbL5F | 4.6 (75%) | 0.36(3) | 21.7 | — | — | — |
| TbL6F | 4.6 (78%) | 0.25(4), 2.40(3)e | 16.7 | — | — | — |
| EuLH | 0.261 (3.4%) | —f | 4.34 | 5.18g, 4.73h | 11.9g, 13.1h | 36.2g |
| EuL3F | 0.680 (5.3%) | 0.93(6), 0.42(5)e | 1.09 | 9.25g, 5.10h | 6.7g, 12.3h | 16.1g |
| EuL5F | 0.814 (13%) | 0.47(6), 1.76(5)e | 5.05 | 5.25g, 5.11h | 11.5g, 11.8h | 43.4g |
| EuL6F | 0.207 (3.5%) | 0.20(1), 2.85(5)e | 5.10 | 5.28g, 5.19h | 11.6g, 11.8h | 43.8g |
The Ln(III) luminescence lifetimes (τH2O) were measured by time-resolved emission spectroscopy. The decays were monoexponential. τH2O values varied for Ln = Tb but were almost identical for all EuL (∼0.61 ms) (Table S4, ESI†). The number of Ln(III)-bound water molecules (q) were q = 1 for EuL. Deviations for TbL from q = 1 could be due to BET, which makes this method inapplicable,24,25 or the result of the typical error of q ±0.5.
TbL5F and TbLH had the highest Tb-centred luminescence quantum yields (ΦLn = 21.7% and 22.5%, respectively, values identical within experimental error). The low ΦLn of TbL3F is presumably the result of BET. EuL5F and EuL6F had ΦLn ∼5%, which is higher than most Eu(III) complexes with similar structures, i.e. uncharged do3a-based emitters with secondary amide-linked carbostyril antenna, including EuLH (ΦLn = 4.34%). EuL3F, however, had low ΦLn = 1.09%. Unlike TbL3F, EuL3F does not suffer from BET, therefore, an alternative explanation for the poor performance of this emitter was necessary.
Φ Ln is the product of the intrinsic quantum yield of the Ln(III) (ϕLnLn) and the Ln(III) sensitisation efficiency (ηsens, eqn (1)), i.e. the efficiency of Ln(III) excited state population. For Eu(III) ϕLnLn can be determined from the corrected emission spectrum.26
 | (1) |
In EuL5F and EuL6Fηsens is increased compared to EuLH, presumably due to a combination of the small adjustments in spectral overlap and PeT quenching. EuL3F had markedly lower ηsens and ϕLnLn than the other EuL (Table 2). The steady-state and time-resolved EuL3F emission spectra have different shapes. Eu(III) spectra are sensitive to coordination environment, and these differences indicate the presence of several emissive species.21 The signal of the slow-decaying component dominating the time-resolved spectrum resembles the EuL5F/EuL6F/EuLH spectra. Contribution from the fast-decaying species modifies the steady-state EuL3F spectrum. If τobs is assumed unchanged, the steady-state spectral shape yields a lower overall ϕLnLn (Table 2). The spectrum of TbL3F is similarly time-dependent, but not those of Eu/TbL5F and Eu/TbL6F. The reasons for the diminished ηsens of EuL3F are unclear. PeT is more favoured in EuL3F than in EuL5F and EuL6F, and EuLF have much lower ΦL than the corresponding GdLF, which is consistent with PeT quenching. The τfl of EuLF and GdLF, however, cannot be compared directly. The biexponential decay of the EuLF antenna fluorescence suggested the presence of additional emitters to those seen in GdLF. Further work is therefore needed to understand the effect of fluorination on EnT and PeT.
In conclusion, monofluorinated 7-aminocarbostyrils, obtained via a photochemical cyclisation, were competent sensitisers of Eu(III) and Tb(III) emission. The position of the fluorine had a dramatic impact on the antenna and Ln(III) photophysical properties, rendering the emission oxygen-sensitive (TbL3F, TbL4F), and increasing (EuL5F, EuL6F), or decreasing ΦLn, (TbL3F, TbL6F, EuL3F) compared to non-fluorinated LnLH. 5-Fluorination improved Eu(III) emission without negatively impacting Tb(III) luminescence. Remote fluorination influenced the excited-state behaviour of LnL3F. Work towards the 4-fluorinated isomer, and ligands containing other EWGs than fluorine is ongoing.
D. K. did all experiments except the crystallographic analysis, which was done by A. O. K. E. B. designed the project, secured funding, and supervised the work. All authors contributed to data analysis and manuscript writing.
This work was funded by Knut och Alice Wallenbergs Stiftelse (Dnr: 2018.0066) and Vetenskapsrådet (2021-04625). We thank Eirini Servetas for help with the synthesis, and Salauat R: Kiraev for the critical reading of the manuscript.
Conflicts of interest
There are no conflicts to declare.Notes and references
- D. Parker, J. D. Fradgley and K.-L. Wong, Chem. Soc. Rev., 2021, 50, 8193–8213 RSC.
- C. D.-S. Brites, S. Balabhadra and L. D. Carlos, Adv. Opt. Mater., 2019, 7, 1801239 CrossRef.
- A. de Bettencourt-Dias, in Luminescence of Lanthanide Ions in Coordination Compounds and Nanomaterials, John Wiley & Sons Ltd, 2014, ch01, pp. 1–48 Search PubMed.
- D. Kovacs and K. E. Borbas, Coord. Chem. Rev., 2018, 364, 1–9 CrossRef CAS.
- D. Kovacs, X. Lu, L. S. Mészáros, M. Ott, J. Andres and K. E. Borbas, J. Am. Chem. Soc., 2017, 139, 5756–5767 CrossRef CAS PubMed.
- D. Kovacs, E. Mathieu, S. R. Kiraev, J. A.-L. Wells, E. Demeyere, A. Sipos and K. E. Borbas, J. Am. Chem. Soc., 2020, 142, 13190–13200 CrossRef CAS.
- A. J. Wilkinson, D. Maffeo, A. Beeby, C. E. Foster and J. A.-G. Williams, Inorg. Chem., 2007, 46, 9438–9449 CrossRef CAS PubMed.
- D. Parker, P. K. Senanayake and J. A.-G. Williams, J. Chem. Soc., Perkin Trans. 2, 1998, 2129–2139 RSC.
- D. Kovacs, S. R. Kiraev, D. Phipps, A. Orthaber and K. E. Borbas, Inorg. Chem., 2020, 59, 106–117 CrossRef CAS PubMed.
- D. Kovacs, D. Phipps, A. Orthaber and K. E. Borbas, Dalton Trans., 2018, 47, 10702–10714 RSC.
- P. B. Glover, A. P. Bassett, P. Nockemann, B. M. Kariuki, R. Van Deun and Z. Pikramenou, Chem. – Eur. J., 2007, 13, 6308–6320 CrossRef CAS PubMed.
- N. A. Meanwell, J. Med. Chem., 2018, 61, 5822–5880 CrossRef CAS PubMed.
- D. Janasik and T. Krawczyk, Chem. – Eur. J., 2022, 28, e202102556 CAS.
- A. M. Kenwright, I. Kuprov, E. De Luca, D. Parker, S. U. Pandya, P. K. Senanayake and D. G. Smith, Chem. Commun., 2008, 2514–2516 RSC.
- J. Ruiz-Cabello, B. P. Barnett, P. A. Bottomley and J. W.-M. Bulte, NMR Biomed., 2011, 24, 114–129 CrossRef CAS PubMed.
- X. Deng, J. Rong, L. Wang, N. Vasdev, L. Zhang, L. Josephson and S. H. Liang, Angew. Chem., Int. Ed., 2019, 58, 2580–2605 CrossRef CAS PubMed.
- D. van der Born, A. Pees, A. J. Poot, R. V.-A. Orru, A. D. Windhorst and D. J. Vugts, Chem. Soc. Rev., 2017, 46, 4709–4773 RSC.
- O. Bouazzaoui, K. Rousée, J. K. Mulengi, X. Pannecoucke, J.-P. Bouillon and S. Couve-Bonnaire, Eur. J. Org. Chem., 2018, 3705–3715 CrossRef CAS.
- P. Ung, M. Clerc, H. Huang, K. Qiu, H. Chao, M. Seitz, B. Boyd, B. Graham and G. Gasser, Inorg. Chem., 2017, 56, 7960–7974 CrossRef CAS PubMed.
- G.-L. Law, R. Pal, L. O. Palsson, D. Parker and K.-L. Wong, Chem. Commun., 2009, 7321–7323 RSC.
- K. Binnemans, Coord. Chem. Rev., 2015, 295, 1–45 CrossRef CAS.
- S. Susumu and W. Masanobu, Bull. Chem. Soc. Jpn., 1970, 43, 1955–1962 CrossRef.
- K. Suzuki, A. Kobayashi, S. Kaneko, K. Takehira, T. Yoshihara, H. Ishida, Y. Shiina, S. Oishi and S. Tobita, Phys. Chem. Chem. Phys., 2009, 11, 9850–9860 RSC.
- A. Beeby, I. M. Clarkson, R. S. Dickins, S. Faulkner, D. Parker, L. Royle, S. A.-S. de, J. A.-G. Williams and M. Woods, J. Chem. Soc., Perkin Trans. 2, 1999, 493–504 RSC.
- R. M. Supkowski and W. D. Horrocks Jr., Inorg. Chim. Acta, 2002, 340, 44–48 CrossRef CAS.
- M. H.-V. Werts, R. T.-F. Jukes and J. W. Verhoeven, Phys. Chem. Chem. Phys., 2002, 4, 1542–1548 RSC.
- A. H. Harvey, J. S. Gallagher and J. M.-H. L. Sengers, J. Phys. Chem. Ref. Data, 1998, 27, 761–774 CrossRef CAS.
Footnote |
| † Electronic supplementary information (ESI) available: Synthesis, characterisation, and NMR spectra of all new compounds, additional crystallographic, photophysical, and electrochemical characterisation. CCDC 2155036–2155038. For ESI and crystallographic data in CIF or other electronic format see DOI: https://doi.org/10.1039/d2cc01229d |
| This journal is © The Royal Society of Chemistry 2022 |