
 Open Access Article
 This Open Access Article is licensed under a
 Creative Commons Attribution 3.0 Unported Licence
In situ bulk magnetization measurements reveal the state of charge of redox flow batteries†
Evan Wenbo
Zhao
 ab,
Edward J. K.
Shellard
a,
Peter A. A.
Klusener
c and
Clare P.
Grey
*a
ab,
Edward J. K.
Shellard
a,
Peter A. A.
Klusener
c and
Clare P.
Grey
*a
aDepartment of Chemistry, Lensfield Road, University of Cambridge, Cambridge CB2 1EW, UK. E-mail: cpg27@cam.ac.uk
bMagnetic Resonance Research Centre, Institute for Molecules and Materials, Radboud University Nijmegen, Heyendaalseweg 135, 6525 AJ Nijmegen, Netherlands
cShell Global Solutions International B.V., Shell Technology Centre Amsterdam, Grasweg 31, 1031 HW Amsterdam, Netherlands
First published on 22nd December 2021
Abstract
We report two methods that use either NMR spectroscopy or direct magnetic susceptibility measurements for in situ (strictly online) determination of the state of charge of redox flow batteries. These methods are demonstrated on the inorganic, redox-active potassium ferro/ferri cyanide catholyte cycled against 2,6-dihydroxyanthraquinone as the anolyte in a full cell, and should be applicable to a wide range of redox couples, provided that the magnetization of the electrolyte solution depends on its oxidation state.
Stationary energy storage for the grid is becoming increasingly important to store and distribute energy from intermittent renewable sources. Redox flow batteries (RFBs) are particularly attractive for this application because, unlike traditional batteries, they store energy in electrolyte tanks rather than in solid materials.1–5 This feature allows their capacity to be scaled up in a cost-efficient way by merely changing the tank size. However, these batteries come with their own set of challenges. During battery operation, side reactions and cross-over of the electrolytes in an RFB can occur and cause an imbalance in the oxidation states of the catholyte and anolyte, which inevitably results in capacity loss. Depending on the mechanisms, the electrolytes can be re-balanced, and the capacity can be restored allowing the RFBs to continue to operate at full capacity. In order to achieve this re-balancing, the state-of-charge (SOC), defined by the average oxidation state of the redox-active electrolytes in RFBs, needs to be accurately measured.6
The open-circuit voltage (OCV) has been used to monitor the SOC of a flow battery by using the Nernst Equation to relate the voltage to the ratios of the electrolytes.6 However, if the system is unbalanced, OCV becomes an unreliable method by which to determine the SOC. Alternatively, a reference electrode could be placed in each half-cell electrolyte tank but these reference electrodes are inherently unreliable, particularly for long-time measurements, a large number of factors leading to drifts in the measured potential. Furthermore, for most redox couples, the potential changes are small over a wide range of SOCs and often the SOC is only accurately measured at the end of a redox process and a step in voltage is seen. For these reasons, new robust approaches are needed to accurately measure the SOC.
The electrolyte conductivity has been used as an indicator for SOC.7 This was demonstrated for all-vanadium RFBs, exploiting the mechanism whereby the ion-pairing between SO42− and the VO2+ and VO2+ causes a shift in acid dissociation equilibria. However, this method is limited to the systems whose ionic conductivity depends on the oxidation state of the electrolytes. Optical absorption spectroscopy has also been used to monitor the SOC. This method is applicable to many types of redox couples as the optical properties are inherently coupled to the oxidation state of a molecule.7,8 However, optical methods are sometimes limited by their spectral resolution and also to absorption problems for highly concentrated electrolytes. In a new approach, in our previous studies, we demonstrated that the bulk magnetization of the electrolyte solution can be a useful indicator of the SOC of an organic molecule-based RFB,9,10 where the magnetization was measured via the shift of water resonances in the NMR spectra as a function of electrochemical cycling. Here, we demonstrate the applicability of this method to an inorganic electrolyte, specifically, the potassium ferro/ferri cyanide redox couple, chosen because it is a commonly used, cheap electrolyte in RFB systems.11–15 First we measured the bulk magnetization by in situ NMR (Fig. 1), calculating a value for the effective magnetic moment, μeff, for the [Fe(III)(CN)6]3− ions that is greater than its spin only value, consistent with an orbital contribution to the magnetism. We then make use of a low-cost magnetic susceptibility balance, available in many laboratories, namely the Evans balance.16 This balance detects the force that a paramagnetic sample exerts on a nearby permanent magnet, and we use it here to demonstrate a simpler and low-cost way to measure the bulk magnetization of the electrolyte solution. The methods demonstrated can be similarly applied to study a wide range of inorganic redox couples, including vanadium-based,17,18 chromium-based,19 manganese-based,20 and iron-based electrolytes.21,22
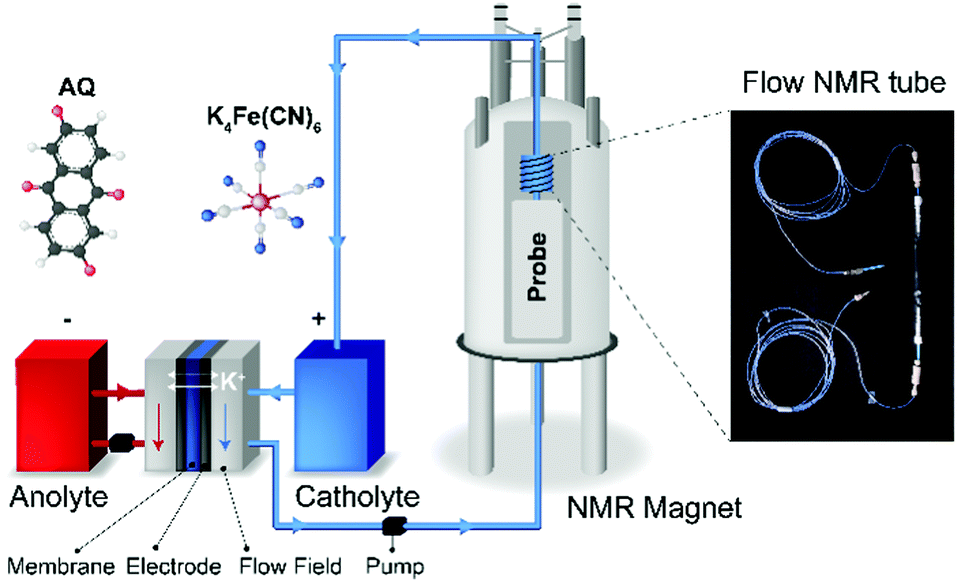 | ||
| Fig. 1 Schematic of the in situ NMR setup. The battery is set up outside the NMR magnet. The catholyte potassium ferro/ferri cyanide solution is pumped through the NMR probe. On the right, a 10 mm (O.D.) flow NMR tube used as the sampling apparatus in the NMR probe. | ||
Fig. 2 presents the in situ1H NMR spectra of the catholyte during electrochemical cycling. The acquisition of the 1H NMR spectra started 13 minutes before the commencement of electrochemical cycling. During the in situ measurement, the battery was charged (oxidation of [Fe(II)(CN6)]4− to [Fe(III)(CN6)]3−) at 100 mA to a cut-off voltage of 1.7 V; this was followed by a discharge reduction of [Fe(III)(CN6)]3− to [Fe(II)(CN6)]4− at 100 mA to a cut-off voltage of 0.6 V. The only 1H NMR observables in the catholyte solution are the residual protons in the deuterated solvent, existing in the form of H2O or HDO. Their resonances are set at 4.79 ppm prior to electrochemical cycling, which is the chemical shift of pure water at room temperature. Due to the diamagnetic properties of the low-spin d6 Fe2+ complex [Fe(II)(CN6)]4− anion, the water resonances may deviate from 4.79 ppm. Nonetheless, since only the changes in the shifts of the water resonances are used for the analyses, these deviations are cancelled out, allowing us to measure changes in the paramagnetic susceptibility. Upon charging, the resonance of H2O shifts to higher chemical shifts in a linear fashion, reaching of 6.28 ppm at the top of charge. Upon discharging, the H2O resonance shifts back towards a lower chemical shift of 5.02 ppm. In the following charge/discharge cycles, the spectra show reversible trends (Fig. 2 and Fig. S1, ESI†).
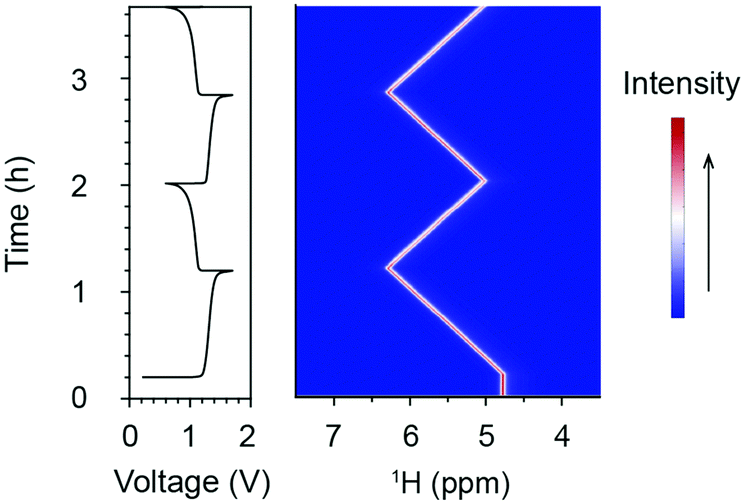 | ||
| Fig. 2 In situ 1H NMR spectra acquired during electrochemical cycling. The voltage and 1H NMR spectra of the catholyte solution, 20 cm3 200 mM K4[Fe(CN)6], versus the anolyte, 20 cm3 300 mM AQ, in a full cell comprising two graphite flow plates with serpentine flow patterns, two 5.0 cm2 carbon felt electrodes and a Nafion 212 membrane. The flow rate was set at 13.6 cm3 min−1. The data was acquired while charging/discharging with a current of 100 mA. The colour scale indicates the intensity of the resonances in arbitrary units. The NMR signal arises from water, comprising a mixture of rapidly exchanging H2O, HDO and D2O molecules. | ||
The shifts of H2O resonances are caused by the changes of bulk magnetization of the electrolyte solution. The [Fe(II)(CN6)]4− anions are diamagnetic, while the d5 [Fe(III)(CN6)]3− anions are paramagnetic containing low-spin Fe3+ ions, i.e. with a single unpaired electron in the t2g orbital and spin S = 1/2. The concentrations of [Fe(II)(CN6)]4− and [Fe(III)(CN6)]3− anions determine the bulk magnetization of the electrolyte solution. Based on the results from the in situ NMR measurement, the bulk magnetic susceptibility was calculated using eqn (S1) (ESI†). Fig. 3a presents the voltage profile and the calculated bulk magnetic susceptibility of the catholyte solution as a function of time. During the first charge, corresponding to the oxidation of [Fe(II)(CN6)]4− to [Fe(III)(CN6)]3− anions, Δχ increases linearly from 0 to 0.36 ppm, for an overall capacity of the cell of 97.4 mA h (theoretical capacity of a balanced cell is 107.2 mA h). In the following discharge, Δχ decreases to 0.06 ppm linearly and reversible changes of Δχ are obtained in the subsequent charge/discharge cycles.
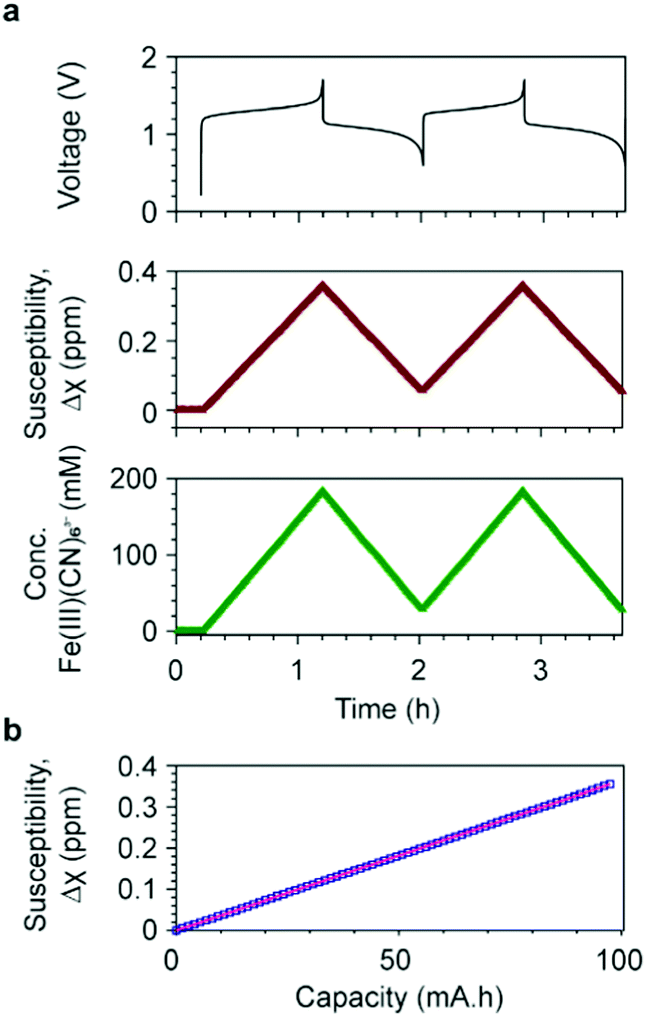 | ||
| Fig. 3 Bulk magnetic susceptibility and concentrations of ferricyanide ions. (a) The voltage of a full cell with 20 cm3 200 mM K4Fe(CN)6vs. 20 cm3 300 mM AQ is shown at the top; in the middle, the susceptibility of the catholyte as a function of time during electrochemical cycling; at the bottom, the concentration of [Fe(III)(CN)6]3− anions as a function of time, calculated using a μeff value of 2.14 BM. (b) Susceptibility as a function of battery capacity during the first charge cycle. The blue squares represent the experimental data and the pink line represents the fit using eqn (S6) (ESI†). A slope of 0.0036 ppm mA−1 h−1 was obtained with a R2 = 0.99999. | ||
Δχ is plotted as a function of battery capacity Q in Fig. 3b, where Δχ and Q are calculated by eqn (S1) and (S7), respectively. Fitting this data by eqn (S6) gives a slope of 0.0036 ppm mA−1 h−1 with a coefficient of determinant R2 = 0.99999. The effective magnetic moment μeff was calculated to be 2.14 BM (Bohr magnetons) per Fe3+ ion. Replacing μeff by 2.14 BM in eqn (S4) (ESI†), including the other constants, we obtain,
| ΔCP = 122.18Δδ | (1) |
The measured value of μeff 2.14 BM is higher than the spin-only value, 1.73 for an S = 1/2 ion. This deviation is ascribed to the non-zero (i.e., partially quenched) orbital contribution to the magnetic moment of the [Fe(III)(CN)6]3− anion. Low-spin d5 ions in an octahedral environment have an electronic configuration t2g5, corresponding to a 2T2g state, with an orbital contribution of 1. Given the t2g orbitals are more than 1/2-filled, the orbital contributions result in positive deviations from the spin-only values. A μeff value of greater than 1.73 BM was similarly measured for potassium ferricyanide powders at 300 K.23 Variations in the extent of the deviations from the spin-only values for spin-1/2 systems T states may also originate from additional distortions due to Jahn–Teller effects, coupling between ions (in the solid state) and differences in temperature between measurements.
The NMR results demonstrate that the bulk magnetization of electrolyte solution can be a useful indicator for the SOC of a flow battery and that NMR is a sensitive tool to measure this bulk magnetization. However, the high cost and bulky size of an NMR instrument make it impractical to use to monitor the SOC of commercial flow batteries. This motivated us to search for a simpler and inexpensive technique to measure the bulk magnetization. The Evans balance,16 based on a torsion mechanism, is a good candidate. In this method, a paramagnetic sample introduced in a glass tube between the first pair of magnets causes a deflection that is compensated by an electromagnet between the balancing second pair of magnets, the required compensation being a measure of the magnetic susceptibility. We designed a flow tube that fits into the cavity of an Evans balance, adopting a tube-in-a-tube design, as shown in Fig. 4a, in which a 1/16′′ PFA tube is inserted into a 3 mm O.D. glass tube. The electrolyte solution flows to the bottom of the glass tube through the inner tube, and then flows out through the outer tube and the side arm attached to it. This design ensured smooth electrolyte flow through the reservoir, avoiding any stagnation points where stale electrolyte could accumulate.
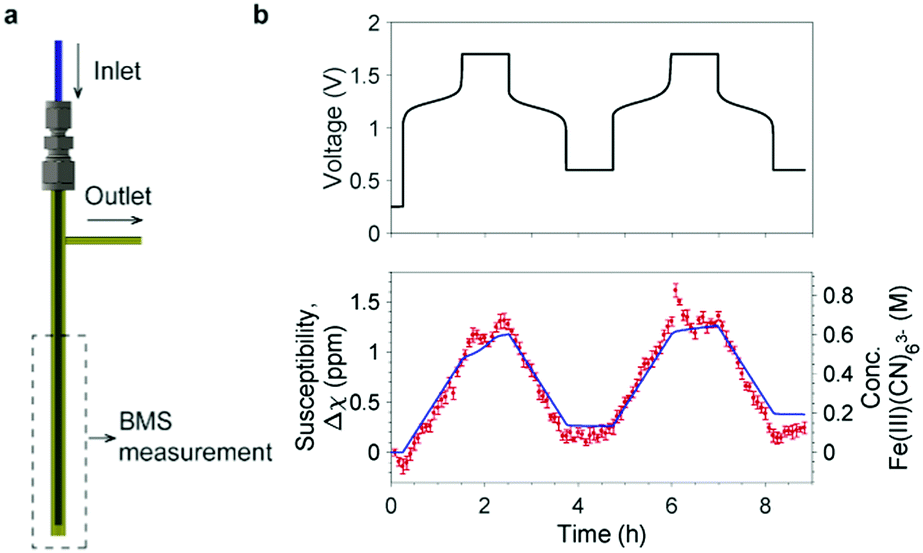 | ||
| Fig. 4 Bulk magnetization measurement using an Evans balance. (a) The flow sampling apparatus designed for the Evans balance. A 1/16′′ PFA tube is used as the inlet and inserted to the bottom of a 3 mm O.D. glass tube. The side arm on the right is the outlet. The apparatus is placed in the balance at a depth of 50 mm. See Fig. S3 (ESI†) for pictures of the real setup and the sampling apparatus. (b) The voltage of a full cell with 15 cm3 500 mM K4Fe(CN)6vs. 15 cm3 300 mM AQ is shown at the top; the bottom shows the changes in bulk magnetic susceptibility of the catholyte (in red) and the concentration of [Fe(III)(CN)6]3− anions (right axis) during electrochemical cycling. Measurements were taken every five minutes and error bars show the standard deviation of the five readings at 10 second intervals which were averaged. The blue line represents the capacity calculated from the current flow measured in the electrochemistry. | ||
The measurement was performed on a full cell during electrochemical cycling with 15 cm3 500 mM K4[Fe(CN)6] vs. 15 cm3 300 mM AQ. The solvent was H2O with 1 M KOH as the supporting electrolyte for the catholyte, and 1.6 M KOH for the anolyte. The battery was rested for 15 min before being charged at 150 mA to a cut-off voltage of 1.7 V (corresponding to the oxidation of [Fe(II)CN6]4− to [Fe(III)CN6]3−); this was followed by a 1.7 V potential hold for one hour. The cell was then discharged (reduction of [Fe(III)CN6]3− to [Fe(II)CN6]4−) at 150 mA to a cut-off voltage of 0.6 V with a potential hold at 0.6 V for an hour thereafter. The magnetic susceptibility of the catholyte and calculated concentration of [Fe(III)CN6]3− (Fig. 4b) exhibit a linear growth when charging and a linear decline when discharging. The overlayed calculated values from the cell's capacity correlate well with magnetic susceptibility, Δχ. Thus, to a first approximation, the change in the magnetic susceptibility is directly proportional to the capacity and, therefore, the SOC of the battery.
Evans balances may be affected by changes in the local environment and so we took care to minimise any possible interferences by reducing the air-flow and monitoring the temperature. When the balance was left undisturbed and the temperature changed by only one degree over the course of the experiment (reported in Fig. 4), we were able to obtain reproducible and accurate measurements. Earlier attempts before we had optimised the set-up are described in the ESI.† Finally, we note that while magnetic susceptibilities are temperature dependent, they vary in a predictable manner (typically as the reciprocal of temperature) and it would be straightforward to account for any external temperature fluctuations with, for example, a simple calibration curve.
To conclude, we have measured the bulk magnetization of the ferro/ferri cyanide electrolyte solution as a function of electrochemical cycling. This was achieved by monitoring the shift of water resonances in the 1H NMR spectra and using its linear relationship to the bulk magnetization of the electrolyte solution. Fitting the data of magnetic susceptibility as a function of battery capacity, we calculated the effective magnetic moments of the dissolved ferricyanide anions to be 2.14 BM. We further calculated the concentration of ferricyanide anions using this value allowing the SOC of the battery to be determined during cycling. We emphasize that this method is applicable to a wide range of redox chemistries, where the magnetization of the electrolyte solution changes as a function of its oxidation state. This requirement is fulfilled by iron-, vanadium-, chromium-, manganese- and many organic molecule-based systems that involve radical anions.
Motivated by the NMR results, with the goal of developing a compact device that can be applied to large-scale redox flow batteries, we used an Evans balance to measure the bulk magnetization of the electrolytes. We again obtained a clear correlation between the readings from the Evans balance and the capacity of the battery, closely corresponding with the NMR measurements of bulk magnetization. The Evans balance is an example of a simple, small and cheap device with sufficient sensitivity to measure variations in electrolyte magnetization. With a customized modification to the Evans balance or similar instrument, the design of a compact device that can be integrated into a commercial flow battery to reliably measure the state of charge is readily envisaged.
C. P. G. acknowledges support from Centre of Advanced Materials for Integrated Energy Systems (CAM-IES) via EPSRC grant number EP/P007767/1, and support from Shell. E. W. Z. acknowledges the start-up support from Institute for Molecules and Materials, Radboud University Nijmegen. The authors acknowledge Prof. Dominic Wright from the University of Cambridge for helpful discussions, and Dr Chris Brackstone from the physical teaching laboratory for lending the Evans balance.
Conflicts of interest
A patent application with a filling number of GB 2102339.5 has been submitted by Cambridge Enterprise based on the findings presented in this paper.Notes and references
- J. Winsberg, T. Hagemann, T. Janoschka, M. D. Hager and U. S. Schubert, Angew. Chem., Int. Ed., 2017, 56, 686–711 CrossRef CAS PubMed.
- M. V. Holland-Cunz, F. Cording, J. Friedl and U. Stimming, Front. Energy, 2018, 12, 198–224 CrossRef.
- B. Dunn, H. Kamath and J.-M. Tarascon, Science, 2011, 334, 928–935 CrossRef CAS PubMed.
- Y. Ding, C. Zhang, L. Zhang, Y. Zhou and G. Yu, Chem, 2019, 5, 1964–1987 CAS.
- J. Kowalski, L. Su, J. D. Milshtein and F. R. Brushett, Curr. Opin. Chem. Eng., 2016, 13, 45–52 CrossRef.
- M. Skyllas-Kazacos and J. F. McCann, Vanadium redox flow batteries (VRBs) for medium- and large-scale energy storage, in Advances in Batteries for Medium and Large-Scale Energy Storage, ed. C. Menictas, M. Skyllas-Kazacos and T. M. Lim, Woodhead Publishing, 2015, ch. 10, pp. 329–386 Search PubMed.
- M. Skyllas-Kazacos and M. Kazacos, J. Power Sources, 2011, 196, 8822–8827 CrossRef CAS.
- L. Tong, Q. Chen, A. A. Wong, R. Gómez-Bombarelli, A. Aspuru-Guzik, R. G. Gordon and M. J. Aziz, Phys. Chem. Chem. Phys., 2017, 19, 31684–31691 RSC.
- E. W. Zhao, T. Liu, E. Jónsson, J. Lee, I. Temprano, R. B. Jethwa, A. Wang, H. Smith, J. Carretero-González, Q. Song and C. P. Grey, Nature, 2020, 579, 224–228 CrossRef CAS PubMed.
- E. W. Zhao, E. Jónsson, R. B. Jethwa, D. Hey, D. Lyu, A. Brookfield, P. A. A. Klusener, D. Collison and C. P. Grey, J. Am. Chem. Soc., 2021, 143, 1885–1895 CrossRef CAS PubMed.
- X. Wei, G.-G. Xia, B. Kirby, E. Thomsen, B. Li, Z. Nie, G. G. Graff, J. Liu, V. Sprenkle and W. Wang, J. Electrochem. Soc., 2015, 163, A5150–A5153 CrossRef.
- K. Lin, Q. Chen, M. R. Gerhardt, L. Tong, S. B. Kim, L. Eisenach, A. W. Valle, D. Hardee, R. G. Gordon, M. J. Aziz and M. P. Marshak, Science, 2015, 349, 1529–1532 CrossRef CAS PubMed.
- W. Lee, A. Permatasari and Y. Kwon, J. Mater. Chem. C, 2020, 8, 5727–5731 RSC.
- J. Luo, A. Sam, B. Hu, C. DeBruler, X. Wei, W. Wang and T. L. Liu, Nano Energy, 2017, 42, 215–221 CrossRef CAS.
- M. Wu, Y. Jing, A. A. Wong, E. M. Fell, S. Jin, Z. Tang, R. G. Gordon and M. J. Aziz, Chem, 2020, 6, 1432–1442 CAS.
- D. F. Evans, J. Phys. E: Sci. Instrum., 1974, 7, 247–249 CrossRef.
- M. Skyllas-Kazacos, M. Rychick and R. Robins, All-vanadium redox battery, US4786567A, 1988 Search PubMed.
- J. Friedl, M. V. Holland-Cunz, F. Cording, F. L. Pfanschilling, C. Wills, W. McFarlane, B. Schricker, R. Fleck, H. Wolfschmidt and U. Stimming, Energy Environ. Sci., 2018, 11, 3010–3018 RSC.
- L. H. Thaller, Electrically rechargeable REDOX flow cell, US3996064A, 1976 Search PubMed.
- A. E. S. Sleightholme, A. A. Shinkle, Q. Liu, Y. Li, C. W. Monroe and L. T. Thompson, J. Power Sources, 2011, 196, 5742–5745 CrossRef CAS.
- K. Gong, X. Ma, K. M. Conforti, K. J. Kuttler, J. B. Grunewald, K. L. Yeager, M. Z. Bazant, S. Gu and Y. Yan, Energy Environ. Sci., 2015, 8, 2941–2945 RSC.
- A. K. Manohar, K. M. Kim, E. Plichta, M. Hendrickson, S. Rawlings and S. R. Narayanan, J. Electrochem. Soc., 2015, 163, A5118–A5125 CrossRef.
- B. N. Figgis, M. Gerloch, R. Mason and R. S. Nyholm, Proc. R. Soc. London, Ser. A, 1969, 309, 91–118 CAS.
Footnote |
| † Electronic supplementary information (ESI) available. See DOI: 10.1039/d1cc01895g |
| This journal is © The Royal Society of Chemistry 2022 |