
 Open Access Article
 This Open Access Article is licensed under a
 Creative Commons Attribution 3.0 Unported Licence
Development and validation of simple and sensitive HPLC-UV method for ethambutol hydrochloride detection following transdermal application†
Qonita Kurnia
Anjani
 ab,
Akmal Hidayat
Bin Sabri
a and
Ryan F.
Donnelly
*a
ab,
Akmal Hidayat
Bin Sabri
a and
Ryan F.
Donnelly
*a
aSchool of Pharmacy, Queen's University Belfast, Medical Biology Centre, 97 Lisburn Road, Belfast BT9 7BL, UK. E-mail: r.donnelly@qub.ac.uk
bDepartment of Pharmaceutics, Faculty of Pharmacy, Hasanuddin University, Makassar 90245, Indonesia
First published on 13th December 2021
Abstract
A new high-performance liquid chromatographic method coupled with UV detection (HPLC-UV) to quantify ethambutol (ETH) post permeation studies following microneedle administration has been developed. This method involves the derivatization of ETH with phenethyl isocyanate (PEIC) at room temperature for 90 min. The separation of the derivative was performed using a C18 column that utilised a mobile phase consisting of 25 mM sodium dihydrogen phosphate buffer (with 1% v/v triethylamine, pH 3.0 adjusted using orthophosphoric acid) and methanol (25![[thin space (1/6-em)]](https://www.rsc.org/images/entities/char_2009.gif) :75 v/v). The developed analytical method was validated according to the standards set by the International Council on Harmonization (ICH) guidelines. The method is linear for drug concentrations within the range of 0.39–12.5 μg mL−1 (R2 = 0.9999). The validated method was found to be specific, precise, and accurate. Moreover, the ETH derivative was found to be stable under specific storage conditions. In addition, a simple and straightforward extraction procedure for extracting and quantifying ETH from the skin was developed and evaluated. The extraction procedure displayed recovery rates that range from 101.77 ± 7.10% to 102.33 ± 8.69% indicating high extraction efficiency. The developed method was utilised in assessing the permeation of ETH across dermatomed neonatal porcine skin following microneedle application. Collectively, the simple and stable HPLC method developed in this study may be of great utility in screening formulations for ethambutol within a preclinical setting through in vitro permeation studies.
:75 v/v). The developed analytical method was validated according to the standards set by the International Council on Harmonization (ICH) guidelines. The method is linear for drug concentrations within the range of 0.39–12.5 μg mL−1 (R2 = 0.9999). The validated method was found to be specific, precise, and accurate. Moreover, the ETH derivative was found to be stable under specific storage conditions. In addition, a simple and straightforward extraction procedure for extracting and quantifying ETH from the skin was developed and evaluated. The extraction procedure displayed recovery rates that range from 101.77 ± 7.10% to 102.33 ± 8.69% indicating high extraction efficiency. The developed method was utilised in assessing the permeation of ETH across dermatomed neonatal porcine skin following microneedle application. Collectively, the simple and stable HPLC method developed in this study may be of great utility in screening formulations for ethambutol within a preclinical setting through in vitro permeation studies.
1. Introduction
Tuberculosis (TB) is an infectious disease and is one of the leading causes of death worldwide, posing a major health, social and economic burden, primarily in low and middle-income countries.1 The most common combination of TB pharmacotherapeutic agents typically entails the daily administration of rifampicin, isoniazid, pyrazinamide and ethambutol (ETH) over the course of two months. The regimen is then followed by daily administration of rifampicin and isoniazid only for the subsequent four months.2–4 For the treatment of TB, ETH is available as an oral tablet containing the dextro-isomer of the drug.5 Despite the ease and simplicity via oral administration, frequent oral dosing may be associated with adverse side effects and imposes a high pill burden among patients that may result in noncompliance.6 Transdermal delivery offers promising improvements for long duration therapies of TB disease.Microneedle (MN) array technology provide an elegant approach to deliver the high-dose drugs required in TB regimes transdermally, in a painless and minimally invasive manner.7 Such a device is applied to the skin surface to form micropores that could be utilised by drug molecules to permeate and reach the microcirculation.7,8 Among the classes of MN available, hydrogel-forming MN array technology, has been reported to effectively and successfully deliver molecules of varying physiochemical properties, ranging low molecular weight to high molecular drugs.9–12 Such a delivery strategy provides a simple yet effective approach to transdermal delivery of high doses of TB drugs and may of great value in managing cutaneous TB, a condition that is a result of chronic infection of Mycobacterium tuberculosis, Mycobacterium ovis and occasionally by the Calmette-Guerin bacillus.13
The development of an effective drug delivery system must be complimented by the development of a simple yet sensitive analytical method. Such an analytical method would be of great value in evaluating the drug delivery performance of formulations, thus guiding future formulation design and refinement. In the case of ETH, several researchers have developed an ion pairing method via reversed phase HPLC for quantifying ETH in pharmaceutical dosage forms.14 Ion-pair chromatography is able to increase the affinity of charged analytes to the stationary phase, thus improving the peak shape and retention time of the solutes.15 However, such HPLC methods are typically associated with inconsistent results, due to the separation of the ion-pairs during HPLC analysis, thus limiting its utility in both formulation evaluation and biological analysis.16 Therefore, the utilisation of a precolumn derivatisation method offers the advantage of enhancing the sensitivity, selectivity and separation behaviour of the analyte of interest relative to ion-pair chromatography.17 Yan et al. developed a method based on precolumn derivatisation with phenethyl isocyanate using an LC-MS detector for determination of ETH in tablet dosage forms.18 Despite the sensitivity conferred by the method developed by Yan and co-workers, the expensive cost of acquiring, maintaining, and using LC-MS limits the utility of the method as not all researchers would have access to such instrumentation. In addition, the greater intra sample variation with each LC-MS injections relative to HPLC-UV along with the limited range of compatible buffers available for LC-MS methods are other disadvantages associated with the method.
In order, to circumvent this issue, one may opt to use HPLC-UV that is more cost-effective and is compatible with a wider range of buffer for sample analysis while overcoming the issue of intra sample variation. Nevertheless, sample analysis via HPLC-UV is not possible for compound like ETH that lack any UV chromophore. In this instance, pre-column derivatisation offers an elegant approach to introduce a UV chromophore to the drug or analyte to be detected via HPLC-UV. Collectively, there is an impetus to develop a simple yet sensitive analytical method for detecting ETH within biological tissues. In the case of microneedle-based delivery, the method should be able to detect the presence of the drug within skin tissues as this would be the first site where the drug would be released from the formulation. In addition, the ability of the method to detect the presence of ETH in the skin is of great clinical value in order to evaluate the effectiveness of microneedle-based delivery systems in providing localised delivery antibiotics for cutaneous TB.
In this paper, we present, for the first time, the development of a novel yet sensitive analytical method to quantify ETH in following in vitro skin permeation study. The method employs the use of HPLC-UV to detect ETH via precolumn derivatisation with phenethyl isocyanate. The analytical method has been validated per the International Council on Harmonization (ICH) guidelines. The method was then used to assess the drug permeation of ETH into skin tissues following MN administration in vitro. To the best of our knowledge, this is the first ever paper to report the development and validation of a HPLC-UV method for detecting ETH in skin tissues. This is of great value in evaluating the effectiveness of MN formulation in delivering antibiotics to the skin for the treatment of cutaneous TB. In addition, it is hoped that the HPLC method developed would also serve as an analytical tool for the screening and evaluation of drug delivery systems for ETH.
2. Experimental part
2.1 Chemical and materials
Ethambutol dihydrochloride (ETH) (purity, ≥98%) was purchased from Alfa Aesar (Lancashire, UK). Phenethyl isocyanate (PEIC) was purchased from Tokyo Chemical Industry (Zwijndrecht, Belgium). HPLC column Phenomenex® Luna C18 (Phenomenex, 4.6 × 150 mm, 5 μm particle size) was purchased from Phenomenex (Cheshire, UK). All other reagents were of analytical grade and purchased from standard commercial suppliers. Dermatomed neonatal porcine skin was trimmed from stillborn piglets (i.e. those that are dead upon birth) less than 24 hours post-mortem, rinsed in PBS and frozen at −20 °C until use. The piglets were kindly donated by the Agri-Food and Bioscience Institute, Hillsborough, Northern Ireland UK.2.2 Instrumentation and chromatographic conditions
The HPLC system used was an Agilent Technologies 1220 Infinity compacted LC Series, consisting of a degasser, binary pump and standard auto injector and UV detector (Agilent Technologies UK Ltd, Stockport, UK). Isocratic analysis of ETH was performed on a C18 Phenomenex® Luna column (150 × 4.6 m) with particle size of 5 μm pore size of 100 Å at room temperature. The mobile phase consisted of a mixture 25 mM sodium dihydrogen phosphate buffer (with 1% v/v triethylamine, pH 3.0 adjusted using orthophosphoric acid) and methanol (25:75 v/v). The injection volume of all samples was 50 μL, UV detection at 210 nm, flow rate of 1 mL min−1 with a run time of 7 min.
2.3 Preparation of stock and standard solutions
Stock of derivative reagent was prepared by diluting 20 mg of PEIC in acetonitrile in a 10 mL volumetric flask to achieve a 2 mg mL−1 final concentration. An ETH stock solution was prepared by dissolving 10 mg of compound in phosphate buffered saline (PBS) pH 7.4 in a 10 mL volumetric flask. In order to obtain a 100 μg mL−1 test solution, 1 mL of standard solution was taken and then diluted with PBS pH 7.4 in a 10 mL volumetric flask. The calibration standard solutions were obtained by diluting ETH standard solution in PBS.2.4 Optimization of derivatization method
2.5 Preparation of calibration standard and quality control solution
Calibration standards (CCs) were obtained by diluting the stock solutions of ETH to obtain a range of concentrations ranging from 0.19–12.5 μg mL−1. Quality control (QC) solutions were also prepared at three different concentrations: 1, 5, and 10 μg mL−1.2.6 HPLC method validation
| LOD = 3.3σ/S | (1) |
| LLOQ = 10σ/S | (2) |
| %RE = Absolute error/True value | (3) |
| %RSD = SD/Mean of concentration | (4) |
From the above equation, the absolute error is the value determined from deviation between measured concentration and theoretical concentration of the standard (true value).
2.7 Skin extraction recovery
Extraction recovery of ETH from dermatomed neonatal porcine skin were obtained by comparing the measured values of ETH from extracted samples at low, medium and high concentrations with the standard solutions. Briefly, skin samples were spiked with ETH solutions and incubated for 24 hours at 37 °C to mimic the condition for in vitro permeation study. Following this, deionised water was added to the glass vials containing the skin samples, and the mixture were then sonicated for 30 min. All the samples were then centrifuged at 14000 rpm for 15 min followed by the pre-column derivatisation procedure prior to HPLC analysis.
2.8 Stability studies
The stability of PEIC–ETH products from different derivatisation steps was evaluated. Firstly, the working solutions of pure ETH were prepared and kept under different conditions for seven days. Samples were taken every 24 hours and then transferred to an Eppendorf tube containing PEIC to perform the derivatisation procedure prior to HPLC analysis. The purpose of this step was to determine the stability of pure ETH solution as the PEIC can only form the derivatisation product with remaining ETH molecules at a certain time. Secondly, the mixture of ETH and PEIC was subjected to different storage environments and then analysed via HPLC to determine the stability of ETH–PEIC derivatives. The stabilities of all samples were evaluated under different storage conditions: bench-top (ambient temperature), refrigerator (2–8 °C), incubator at 37 °C and freeze–thaw at −20 °C. Additionally, a series of solutions were covered with aluminium foil to investigate if the derivative was prone to photodegradation. Over seven consecutive days, 1 mL of sample was taken and analysed from each vial stored under the respective conditions. All samples were prepared in triplicate and analysed using the validated HPLC method in order to evaluate the percentage of recovery.2.9 Application of the method to in vitro permeation study
An in vitro permeation study was performed using a Franz cell (Permergear, Hellertown PA, USA) set up. Briefly, the Franz cells were set up using dermatomed porcine skins. PBS (pH 7.4) was degassed and pre-heated to 37 ± 1 °C before being added to the receiver compartment. This in vitro system is used to evaluate two different drug reservoir systems. Lyophilised (LYO) reservoirs that were prepared by casting an aqueous mixture of 50% w/w drug and 2.5% w/w gelatin. The casted mixture was then lyophilised for 24 hours. On the other hand, poly(ethylene glycol) (PEG) reservoirs were fabricated by dissolving the drug into PEG mixture which consisted of 75% w/w PEG 200 and 25% w/w PEG 6000. The PEG reservoirs were then transferred to the refrigerator at −20 °C for 15 min to solidify. Hydrogel-forming MN arrays were prepared via micromoulding from an aqueous blend consisting of 20% w/w Gantrez® S-97, 7.5% PEG 10000 and 3% w/w Na2CO3 based on a previously reported method.9 The drug-containing reservoir was then placed on top of a hydrogel-forming MN arrays. The combined formulation was then applied onto the porcine skin within the donor compartment.
After 24 hours, skin and dissolution media from the receiver compartment were collected and prepared for HPLC injection. Prior to the analysis, deionised water was added to the glass vial containing skin sample, and the mixture were then sonicated for 30 min. All the samples were then centrifuged at 14000 rpm for 15 min followed by the injection of the supernatant into the HPLC column. Where necessary, samples and external standards were diluted in PBS (pH 7.4). The drug concentration ([Drug]sample) from the skin and receptor compartment after 24 hours was calculated using eqn (5).
 | (5) |
2.10 Statistical analysis
Least squares linear regression analysis, correlation analysis, percentage accuracy, percentage RSD, RE, LOD, LOQ and calculation of means and SD were all performed using Microsoft Excel™ 2019 (Microsoft Corporation, Redmond, USA). Additionally, statistical analysis on drug stability studies was carried out using GraphPad Prism® version 8.0 (GraphPad Software, San Diego, California, USA). One-way analysis of variance (ANOVA) was used for comparison in several factors of derivatisation optimisation. Two-way ANOVA was used for comparison using two factors, namely storage conditions and storage duration. In all cases, p < 0.05 was used to denote statistical significance.3. Result and discussion
3.1 Chromatographic method development
In this study, sample analysis was carried out on a C18 column (4.6 × 150 mm, 5 μm particle size) due to its versatility and suitability for a broad range of compounds. The derivatization products of PEIC–ETH have an extensive range of polarity. Additionally, the molecules of PEIC–ETH are able to appear in different ionisation states at different pH values. Accordingly, the composition of mobile phase was optimised to obtain a consistent degree of ionisation and polarity of the analytes.In the ETH–PEIC separation method, the aqueous portion of the mobile phase was a phosphate buffer at pH 3.0. As a product of precolumn derivatisation, ETH–PEIC was completely ionised over the pH range of 1–10. Therefore, it is possible to use a nonspecific buffer to elute the analytes from the stationary phase. However, the UV wavelength used in this method was 210 nm, which can increase the likelihood of PBS solvent peaks interference. This may pose a problem for ETH–PEIC detection, as PBS is the solvent used in ETH–PEIC working solution.19 Therefore, a specific pH is required to achieve specific functional group ionisation on the ETH–PEIC derivative. However, it is known that the cationic form ETH is present over the pH range of 0 to 4.2, due to the presence of secondary amine groups, NH+, of ETH. Leveraging on this physiochemical property of the derivative, phosphate buffer solution at pH 3.0 was deemed the appropriate choice of buffer to maintain the ionisation of the secondary amine group while improving chromatographic separation. Nevertheless, an asymmetrical peak (tailing) was observed in the chromatogram of ETH. Therefore, 1% v/v of triethylamine (TEA) was used in this study as one component of mobile phase to improve peak symmetry of PEIC–ETH.
Such improvement in peak symmetry upon the addition of TEA is attributed the masking properties of TEA within the mobile phase.20 PEIC–ETH is a basic charged solute which, in the absence of TEA, undergoes an ion-exchange process with the Si–OH along the stationary phase of the HPLC column, as shown in eqn (6) below. This results in the formation of a strong SiO–PEIC–ETH+ complex which does not follow regular hydrophobic retention, ultimately resulting in poor peak symmetry.
| PEIC–ETH+ + SiO–H+ ⇌ H+ + SiO–PEIC–ETH+ | (6) |
However, the presence of TEA competes with the charged derivative of PEIC–ETH+ for the silanol groups on the silica-based HPLC column. Such competition between PEIC–ETH+ with TEA for the silanol group is under constant equilibria governed by Le Chatelier's principle, as shown in eqn (7) below. This mitigates the strong ionic interaction of SiOH with PEIC–ETH+, limiting it to the conventional hydrophobic retention, thus improving peak symmetry.
| SiO–PEIC–ETH+ + TEA+ ⇌ SiO–TEA+ + PEIC–ETH+ | (7) |
3.2 Optimization of derivatization method
Several studies have explored ETH quantification via HPLC-UV. Nevertheless, such method developments for ETH quantification via HPLC-UV are indeed challenging to develop due the absence of a strong chromophore group on ETH. A number of chemical agents have been explored in the development of ETH precolumn derivatisation, namely 4-fluoro-7nitrobenzo-2oxa-1,3-diagole, copper sulphate, octylamine and PEIC.18,21,22 Most of these derivatising agents typically requires ETH extraction via the use of organic solvents, such as chloroform, prior to derivatisation. Such a requirement adds an extra layer of sample processing which could lead to incomplete drug extraction prior to sample analysis, thus limiting their utility in precolumn derivatisation method development.21 However, PEIC has been reported to offer relatively high sensitivity and selectivity in precolumn derivatisation. In this work, PEIC was chosen as the derivatising agent as the secondary aliphatic amine of ETH can react with the electrophilic isocyanate group on PEIC, resulting in the formation of PEIC–ETH derivative for analyte detection.23 In addition, the reactivity of PEIC with ETH obviates the need of ETH extraction via the use of organic solvents prior to derivatisation, thus enabling a simple and straightforward sample processing post permeation experiments. The proposed chemical reaction and derivatisation mechanism of PEIC–ETH derivatisation is illustrated in Fig. 1. It can be seen from Fig. 1 that the main derivative proposed from the reaction of ETH with the derivatising agent consist of two PEIC motif on one drug molecule. This is because in the current work, the derivatisation reaction occurred when the concentration ratio of ETH to PEIC was 1 to 200, thus ETH was reacted in excess PEIC. It is postulated that under such condition that double derivatisation would most likely to occur due to the second nucleophilic addition of an additional molecule of PEIC on the second secondary amine group on ETH. The formation of double derivatisation of ETH when the drug is reacted in the presence of excess PEIC has been previously confirmed and evidenced via LC-MS as reported by Yan et al.18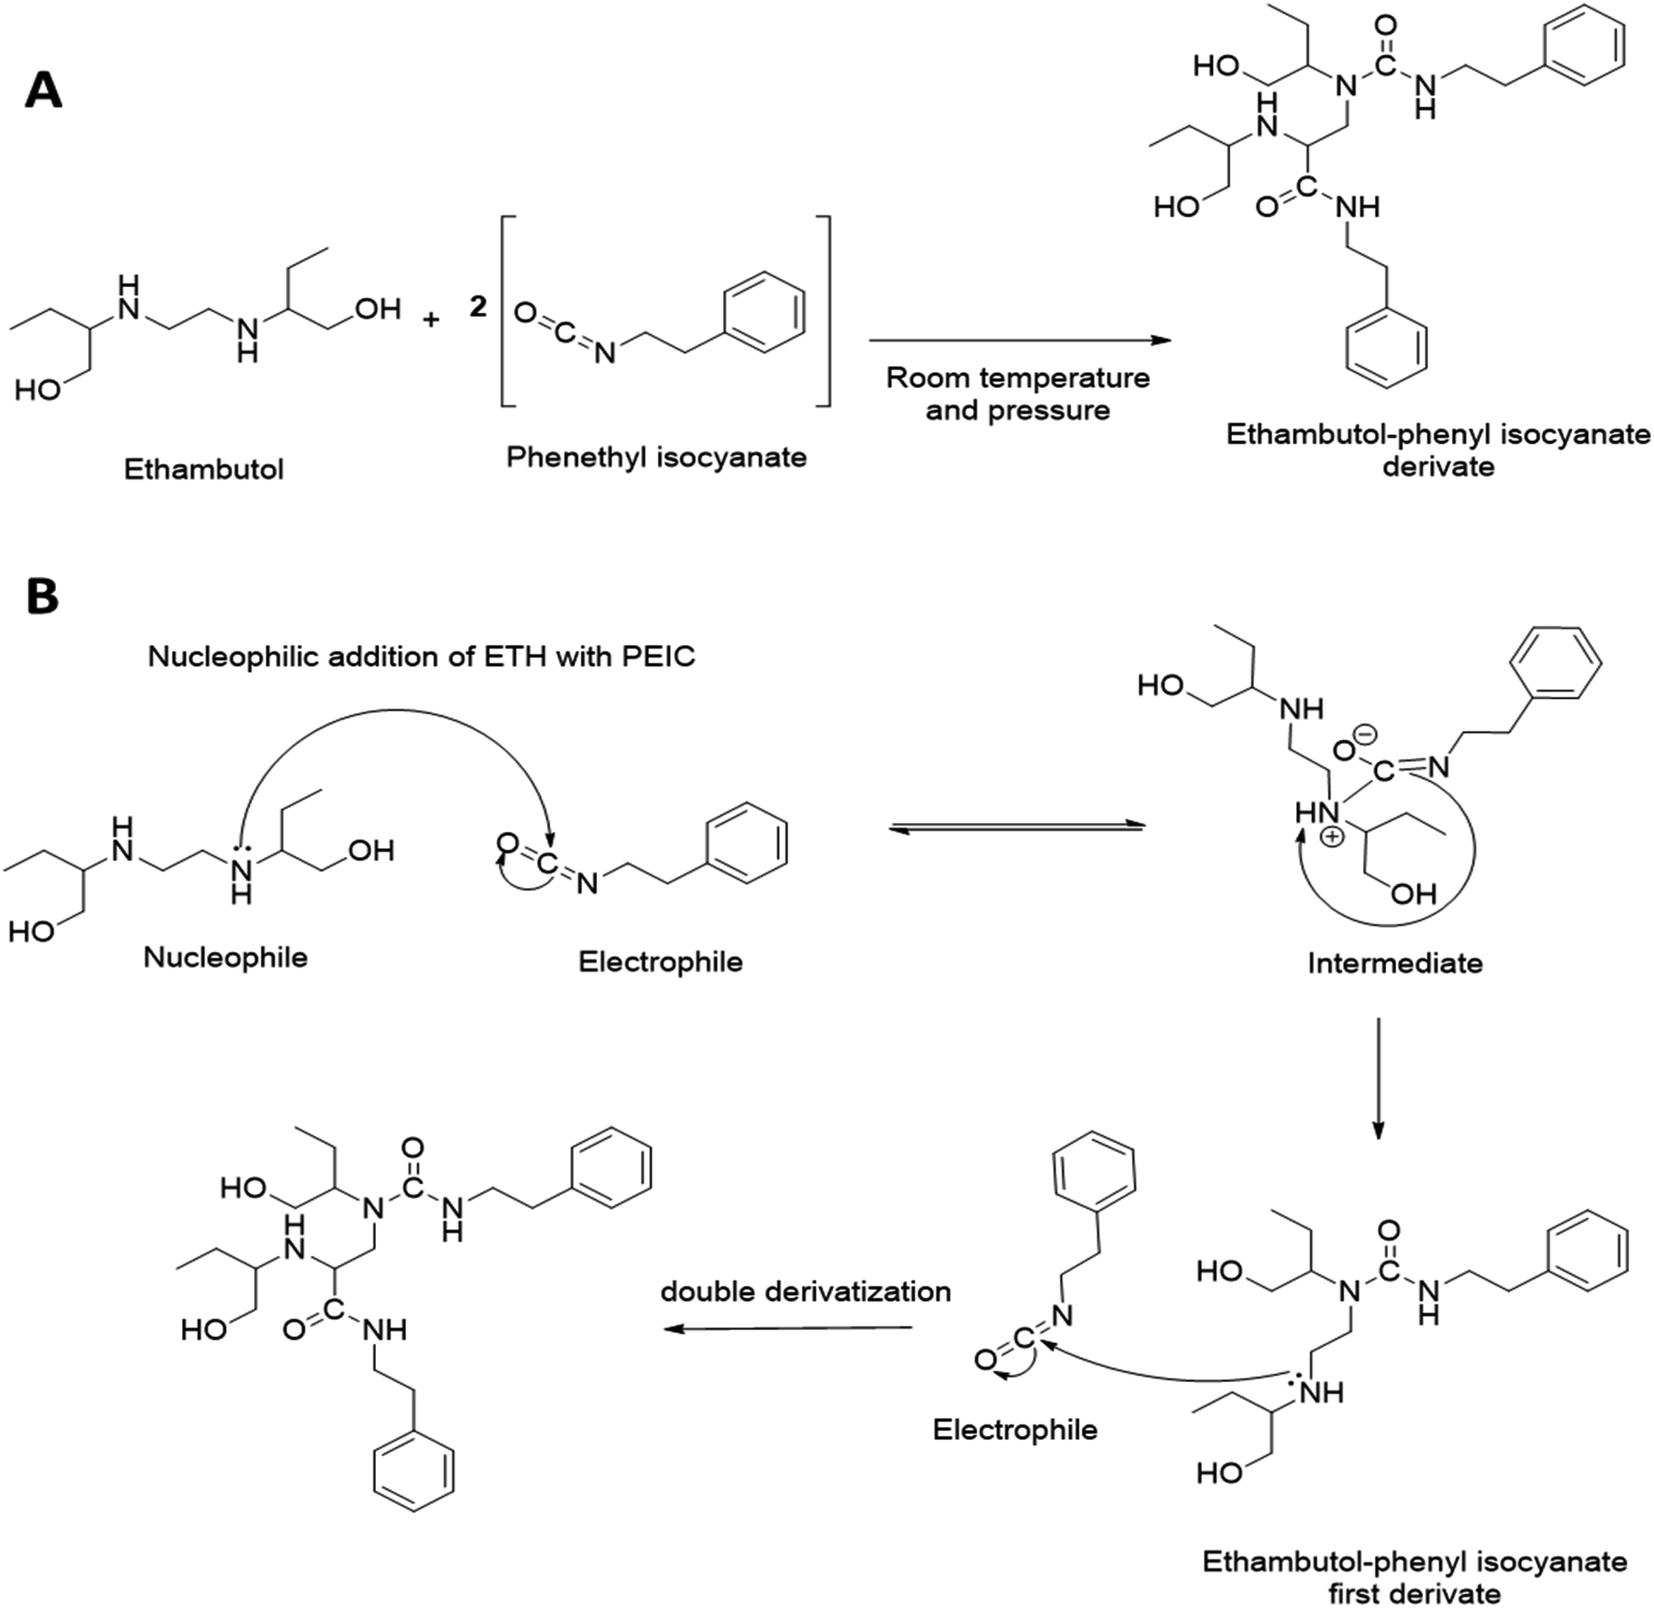 | ||
| Fig. 1 (A) Chemical reaction of PEIC–ETH derivatisation and (B) the proposed mechanism of PEIC–ETH derivatisation resulting in the formation of double derivative as PEIC was excess in the presence of ETH. | ||
In order to develop a derivatisation method for PEIC–ETH, a homogenisation method along with the processing temperatures were optimised to achieve the most reliable and consistent analytical conditions. The concentration of PEIC and reaction time were investigated, as these factors were considered to affect the outcome of the derivatisation process.
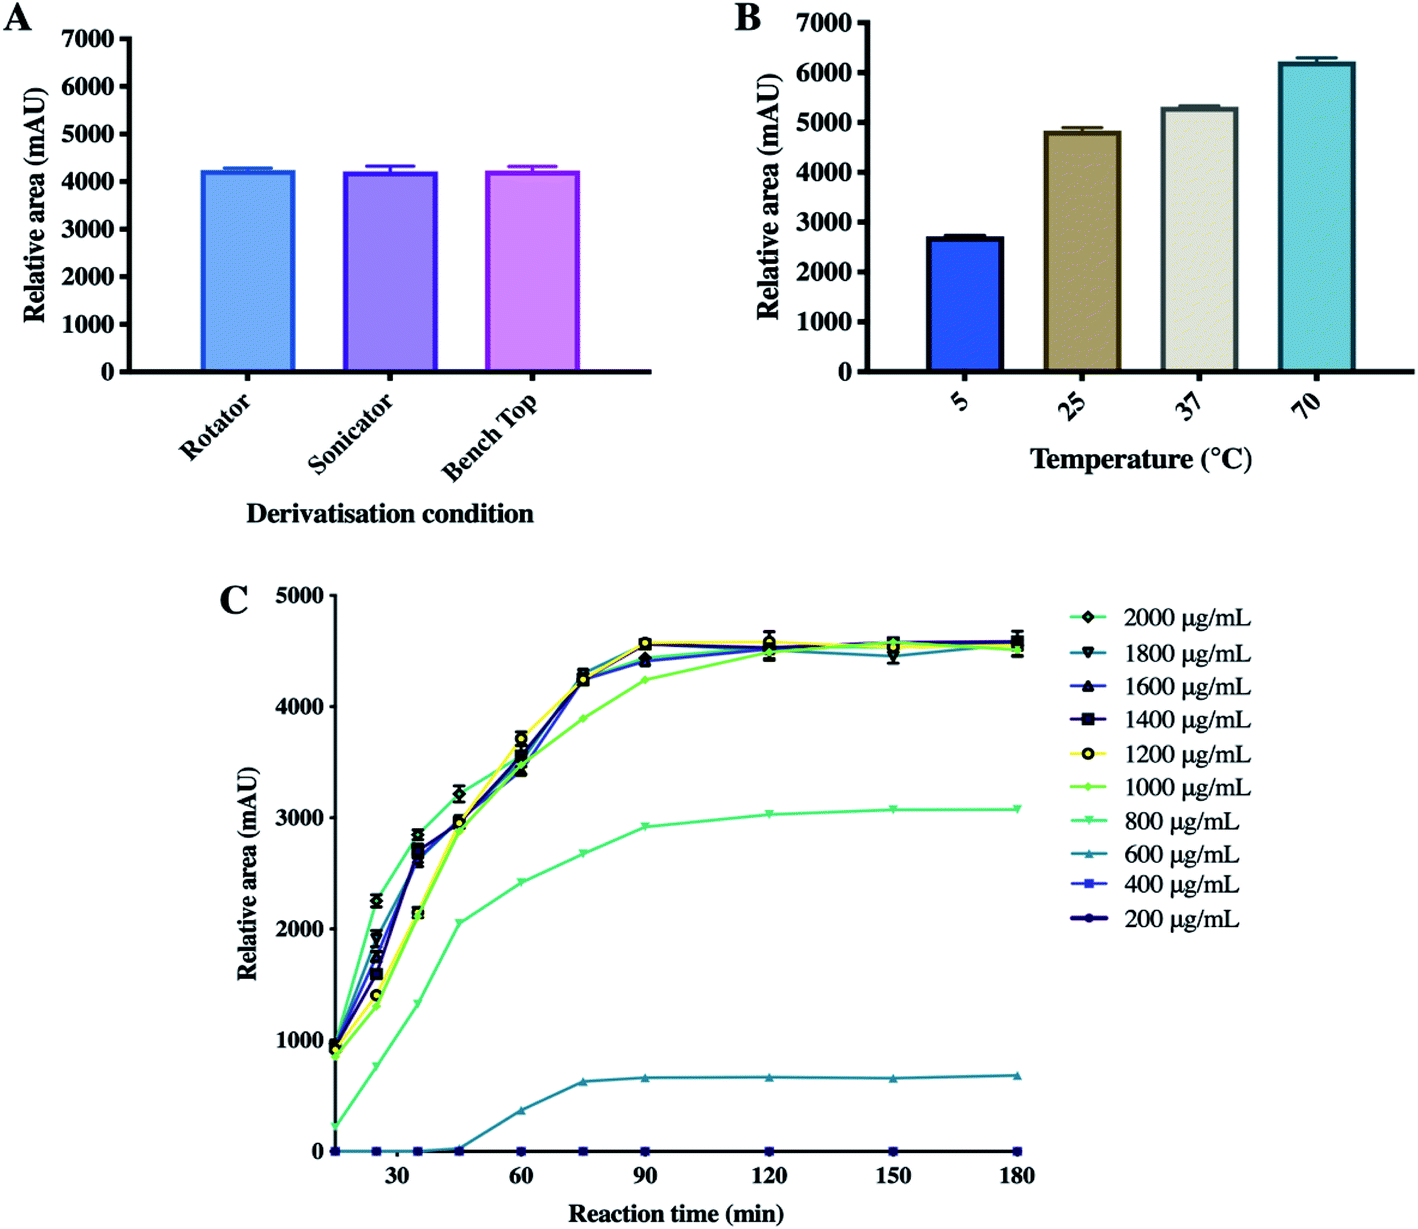 | ||
| Fig. 2 The effect of several factors on the PEIC–ETH derivatizations, namely (A) homogenisation methods, (B) temperature (means + SD, n = 3), (C) time and PEIC concentrations (means ± SD, n = 3). | ||
3.3 HPLC method validation
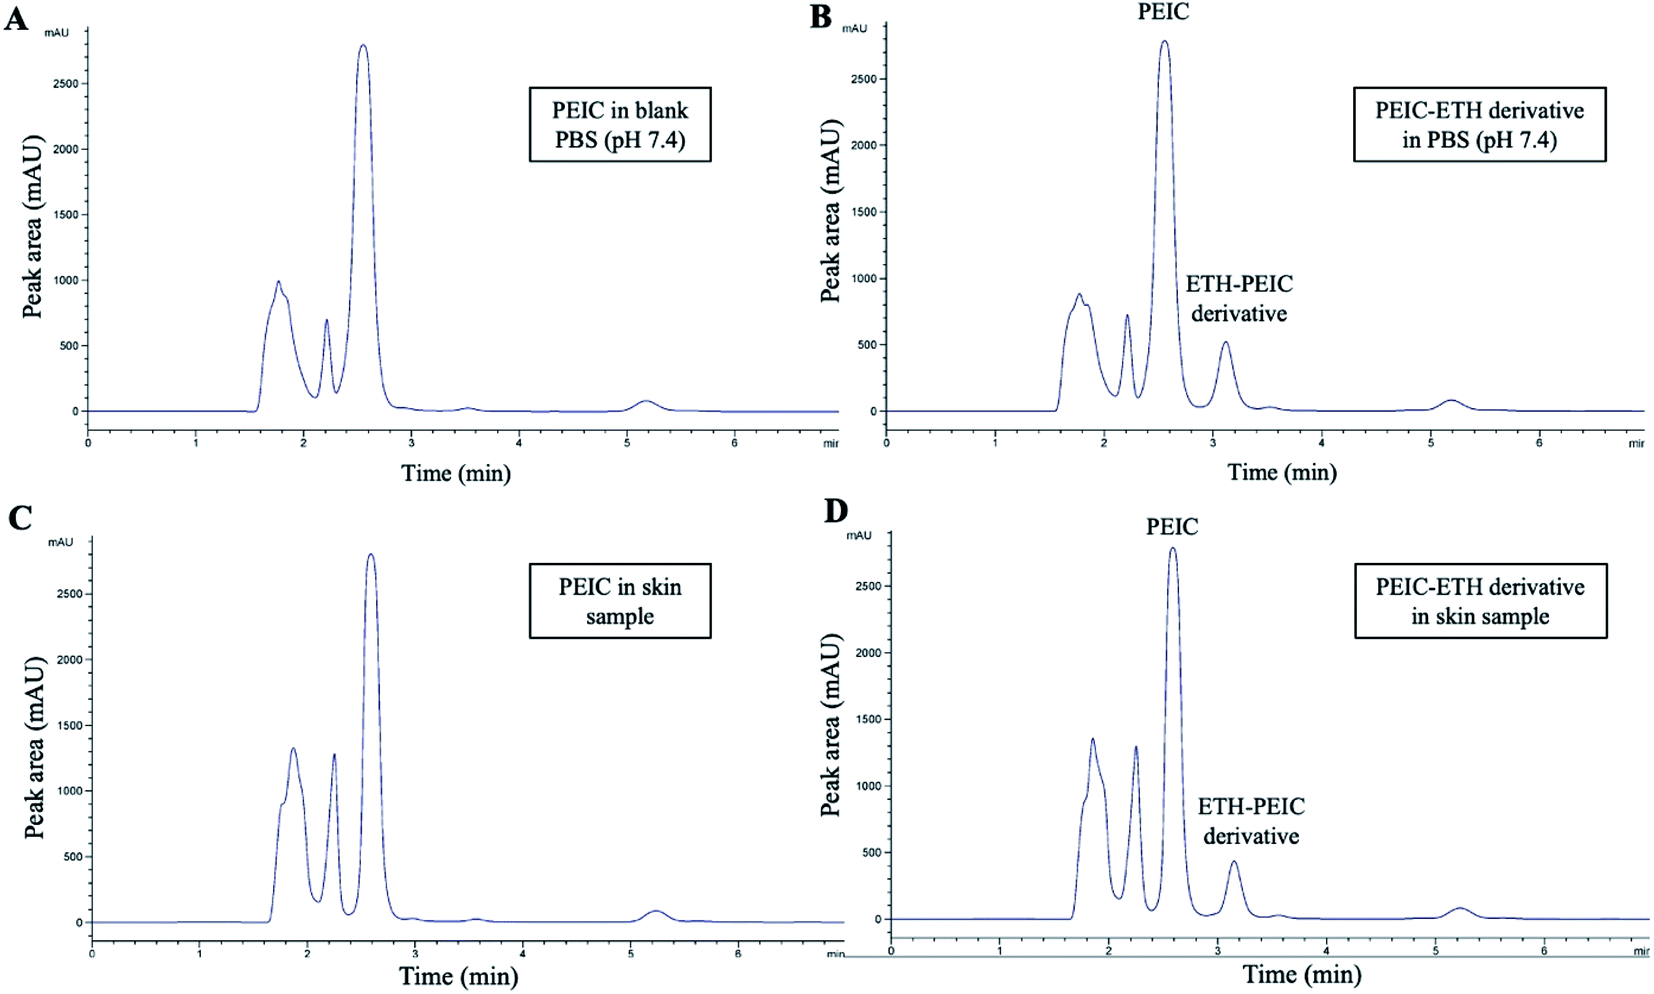 | ||
| Fig. 3 Representative HPLC-UV chromatogram of PEIC in blank PBS (pH 7.4) (A), standard solution of PEIC–ETH derivative (B), sample obtained from skin spiked with PEIC solution (1.2 mg mL−1) (C) and sample obtained from skin spiked with standard solution (D) of PEIC (1.2 mg mL−1) and ETH (100 μg mL−1). | ||
| Concentration range (μg mL−1) | Slope | y-intercept | R 2 | LOD (μg mL−1) | LOQ (μg mL−1) |
|---|---|---|---|---|---|
| 0.39–12.5 | 225.43 | 61.82 | 0.9999 | 0.08 | 0.25 |
| Concentration added (μg mL−1) | Intra-day | Inter-day | ||||
|---|---|---|---|---|---|---|
| Concentration found (μg mL−1) | Precision (%RSD) | Accuracy (%RE) | Concentration found (μg mL−1) | Precision (%RSD) | Accuracy (%RE) | |
| 1 | 1.03 ± 0.01 | 1.82 | 3.43 | 1.04 ± 0.00 | 0.07 | 4.81 |
| 5 | 4.97 ± 0.02 | 0.54 | −0.45 | 5.03 ± 0.02 | 0.40 | 0.62 |
| 10 | 9.72 ± 0.05 | 0.52 | −2.70 | 9.84 ± 0.01 | 0.15 | −1.58 |
3.4 Skin extraction recovery
The skin extraction recoveries of ETH following extraction from dermatomed neonatal porcine skin were obtained by comparing the concentrations of spiked samples at three different concentrations (1, 5 and 10 μg mL−1) to the standard solutions. The results from recovery test are presented in Table 3. The mean recoveries of ETH were between 101.77 ± 7.10% and 102.33 ± 8.69%. The high recovery rates displayed indicate the extraction procedure displayed high extraction efficiency of ETH from the skin. Moreover, based on the result shown, the extraction method was considered to be consistent, precise and reproducible, since the %RSD values were found to be in the within the range of 3.32–8.49%, which is under the required limit of 15%.29| Concentration added (μg mL−1) | %Skin extraction recovery ± SD | %RSD |
|---|---|---|
| 1 | 101.77 ± 7.10 | 6.97 |
| 5 | 102.33 ± 8.69 | 8.49 |
| 10 | 102.03 ± 3.39 | 3.32 |
3.5 Stability studies
The stability of ETH–PEIC derivative within the receptor media was investigated. In addition, several conditions were evaluated to decipher under which storage conditions would the drug solution remain stable. In this study, the degradation was recorded as the decline in percentage of drug recovery for every 24 hours. As displayed in Fig. 2A supplemental data, a negligible loss of ETH was observed after four days of storage under all the conditions evaluated. Moreover, no significant differences with respect to degradation were found amongst the storage condition evaluated for ETH working solution over the course of four days (p > 0.05). In terms of the stability of the derivative product (Fig. 2B supplemental data), PEIC–ETH was stable under all conditions for up to seven days. This finding was confirmed by previous published work, where it was described that PEIC can form stable isourea linkages with molecules containing amine group, thus endowing the derivative with good sample stability prior to analysis.30In summary, the ETH working solutions and ETH–PEIC mixture solutions can be prepared and stored for four and seven days, respectively. Such stability conferred by the derivatisation product suggests the analytical procedure does not necessitate immediate sample analysis post derivatisation. Coupled with the simplicity in the spontaneous bench top reaction of PEIC with ETH, the analytical method developed in the current work offers great flexibility in analysis with respect to research settings where access to equipment is not always immediate. In addition, such good stability also offers the simplicity and ease of sample transfer from one research institute to another without the need of cold storage. Furthermore, the validated method presented in our current work does not only display a simple, straightforward and stable method for derivatising ETH but chromatographic conditions used in analysing the sample is far shorter, 7 min, relative to the 20 min run time presented by Yan and co-worker.18 This shorter run time may be of great benefit for formulators and analytical scientists to rapidly analyse large samples number within a shorter period of time during formulation development and optimisation.
3.6 Application of the method to in vitro permeation study
We evaluated two types of drug reservoirs used in tandem with hydrogel-forming MN arrays for the delivery ETH. These reservoirs were LYO reservoir and PEG reservoir. The validated HPLC method was employed to quantify the amount of ETH that have permeated into and across the skin following a 24 hours MN application (Fig. 4). The amount of ETH extracted from the skin was found to be 0.46 ± 0.02 mg and 5.90 ± 1.32 mg from PEG and LYO reservoir, respectively. In addition, the combination of the LYO reservoir with hydrogel-forming MN arrays delivered 17.01 ± 1.07 mg into the receptor compartment following a 24 hours MN application. The amount of ETH permeated across the skin was significantly higher than that of PEG reservoir, which delivered only 8.26 ± 0.52 mg at 24 hours (p < 0.05). This suggest that the combination of LYO reservoir with hydrogel forming microneedles offer an excellent synergy in terms of the amount of ETH that can be delivered into and across the skin. Such enhancement in the delivery of ETH through the combination of LYO reservoir with hydrogel forming MNs may be attributed to the presence of gelatin within the wafer.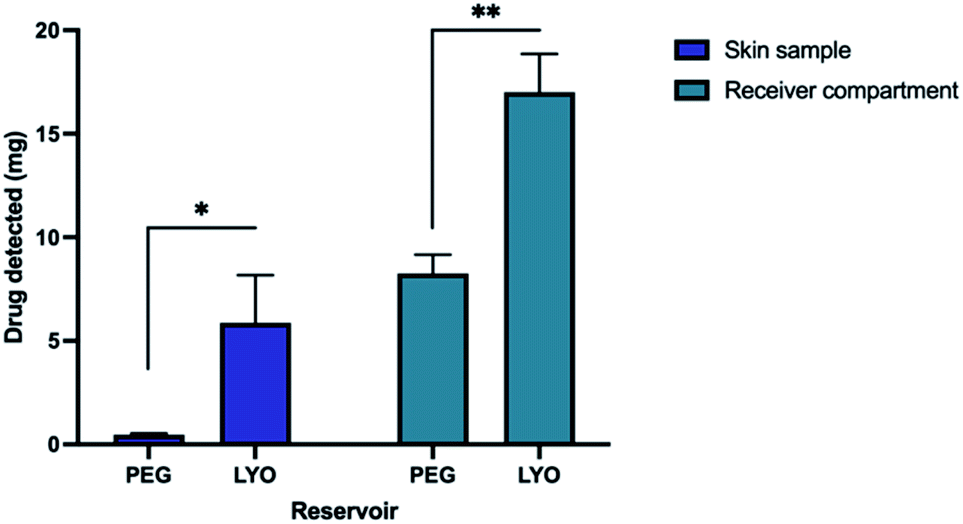 | ||
| Fig. 4 The percentage of ETH extracted from skin and receiver compartment at 24 h after MN application (means + SD, n = 3). | ||
Upon skin application, interstitial fluid from the skin slowly imbibes into the MNs leading to the swelling and formation of a continuous hydrogel network. Once the hydrogel network has been established within the MNs, water molecules can then diffuse into the LYO wafer that functions as a drug reservoir. This wafer layer also contains gelatin that is traditionally used as tablet binder. However, this pharmaceutical excipient is very hygroscopic in nature.31 The presence gelatin endows the reservoir with additional osmotic pressure to draw water up more water molecules at a faster rate from the skin via the hydrogel network into the wafer.32 This would promote faster dissolution and release of ETH from the reservoir and into the skin relative to the PEG reservoir. The absence of gelatin within the PEG reservoir fails to draw up as much water molecule relative to LYO wafer. In the case of PEG reservoir, the diffusion of water molecules into the drug containing layer will be a passive process without the assistance of any additional osmotic pressure.
This delivery profile exhibited by LYO wafer when used in combination with hydrogel forming MNs may be of great clinical value in delivering systemic and intradermal doses of ETH for managing TB. The ability of this combinatorial approach to deliver high doses of ETH intradermally may be of great therapeutic benefit for the treatment of cutaneous TB. Collectively, this result highlighted that the HPLC method developed in this study was effectively applied to evaluate and quantify the permeation of ETH from different drug reservoir-hydrogel MN combinations. Such quantification enables us to elucidate the different release profiles from the different drug reservoirs. Indeed, the current work highlights that the analytical method is successful in evaluating ETH permeation profile following MN application. However, we envisioned that this analytical method would still be applicable in evaluating and elucidating the delivery profile of other transdermal delivery systems such as the conventional transdermal patch, niosomes and jet injectors.
4. Conclusion
In conclusion, the current work highlights the development and validation of a simple derivatisation method and analytical procedures for the sensitive and reliable detection and quantification of ETH. The method was successfully developed using HPLC-UV for detecting ETH following in vitro permeation studies post MN application. The analytical method was validated following the criteria recommended by the ICH guidelines. The specificity, linearity, linear concentration range, LOD, LOQ, accuracy and precision were determined for the method. In addition, the analytical method was shown to be specific, with acceptable precision and accuracy. In addition, the derivatization product of PEIC and ETH was found to be stable under the specific storage condition and storage time. The HPLC method was successfully applied to determine ETH permeation profile from an in vitro permeation study following MN application. It is hoped that such method may be of great heuristic value in preclinical ETH formulation screening, evaluation, and development.Author contributions
Qonita Kurnia Anjani: conceptualization, methodology, visualization, investigation, validation, data curation, writing – original draft. Akmal Hidayat Bin Sabri: investigation, writing – review & editing. Ryan F. Donnelly: conceptualization, methodology, writing – review & editing, supervision.Conflicts of interest
There are no conflicts to declare.Acknowledgements
Authors thank Luki Ahmadi Hari Wardoyo for his support in providing and designing the illustrations included in this manuscript. Authors also gratefully acknowledge the Indonesian Endowment Fund for Education (Lembaga Pengelola Dana Pendidikan/LPDP) scholarship for their financial support to this work.Notes and references
- M. Pai, M. A. Behr, D. Dowdy, K. Dheda, M. Divangahi, C. C. Boehme, A. Ginsberg, S. Swaminathan, M. Spigelman, H. Getahun, D. Menzies and M. Raviglione, Nat. Rev. Dis. Primers, 2016, 2, 1–23 CrossRef PubMed
.
- S. Ahmad and E. Mokaddas, J. Infect. Public Health, 2014, 7, 75–91 CrossRef PubMed
- J. G. Douglas and M. J. McLeod, Clin. Pharmacokinet., 1999, 37, 127–146 CrossRef CAS PubMed
- A. Zumla, J. Chakaya, R. Centis, L. D'Ambrosio, P. Mwaba, M. Bates, N. Kapata, T. Nyirenda, D. Chanda, S. Mfinanga, M. Hoelscher, M. Maeurer and G. B. Migliori, Lancet Respir. Med., 2015, 3, 220–234 CrossRef PubMed
- S. Chakraborty and K. Y. Rhee, Cold Spring Harbor Perspect. Med., 2015, 5, 1–11 CAS
- B. Saifullah, M. Z. B. Hussein and S. H. H. Al Ali, Int. J. Nanomed., 2012, 7, 5451–5463 CrossRef CAS PubMed
- R. F. Donnelly, R. R. S. Thakur, M. J. Garland, K. Migalska, R. Majithiya, C. M. McCrudden, P. L. Kole, T. M. T. Mahmood, H. O. McCarthy and A. D. Woolfson, Adv. Funct. Mater., 2012, 22, 4879–4890 CrossRef CAS PubMed
-
R. F. Donnelly, R. R. S. Thakur, D. I. J. Morrow and A. D. Woolfson, Microneedle-mediated transdermal and intradermal drug delivery, Wiley-Blackwell, Chichester, 2012 Search PubMed
- R. F. Donnelly, M. T. C. McCrudden, A. Z. Alkilani, E. Larrañeta, E. McAlister, A. J. Courtenay, M. C. Kearney, R. R. S. Thakur, H. O. McCarthy, V. L. Kett, E. Caffarel-Salvador, S. Al-Zahrani and A. D. Woolfson, PLoS One, 2014, 9, 1–12 Search PubMed
- E. M. Migdadi, A. J. Courtenay, I. A. Tekko, M. T. C. McCrudden, M. C. Kearney, E. McAlister, H. O. McCarthy and R. F. Donnelly, J. Contr. Release, 2018, 285, 142–151 CrossRef CAS PubMed
- X. Gao and N. K. Brogden, J. Pharmaceut. Sci., 2019, 108, 3695–3703 CrossRef CAS PubMed
- M. C. Kearney, P. E. McKenna, H. L. Quinn, A. J. Courtenay, E. Larrañeta and R. F. Donnelly, Pharmaceutics, 2019, 11, 1–17 CrossRef PubMed
- J. B. dos Santos, A. R. Figueiredo, C. E. Ferraz, M. H. de Oliveira, P. G. da Silva and V. L. S. de Medeiros, An. Bras. Dermatol., 2014, 89, 219–229 CrossRef PubMed
- Z. Jiang, H. Wang and D. C. Locke, Anal. Chim. Acta, 2002, 456, 189–192 CrossRef CAS
- C. J. Bhanushali, A. S. Zidan, Z. Rahman and M. J. Habib, AAPS PharmSciTech, 2013, 14, 1313–1320 CrossRef CAS PubMed
-
M. C. García-Alvarez-Coque, G. Ramis-Ramos and M. J. Ruiz-Angel, Encyclopedia of Analytical Science, 2019, pp. 117–126 Search PubMed
-
H. van der Jagt, in Encyclopedia of Analytical Science, 2019 Search PubMed
- M. Yan, T. Guo, H. Song, Q. Zhao and Y. Sui, J. Chromatogr. Sci., 2007, 45, 269–272 CAS
- M. Swartz, J. Liq. Chromatogr. Relat. Technol., 2010, 33, 1130–1150 CrossRef CAS
- A. I. Gasco-López, A. Santos-Montes and R. Izquierdo-Hornillos, J. Chromatogr. Sci., 1997, 35, 525–535 Search PubMed
- P. Chenevier, L. Massias, D. Gueylard and R. Farinotti, J. Chromatogr. B: Biomed. Sci. Appl., 1998, 708, 310–315 CrossRef CAS
- M. Breda, P. Marrari, E. Pianezzola and M. Strolin Benedetti, J. Chromatogr. A, 1996, 729, 301–307 CrossRef CAS PubMed
-
N. D. Danielson, P. A. Gallagher and J. J. Bao, in Encyclopedia of Analytical Chemistry, John Wiley & Sons, Ltd, 2008 Search PubMed
- Q. K. Anjani, A. D. Permana, Á. Cárcamo-Martínez, J. Domínguez-Robles, I. A. Tekko, E. Larrañeta, L. K. Vora, D. Ramadon and R. F. Donnelly, Eur. J. Pharm. Biopharm., 2021, 294–312, 294–312 CrossRef PubMed
- H. Li, J. R. Lee, D. Q. A. Nguyen, S. B. Kim, Y. G. Seo, Y. K. Chang, S. K. Hong, M. H. Moon, I. Y. Chung and C. J. Kim, J. Pharm. Biomed. Anal., 2009, 49, 957–963 CrossRef CAS PubMed
- M. N. Pereira, B. N. Matos, T. Gratieri, M. Cunha-Filho and G. M. Gelfuso, J. Pharm. Biomed. Anal., 2018, 159, 331–340 CrossRef CAS PubMed
- O. González, M. E. Blanco, G. Iriarte, L. Bartolomé, M. I. Maguregui and R. M. Alonso, J. Chromatogr. A, 2014, 1353, 10–27 CrossRef PubMed
- ICH, 2005.
- A. D. Permana, E. Wahyudin, I. Ismail, M. N. Amir, M. Raihan, Q. K. Anjani, E. Utomo, P. Layadi and R. F. Donnelly, Anal. Methods, 2021, 13, 933–945 RSC
-
G. T. Hermanson, in Bioconjugate Techniques, Elsevier Inc., 2013 Search PubMed
- N. Oladzadabbasabadi, S. Ebadi, A. Mohammadi Nafchi, A. A. Karim and S. R. Kiahosseini, Carbohydr. Polym., 2017, 160, 43–51 CrossRef CAS PubMed
- M. Zheng, Z. Wang, H. Chang, L. Wang, S. W. T. Chew, D. C. S. Lio, M. Cui, L. Liu, B. C. K. Tee and C. Xu, Adv. Healthcare Mater., 2020, 9, 1901683 CrossRef CAS PubMed
Footnote |
| † Electronic supplementary information (ESI) available. See DOI: 10.1039/d1ay01414e |
| This journal is © The Royal Society of Chemistry 2022 |