 Open Access Article
Creative Commons Attribution 3.0 Unported Licence
Radiation treatment response and hypoxia biomarkers revealed by machine learning assisted Raman spectroscopy in tumour cells and xenograft tissues
Xinchen
Deng
 a,
Kirsty
Milligan
 a,
Alexandre
Brolo
 b,
Julian J.
Lum
cd,
Jeffrey L.
Andrews
e and
Andrew
Jirasek
*a
aDepartment of Physics, The University of British Columbia – Okanagan campus, Kelowna, Canada V1V 1V7. E-mail: andrew.jirasek@ubc.ca
bDepartment of Chemistry, University of Victoria, Victoria, Canada V8P 5C2
cDepartment of Biochemistry and Microbiology, University of Victoria, Victoria, Canada V8P 5C2
dTrev and Joyce Deeley Research Centre, BC Cancer, Victoria, Canada V8R 6V5
eDepartment of Statistics, The University of British Columbia – Okanagan campus, Kelowna, Canada V1V 1V7
First published on 26th September 2022
Abstract
Recent advancements in anatomical imaging of tumours as treatment targets have led to improvements in RT. However, it is unlikely that improved anatomical imaging alone will be the sole driver for new advances in personalised RT. Biochemically based radiobiological information is likely to be required for next-generation improvements in the personalisation of radiotherapy dose prescriptions to individual patients. In this paper, we use Raman spectroscopy (RS), an optical technique, to monitor individual biochemical response to radiation within a tumour microenvironment. We spatially correlate individual biochemical responses to augmentatively derived hypoxic maps within the tumour microenvironment. Furthermore, we pair RS with a data analytical framework combining (i) group and basis restricted non-negative matrix factorization (GBR-NMF), (ii) a random forest (RF) classifier, (iii) and a feature metric importance calculation method, Shapley Additive exPlanations (SHAP), in order to ascertain the relative importance of individual biochemicals in describing the overall biological response as observed with RS. The current study found that the GBR-NMF-RF-SHAP model helped identify a wide range of radiation response biomarkers and hypoxia indicators (e.g., glycogen, lipids, DNA, amino acids) in H460 human lung cancer cells and H460 xenografts. Correlations between the hypoxic regions and Raman chemical biomarkers (e.g., glycogen, alanine, and arginine) were also identified in H460 xenografts. To summarize, GBR-NMF-RF-SHAP combined with RS can be applied to monitor the RT-induced biochemical response within cellular and tissue environments. Individual biochemicals were identified that (i) contributed to overall biological response to radiation, and (ii) spatially correlated with hypoxic regions of the tumour. RS combined with our analytical pipeline shows promise for further understanding of individual biochemical dynamics in radiation response for use in cancer therapy.
1. Introduction
Cancer results in an estimated 7.6 million deaths per year worldwide.1 Radiation therapy (RT) is an essential cancer treatment modality prescribed to approximately 50% of all cancer patients during their course of illness.1 RT treats cancer by delivering ionising radiation to the tumour producing irreversible bio-molecular damage that leads to cell death.1,2 The advancements in imaging modalities such as computed tomography (CT) and magnetic resonance imaging (MRI) have improved the efficacy in treatment plan design in current RT protocols.3,4 For example, image-guided radiation therapy (IGRT) has helped clinicians obtain excellent conformity of radiation dose distribution to tumour shape in order to ensure thorough coverage of treatment targets while sparing healthy tissues.3,4Although advancements in anatomical imaging of tumours as treatment targets have led to improvements in RT, it is unlikely that the improved anatomical imaging will be the sole solution for personalised RT.2 The interest in applying personalised treatment plans has been growing as the knowledge of cancer biology and radio-biology deepens within the cancer research and treatment community. Resistance to RT often occurs in the hypoxic (low oxygen) regions of tumours, which leads to unsatisfactory clinical outcomes by reducing the efficacy of radiotherapy, resulting in lower tumour control and overall survival.2,5 Hypoxia is associated with complex metabolic pathways in the tumour microenvironment.6,7 However, an efficient technique to simultaneously monitor multiple biochemical changes within the tumour microenvironment during RT has not been developed.
Raman spectroscopy (RS) is a non-invasive optical technique that provides a detailed spectroscopic description of the molecular composition within a sample. RS can be attractive in the clinical setting as it can yield fingerprints of multiple chemical biomarkers simultaneously without destroying the biological sample.8 To analyze the spectral data acquired from RS, dimensionality reduction techniques are typically applied to parse the covariant features in the spectra.8 Unsupervised dimensionality reduction techniques such as principal component analysis (PCA) and non-negative matrix factorization (NMF) have helped discover glycogen and lipids as radiation response Raman biomarkers in cancer cells and tissue samples.9–17 However, unsupervised dimensionality reduction methods can also lead to interpretability problems when used to interpret the biochemical information contained within RS data, as biological components do not necessarily segregate along individual reduced dimensions (e.g. PCs).
To tackle this challenge, a group and basis restricted non-negative matrix factorization (GBR-NMF) algorithm has been previously developed by our group in order to decompose the spectral data with constrained chemical bases of interest.18 GBR-NMF is a semi-supervised dimension reduction method, which helps to improve the interpretability of the decomposed RS data, and hence aid in monitoring radiation response.19,20 Moreover, GBR-NMF can be combined with a classifier method such as random forest (RF) to form a data analytical framework (GBR-NMF-RF) to stratify the relative importance of each of the GBR-NMF decomposed biochemicals. RF ensembles a collection of decision classifiers and generates the overall classification result based on the individual voting results of tree classifiers within the forest.21
The aim of the current study is to apply GBR-NMF-RF data analytical framework and the feature importance metric (e.g., SHapley Additive exPlanations [SHAP]) to analyze Raman cellular and spectral tissue data. RF classifies the irradiated and non-irradiated cancer cellular and tissue samples based on the GBR-NMF decomposed chemical scores. In addition, RF can pair with the feature importance evaluation metrics (e.g., SHAP) to measure the contribution of chemicals during the classification tests. SHAP is a game theoretic approach to explaining the effects of features on the predictions.
Using the GBR-NMF-RF analytical framework, we first examines which biomarkers RS can track when monitoring radiation response in cancer under different micro-environments (cellular vs. tissue). The present study also investigated whether biochemical changes detected by RS can be associated with tumour biological features such as hypoxia in the tumour microenvironment. Hypoxia, as a standard feature of solid tumours can deprive the oxygen supply and impair blood flow due to abnormal angiogenesis (the formation of abnormal blood vessels supplying the tumour).22 Thus, not only cancer cells but also the tumour microenvironment is affected by hypoxia-induced changes.22,23 To investigate which biomarkers correlate with hypoxic regions in the tissue, three data sets (Table 1) that cover cells and xenografts derived from human lung (H460) were selected. The random forest classifier in GBR-NMF-RF is used to classify the cellular and tissue data sets into irradiated and non-irradiated classes. After RF classification, the feature importance ranked by SHAP uncovered the variability of the chemical scores before and after the radiation treatment and correlations between hypoxic regions and chemical spatial distribution.
| Data names | Descriptions |
|---|---|
| Cellular data set (Matthews et al.11) | 360 H460 cellular spectra (irradiated at 0, 2, 4, 6, 8, and 10 Gy harvested at day 3) |
| Tissue data set 1 (Harder et al.13) | 6280 H460 xenografts tissue spectra from 12 mice (irradiated at 0 Gy, 5 Gy and 15 Gy and harvested at day 3) |
| Tissue data set 2 (Van Nest et al.15) | 2960 H460 xenografts tissue spectra from 6 mice (irradiated at 0 Gy and 15 Gy and harvested at day 3) |
The feature importance ranked by SHAP uncovered the biochemical variability in H460 cells and H460 tissue xenografts, pre and post-irradiation. In both the H460 cells and H460 tissue xenografts, radiation induced changes in the following biochemicals were observed; glycogen, lipids, DNA and amino acids. In addition, this study also discovered the co-expression of hypoxia and Raman chemical biomarkers (e.g., glycogen, alanine, and arginine) in the tissue tumour microenvironment. RS assisted with GBR-NMF-RF data analytical framework has demonstrated outstanding capability to monitor the RT-induced biochemical response within the tumour microenvironment.
2. Materials and methods
2.1. Tumour cellular and tissue samples cultures and irradiation
The acquisition procedures of tissue data set 1 were summarised based on Harder et al.12 The mice were irradiated when tumour sizes reached 10–12 mm diameter. Each mouse was anesthetized using a single intraperitoneal (IP) injection of Ketamine/Dexdomitor mixture (50 mg kg−1 Ketamine and 0.5 mg kg−1 Dexdomitor based on body weight). After confirmation of anesthesia, individual mice were placed into a custom-designed restraining acrylic chamber and placed near the isocentre of a Varian Truebeam STx linear accelerator (LINAC) (Varian Medical Systems Inc., Palo Alto, CA, USA). Based on treatment plans made in Eclipse (version 11) treatment planning software (Varian Medical Systems Inc.), irradiations were delivered via a 6 MV photon beam with a dose rate of 6 Gy per minute at isocentre. Single fractions of 0, 5, and 15 Gy dose were delivered to the tumour tissues. Mice were euthanized three days post-irradiation. Removed tumour tissues from mice for Raman spectral analysis were embedded in mounting medium (Tissue-Tek O.C.T.™ Sakura Finetek Europe B.V., The Netherlands), flash-frozen in liquid nitrogen, and stored at −80 °C.
Tissue data set 2 were acquired by Van Nest et al.15 The animals were prepared for irradiation when the tumour volume was below 80 mm2 or above 130 mm2 with an average tumour volume of 97 ± 7mm2. The animals were anesthetized using isoflurane inhalation (2%, in oxygen). Treatment plans were made using Muriplan (Gulmay Medical Inc.) to deliver single fractions of 0 or 15 Gy dose the tumour at a dose rate of 4 Gy min−1. Mice were treated using a small animal radiation research platform (SARRP, Xstrahl, Gulmay Medical Inc., Suwanee, GA) and imaged using a single cone-beam computed tomography (CBCT) scan. For tumour tissues involving evaluation of carbonic anhydrase IX (CAIX) expression, tumours were irradiated with a Varian Truebeam STx linear accelerator (LINAC) (Varian Medical Systems Inc., Palo Alto, CA, USA) via a 6 MV photon beam with a dose rate of 6 Gy per minute. Mice were euthanized through isoflurane overdose (5%, in oxygen) and cervical dislocation at three days post-irradiation for tumour extraction. Tumours were extracted and embedded in the mounting medium (Tissue-Tek O.C.T. Sakura Tinetek Europe B.V., The Netherlands), flash-frozen in liquid nitrogen, and stored at –80 °C immediately after euthanasia.
2.2. Raman reference chemical library selection
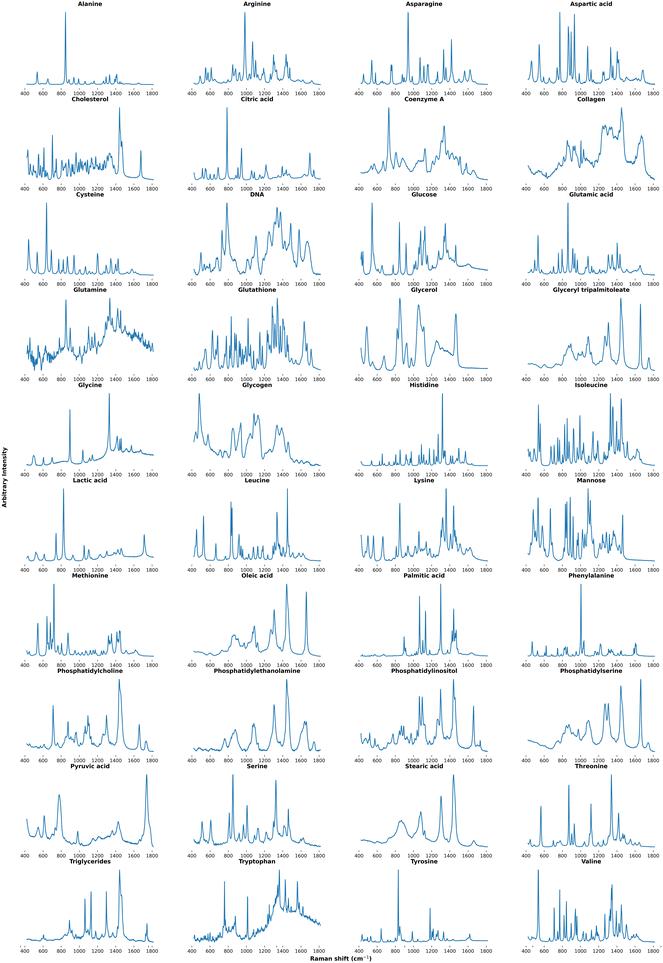
A Raman reference chemical library included 40 chemicals and was constructed to cover a range of biochemicals known to be present within the Raman cellular spectra, which includes carbohydrates, lipids, enzymes, amino acids, and nucleic acids.20,24–27 The chemical reference libraries were built based on the biological composition of cells and biomolecular dynamics in cancer metabolism. Traditionally, cancer metabolism studies usually focus on the central carbon metabolism (e.g., glycolysis and the tricarboxylic acid cycle [the citric acid cycle, TCA cycle]). However, given the essential roles played by amino acids in the reprogramming of cancer metabolism, amino acids are also investigated here. Extending from the previously built Raman chemical reference library,19,20 new amino acids (e.g., glycine, leucine, lysine, and threonine) are added in the current study. RS reference chemicals are listed in Table 2, and the spectra are shown in Fig. 7.| Chemical names | Abbreviation |
|---|---|
| Alanine | Ala |
| Arginine | Arg |
| Asparagine | Asn |
| Aspartic acid | Asp |
| Cholesterol | Cho |
| Citric acid | Cit |
| Coenzyme A | CoA |
| Collagen | Col |
| Cysteine | Cys |
| DNA | DNA |
| Glucose | Glu |
| Glutamic acid | GluA |
| Glutamine | Gln |
| Glutathione | GSH |
| Glycerol | Glyc |
| Glyceryl tripalmitoleate | GlyT |
| Glycine | Gly |
| Glycogen | Glg |
| Histidine | His |
| Isoleucine | Ile |
| Lactic acid | Lac |
| Leucine | Leu |
| Lysine | Lys |
| Mannose | Man |
| Methionine | Met |
| Oleic acid | Ole |
| Palmitic acid | Pal |
| Phenylalanine | Phe |
| Phosphatidylcholine | PC |
| Phosphatidylethanolamine | PE |
| Phosphatidylinositol | PI |
| Phosphatidylserine | PS |
| Pyruvic acid | Pyr |
| Serine | Ser |
| Stearic acid | Ste |
| Threonine | Thr |
| Triglycerides | Tri |
| Tryptophan | Trp |
| Tyrosine | Tyr |
| Valine | Val |
2.3. Data acquisition
All the reference chemical spectra (liquid or solid) were acquired using a Renishaw inVia Raman microscope (Renishaw Inc.) with a 100× dry objective (NA = 0.9) (Leica Microsystems, Wetzlar, Germany), a 1200 lines per mm diffraction grating, a 10 s exposure time, and a 785 nm laser (Renishaw). All reference spectra were interpolated onto the same wavenumber axis (resolution) as the cellular or tissue xenografts spectra before the analysis.
For the cellular Raman data set acquisition, cells were washed with PBS, harvested with trypsin, and centrifuged into a pellet. Pellets were transferred to a 5 mm thick magnesium fluoride window (Janos Technology Inc., Keene, NH, USA) and allowed to air dry for 5 minutes. Raman spectra were acquired from 20 individual cells from each sample (20 spectra per sample at each radiation dose indicated) at three days post irradiation. Cells were randomly chosen from the top layer of the cell pellet for acquisition. To acquire the xenografts tissue Raman data set 1 and 2, tumours were sectioned into 20 μm using a rotary microtome (HM 550; MICROM International GmbH, Walldorf, Germany) and placed on magnesium fluoride slides. Before Raman acquisition, the frozen sections were air-dried for 10 minutes.
All RS biological sample acquisitions were conducted with the same instrument parameters. A Renishaw inVia Raman Microscope (Renishaw Inc., Illinois, IL, USA) equipped with a 785 nm diode laser (Renishaw) and dry objective (100×, NA = 0.9) (Leica Microsystems, Wetzlar, Germany) was used to collect Raman map spectra. Spectra were registered using a thermoelectrically cooled charge-coupled device (CCD) detector (Andor Technology, Connecticut, USA). The laser sampling dimensions were 2 × 5 × 10 μm3, and a laser power density was measured 0.5 mW μm−3 at the sampling volume. Spectra were acquired for 20 s per point, covering a spectral range of 460–1800 cm−1.
A total of twelve mice were studied for tissue data set 1, with four mice in each dose group (0, 5, and 15 Gy). The animal sample size was selected to follow similar population sizes from previously published Raman studies involving animals and radiation exposure. Five to eight unique mapping regions (map areas are between 100–220 μm2, step size 15 μm2) were analysed over three tissue sections per mouse, resulting in a total of 6648 spectra before spectral processing. After pre-processing, 6280 H460 xenografts tissue spectra were acquired in total. For tissue data set 2, two maps were collected from randomly selected regions within each tissue section, leading to a total of six maps collected per tumour (2 maps per section, 3 sections per tumour). This study included a total of 6 mice (6 mice at 3 days post irradiation; 3 per dose group). A total number of 2960 H460 xenograft tissue spectra resulted after spectra were processed.
Each spectrum was processed with a cosmic ray removal program from WiRE (Renishaw Inc.) to remove cosmic rays. Additionally, Matlab was used for other prepossessing steps, such as correcting for wavenumber calibration drifts, estimating and subtracting a baseline arising from the substrate and biological fluorescence, and normalised to a total area under the curve equal to 1.
![[thin space (1/6-em)]](https://www.rsc.org/images/entities/char_2009.gif) :
:![[thin space (1/6-em)]](https://www.rsc.org/images/entities/char_2009.gif) 100 dilution, Invitrogen Molecular Probes, OR, USA) was incubated for 30 min at room temperature, after which sections were washed twice with PBS, fixed using 2% paraformaldehyde for 1 min then washed with PBS. Raman mapping and CAIX IF co-registered imaging was conducted in the same region of a 20 μm thick tissue section. The Raman spectral map was acquired using the Renishaw Raman system with a 20 μm step size in each dimension, over a 500 × 600 μm2 region using a 100× Leica dry objective. The white light image of the same region was collected at the same time using a 10× Leica dry objective in the Renishaw system. The CAIX immunofluorescence staining was collected using 10× magnification. Immunofluorescence (IF) images were gathered using an Olympus microscope coupled with a Nuance multispectral imaging system (PerkinElmer, MA, USA) and a multispectral laser (Excelitas Technologies).
100 dilution, Invitrogen Molecular Probes, OR, USA) was incubated for 30 min at room temperature, after which sections were washed twice with PBS, fixed using 2% paraformaldehyde for 1 min then washed with PBS. Raman mapping and CAIX IF co-registered imaging was conducted in the same region of a 20 μm thick tissue section. The Raman spectral map was acquired using the Renishaw Raman system with a 20 μm step size in each dimension, over a 500 × 600 μm2 region using a 100× Leica dry objective. The white light image of the same region was collected at the same time using a 10× Leica dry objective in the Renishaw system. The CAIX immunofluorescence staining was collected using 10× magnification. Immunofluorescence (IF) images were gathered using an Olympus microscope coupled with a Nuance multispectral imaging system (PerkinElmer, MA, USA) and a multispectral laser (Excelitas Technologies).
2.4. Data analytical methods
Rather than decomposing the non-negative data matrix X into two lower rank non-negative matrices W such that
| X ≈ WH |
GBR-NMF decomposed the non-negative data matrix X into W, A, and S such that
| X ≈ WAS |
SHapley Additive exPlanations (SHAP) was used to calculate the feature importance after the classification tests. SHAP was developed to explain the output of machine learning models based on game theory by finding the optimal contribution allocation for feature variables.29 SHAP assigns each variable feature an importance value for a particular prediction.29
An explainer optimized for tree-based models (e.g., RF) implemented by Lundberg et al. was used to calculate the feature importance in the current study in Python 3.9.13.30,31
The random forest is used to classify the cellular and tissue data sets into irradiated and non-irradiated classes with a standard package in scikit-learn (version 1.0) in Python 3.9.13.31,32 Based on the feature importance calculated by SHAP, the top 20 chemicals were selected for further investigation on the variance of the chemical scores before and after the radiation treatment and correlations between hypoxic regions and chemical spatial distribution.
3. Results and discussion
3.1. Heterogeneity in tumour cell and xenograft tissue Raman spectra and comparison of GBR-NMF and PCA chemical scores
Raman spectra acquired on one H460 cellular data set and two H460 tissue data sets were analysed by the GBR-NMF-RF data analytical framework. RS reference chemicals shown in Fig. 7 were used as constraint chemicals for GBR-NMF dimension reduction. RF was then used to classify the decomposed GBR-NMF chemical scores into irradiated and non-irradiated classes. Feature importance was simultaneously calculated by SHAP. The chemical score variation trends pre and post-irradiation were examined. Furthermore, hypoxia indicated with CAIX IF maps and GBR-NMF decomposed Raman maps were also studied to find the correlation between hypoxia and chemical metabolites.In Fig. 1, the average spectra (red) with ±1 standard deviation (grey shadow spectrum) for the three H460 Raman spectral data sets are shown. The greatest standard deviation of H460 cellular data set and tissue data set 1 occurs at 482 cm−1, which can be attributed to glycogen.11,14,19,33 For tissue data set 2, the greatest standard deviation is located at 1438 cm−1, which can be assigned to unsaturated fatty acids and triglycerides.27 Other spectral regions where high standard deviations occur in three data sets were also identified, such as 1440 cm−1 (CH2 scissoring vibrations and lipids), 1442 cm−1 (CH2 scissoring and lipids), 1447 cm−1 (CH2 bending mode of proteins and lipids), 850 cm−1 (single-bond stretching vibrations for amino acids), and 1658–1664 cm−1 (Amide I).
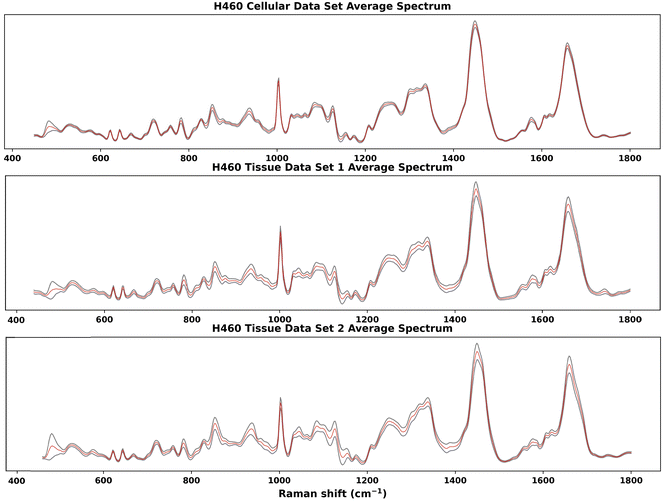 | ||
| Fig. 1 Average Raman spectra of H460 cellular and tissue samples. The red spectrum is the average spectrum and the grey shadow spectrum is the average spectrum ±1 standard deviation. The greatest standard deviation of H460 cellular data set and tissue data set 1 is at 482 cm−1, which can be attributed to glycogen.11,14,19,33 For tissue data set 2, the greatest standard deviation is at 1438 cm−1, which can be assigned to unsaturated fatty acids and triglycerides.27 High standard deviations were also identified, in 1440 cm−1 (CH2 scissoring vibrations and lipids), 1442 cm−1 (CH2 scissoring and lipids), 1447 cm−1 (CH2 bending mode of proteins and lipids), 850 cm−1 (single-bond stretching vibrations for amino acids), and 1658–1664 cm−1 (Amide I). | ||
3.2. Radiation response classifications and chemical feature importance differences in cellular and tissue samples
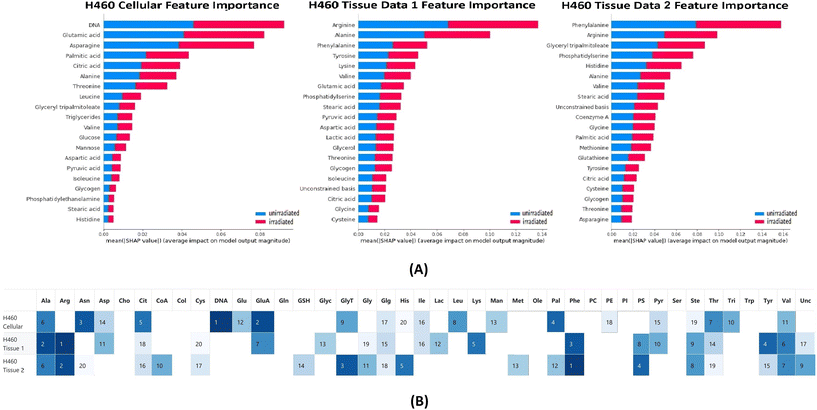
The classification tests were performed on the H460 cellular and tissue data sets with RF. Feature importance of chemicals for each classification test was calculated based on the SHAP package and is presented in Fig. 2. The average accuracy for each classification test was 0.93 (cellular), 0.85 (tissue 1) and 0.91 (tissue 2) respectively. The average sensitivity/recall for each classification test was 0.97 (cellular), 0.83 (tissue 1) and 0.93 (tissue 2) respectively. The average precision for each classification test was 0.94 (cellular), 0.80 (tissue 1) and 0.87 (tissue 2) respectively.In the top 20 contributing chemicals, alanine, citric acid, glycogen, stearic acid, threonine, and valine appeared in all three data sets (cell and xenografts tissue). DNA, glucose, leucine, mannose, phosphatidylethanolamine, and triglycerides were only ranked as high contributing chemicals in the cellular data set. Although absent from the cellular data set, chemical bases such as arginine, phenylalanine, phosphatidylserine, tyrosine, and unconstrained bases show high contributions in both tissue data sets. Cysteine, glutathione, glycine, methionine only occur as the critical chemical in one of the tissue data sets. It is worth noting that DNA was ranked as the highest contributing chemical in the cellular data set classification tests while absent from the top 20 chemicals in both tissue data sets. Moreover, the unconstrained bases appeared as a top 20 contributing chemical to both tissue data set classifications. The unconstrained bases can be interpreted as the residue of unidentified chemical metabolites in the Raman spectra.
3.3. Monitoring chemical score trends of amino acids and other chemicals
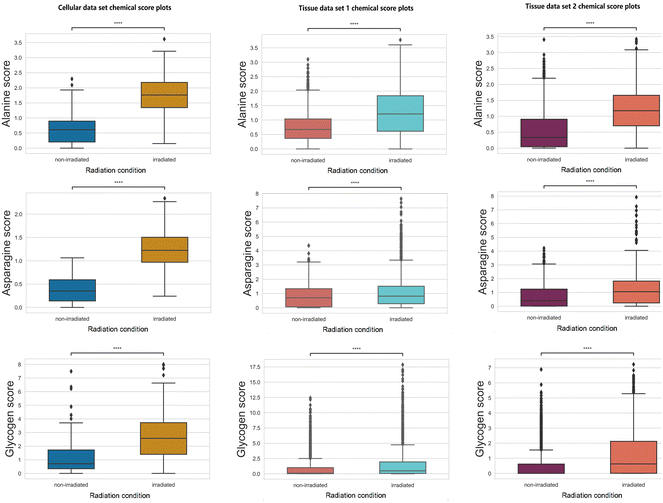
Increases in chemical scores (statistically significant with a p-value <0.05 using null-hypothesis significance testing) are observed in alanine, asparagine, and glycogen after radiation treatment in all three data sets (Fig. 3).Glycogen accumulation after irradiation has been reported previously in H460 cancer cells and xenografts tissues.11,13,15 Increased glycogen levels can be attributed to impaired inhibition of glycogen synthase kinase-3 (GSK-3) which regulates glycogen synthesis. Western blot analysis was conducted previously and found increases in phosphorylation of GSK-3β and total amount of GSK-3β11 for post-irradiation cells. Glycogen accumulation in xenograft tissues after radiation treatment was also confirmed using periodic acid-Schiff staining.13
Other than glycogen, multiple amino acids can be identified as metabolites responding to radiation treatment. The increased level of multiple amino acids can indicate tumour radiation response to repair the damage induced by ionising radiation. Alanine is an amino acid that can be synthesized from pyruvate, which has a vital role in the TCA cycle of cancer cells.34 Altered alanine metabolism was found in studies across various types of cancer (e.g., lung cancer, and pancreatic cancer).35–37 Moreover, increased alanine production can be used as a tumour response indicator to effective RT evaluated by hyperpolarized 13C MRI.38 Asparagine has an essential role in promoting cancer cell proliferation as an amino acid exchange factor;39,40 this phenomenon can be associated with the increased level observed in Fig. 3. Asparagine is degraded by the enzyme asparaginase (ASNase) and combinatorial treatment with ASNase with chemotherapy or chemoradiation showed synergy in suppressing tumor growth.41–43
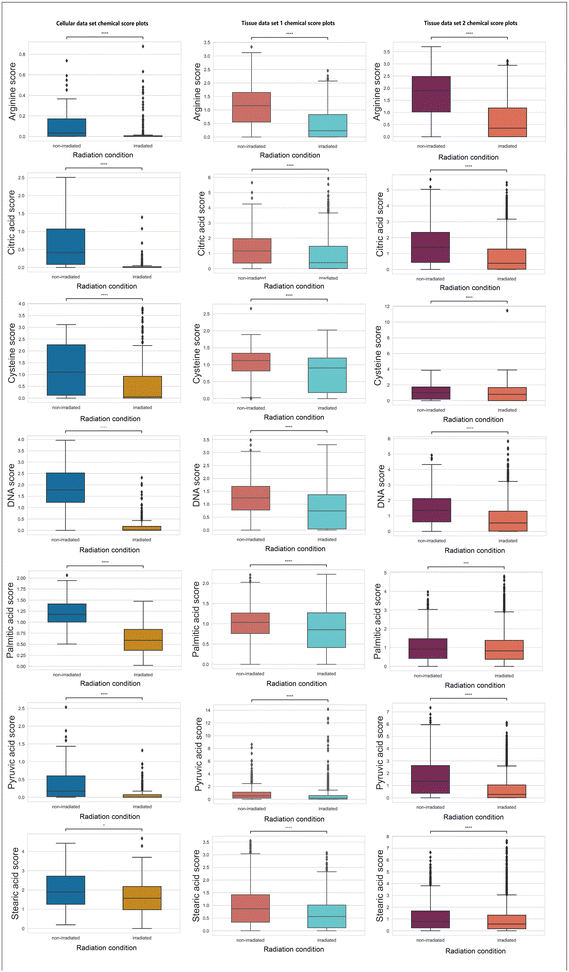
In Fig. 4, chemicals (e.g., arginine, citric acid, DNA, palmitic acid, pyruvic acid, and stearic acid) with a consistent decreasing trend (statistically significant with a p-value <0.05 using null-hypothesis significance testing) post-irradiation across three data sets are presented.
Arginine is a non-essential amino acid that can be synthesized by cells.44 Nonetheless, when cells encounter catabolic stress, arginine will be heavily consumed from the environment,44 which explains the decreased arginine level found by RS. DNA double-strand and single-strand breaks induced by ionising radiation have been established as one primary cellular damage mechanism,1 which corresponds to the observation in declined DNA scores. The depletion of citric acid and pyruvic acid can potentially lead to increased energy consumption in the TCA cycle.45 Altered lipid metabolism is a hallmark of metabolic alterations in cancer.46 Previously, a study conducted on blood serum samples acquired before and after radiation treatment in patients analyzed by gas chromatography has demonstrated decreased level of saturated fatty acids after treatment.47 The decreases in palmitic acid and stearic acids (which are two types of saturated fatty acids) found in the present study corresponds to the previously reported decreases in saturated fatty acids.
3.4. Hypoxia indicated by CAIX staining map correlated to GBR-NMF decomposed Raman chemical maps
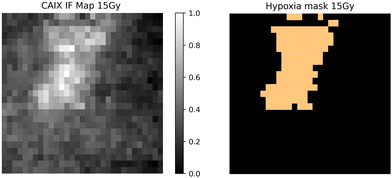
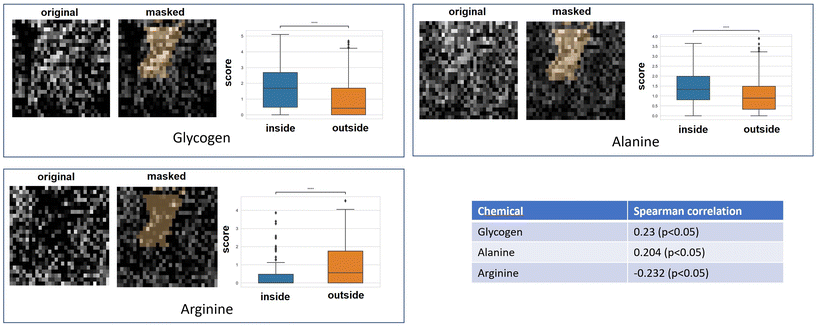
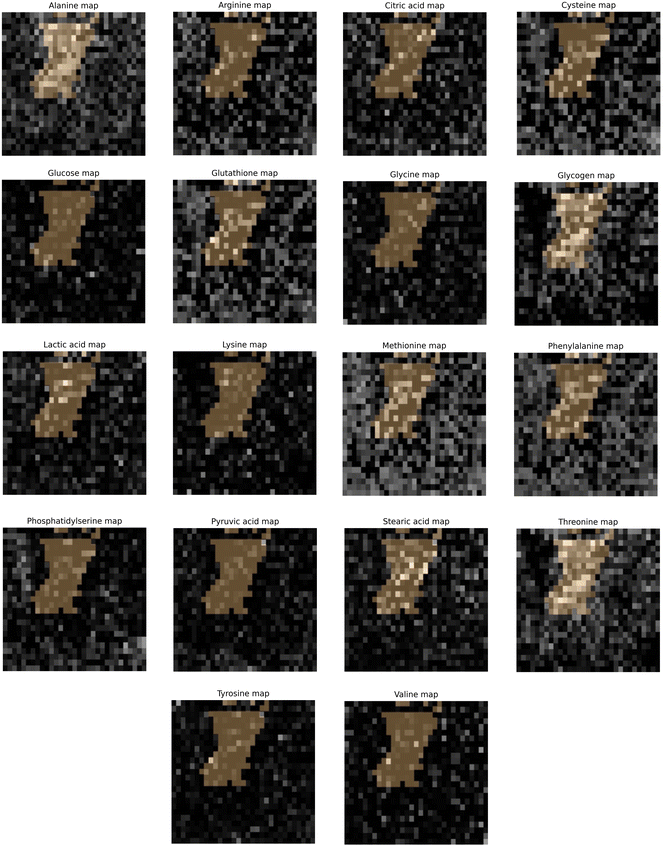
Qualitative and quantitative pixel-by-pixel comparisons between GBR-NMF decomposed Raman maps and CAIX IF map of the same tissue section (irradiated at 15 Gy and harvested at 3 days) was conducted. A hypoxia mask was generated based on the CAIX IF map in Fig. 5. The hypoxia mask threshold is set as the average intensity plus one standard deviation for the CAIX intensities. All the chemicals selected based on SHAP are shown in Fig. 8. Qualitative and quantitative comparisons of Raman chemical maps and CAIX IF maps are shown in Fig. 6 to demonstrate the spatial correlations between the RS chemicals and hypoxia.The average glycogen score inside the hypoxia mask is higher than the average outside of the hypoxia region. A positive correlation between the glycogen scores and the CAIX intensities in the map was calculated from Spearman's correlation (0.23, p-value <0.05). The similarities between glycogen and hypoxia distribution in Fig. 6 can be linked to glycogen synthesis induced in hypoxia by the hypoxia-inducible factor 1.48,49 The hypoxia-inducible factor 1 (HIF-1) is a transcription factor responsible for alterations in cell metabolism in hypoxic tumor cells.48,49 It promotes cell proliferation by inducing a metabolic shift from oxidative phosphorylation to glycolysis and lactic acid production.48,49 Furthermore, alanine distribution in the chemical map also resembles CAIX spatial distribution in Fig. 6. Alanine has a higher average score inside the hypoxia region than the region outside of hypoxia. Alanine scores are positively correlated with CAIX intensities shown by Spearman's correlation (0.204, p < 0.05). Previous studies have found connections between hypoxia and alanine synthesis indicated in Fig. 6.34,50 Alanine is an amino acid synthesized from pyruvate. Alanine is expected to lie mainly in the mitochondrial matrix, which is the site of the TCA cycle.34,50 The alanine aminotransferase (ALAT) competes for mitochondrial pyruvate with pyruvate dehydrogenase (PDH).34 Therefore, if the PDH activity is low (e.g., hypoxia), the increased alanine synthesis may be observed.34
Arginine displays high activities across the map except for regions inside the hypoxia mask (Fig. 6). Arginine scores are also negatively correlated with CAIX intensities calculated from Spearman's correlation (−0.232, p-value <0.05). Hypoxia induces angiogenesis.22 Studies have found that arginine plays an essential role in angiogenesis.51,52 Arginine can be converted to nitric oxide (NO), and NO within the tumour microenvironment is an essential mediator of tumour angiogenesis.52 NO can promote angiogenesis by producing more blood vessels near the solid hypoxic tumours to supply nutrients and oxygen.52,53
3.5. Discussion
The concerted changes observed with pyruvate, alanine, and citric acid appear to be a potential RT-induced resistance mechanism (Fig. 3, 4, and 6).54–56 The shift from pyruvate to alanine diverts carbon away from the entry into the TCA cycle, an observation consistent with the reduction in citrate. In addition, the transaminase reaction catalyzed by GPT1/2 and pyruvate conversion to alanine also consumes the anapleurotic metabolite glutamate.54 These metabolic changes further decrease the entry of carbon sources into the TCA cycle. Although the increase in asparagine could shunt carbons into the TCA cycle, the rise in asparagine may suppress apoptosis through GCN2 (a serine/threonine kinase) or ATF4 (a protein that in humans is encoded by the ATF4 gene).55 Furthermore, the depletion of glutamine and glutamate is explained by their supporting roles in the production of alanine.55,56In addition to reducing pyruvate in the TCA cycle, the potential reduction in the overall TCA cycle would stall electron transport chain (ETC) activity and reduce the production of reactive oxygen species necessary for RT-induced DNA damage.57 Interestingly the increase in CAIX staining, a hypoxia marker, suggests that low oxygen may be the primary driver of these metabolite changes (Fig. 3–5). These data indicate that inhibition of GPT1/2 could shift the pyruvate reactions towards pyruvate dehydrogenase and conversion to acetyl-CoA.58 Pyruvate dehydrogenase and conversion to acetyl-CoA can help maintain TCA flux, ETC to allow for sufficient ROS production during RT and thereby restore or sensitize to RT-induced cell death.
In previous research, RS has demonstrated the potential to be incorporated into radiation therapy as a label-free technique to reveal the biochemical dynamics and assess the treatment response for various types of cancer.9–17,59–63 Nevertheless, conventional unsupervised dimension reduction techniques can provide limited resolution in distinguishing responses from different chemicals.9–17,59–63 In this manuscript, the GBR-NMF-RF-SHAP data analytical framework has demonstrated an outstanding capability to resolve signals such as radiation response and hypoxia indicators corresponding to constrained chemicals. Moreover, GBR-NMF-RF-SHAP also exhibited efficiency in analyses across various types of cancer data (cell and tissue). In the future, biochemicals indicating radiation response and hypoxia identified herein will be cross-validated using orthogonal techniques such as mass spectroscopy and staining.
4. Conclusions
The current study uses the GBR-NMF-RF data analytical framework and feature importance metric (e.g., SHapley Additive exPlanations [SHAP]) to identify and monitor radiation response biomarkers and hypoxia indicators in H460 cells and tissue xenografts. GBR-NMF, as a semi-supervised dimensionality reduction method, allowed us to monitor individual biochemicals and the changes in those biochemicals related to radiation exposure. Combined with GBR-NMF, the random forest classifier and SHAP feature importance can classify radiation response in biological samples (e.g., cancer cells and tissues) and identify biochemicals which are important in classifying the data as irradiated or unirradiated. Three RS data sets that include H460 cells (derived from the human lung) and H460 xenografts acquired from the murine model were analysed with GBR-NMF-RF. A range of chemical metabolites (e.g., glycogen, lipids, DNA, amino acids) were identified and, furthermore, radiation response biomarkers were evaluated as to how their expression spatially correlates with hypoxic regions of tissue. Correlations between hypoxic regions and glycogen, alanine and arginine were identified in the tissue xenografts. GBR-NMF-RF combined with RS has a tremendous potential to be applied to monitor cancer metabolism variations related to radiation treatment.Conflicts of interest
There are no conflicts to declare.Acknowledgements
This work was supported by grant funding from the National Sciences and Engineering Research Council of Canada Discovery Grants RGPIN-2020-07232 (A. J., K. M., X. D.), RGPIN-2020-04646 (J. L. A.), the Canadian Institutes of Health Research (PJT 162279, J. J. L.). We would like to thank Samantha Van Nest and Katy Milne for the CAIX tissue staining work, and Quinn Matthews for the H460 cell data acquisition.References
- R. Baskar, K. A. Lee, R. Yeo and K.-W. Yeoh, Int. J. Med. Sci., 2012, 9, 193–199 CrossRef PubMed.
- A. H. Ree and K. R. Redalen, Br. J. Radiol., 2015, 88, 20150009 CrossRef PubMed.
- L. A. Dawson and D. A. Jaffray, J. Clin. Oncol., 2007, 25, 938–946 CrossRef PubMed.
- S. Chin, C. L. Eccles, A. McWilliam, R. Chuter, E. Walker, P. Whitehurst, J. Berresford, M. Van Herk, P. J. Hoskin and A. Choudhury, J. Med. Imaging Radiat. Oncol., 2020, 64, 163–177 CrossRef PubMed.
- K. Graham and E. Unger, Int. J. Nanomed., 2018, 13, 6049–6058 CrossRef CAS PubMed.
- K. L. Eales, K. E. R. Hollinshead and D. A. Tennant, Oncogenesis, 2016, 5, e190–e190 CrossRef CAS PubMed.
- J. E. Spowart, K. N. Townsend, H. Huwait, S. Eshragh, N. R. West, J. N. Ries, S. Kalloger, M. Anglesio, S. M. Gorski, P. H. Watson, C. B. Gilks, D. G. Huntsman and J. J. Lum, J. Pathol., 2012, 228, 437–447 CrossRef CAS PubMed.
- H. J. Butler, L. Ashton, B. Bird, G. Cinque, K. Curtis, J. Dorney, K. Esmonde-White, N. J. Fullwood, B. Gardner, P. L. Martin-Hirsch, M. J. Walsh, M. R. McAinsh, N. Stone and F. L. Martin, Nat. Protoc., 2016, 11, 664–687 CrossRef PubMed.
- Q. Matthews, A. Jirasek, J. Lum, X. Duan and A. G. Brolo, Appl. Spectrosc., 2010, 64, 871–887 CrossRef.
- Q. Matthews, A. Jirasek, J. J. Lum and A. G. Brolo, Phys. Med. Biol., 2011, 56, 6839–6855 CrossRef.
- Q. Matthews, M. Isabelle, S. J. Harder, J. Smazynski, W. Beckham, A. G. Brolo, A. Jirasek and J. J. Lum, PLoS One, 2015, 10, e0135356 CrossRef PubMed.
- S. J. Harder, Q. Matthews, M. Isabelle, A. G. Brolo, J. J. Lum and A. Jirasek, Appl. Spectrosc., 2015, 69, 193–204 CrossRef PubMed.
- S. J. Harder, M. Isabelle, L. DeVorkin, J. Smazynski, W. Beckham, A. G. Brolo, J. J. Lum and A. Jirasek, Sci. Rep., 2016, 6, 21006 CrossRef.
- P. Meksiarun, P. H. B. Aoki, S. J. V. Nest, R. G. Sobral-Filho, J. J. Lum, A. G. Brolo and A. Jirasek, Analyst, 2018, 143, 3850–3858 RSC.
- S. J. Van Nest, L. M. Nicholson, L. DeVorkin, A. G. Brolo, J. J. Lum and A. Jirasek, Radiat. Res., 2018, 189, 497–504 Search PubMed.
- X. Deng, R. Ali-Adeeb, J. L. Andrews, P. Shreeves, J. J. Lum, A. Brolo and A. Jirasek, Appl. Spectrosc., 2020, 74, 701–711 CrossRef PubMed.
- K. Milligan, S. J. Van Nest, X. Deng, R. Ali-Adeeb, P. Shreeves, S. Punch, N. Costie, N. Pavey, J. M. Crook, D. M. Berman, A. G. Brolo, J. J. Lum, J. L. Andrews and A. Jirasek, J. Biophotonics, 2022, e202200121 Search PubMed.
- P. Shreeves, J. L. Andrews, X. Deng, R. Ali-Adeeb and A. Jirasek, arXiv:2107.00744 [physics, stat], 2021, DOI:10.48550/ARXIV.2107.00744.
- K. Milligan, X. Deng, P. Shreeves, R. Ali-Adeeb, Q. Matthews, A. Brolo, J. J. Lum, J. L. Andrews and A. Jirasek, Sci. Rep., 2021, 11, 3853 CrossRef.
- X. Deng, K. Milligan, R. Ali-Adeeb, P. Shreeves, A. Brolo, J. J. Lum, J. L. Andrews and A. Jirasek, Appl. Spectrosc., 2021, 76(4), 462–474 CrossRef.
- L. Breiman, Mach. Learn., 2001, 45, 5–32 CrossRef.
- B. Muz, P. de la Puente, F. Azab and A. K. Azab, Hypoxia, 2015, 3, 83–92 CrossRef.
- A. Casazza, G. Di Conza, M. Wenes, V. Finisguerra, S. Deschoemaeker and M. Mazzone, Oncogene, 2014, 33, 1743–1754 CrossRef PubMed.
- G. M. Cooper, The Cell: A Molecular Approach. 2nd edition, 2000 Search PubMed.
- J. De Gelder, K. De Gussem, P. Vandenabeele and L. Moens, J. Raman Spectrosc., 2007, 38, 1133–1147 CrossRef.
- A. C. S. Talari, Z. Movasaghi, S. Rehman and I. u. Rehman, Appl. Spectrosc. Rev., 2015, 50, 46–111 CrossRef.
- K. Czamara, K. Majzner, M. Z. Pacia, K. Kochan, A. Kaczor and M. Baranska, J. Raman Spectrosc., 2015, 46, 4–20 CrossRef.
- A. Sarica, A. Cerasa and A. Quattrone, Front. Aging Neurosci., 2017, 9, 329 CrossRef PubMed.
- S. M. Lundberg and S.-I. Lee, Advances in Neural Information Processing Systems 30, Curran Associates, Inc., 2017, pp. 4765–4774 Search PubMed.
- S. M. Lundberg, G. Erion, H. Chen, A. DeGrave, J. M. Prutkin, B. Nair, R. Katz, J. Himmelfarb, N. Bansal and S.-I. Lee, Nat. Mach. Intell., 2020, 2, 56–67 CrossRef.
- G. Van Rossum and F. L. Drake, Python 3 Reference Manual, CreateSpace, Scotts Valley, CA, 2009 Search PubMed.
- F. Pedregosa, G. Varoquaux, A. Gramfort, V. Michel, B. Thirion, O. Grisel, M. Blondel, P. Prettenhofer, R. Weiss, V. Dubourg, J. Vanderplas, A. Passos, D. Cournapeau, M. Brucher, M. Perrot and E. Duchesnay, J. Mach. Learn. Res., 2011, 12, 2825–2830 Search PubMed.
- S. Duraipandian, D. Traynor, P. Kearney, C. Martin, J. J. O'Leary and F. M. Lyng, Sci. Rep., 2018, 8, 15048 CrossRef PubMed.
- L. Vettore, R. L. Westbrook and D. A. Tennant, Br. J. Cancer, 2020, 122, 150–156 CrossRef PubMed.
- D. Heber, L. O. Byerly and R. T. Chlebowski, Cancer, 1985, 55, 225–229 CrossRef PubMed.
- C. M. Sousa, D. E. Biancur, X. Wang, C. J. Halbrook, M. H. Sherman, L. Zhang, D. Kremer, R. F. Hwang, A. K. Witkiewicz, H. Ying, J. M. Asara, R. M. Evans, L. C. Cantley, C. A. Lyssiotis and A. C. Kimmelman, Nature, 2016, 536, 479–483 CrossRef PubMed.
- B.-H. Choi and J. L. Coloff, Cancers, 2019, 11, 675 CrossRef PubMed.
- H. Qin, V. Zhang, R. A. Bok, R. D. Santos, J. A. Cunha, I.-C. Hsu, B. Santos, J. Delos, J. E. Lee, S. Sukumar, P. E. Z. Larson, D. B. Vigneron, D. M. Wilson, R. Sriram and J. Kurhanewicz, Int. J. Radiat. Oncol., Biol., Phys., 2020, 107, 887–896 CrossRef PubMed.
- A. S. Krall, S. Xu, T. G. Graeber, D. Braas and H. R. Christofk, Nat. Commun., 2016, 7, 11457 CrossRef PubMed.
- E. L. Lieu, T. Nguyen, S. Rhyne and J. Kim, Exp. Mol. Med., 2020, 52, 15–30 CrossRef PubMed.
- M. Chiu, G. Taurino, M. G. Bianchi, M. S. Kilberg and O. Bussolati, Front. Oncol., 2020, 9, 1480 CrossRef PubMed.
- E. H. Panosyan, Y. Wang, P. Xia, W.-N. P. Lee, Y. Pak, D. R. Laks, H. J. Lin, T. B. Moore, T. F. Cloughesy, H. I. Kornblum and J. L. Lasky, Mol. Cancer Res., 2014, 12, 694–702 CrossRef PubMed.
- W. Zheng, Y. Gao, X. Ke, W. Zhang, L. Su, H. Ren, N. Lin, Y. Xie, M. Tu, W. Liu, L. Ping, Z. Ying, C. Zhang, L. Deng, X. Wang, Y. Song and J. Zhu, BMC Cancer, 2018, 18, 910 CrossRef PubMed.
- H. Al-Koussa, N. El Mais, H. Maalouf, R. Abi-Habib and M. El-Sibai, Cancer Cell Int., 2020, 20, 150 CrossRef PubMed.
- S. Hui, J. M. Ghergurovich, R. J. Morscher, C. Jang, X. Teng, W. Lu, L. A. Esparza, T. Reya, L. Zhan, J. Y. Guo, E. White and J. D. Rabinowitz, Nature, 2017, 551, 115–118 CrossRef PubMed.
- M. T. Snaebjornsson, S. Janaki-Raman and A. Schulze, Cell Metab., 2020, 31, 62–76 CrossRef PubMed.
- S. Shaikh, N. A. Channa, F. N. Talpur, M. Younis and N. Tabassum, Lipids Health Dis., 2017, 16, 92 CrossRef PubMed.
- J. Pelletier, G. Bellot, P. Gounon, S. Lacas-Gervais, J. Pouysségur and N. M. Mazure, Front. Oncol., 2012, 2, 18 Search PubMed.
- N. Pescador, D. Villar, D. Cifuentes, M. Garcia-Rocha, A. Ortiz-Barahona, S. Vazquez, A. Ordoñez, Y. Cuevas, D. Saez-Morales, M. L. Garcia-Bermejo, M. O. Landazuri, J. Guinovart and L. del Peso, PLoS One, 2010, 5, e9644 CrossRef PubMed.
- M. W. Gray, Encyclopedia of Genetics, Academic Press, New York, 2001, pp. 1215–1217 Search PubMed.
- K. Howell, C. M. Costello, M. Sands, I. Dooley and P. McLoughlin, Am. J. Physiol.: Lung Cell. Mol. Physiol., 2009, 296, L1042–L1050 CrossRef PubMed.
- V. L. Albaugh, C. Pinzon-Guzman and A. Barbul, J. Surg. Oncol., 2017, 115, 273–280 CrossRef PubMed.
- B. Salimian Rizi, A. Achreja and D. Nagrath, Trends Cancer, 2017, 3, 659–672 CrossRef PubMed.
- H. C. Yoo, Y. C. Yu, Y. Sung and J. M. Han, Exp. Mol. Med., 2020, 52, 1496–1516 CrossRef PubMed.
- J. Zhang, J. Fan, S. Venneti, J. R. Cross, T. Takagi, B. Bhinder, H. Djaballah, M. Kanai, E. H. Cheng, A. R. Judkins, B. Pawel, J. Baggs, S. Cherry, J. D. Rabinowitz and C. B. Thompson, Mol. Cell, 2014, 56, 205–218 CrossRef PubMed.
- J. Zhang, N. N. Pavlova and C. B. Thompson, EMBO J., 2017, 36, 1302–1315 CrossRef PubMed.
- S. J. Forrester, D. S. Kikuchi, M. S. Hernandes, Q. Xu and K. K. Griendling, Circ. Res., 2018, 122, 877–902 CrossRef PubMed.
- P. W. Stacpoole, J. Natl. Cancer Inst., 2017, 109, djx071 CrossRef PubMed.
- M. S. Vidyasagar, K. Maheedhar, B. M. Vadhiraja, D. J. Fernendes, V. B. Kartha and C. M. Krishna, Biopolymers, 2008, 89, 530–537 CrossRef PubMed.
- S. Devpura, K. N. Barton, S. L. Brown, O. Palyvoda, S. Kalkanis, V. M. Naik, F. Siddiqui, R. Naik and I. J. Chetty, Med. Phys., 2014, 41, 050901 CrossRef PubMed.
- Q. Wu, S. Qiu, Y. Yu, W. Chen, H. Lin, D. Lin, S. Feng and R. Chen, Biomed. Opt. Express, 2018, 9, 3413–3423 CrossRef PubMed.
- S. K. Paidi, P. M. Diaz, S. Dadgar, S. V. Jenkins, C. M. Quick, R. J. Griffin, R. P. M. Dings, N. Rajaram and I. Barman, Cancer Res., 2019, 79, 2054–2064 CrossRef PubMed.
- K. Pansare, S. R. Singh, V. Chakravarthy, N. Gupta, A. Hole, P. Gera, R. Sarin and C. M. Krishna, Appl. Spectrosc., 2020, 74, 553–562 CrossRef PubMed.
| This journal is © The Royal Society of Chemistry 2022 |

