
 Open Access Article
 This Open Access Article is licensed under a
 Creative Commons Attribution 3.0 Unported Licence
In vitro toxicity screening of amorphous silica nanoparticles using mitochondrial fraction exposure followed by MS-based proteomic analysis†
Premkumari
Kumarathasan
 *ab,
Nazila
Nazemof
*b,
Dalibor
Breznan
a,
Erica
Blais
a,
Hiroyuki
Aoki
c,
James
Gomes
b,
Renaud
Vincent
a,
Sadhna
Phanse
c and
Mohan
Babu
c
*ab,
Nazila
Nazemof
*b,
Dalibor
Breznan
a,
Erica
Blais
a,
Hiroyuki
Aoki
c,
James
Gomes
b,
Renaud
Vincent
a,
Sadhna
Phanse
c and
Mohan
Babu
c
aEnvironmental Health Science and Research Bureau, HECSB, Health Canada, Ottawa, ON, Canada. E-mail: premkumari.kumarathasan@hc-sc.gc.ca; Fax: +613-946-2600; Tel: +613-957-0209
bInterdisciplinary School of Health Sciences, Faculty of Health Sciences, University of Ottawa, Ottawa, ON, Canada
cDepartment of Biochemistry, University of Regina, Regina, SK, Canada
First published on 18th July 2022
Abstract
Silica nanoparticles (SiNPs) are used in consumer products, engineering and medical technologies. Attractive properties of SiNPs (e.g. size/surface-modification) enhance usage and thus the likelihood of environmental/human exposures. The assessment of health risks associated with exposures to SiNPs requires information on their relative potencies and toxicity mechanisms. In this work, phagocytic J774 cells were exposed to amorphous pristine (15, 30, 75 nm) and surface-modified (–NH2, –C3COOH, –C11COOH, –PEG) SiNP variants, and internalization was assessed by transmission electron microscopy (TEM), while cellular ATP was measured as a cytotoxicity endpoint. Furthermore, mitochondrial fractions from J774 cells were exposed to these SiNP variants (5, 15 μg mL−1), as well as two reference particles (SiNP 12 nm and TiO2), and proteomic changes were analyzed by mass spectrometry. Ingenuity Pathway Analysis was used to identify toxicity pathways. TEM analyses showed SiNP internalization and distribution along with some changes in mitochondrial structure. SiNP size- and surface-modification and chemical composition-related changes in mitochondrial proteins, including key proteins of the respiratory complex and oxidative stress, were evident based on high content mass spectrometry data. In addition, the dose-related decrease in cellular ATP levels in SiNP-exposed cells was consistent with related mitochondrial protein profiles. These findings suggest that physicochemical properties can be determinants of SiNP exposure-related mitochondrial effects, and mitochondrial exposures combined with proteomic analysis can be valuable as a new approach methodology in the toxicity screening of SiNPs for risk assessment, with added insight into related toxicity mechanisms.
Introduction
Amorphous silica nanoparticles (SiNPs) are engineered nanomaterials (ENM) used in a wide range of applications, and consequently are produced on a large scale. The unique physical and chemical properties of amorphous SiNPs such as their hydrophilicity, biocompatibility and stability make them suitable candidates for a diverse array of consumer products including electronics, paints, cosmetics, food, toothpaste and medical applications including gene therapy, imaging, and photodynamic therapy, or as excipients in dietary supplements.1–3 According to the Consumer Products Inventory (CPI) list, almost a fifth of nano-based products claim to contain SiNPs.3 The release of silica nanoparticles into the environment has been reported.4 Increased production, use, and environmental release of SiNPs raise concerns of potential exposure and related environmental/human health risks.Toxicity testing is important to assess the health risk associated with exposure to engineered nanomaterials. Nevertheless, toxicological studies fall short, as opposed to studies on the production and application of these materials. In general, nanoparticle (NP) exposures can occur by various routes such as inhalation, oral ingestion or dermal absorption. Besides, there are various reports on nanoparticle exposures and adverse effects at the cellular level as well as on the innate immune system.5–7 Exposure to SiNPs in vitro or in vivo, and corresponding cellular cytotoxicity as well as organ-level (e.g. respiratory, cardiovascular, immune and reproductive system) toxicity and mitochondrial dysfunction, are known.8–15
Moreover, there are reports on NP exposures and oxidative damage due to reactive oxygen species (ROS) formation, and ROS formation has been suggested as one of the mechanisms by which SiNPs could exert toxicity.16–21 Environmental pollutant exposures can lead to cellular oxidative stress, which in turn can adversely affect mitochondrial function. Cell metabolism and energy production is critical for cell health, and thus examining mitochondrial integrity after NP exposures can be useful in nanomaterial toxicity testing.
Of the various ENMs currently in commerce, nanosilica is used/produced more, and yet existing knowledge gaps in toxicity information on these materials require more work to generate these data. Although many reports on the toxicity of nanosilica are on mesoporous SiNPs, toxicity data for amorphous SiNPs are limited. Amorphous silica nanomaterials are among the ENMs in commerce in Canada and in the Domestic Substances List (DSL) that require toxicity information for assessment of the health risk associated with these materials. Furthermore, toxicity studies reported thus far on amorphous SiNPs are on different sizes of NPs, but not on nanoforms of amorphous SiNPs. In addition, amorphous SiNP exposure-related toxicity mechanisms are less clear. Moreover, there are relatively many reports on the application of high-content approaches such as genomic/transcriptomic analysis in chemical exposure-related toxicity testing for risk assessment, including nanotoxicology.22 However, the use of proteomic analysis in the same context that can provide phenotypic information is in its early stages. High-content molecular-level analyses in addition to relative cytotoxic potency estimation can provide mechanistic insight into the toxicity of environmental chemicals, and is of emerging interest in NP toxicity testing.
The objective of this work was to develop an in vitro toxicity screening approach based on high-content mass spectrometry-based proteomic analysis of mitochondrial fractions to test for the relative toxicities of amorphous SiNP nanoforms. As a part of this effort, TEM analysis examined the internalization of SiNP nanoforms by J774 cells. In addition, cellular ATP levels in J774 cells exposed to these SiNP nanoforms were measured to assess the cytotoxicity. Also, mitochondrial fractions derived from J774 cells were exposed to different SiNP nanoforms and protein-level changes were analysed using mass spectrometry. Pathway analysis based on proteomic changes provided information on toxicity mechanisms. Moreover, the relationships between the relative potencies of SiNP nanoforms and their physicochemical properties were tested to identify potency determinants.
Materials and methods
Materials
Dulbecco's modified Eagle's medium (phenol red-free) and with phenol red, fetal bovine serum (FBS), phosphate buffered saline (10×), Mitochondria Isolation Kit for Cultured Cells, Halt™ Protease Inhibitor Cocktail, EDTA-Free (100×), Trypan Blue Solution 0.4%, and molecular-weight cut-off filters were purchased from Thermo Scientific (Nepean, ON, Canada). Karnovsky fixative reagent grade and Sorensen's phosphate buffer were from Electron Microscopy Sciences (Hatfield, PA, USA). Ammonium acetate (NH4OAc), calcium chloride, trifluoroacetic acid, HPLC grade (TFA), formic acid (FA), acetonitrile (ACN) and ultrapure water were from Sigma-Aldrich (Oakville, ON, Canada). Trypsin/Lys C Mix, mass spec grade and ProteaseMAX™ were from Promega (Madison, WI, USA). α-Cyano-4-hydroxycinnamic acid was purchased from Bruker Daltonics (Bremen, Germany). Nanoparticles: Custom-synthesized pristine amorphous silica nanoparticles (SiNPs) of different sizes (15, 30, 75 nm) and the 15 nm surface-modified (–C3–COOH, –C11–COOH, –NH2, and –PEG) SiNPs were obtained from Advanced Quantum Materials Inc (AQM, Edmonton, AB, Canada). Here, pristine amorphous non-porous SiNPs were synthesized by a modified Stöber method as reported previously,23 with a calcination process as a step. Reference particles (SRM-154b titanium dioxide, TiO2) included in this study were from the National Institute of Standards and Technology (Gaithersburg, MD, USA). Nano-sized silica (12 nm) served as an additional reference particle (cat. # 718483; Sigma Aldrich, Oakville, ON, Canada).Characterization of physicochemical properties of SiNP nanoforms
The size, surface area, functional groups, metal content, polydispersity/aggregation and zeta potential of the SiNP nanoforms in the dry state were analysed as previously described.23 Briefly, transmission electron microscopy (TEM) images for size distribution of the SiNPs were performed by a JEOL 2010 TEM (with LaB6 electron gun). Brunauer–Emmett–Teller (BET) surface area analysis was done by nitrogen absorption using the ASAP 2020 instrument (Micromeritics, Norcross, GA, USA). Fourier transform infrared (FT-IR) spectroscopic analyses and thermogravimetric analysis (TGA) were performed for functional group analysis using a Thermo Nicolet Magna 750 IR spectrometer and a Mettler Toledo Star TGA/DSC system, respectively. Quantitative nuclear magnetic resonance (NMR) spectroscopy was done in solution state using a Bruker Avance 400 MHz spectrometer to determine the surface functional groups. The metal contents of pristine SiNP samples were analyzed using inductively coupled plasma-mass spectrometry/atomic emission spectroscopy (ICP-MS/AES, Varian Vista-PRO, Mulgrave, Australia). Dynamic light scattering (DLS) and zeta potential measurements were done using the Zetasizer Nano ZS (Malvern Instruments, UK).TEM analyses of J774 cells exposed to SiNPs
![[thin space (1/6-em)]](https://www.rsc.org/images/entities/char_2009.gif) 000 cells per mL and were allowed to attach to the surface for 24 h prior to SiNP exposure.
:1, 2:1, 3:1) and then with Epon, and finally the cell pellet was treated with Epon and cured at 60 °C for 48 h alone for embedding the cells in this resin. Embedded cells were then sectioned using a microtome. Ultra-thin sections (ca. 70 nm thickness) collected on 200 mesh copper grids with a carbon support film (3 grids per sample) were stained with 4% uranyl acetate and Reynolds lead citrate, and the samples (duplicates) were examined using an FEI Tecnai 12 TEM (Advanced Microscopy Techniques, NJ, USA) at an accelerating voltage of 120 kV and equipped with a Gatan Ultrascan 4000 4k × 4k CCD Camera System Model 895.
000 cells per mL and were allowed to attach to the surface for 24 h prior to SiNP exposure.
:1, 2:1, 3:1) and then with Epon, and finally the cell pellet was treated with Epon and cured at 60 °C for 48 h alone for embedding the cells in this resin. Embedded cells were then sectioned using a microtome. Ultra-thin sections (ca. 70 nm thickness) collected on 200 mesh copper grids with a carbon support film (3 grids per sample) were stained with 4% uranyl acetate and Reynolds lead citrate, and the samples (duplicates) were examined using an FEI Tecnai 12 TEM (Advanced Microscopy Techniques, NJ, USA) at an accelerating voltage of 120 kV and equipped with a Gatan Ultrascan 4000 4k × 4k CCD Camera System Model 895.
J774 cell exposure to SiNPs and cytotoxicity analysis (cellular ATP levels)
Murine monocyte/macrophage (J774) cells (ATCC; VA, USA) were maintained as described previously.24 Cells were initially cultured in 75 cm2 tissue culture flasks (Corning, NY, USA) at 37 °C with 5% CO2 and 95% relative humidity, For the exposure experiments, cells were cultured in DMEM (phenol red-free) with 10% FBS, in 96-well plates at 20000 cells per well (∼0.32 cm2 surface area; 100 μL medium), for 24 h prior to particle exposure. Cell counts were determined using the Multisizer 3 Coulter Counter (Beckman Coulter, ON, Canada). The stock particle suspensions (RT) were sonicated for 20 min, and working suspensions were prepared in serum-free medium (100 μL) and re-sonicated for 10 min, before dosing cells at 0, 10, 30 and 100 μg cm−2 (well surface area, 96-well plate), where cells were in 100 μL of DMEM + 10% FBS. After dosing, the final concentration of FBS in cell culture medium (200 μL) was 5%. Cells were incubated after nanoparticle exposure at 37 °C with 5% CO2 and 95% relative humidity for 24 h. Cellular ATP levels (energy metabolism) were determined as a cytotoxicity endpoint using a luminescence-based ViaLight Plus assay on the BioTek Synergy 2 multimode plate reader, following the manufacturer's recommended protocol. Exposure experiments were conducted three times (n = 3), with triplicate samples per experiment.
Exposure of J774 cell mitochondrial fractions to SiNPs for mass spectrometry-based proteomic analysis
000000 cells) was centrifuged at 850g for 2 min. (Note: Multiple tubes containing 20000000 cells per tube were processed using this process simultaneously.) Then, 800 μL of Mitochondria Isolation Reagent A was added to the pellet, and incubated on ice. After 2 min, 10 μL of Mitochondria Isolation Reagent B was added to the mixture, incubating it on ice for 5 min, vortexing it every min. After 5 min, 800 μL of Mitochondria Isolation Reagent C was added. The tube was inverted gently several times and centrifuged at 700g for 10 min at 4 °C, and the supernatant was collected. Pooled mitochondrial fractions were subdivided as required for the exposure experiment and centrifuged at 12000g for 15 min at 4 °C, and the mitochondrial pellets were washed with Mitochondria Isolation Reagent C, and kept on ice for downstream processing.
000000 cells) was exposed to SiNPs at concentrations of 5 and 15 μg mL−1. Briefly, 200 μL of the particle suspensions was added to the mitochondrial pellet, vortexed and incubated for 2 h at 37 °C. These samples were then vortexed and centrifuged at 12500g for 10 min. The mitochondrial pellet was washed three times with 25 μL aliquots of Mitochondria Isolation Reagent C, and stored at −80 °C, for proteomics analysis.
000g for 10 min, and the supernatants were fractionated using molecular weight cut-off filters (MWCO) to obtain fractions: <10, 10–50, 50–100 kDa as described previously.25 Initially 10 kDa MWCO filters were pre-wetted using deionized water (300 μL) at 14000g for 10 min, filtrates were discarded, and mitochondrial lysates (100 μL) diluted with deionized water (200 μL) were added to these filters, and centrifuged at 14000g for 10 min. The filtrates were removed, while the residues were diluted with 175 μL aliquots of 10% ACN (aq), inverted into new receiver tubes and spun at 5000g for 3 min for the collection of solubilized residues which were then transferred to a pre-wetted 50 kDa MWCO filter set-up and spun at 14000g for 15 min. The resulting filtrates were saved and the residues were solubilized as mentioned before, transferred to a pre-wetted 100 kDa MWCO filter set-up and spun at 14000g (15 min). Filtrates obtained from MWCO fractionation were evaporated to complete dryness under a gentle stream of high-purity N2 (g). These evaporated fractions were resuspended in 25 μL of 50 mM NH4OAc (pH 7.4) and were treated with 2 μL ProteaseMAX and 10 μL of Trypsin/Lys C enzyme solution (50 μg mL−1) for enzymatic digestion,26 vortexed gently and then centrifuged at 5000g (1 min). Samples were then sonicated for 5 min in an ice bath, centrifuged at 5000g (1 min), and incubated overnight in a water bath, at 37 °C. Enzymatic digestion reaction was quenched with 5 μL of 5% TFA in deionized water, and vortexed (3 s), and samples were centrifuged at 14000g (10 min) to remove any residues. Supernatants were stored at −80 °C for mass spectrometry analysis by MALDI-TOF-TOF-MS and LC-Orbitrap.
Mass spectrometry analyses
LC-MS/MS analysis and protein identification
Another set of enzymatically digested samples were desalted using ZipTip C18 pipette tips (Millipore, catalog number ZTC18S096), according to the manufacturer's protocol, were dried by evaporation using a Speed Vac concentrator (Savant) and were stored at −20 °C prior to MS analysis. Before MS analysis, the dried peptides were immediately re-suspended in 1% FA. All samples were analyzed by nano LC coupled to an Orbitrap Elite mass spectrometer (Thermo Fisher Scientific). Chromatographic separation of peptides was performed on a Proxeon EASY-nLC 1000 System (Thermo Fisher Scientific) equipped with a Thermo Scientific™ Acclaim™ PepMap™ C18 column, 15 cm × 50 μm ID, 3 μm, 100 Å employing a water/ACN/0.1% FA gradient. Five μL aliquots of Tryp/LysC digested and C18 cleaned-up samples were loaded on an LC column, and the flow rate was set at 0.3 μL min−1. Peptides were separated initially with 1% ACN, which was raised to 3% ACN over 2 min, and then was increased to 24% of ACN over 170 min, followed by a linear increase to 100% of ACN over 29 min, followed by a washing period of 10 min with 100% of ACN. The eluted peptides were directly sprayed into the mass spectrometer using positive electrospray ionization (ESI) at an ion source temperature of 250 °C and an ion spray voltage of 2.1 kV. Full-scan MS spectra (350–2000 m/z) were acquired in the Orbitrap Elite at 60000 (m/z 400) resolution. The automatic gain control settings were 1E6 for full FTMS scans and 5E4 for MS/MS scans. Fragmentation was performed with collision-induced dissociation (CID) in the linear ion trap when the ion intensity was >1500 counts. The most intense ions were isolated for ion trap CID with charge states ≥2 and sequentially isolated for fragmentation using the normalized collision energy set at 35%, activation Q at 0.250 and an activation time of 10 ms. Ions selected for MS/MS were dynamically excluded for 30 s. Calibration was performed externally with Pierce LTQ Velos ESI Positive Ion Calibration Solution (Thermo Fisher Scientific, catalog number 88322). The Orbitrap Elite mass spectrometer was operated with Thermo Xcalibur software. All RAW files were converted to mzXML using ReAdW-4.3.1. The mzXML files were analyzed using Thermo Proteome Discoverer (PD) 2.2. Database searches were performed with SEQUEST HT and MS Amanda 2.0 search algorithms with a few modifications: trypsin digestion, 2 maximum missed cleavages, a precursor mass tolerance of 10 ppm, a fragment mass tolerance of 0.6 Da in the case of SEQUEST HT, and 5 ppm MS1 tolerance and 0.02 Da MS2 tolerance in the case of MS Amanda 2.0, a fixed modification of +57.021 Da (carbamidomethylation) on cysteine, and variable modifications of +15.995 Da (oxidation) on methionine, +79.966 Da (phosphorylation) on serine, threonine, and tyrosine, +33.061 Da (chlorination) on tryptophan and tyrosine, and +44.985 Da (nitrosylation) on tryptophan and tyrosine. A reverse database search was performed for both search engines to determine the spectral false discovery rate (FDR), and the subsequent results were filtered using an FDR of ≤ 1%. The FASTA database used was a mouse proteome downloaded from UniProt with the addition of 635 common contaminants such as proteases, keratins and ubiquitins, yielding a total of 17239 non-redundant protein sequences. Prior to quantitation, the Spectrum Files RC node in PD 2.2 was utilized to perform spectrum recalibration. The false discovery rate (FDR) was determined by using a target-decoy search strategy. Only high-confidence peptides defined by SEQUEST HT or MS Amanda 2.0 with a 1% false discovery rate by Percolator were considered for the peptide identification. The mass spectrometry proteomics data were deposited with the ProteomeXchange Consortium via the PRIDE1 partner repository with the dataset identifier PXD027593.
Particle potency estimates
The dose–response data for protein changes (i.e. protein intensity data) or the cytotoxicity analysis data (i.e. cellular ATP levels) for the particle exposure groups were normalized to the corresponding control group value (no particle treatment), to obtain a fold-effect (FE) for each particle dose. Potency estimate (β) was derived from the following equation:| FE = (Dose + 1)β |
Statistical and bioinformatic analyses
The associations between the physicochemical characteristics of SiNPs and the potency values (β) for these SiNP exposure-related mitochondrial protein or cytotoxicity (cellular ATP) responses were tested by Pearson product moment correlation analyses using SigmaPlot v13.0 (Systat Software, San Jose, CA, USA).Mass spectral intensities of mitochondria-related proteins after SiNP exposures were normalized to control (no particle treatment) values to obtain protein fold-changes. These protein fold-change data were used to conduct the following bioinformatics analyses. A heat map with hierarchical clustering was employed to visualize differential patterns of protein responses as related to the different particle exposures. The analysis was done using the hierarchical clustering option in GenePattern (https://genepattern.broadinstitute.org/gp/pages/login.jsf) and formatted in Java treeview (https://jtreeview.sourceforge.net/). Furthermore, Ingenuity Pathway Analysis (IPA) (Ingenuity Systems, https://www.ingenuity.com) was used to analyse for protein interactions, biofunctions and canonical pathways using the protein fold-change data. The fold-change cut off was set at 1.5, and p < 0.05 and a z score of 2 were used for the identification of canonical pathways and disease/biological functions.
Results
Characterization of physicochemical properties
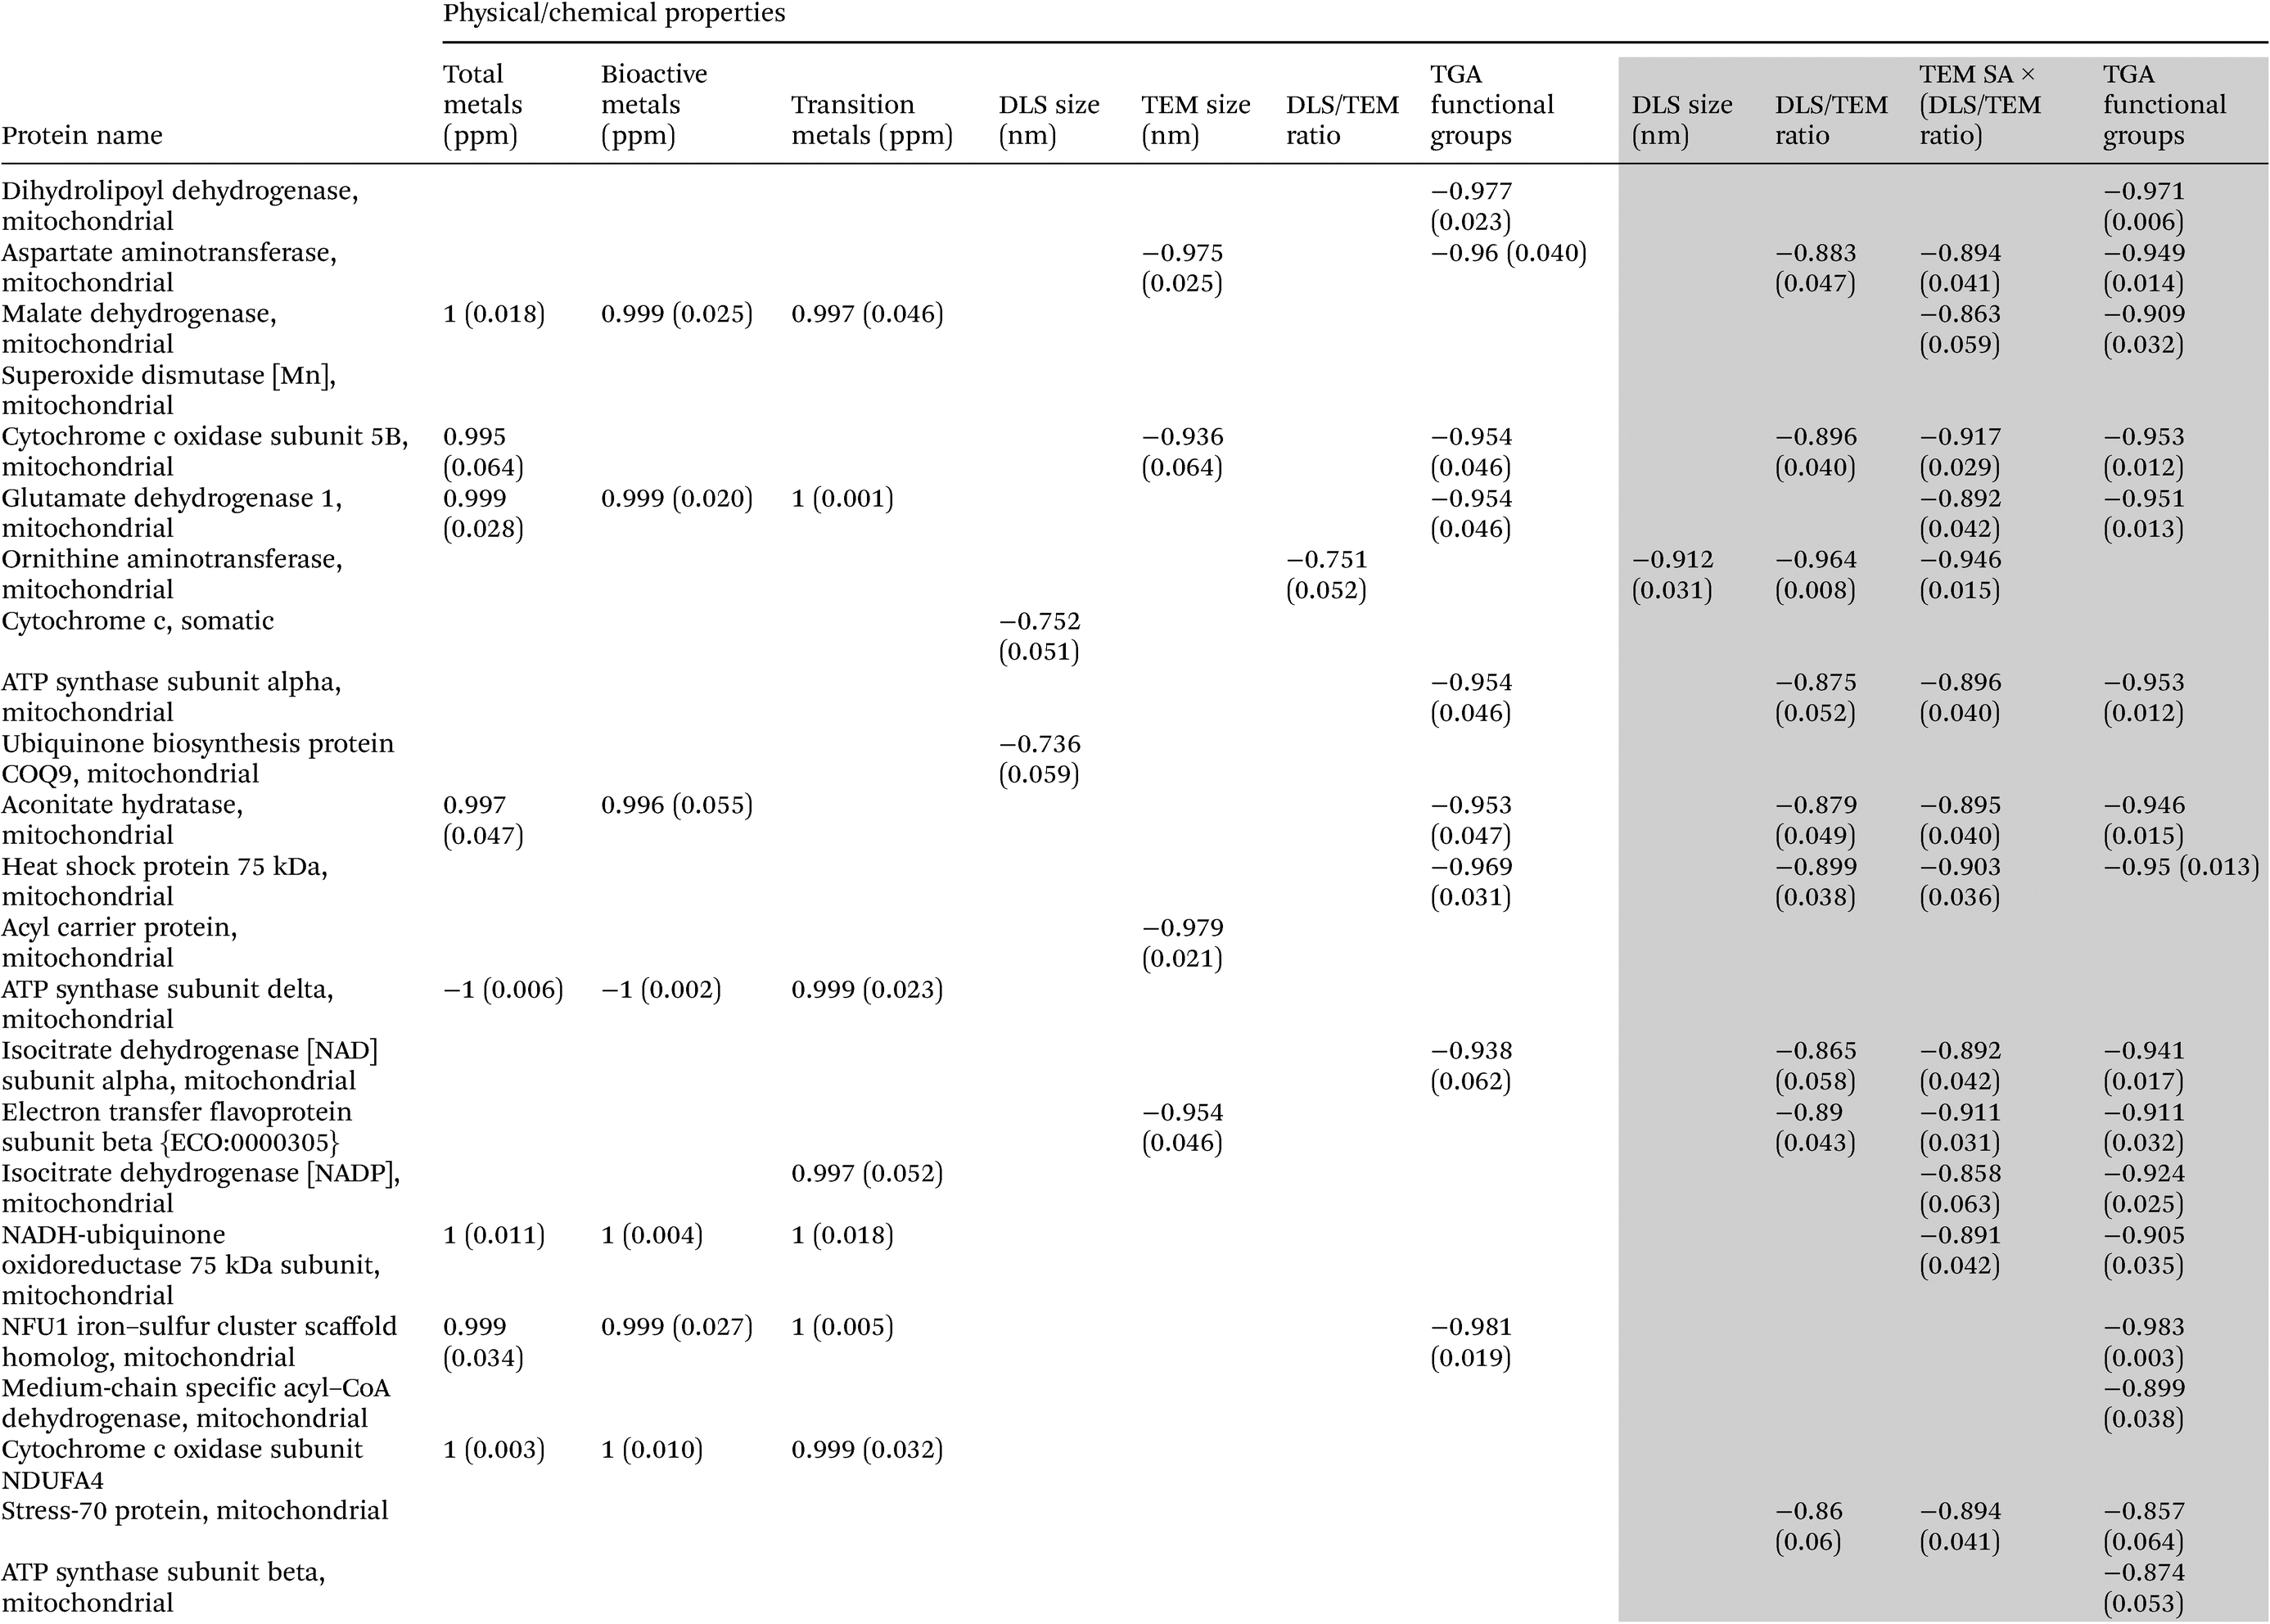
The TEM images shown in Fig. 1A–C illustrate the sizes and shapes of the SiNPs in the dry state. The particles are spherical in shape with some aggregation observed at the 15 and 30 nm sizes, while 75 nm SiNPs appeared to be dispersed well. Quantitative analysis data for the key physicochemical properties including size and surface area (based on TEM images) as well as BET surface area, DLS hydrodynamic size, surface charge (zeta potential), surface functional group content (by TGA and quantitative NMR analysis) and elemental analysis results for these SiNPs are presented in Table 1. The results of the elemental analysis are provided only for the pristine NPs and not for the surface-modified NPs; since the surface-modified SiNPs were derived from their correspondingly sized pristine counterparts, the latter NPs would only vary in organic surface composition. Elemental analysis revealed that the total metal, reactive and transition metal contents were the highest for the pristine 15 nm SiNPs compared with their 30 and 75 nm counterparts. Also, surface area by TEM was the highest for the 15 nm pristine SiNPs. Surface functional groups were higher for the –NH2 group-containing SiNP (Table 1). | ||
| Fig. 1 TEM analysis results for dry pristine amorphous silica (A) 15 nm, (B) 30 nm, and (C) 75 nm nanoparticles (SiNPs). | ||
| SiNP ID | Physicochemical properties | |||||||||||
|---|---|---|---|---|---|---|---|---|---|---|---|---|
| Total metals (ppm) | Bioactive metals (ppm) | Transition metals (ppm) | BET SA (m2 g−1) | TEM SA (m2 g−1) | DLS size (nm) | TEM size (nm) | DLS/TEM ratio | TEM SA × (DLS/TEM Ratio) | Zeta pot (mV) | TGA functional groups (μmol g−1) | qNMR functional groups (μmol g−1) | |
| Metal contents of SiNP nanoforms were determined by ICP-MS/AES; DLS size and zeta potential values for SiNPs were in 0.5 M K3PO4 buffer (pH 7.4), DLS/TEM ratio is a measure of agglomeration; TEM SA × (DLS/TEM ratio) provides information on the available reaction surface. | ||||||||||||
| 15 nm-P | 848.24 | 1649.80 | 785.15 | 29.6 | 130.0 | 657.4 ± 172.4 | 17.2 ± 3.5 | 38.2 | 4966.0 | −15.9 ± 1.2 | — | — |
| 30 nm-P | 615.55 | 1184.60 | 541.30 | 97.2 | 78.8 | 1128.0 ± 423.8 | 28.8 ± 3.5 | 39.2 | 3089.0 | −13.4 ± 2.8 | — | — |
| 75 nm-P | 476.36 | 918.45 | 419.10 | 17.0 | 28.8 | 260.1 ± 30.2 | 78.2 ± 5.5 | 3.3 | 95.0 | −16.6 ± 2.3 | — | — |
| 15 nm-C3-COOH | — | — | — | 162.0 | — | 530.6 ± 49.4 | — | 30.8 | 4004.0 | −17.8 ± 0.7 | 351 | 522 ± 55 |
| 15 nm-C11-COOH | — | — | — | 20.1 | — | 445.3 ± 82.0 | — | 25.9 | 3367.0 | −21.4 ± 4.5 | 325 | 196 ± 13 |
| 15 nm-NH2 | — | — | — | 9.2 | — | 822.4 ± 177.5 | — | 60.0 | 9858.0 | −6.7 ± 1.7 | 1232 | 757 ± 137 |
| 15 nm-PEG | — | — | — | 19.6 | 164.3 | 528.3 ± 54.2 | 13.7 ± 1.4 | 38.6 | 6342.0 | −2.1 ± 0.5 | 180 | 196 ± 5 |
Cellular uptake of SINPs by TEM analyses
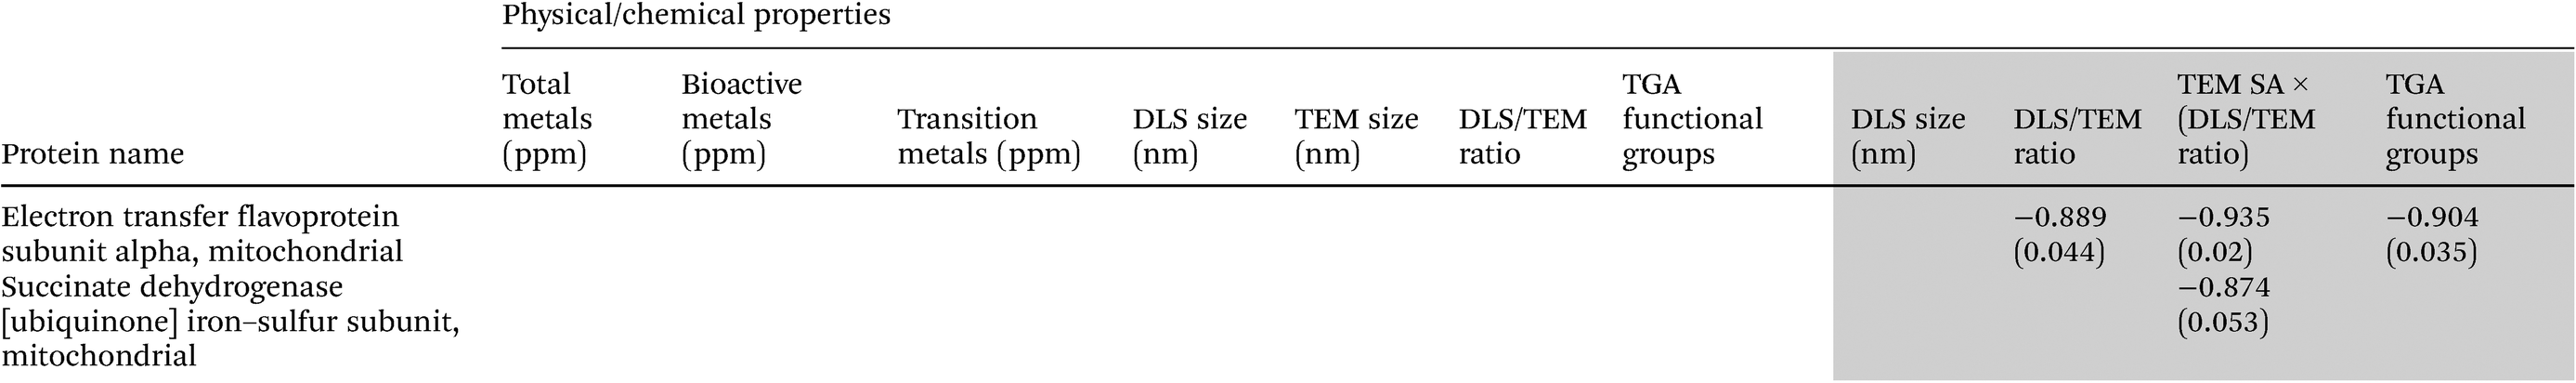
A comparative assessment of the cellular uptake and intracellular localization of these nanoparticles after 24 h exposure of the J774 cells to these SiNPs is shown in Fig. 2A–C. Imaging of the control cells that were not exposed to any particle revealed typical interphase J774 monocyte/macrophage morphology with prominent nuclei, granular cytoplasm, membrane protrusions, vacuoles and mitochondria with visible double membranes (Fig. 2A). SiNPs of all sizes were taken up by macrophage cells. In cells exposed to SiNPs of 15 nm size (Fig. 2B), nanoparticles were observed in the cytoplasm, and in some cases particles seemed to be present in aggregates inside larger vesicles or were in endosome-like vesicles in the cytoplasm (data not shown). The pristine 30 nm-sized SiNPs were taken up by the J774 cells as dense agglomerates/aggregates (see the black arrows) present in large cellular vesicles (Fig. 2C). Mitochondrial structural anomalies such as less obvious external membranes, and less obvious or absent cristae, and vacuolated mitochondria were seen with the smaller sized SiNPs (15, 30 nm) (Fig. 2B–C), while autophagosomes with particle aggregates and some vacuolated mitochondria were seen in cells exposed to 75 nm pristine SiNPs (data not shown).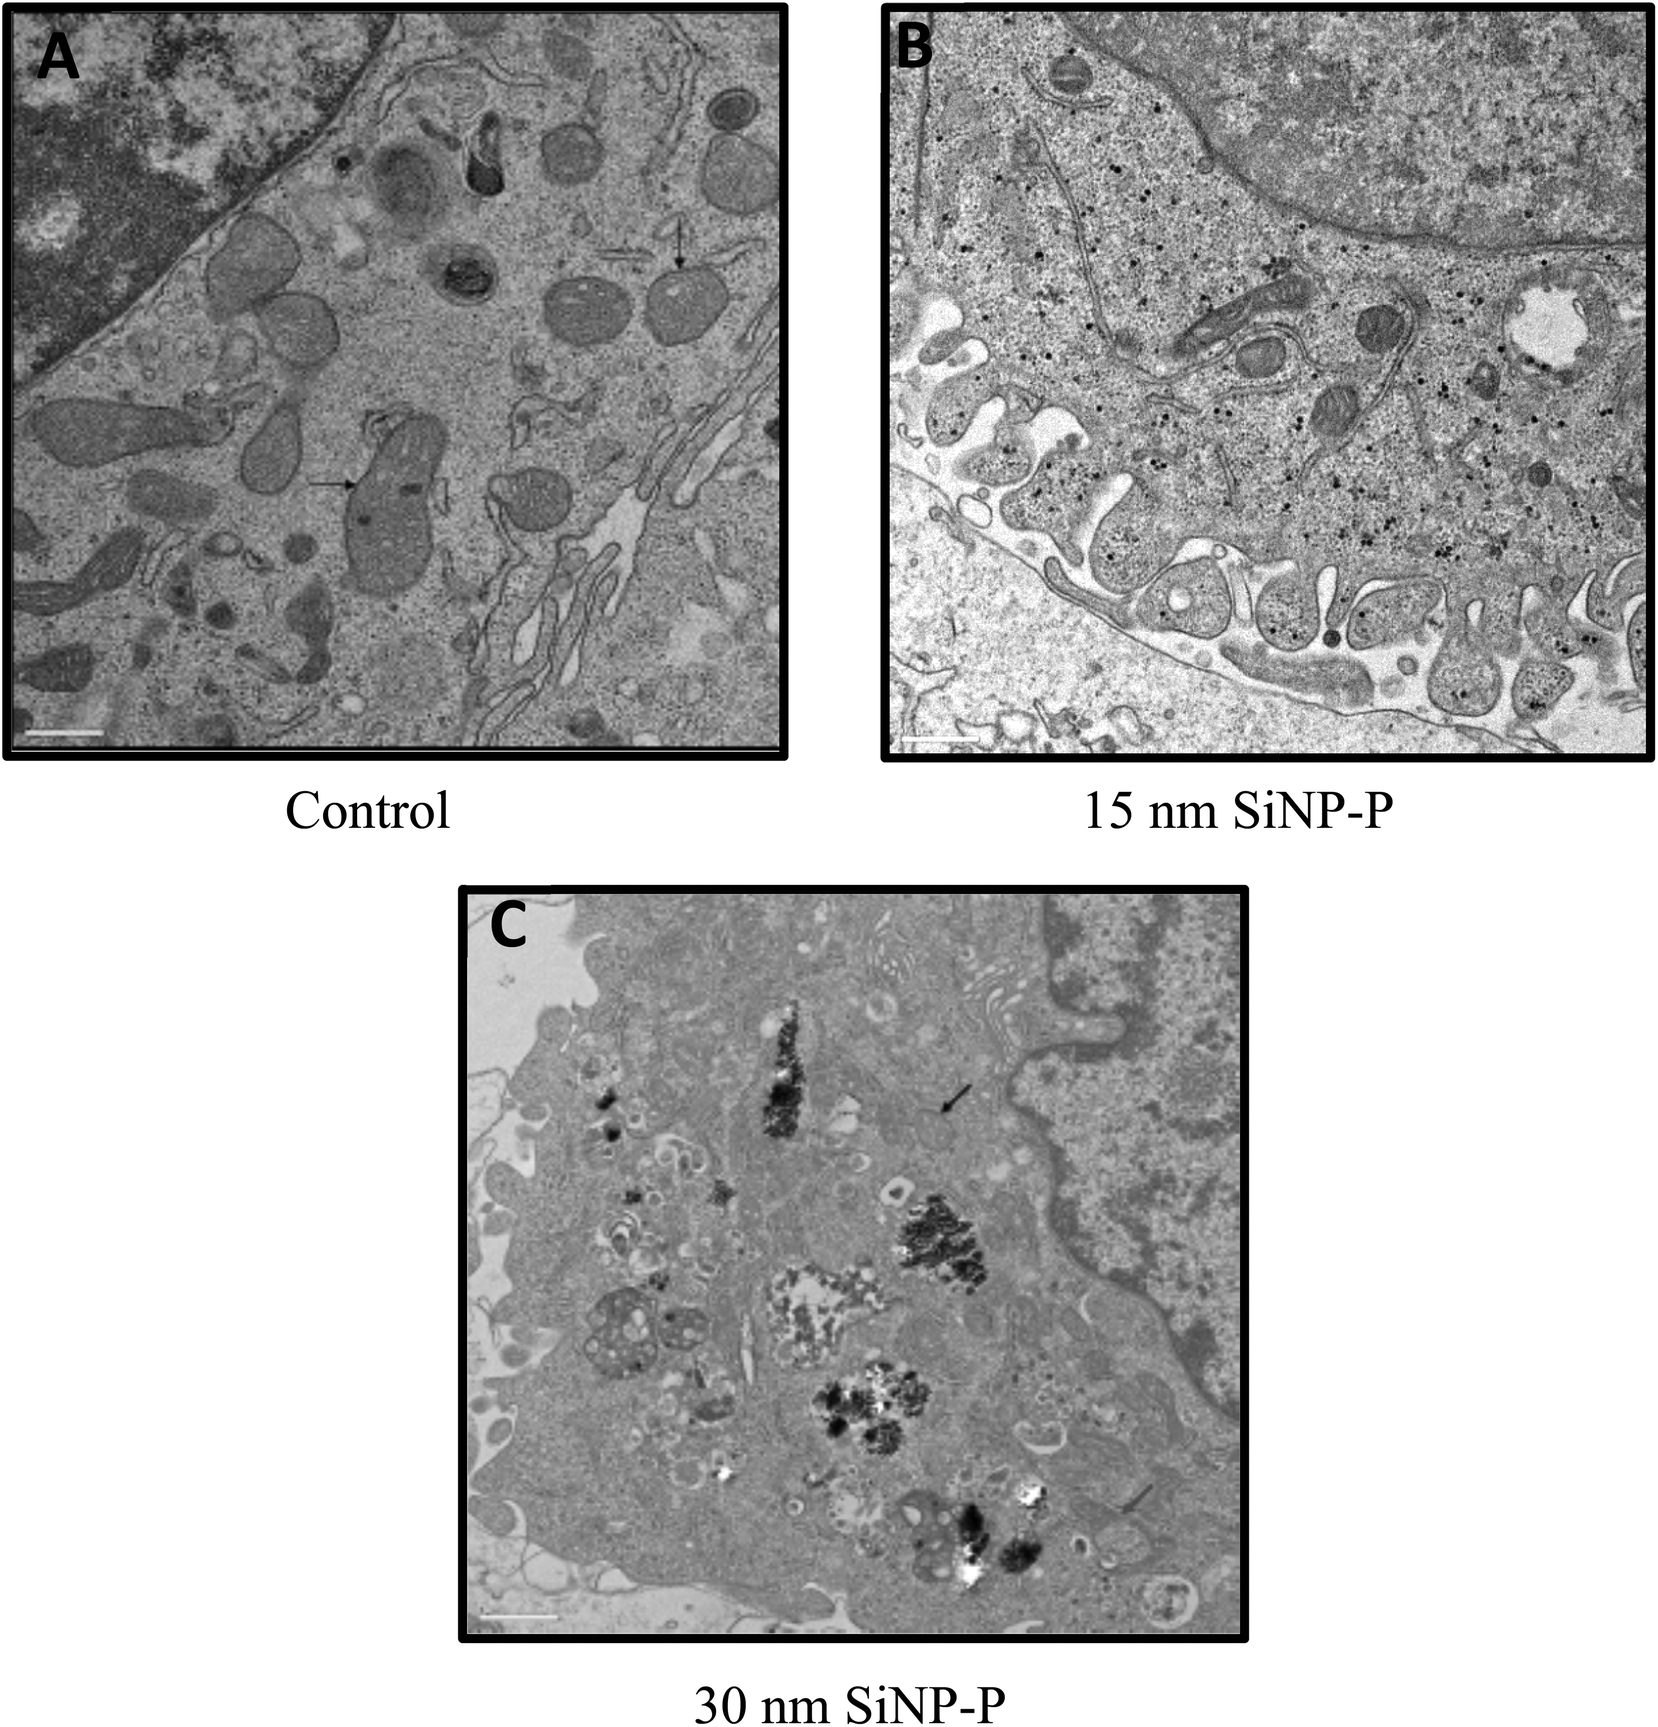 | ||
| Fig. 2 TEM results for J774 cells exposed for 24 h to SiNPs, showing internalization of nanoparticles and related changes in subcellular compartments. Note: (A) Control cells show a clear double-membrane feature of the mitochondria. (B) Granules of nanoparticles are seen in the cytoplasm of J774 cells exposed to 15 nm pristine SiNPs, and the mitochondrial membranes are not clear compared with the controls. (C) Mitochondrial membranes are still less clear after 30 nm SiNP-pristine exposures compared with those of the control cells. After these SiNP exposures, aggregated/agglomerated nanoparticles are encapsulated into secondary lysosomes, and in frame C, after 30 nm pristine SiNP exposure, vacuolated mitochondria are observed (red arrow). | ||
J774 cellular ATP responses to SiNP exposures
J774 cells exposed to these SiNP variants showed decreased ATP responses with an increased dose of NP exposure. Three-way ANOVA results (data not shown) indicated a size main effect (p < 0.027), with smaller size SiNPs being relatively more potent (Table 2). The 15 nm pristine SiNPs are associated with the highest potency value β compared with their pristine 30 and 75 nm counterparts. Also, some surface modifications led to reduced cytotoxic potency values within the 15 nm size particles (–C3–COOH, NH2), whereas the others increased (–C11–COOH, PEG). Moreover, cellular ATP levels exhibited a negative trend of association with the BET surface area (r = −0.560, p = 0.191).| SiNP nanoform | β (relative potencies) |
|---|---|
| 15 nm SiNP-P | 0.027 |
| 30 nm SiNP-P | 0.012 |
| 75 nm SiNP-P | 0.021 |
| 15 nm SiNP-C3COOH | 0.012 |
| 15 nm SiNP-C11COOH | 0.024 |
| 15 nm SiNP-NH2 | 0.011 |
| 15 nm SiNP-PEG | 0.026 |
Mitochondrial protein changes after exposure to SiNPs
Initial mass-spectral profiling by MALDI-TOF-TOF-MS analysis revealed SiNP exposure-specific mass-spectral changes in tryptic peptide profiles as shown by Fig. 3A–F. For instance, decreased tryptic peptide intensities are noticed with exposure to SiNPs irrespective of their size and modifications compared with the control particle untreated mitochondrial digests (e.g. m/z region 1000–2400 Da). In addition, exposure to 12 nm pristine amorphous SiNP (used as a positive control in this study, from another supplier) exhibited a different mitochondrial tryptic peptide profile compared with the almost similar-sized (15 nm) pristine amorphous SiNPs used in this toxicity screening study. In addition, size-related and surface modification-related changes within the same-sized SiNPs’ tryptic peptide signal intensities are observed in these m/z profiles (m/z region 1100–2400 Da). Similarly, in-depth LC-Orbitrap analysis results (with overall standard deviation (SD) associated with the normalized analyte (protein) intensities for replicate analysis better than 1%, across all SiNP exposures) exhibited different SiNP size-related and surface modification-related changes in various mitochondria-related proteins (n = 213) at the doses tested (0, 5 and 15 μg mL−1). However, 32 of these mitochondrial proteins were detectable (based on intensity values) across all particle exposures while the other proteins were expressed with some SiNP exposures only. Of the proteins detected for all treatments, respiratory chain proteins (e.g. NADH:ubiquinone oxidoreductase, succinate dehydrogenase, cytochrome c oxidase, electron transfer flavoprotein subunit), ATP synthase subunit and antioxidant enzymes (e.g. superoxide dismutase 2 – MnSOD) were a few of them, and exposure dose-related changes were also seen in these protein responses (ESI Table 1†). | ||
| Fig. 3 MALDI-TOF-TOF-MS profiles illustrating mitochondrial protein changes after SiNP exposure. | ||
Association between the physicochemical properties of SiNPs and mitochondrial protein changes
Analyses of heat map and hierarchical clustering results revealed nanoparticle exposure dose-related up- (red) and down- (green) regulation of different mitochondrial proteins (Fig. 4). Most proteins were down-regulated at the higher dose (15 μg mL−1) of particle treatment. At the low-dose (5 μg mL−1) particle exposure, the smaller particle size appeared to exhibit increased protein expression compared with the other particles. Also, the relationships between SiNP potency values (β) derived from mitochondrial protein dose–response data as mentioned previously and SiNP physicochemical properties are illustrated in Table 3 (only significant correlations are given here). In general, these results indicated negative associations between SiNP size and SiNP potencies (β) derived based on aspartate amino transferase, acyl carrier protein responses. Similarly, a positive correlation was seen between metal contents (for total, bioactive, transition metal contents) and relative SiNP potencies (β) based on malate dehydrogenase, glutamate dehydrogenase, aconitate hydratase, ATP synthase subunit delta, NADH:ubiquinone oxidoreductase, NFU 1 iron–sulfur cluster scaffold protein, and cytochrome c oxidase subunit N protein responses. Also, negative correlations were observed between surface modifications and β values for dihydrolipoyl dehydrogenase, aspartate aminotransferase, malate dehydrogenase, and cytochrome c oxidase as shown in Table 3. | ||
| Fig. 4 Heatmap and hierarchical clustering demonstrating mitochondrial protein effects (normalized to controls, log 2 transformed) related to the different SiNP exposures. | ||
| Uncoloured region in the table consists of data for all SiNPs, while data in the grey region are only for the analysis of pristine and surface-modified 15 nm SiNPs. |
|---|
|
|
Pathway analyses
Pathway analysis based on protein fold-changes (compared with no particle treatment controls) using IPA (fold-change cut off = 1.5; p < 0.05 and met the criteria of an activation z score of 2) identified the top 5 canonical pathways to be oxidative phosphorylation, the TCA cycle, fatty acid β oxidation, valine degradation I and isoleucine degradation I (Fig. 5A). Similarly, some of the biological functions affected included the quantity of carnitine, concentration of fatty acid, energy expenditure, accumulation of lipid, metabolism of reactive oxygen species, energy homeostasis, cell death, and apoptosis (Fig. 5B), and the top 5 upstream regulators identified were CLPP, INSR, PPARGC1A, MAP4K4 and PTEN (Fig. 5C). Detailed analyses of these different biological events revealed particle-specific increased or decreased protein expressions in the different pathways. For instance, increased or decreased expression or no change in the constituent proteins of the fatty acid oxidation pathway appeared to vary with SiNP form and exposure dose.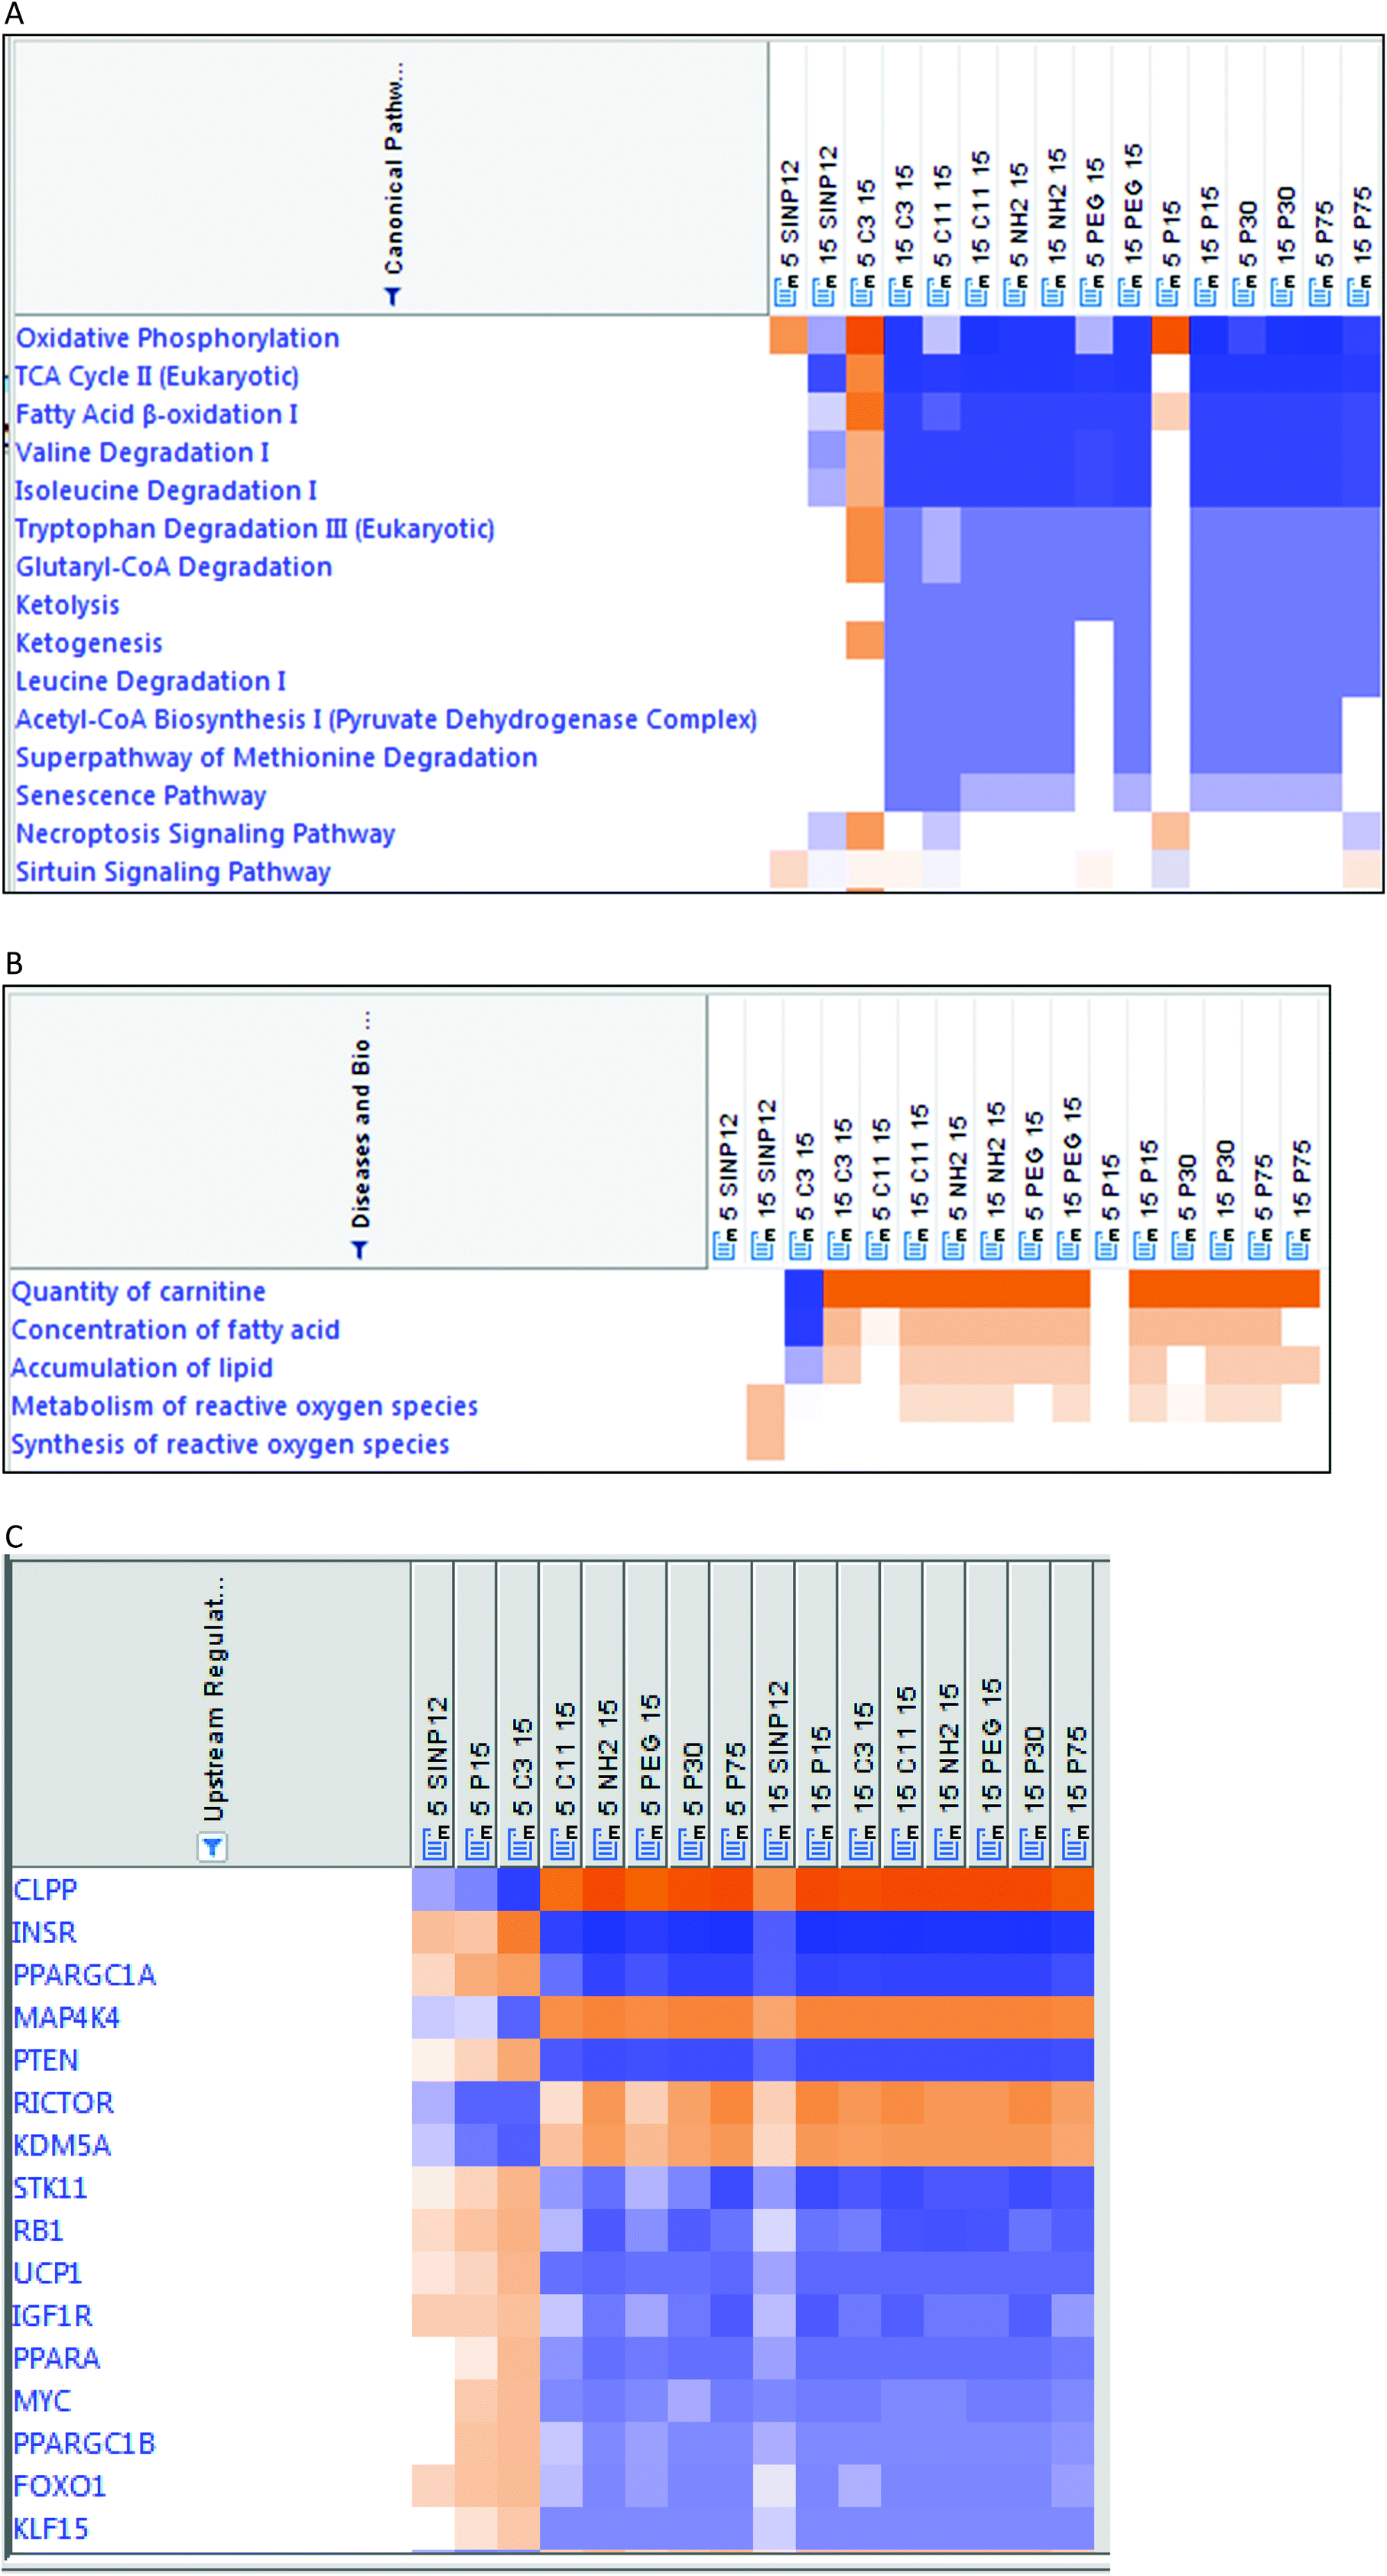 | ||
| Fig. 5 Pathway analysis (IPA) results based on mitochondrial protein fold-changes (normalized to controls, fold-change cut off 1.5) as associated with the different SiNP exposures. | ||
Correlation tests for cellular ATP vs. mitochondrial ATP synthases identified positive trends of the associations (pristine SiNPs: cellular ATP vs. ATP synthase alpha subunit, r = 0.807 (p = 0.403); cellular ATP vs. ATP synthase beta subunit, r = 0.948 (p = 0.206); all SiNPs: cellular ATP vs. ATP synthase alpha subunit, r = 0.541 (p = 0.210); cellular ATP vs. ATP synthase beta subunit, r = 0.446 (p = 0.315)).
Discussion
There are reports on amorphous SiNP toxicity testing by in vitro cellular exposures or in vivo exposures using animal models (inhalation/intratracheal instillation, intravenous/intraperitoneal, etc.) with inconsistency in the study findings.29,30 Furthermore, most of these studies focused on SiNP size-related effects. Not much is known in terms of the toxicity testing of SiNP nanoforms, for instance, on surface-modified SiNPs. Moreover, some of these study findings have implicated SiNP exposures in driving adverse organ/system-level effects including cardiovascular effects.22,31 Emerging evidence also points towards a link between the mitochondrial toxicity of SiNPs and the observed cardiovascular effects.8,14 Amorphous SiNP exposure-related toxicity mechanisms need further exploration, especially with respect to potential mitochondrial function-related effects.In this study, we have therefore focused on understanding SiNP nanoform exposure-related mitochondrial changes. In this context, the initial TEM analysis of J774 cells exposed to SiNPs revealed an internalization of nanoparticles into the cells. For instance, the smaller SiNPs, namely the pristine 15 nm size, are scattered in the cytoplasm, while in the case of the increased-sized SiNP forms, aggregated particles are located in the vacuoles (Fig. 2). In addition, the TEM results show that 15 nm pristine SiNPs are in the proximity of the endoplasmic reticulum (ER) and mitochondrial membrane, suggesting a potential NP interaction with these intracellular organelles (Fig. 2). We also observed that the mitochondrial double-membrane structure was less clear after the SiNP exposure of J774 cells compared with controls. Furthermore, a reduction of cristae in the mitochondria and vacuolated mitochondria (Fig. 2C) are observed in the SiNP-exposed cells (e.g. 30 nm). Similar observations of a loss of cristae and vacuolated mitochondria have been noted in SiNP-exposed HUVEC cells and cardiomyocytes.8,14 Also, the TEM results for 75 nm SiNP-exposed cells showed vacuolated mitochondria and autophagosomes containing NPs (data not shown).
Mitochondria are subcellular organelles and the energy production units of a cell with a key role in maintaining and regulating the metabolic function of cells. An imbalance in mitochondrial functioning can be detrimental to cell viability. Mitochondrial dysfunction is implicated in various metabolic diseases including cardiovascular disease, diabetes, cancer and neurodegenerative disease.32–37 Also, cardiac and mitochondrial dysfunction has been linked to increased ROS production after ENM exposure.38
There are emerging reports implicating different types of nanomaterial exposure in mitochondrial toxicity in various cells/organs.39–41 Our previous work on commercially obtained amorphous SiNP exposure (12–15 nm) in various cell types of lung epithelial (A549) and human and murine monocyte/macrophage cells (THP-1 and J774 cells) have also shown adverse effects on cellular ATP production.24 Furthermore, nanoparticle exposures are known to initiate apoptosis by regulating proteins in the mitochondria-mediated apoptosis pathway.42 Thus, based on our TEM findings in this work and all other reports mentioned above, exploring SiNP nanoform toxicity screening based on a direct exposure of mitochondrial fractions followed by proteomic analysis can provide insights in terms of mitochondrial toxicity and related mechanistic pathways. Isolated mitochondria are known to maintain many functional characteristics when in in situ or in vivo environments. There are reports on the use of isolated mitochondrial fractions for chemical toxicity testing studies.43,44 In this work, mitochondrial fractions were exposed directly to SiNP nanoforms to test the applicability of this methodology to screen nanoparticles for in vitro mitochondrial toxicity by acquiring high-content protein-level information to see the feasibility of this method to support the efforts on a new approach methodology (NAM) in the toxicity testing of nanoforms of chemicals. Besides, the doses used for the direct exposure of mitochondrial fractions in this study were kept low to avoid observing proteomic changes related to frank toxicity. Typically, in vitro cytotoxicity studies have exposed cells (e.g. J774) to SiNPs at doses ranging from 0–2000 μg mL−1.45 In our study, J774 cells were exposed to 0–100 μg cm−2 in 96-well plates for cytotoxicity testing (far less compared with other reports, and the highest dose, 100 μg cm−2, is equivalent to 150 μg mL−1, based on a surface area of 0.3 cm2 for a 96-well plate, and a 200 μL total volume). The maximum dose (15 μg mL−1) used for the exposure of the mitochondrial fraction in this work was a tenth of the highest dose used for the exposure of cells in our study.
Initial MALDI-TOF-TOF-MS profiling in this work demonstrated SiNP exposure-specific changes, in particular size- and surface-modification-specific changes in protein profiles. Furthermore, the protein mass spectral profile comparisons showed differences related to the 12 nm (commercially obtained reference particle) and 15 nm amorphous SiNP (custom synthesized) exposures even though these nanoparticles are of similar sizes, suggesting source-related differences in protein responses. Based on our previous work,24 this 12 nm SiNP (+ve control) displayed high cytotoxic and inflammogenic potency in multiple cell lines, relative to other SiNPs of comparable (15 nm) sizes and exhibited relatively high oxidative potential.23
Further high-content protein analyses carried out by the use of LC-MS/MS analysis exhibited identification of about 200 mitochondria-related proteins that exhibited changes related to SiNP exposures. These proteins included mitochondrial membrane and matrix proteins. Protein fold-changes (SiNP exposure groups normalized to the control) showed SiNP variant- and exposure dose-specific changes (Fig. 4), as with the initial protein profiling results. The heatmap and hierarchical clustering data also illustrate an up- and down-regulation of protein responses specific to these exposures. Some of the proteins identified are products of mitochondrial DNA (e.g. NADPH oxidase, ATP synthase), whereas the others are known to be synthesized by the nuclear DNA and translocated from the cytoplasm to the mitochondria (e.g. superoxide dismutase, aconitase). In general, exposure to the highest dose (15 μg mL−1) of SiNPs exhibited decreased protein expressions for the smaller sized SiNPs (15 and 30 nm). However, the larger-sized SiNP variant (75 nm) showed an opposite trend where at the high dose (15 μg mL−1) some protein responses were increased, as opposed to the low-dose exposure (5 μg mL−1). This behaviour may be attributed to in-solution aggregation/agglomeration of these nanoparticles at the higher dose. Similarly, with the reference particles, the more cytotoxic SiNP 12 nm (+ve control) behaved like the other SiNP variants, whereas the micron-sized TiO2 particles (−ve control) displayed changes in relatively few protein responses, at the highest dose of exposure (Fig. 4), consistent with cytotoxicity responses (data not shown). The reference control particles were incorporated into this work to mainly ensure that the cytotoxicity assay performed as expected.
The association between SiNP potency values (β) derived from these protein responses at the different exposure doses and SiNP physicochemical properties (Table 3) suggests that the metal contents, size, surface area and surface modifications of these nanoforms can influence the toxic potencies of these nanoparticles. Interestingly, a positive correlation was seen between the SiNP metal content, especially transition metals that can redox-cycle and the identified mitochondrial proteins that participate in electron transfer reactions. Meanwhile, the negative correlation between the surface modification and the associated proteins (Table 3) could perhaps be attributed to protein corona formation. Protein coronas are linked to a reduced toxicity of NPs, for instance for nano TiO2 in some reports,46 while they are associated with increased uptake and bioavailability and related protein-level changes.47 Meanwhile, reduced agglomeration in solution as seen with relatively larger pristine SiNPs (75 nm) and with surface-modified NPs (Table 1) may also be attributed to these protein changes. Similarly, cellular ATP levels and mitochondrial ATP synthases were affected by the size, surface area and surface modification properties of these SiNPs. A SiNP exposure-led decline in ATPase activities was reported in HUVEC cells.8 Size- and surface-modifications are known to influence the agglomeration behaviour of nanoparticles, and are implicated in NP-cell interactions in terms of the type of receptor-mediated cellular uptake, for instance, by endocytosis mechanisms.48,49
Pathway analyses based on protein fold-changes in the SiNP-exposed mitochondria exhibited perturbations in critical pathways such as oxidative phosphorylation, the TCA cycle II, fatty acid β oxidation, valine degradation and isoleucine degradation (Fig. 5A). Dose-related effects are noticed with mitochondrial proteins after SiNP exposure, and especially with some SiNP forms (including –C3COOH surface-modified SiNPs) this dose-related effect is more evident (Fig. 4, 5A and Table S1†). For instance, at lower doses some mitochondrial protein expressions were increased, whereas at higher doses a decreased expression of these proteins was noted, and similar observations are seen with mitochondrial pathways, for instance, with the oxidative phosphorylation pathway and TCA cycle (Fig. 5A). Some changes in the expression of mitochondrial proteins constituting the oxidative phosphorylation pathway (Table S1†), the main ATP-generating pathway, are, for instance, seen in complex 1-NDUFA4 and cytochrome c, after SiNP exposures. There are reports on macrophage exposure to nanoparticles (e.g. nano TiO2) and mitochondrial dysfunction associated with increased mitochondrial oxidative stress and reduced metabolic flux in the TCA cycle.7,50–52 Besides, valine and isoleucine are branched chain amino acids and their catabolism takes place mainly in the mitochondria53 and supports ATP production. It is interesting to note that these pathways are downregulated by SiNP exposures, especially at high doses (Fig. 5A). This is consistent with our finding of decreased J774 cellular ATP levels with increasing doses of SiNPs in this study. Moreover, cellular ATP level showed a main size (p < 0.05) effect (data not shown) consistent with mitochondrial protein changes, with especially the smaller size being more potent, as noted previously. In line with our findings, size-related cytotoxicity in vitro is reported in various cells including lung epithelial, monocyte macrophage, and liver and intestinal cells, and smaller sized SiNPs were shown to be relatively more cytotoxic than larger sized ones.54 Yet, there were some deviations reported as well,54 and these deviations were attributed to SiNP synthesis, aggregation, experimental conditions such as serum-containing medium and protein corona formation.
Furthermore, detailed analyses of these different biological events revealed particle-specific increased or decreased protein expressions within the TCA cycle, the oxidative phosphorylation system and the fatty acid oxidation pathways. For instance, in terms of fatty acid β oxidation, the low-dose exposure to 15 nm pristine SiNP led to increased long chain fatty acid CoA ligase, enoyl CoA hydratase, β-hydroxyacyl CoA dehydrogenase and acetyl CoA C-acyl transferase and no change in oxidoreductase, whereas the high-dose exposure to this SiNP variant led to a decrease in all these enzymes that are components of fatty acid β oxidation. Similarly, high-dose exposure to the 30 nm pristine SiNPs led to a reduction in all these enzymes, whereas when exposed to the high dose of 75 nm pristine SiNP, all enzymes were reduced except for the long chain fatty acid CoA ligase, which was unchanged.
Pathway analysis also identified that amorphous SiNP exposures adversely affected elements related to mitochondrial function such as the quantity of carnitine, concentration of fatty acid, accumulation of lipid and metabolism of reactive oxygen species (Fig. 5B). For instance, a quantity of carnitine is essential for fatty acid oxidation in the mitochondria. Deviation from normalcy can imply a potential impact on mitochondrial function as a result of exposure to these SiNPs. Our findings are consistent with previous reports.55 Oxidative stress is known to affect mitochondrial functioning. An impairment in mitochondrial membrane potential, the electron transport chain, and activation of NADPH-like enzyme systems can occur as a consequence of oxidative stress.51 Moreover, mitochondrial dysfunction is reported to initiate apoptosis by regulating proteins such as cytochrome c (Cyt c) and apoptosis inducing factor (AIF) which is released from the mitochondrial intermembrane space.56 Interestingly, both Cyt c and AIF were perturbed by exposure to SiNPs in this work (Table S1†). The mechanistic information obtained from this work and the information on the association between the relative potencies of these nanomaterials and their physicochemical properties can be useful for the construction of quantitative structure–activity (QSAR) and adverse outcome pathway (AOP) models used for health risk analysis associated with nanomaterial exposures.
Furthermore, pathway analysis revealed that SiNP nanoform type and exposure dose can potentially influence upstream regulators, namely CLPP, PPARGC1A, MAP4K4 and PTEN, differently (Fig. 5C). CLPP is an endopeptidase in the mitochondrial matrix and is important in maintaining mitochondrial protein homeostasis.57 Also, SiNP exposures, especially at high doses, exhibited decreased PPARGC1A that coincided with decreased oxidative phosphorylation (Fig. 5A) and decreased superoxide dismutase (SOD2) (Table S1†). PPARGC1A is known to be a transcriptional co-activator and master regulator of mitochondrial function, and interestingly, a decreased level of this regulator molecule was reported to coincide with a reduced expression of oxidative phosphorylation subunits and a reduced expression of various mitochondrial antioxidants in neurodegenerative processes.58 Similarly, SiNP exposures were also associated with upstream MAP4K4 and PTEN effects by this pathway analysis, and these are known to be associated with the regulation of mitochondrial function. Although the upstream regulators are based on a proteomic analysis of the mitochondrial fractions exposed to the SiNPs, not whole cells, the results obtained are still consistent with previous reports on SiNP exposure-related mitochondrial dysfunction in endothelial (HUVEC) cells.9 Also, the findings from this study are consistent with the report from Lee et al. (2021) on mitochondrial effects after the exposure of HepG2 cells to a single nanosilica material and following proteomics changes.59 Besides, mitochondrial exposure involves a relatively shorter exposure time and less material for exposure, compared with exposure of cells to these SiNPs. To our knowledge, very limited work on the application of proteomics for this purpose has thus far been done on these nanomaterials, and none on the toxicity testing of nanoforms.
Recently, to keep pace with the number of engineered nanoparticles that are entering commerce, while reducing the use of animal testing, as with chemical testing, the integration of new approach methodologies (NAMs) based on in vitro cellular and cell-free assays have been explored. The application of new approach methodologies is gaining importance for toxicity screening and in obtaining molecular-level information to advance the risk assessment of ENMs like amorphous SiNPs. These processes are relatively advanced for environmental chemical risk assessment efforts60,61 compared with those for emerging ENM toxicity testing. This new SiNP toxicity screening study is promising as an NAM for nanomaterial toxicity testing to support risk assessment based on adverse mitochondrial effects, which come across as a key event in many adverse health outcomes.
Conclusions
Our findings on the application of mitochondrial fractions for SiNP toxicity screening demonstrate the feasibility of using this strategy for mitochondrial perturbation-based toxicity testing and for the identification of physicochemical determinants of toxicity. Also, proteomic analysis provides insight into toxicity pathways specific to SiNP exposure-led adverse mitochondrial effects consistent with associated cellular cytotoxicity endpoint (ATP) and mitochondrial structural (TEM) changes. These results warrant further research on the application of high-content proteomic analysis in screening for nanomaterial toxicity testing.Conflicts of interest
There are no conflicts to declare.Acknowledgements
The panel of the amorphous SiNPs was synthesized by Applied Quantum Materials Inc. in Edmonton, AB, Canada. We would like to pay tribute to Dr Renaud Vincent who had contributed to the inception and conduct of this work as well as to the preparation of this manuscript, and our irreparable recent loss of him while we were finalizing the manuscript is deeply felt by all of us. We are grateful to Dr Linda Johnston from NRC Canada for providing information on DLS, functional group analysis and surface area for these particles and Dr Nimal DeSilva at the Department of Earth and Environmental Sciences, University of Ottawa for conducting the ICP-MS/AES analysis. We thank Johanne Ouellette at the Facility for Electron Microscopy Research (FEMR), Department of Pharmacology and Therapeutics, McGill University for electron microscopy assistance. This work was funded by the Chemicals Management Plan (CMP) and the Nanotechnology Section, New Substances Assessment and Control Bureau (NSACB) of Health Canada (CRA).References
- Y. X. Yang, Z. M. Song, B. Cheng, K. Xiang, X. X. Chen, J. H. Liu, A. Cao, Y. Wang, Y. Liu and H. Wang, Evaluation of the toxicity of food additive silica nanoparticles on gastrointestinal cells, J. Appl. Toxicol., 2014, 34(4), 424–435, DOI:10.1002/jat.2962.
- S. Sripanyakorn, R. Jugdaohsingh, W. Dissayabutr, S. H. Anderson, R. P. Thompson and J. J. Powell, The comparative absorption of silicon from different foods and food supplements, Br. J. Nutr., 2009, 102(6), 825–834, DOI:10.1017/S0007114509311757.
- M. E. Vance, T. Kuiken, E. P. Vejerano, S. P. McGinnis, M. F. Hochella, D. Rejeski Jr. and M. S. Hull, Nanotechnology in the real world: Redeveloping the nanomaterial consumer products inventory, Beilstein J. Nanotechnol., 2015, 6, 1769–1780, DOI:10.3762/bjnano.6.181.
- Y. Wang, A. Kalinina, T. Sun and B. Nowack, Probabilistic modeling of the flows and environmental risks of nano-silica, Sci. Total Environ., 2016, 545–546, 67–76 CrossRef CAS PubMed.
- P. Kumarathasan, E. Blais, A. Saravanamuthu, A. Bielecki, B. Mukherjee, S. Bjarnason, J. Guénette, P. Goegan and R. Vincent, Nitrative stress, oxidative stress and plasma endothelin levels after inhalation of particulate matter and ozone, Part. Fibre Toxicol., 2015, 12, 28, DOI:10.1186/s12989-015-0103-7.
- G. Oberdörster, A. Maynard, K. Donaldson, V. Castranova, J. Fitzpatrick, K. Ausman, J. Carter, B. Karn, W. Kreyling, D. Lai, S. Olin, N. Monteiro-Riviere, D. Warheit, H. Yang and ILSI Research Foundation/Risk Science Institute Nanomaterial Toxicity Screening Working Group, Principles for characterizing the potential human health effects from exposure to nanomaterials: elements of a screening strategy, Part. Fibre Toxicol., 2005, 2, 8, DOI:10.1186/1743-8977-2-8.
- Q. Chen, N. Wang, M. Zhu, J. Lu, H. Zhong, X. Xue, S. Guo, M. Li, X. Wei, Y. Tao and H. Yin, TiO2 nanoparticles cause mitochondrial dysfunction, activate inflammatory responses, and attenuate phagocytosis in macrophages: A proteomic and metabolomic insight, Redox Biol., 2018, 15, 266–276, DOI:10.1016/j.redox.2017.12.011.
- C. Guo, R. Ma, X. Liu, Y. Xia, P. Niu, J. Ma, X. Zhou, Y. Li and Z. Sun, Silica nanoparticles induced endothelial apoptosis via endoplasmic reticulum stress-mitochondrial apoptotic signaling pathway, Chemosphere, 2018, 210, 183–192, DOI:10.1016/j.chemosphere.2018.06.170.
- C. Guo, J. Wang, L. Jing, R. Ma, X. Liu, L. Gao, L. Cao, J. Duan, X. Zhou, Y. Li and Z. Sun, Mitochondrial dysfunction, perturbations of mitochondrial dynamics and biogenesis involved in endothelial injury induced by silica nanoparticles, Environ. Pollut., 2018, 236, 926–936 CrossRef CAS PubMed.
- L. Chen, J. Liu, Y. Zhang, G. Zhang, Y. Kang, A. Chen, X. Feng and L. Shao, The toxicity of silica nanoparticles to the immune system, Nanomedicine, 2018, 13(15), 1939–1962, DOI:10.2217/nnm-2018-0076.
- D. Napierska, L. C. Thomassen, D. Lison, J. A. Martens and P. H. Hoet, The nanosilica hazard: another variable entity, Part. Fibre Toxicol., 2010, 7(1), 39, DOI:10.1186/1743-8977-7-39.
- J. Y. Kim, J. H. Park, M. Kim, H. Jeong, J. Hong, R. S. Chuck and C. Y. Park, Safety of Nonporous Silica Nanoparticles in Human Corneal Endothelial Cells, Sci. Rep., 2017, 7(1), 14566, DOI:10.1038/s41598-017-15247-2.
- S. Murugadoss, D. Lison, L. Godderis, S. Van Den Brule, J. Mast, F. Brassinne, N. Sebaihi and P. H. Hoet, Toxicology of silica nanoparticles: an update, Arch. Toxicol., 2017, 91(9), 2967–3010 CrossRef CAS PubMed.
- Z. Du, S. Chen, G. Cui, Y. Yang, E. Zhang, Q. Wang, M. F. Lavin, A. J. Yeo, C. Bo, Y. Zhang, C. Li, X. Liu, X. Yang, C. Peng and H. Shao, Silica nanoparticles induce cardiomyocyte apoptosis via the mitochondrial pathway in rats following intratracheal instillation, Int. J. Mol. Med., 2019, 43(3), 1229–1240 CAS.
- K. Lee, J. Lee, M. Kwak, Y. L. Cho, B. Hwang, M. J. Cho, N. G. Lee, J. Park, S. H. Lee, J. G. Park, Y. G. Kim, J. S. Kim, T. S. Han, H. S. Cho, Y. J. Park, S. J. Lee, H. G. Lee, W. K. Kim, I. C. Jeung, N. W. Song, K. H. Bae and J. K. Min, Two distinct cellular pathways leading to endothelial cell cytotoxicity by silica nanoparticle size, J. Nanobiotechnol., 2019, 17(1), 24, DOI:10.1186/s12951-019-0456-4.
- F. Wang, F. Gao, M. Lan, H. Yuan, Y. Huang and J. Liu, Oxidative stress contributes to silica nanoparticle-induced cytotoxicity in human embryonic kidney cells, Toxicol. in Vitro, 2009, 23(5), 808–815, DOI:10.1016/j.tiv.2009.04.009.
- E. J. Park and K. Park, Oxidative stress and pro-inflammatory responses induced by silica nanoparticles in vivo and in vitro, Toxicol. Lett., 2009, 184(1), 18–25, DOI:10.1016/j.toxlet.2008.10.012.
- Y. Ye, J. Liu, M. Chen, L. Sun and M. Lan, In vitro toxicity of silica nanoparticles in myocardial cells, Environ. Toxicol. Pharmacol., 2010, 29(2), 131–137, DOI:10.1016/j.etap.2009.12.002.
- C. Guo, Y. Xia, P. Niu, L. Jiang, J. Duan, Y. Yu, X. Zhou, Y. Li and Z. Sun, Silica nanoparticles induce oxidative stress, inflammation, and endothelial dysfunction in vitro via activation of the MAPK/Nrf2 pathway and nuclear factor-κB signaling, Int. J. Nanomed., 2015, 10, 1463–1477, DOI:10.2147/IJN.S76114.
- C. C. Chou, W. Chen, Y. Hung and C. Y. Mou, Molecular Elucidation of Biological Response to Mesoporous Silica Nanoparticles in Vitro and in Vivo, ACS Appl. Mater. Interfaces, 2017, 9(27), 22235–22251, DOI:10.1021/acsami.7b05359.
- M. Kusaczuk, R. Krętowski, M. Naumowicz, A. Stypułkowska and M. Cechowska-Pasko, Silica nanoparticle-induced oxidative stress and mitochondrial damage is followed by activation of intrinsic apoptosis pathway in glioblastoma cells, Int. J. Nanomed., 2018, 13, 2279–2294, DOI:10.2147/IJN.S158393.
- Y. Li, J. Duan, X. Chai, M. Yang, J. Wang, R. Chen and Z. Sun, Microarray-assisted size-effect study of amorphous silica nanoparticles on human bronchial epithelial cells, Nanoscale, 2019, 11(47), 22907–22923 RSC.
- D. Breznan, N. Nazemof, F. Kunc, M. Hill, D. Vladisavljevic, J. Gomes, L. J. Johnston, R. Vincent and P. Kumarathasan, Acellular oxidative potential assay for screening of amorphous silica nanoparticles, Analyst, 2020, 145(14), 4867–4879, 10.1039/d0an00380h.
- D. Breznan, D. D. Das, J. S. O'Brien, C. MacKinnon-Roy, S. Nimesh, N. Q. Vuong, S. Bernatchez, N. DeSilva, M. Hill, P. Kumarathasan and R. Vincent, Differential cytotoxic and inflammatory potency of amorphous silicon dioxide nanoparticles of similar size in multiple cell lines, Nanotoxicology, 2017, 11(2), 223–235, DOI:10.1080/17435390.2017.1287313.
- P. Kumarathasan, D. Das, M. A. Salam, S. Mohattalage, N. DeSilva, B. Simard and R. Vincent, Mass spectrometry–based proteomic assessment of the in vitro toxicity of carbon nanotubes, Curr. Top. Biochem. Res., 2012, 14, 15–27 CAS.
- M. B. Ariganello, D. Das, D. Breznan, C. MacKinnon-Roy, F. Elisma, A. Khanchi, R. Vincent and P. Kumarathasan, A MALDI-TOF-TOF-MS-based Toxicoproteomic Screening Method to Assess In Vitro Particle Potencies, J. Appl. Toxicol., 2018, 38(10), 1302–1315, DOI:10.1002/jat.3642 , Epub 2018 May 29.
- P. Kumarathasan, S. Mohottalage, P. Goegan and R. Vincent, An optimized protein in-gel digest method for reliable proteome characterization by MALDI-TOF-MS analysis, Anal. Biochem., 2005, 346(1), 85–89, DOI:10.1016/j.ab.2005.06.004.
- R. Vincent, P. Goegan, G. Johnson, J. R. Brook, P. Kumarathasan, L. Bouthillier and R. T. Burnett, Regulation of promoter-CAT stress genes in HepG2 cells by suspensions of particles from ambient air, Fundam. Appl. Toxicol., 1997, 39(1), 18–32, DOI:10.1006/faat.1997.2336.
- S. J. So, I. S. Jang and C. S. Han, Effect of micro/nano silica particle feeding in mice, J. Nanosci. Nanotechnol., 2008, 8(10), 5367–5371 CrossRef CAS PubMed.
- Y. Yang, J. J. Faust, J. Schoepf, K. Hristovski, D. G. Capco, P. Herckes and P. Westerhoff, Survey of food-grade silica dioxide nanomaterial occurrence, characterization, human gut impacts and fate across its lifecycle, Sci. Total Environ., 2016, 565, 902–912 CrossRef CAS PubMed.
- C. Guo, J. Wang, M. Yang, Y. Li, S. Cui, X. Zhou, Y. Li and Z. Sun, Amorphous silica nanoparticles induce malignant transformation and tumorigenesis of human lung epithelial cells via P53 signaling, Nanotoxicology, 2017, 11(9–10), 1176–1194 CrossRef CAS PubMed.
- A. M. Walters, G. A. Porter Jr. and P. S. Brookes, Mitochondria as a drug target in ischemic heart disease and cardiomyopathy, Circ. Res., 2012, 111(9), 1222–1236, DOI:10.1161/CIRCRESAHA.112.265660.
- A. Salminen, J. Ojala, K. Kaarniranta and A. Kauppinen, Mitochondrial dysfunction and oxidative stress activate inflammasomes: impact on the aging process and age-related diseases, Cell. Mol. Life Sci., 2012, 69(18), 2999–3013, DOI:10.1007/s00018-012-0962-0.
- E. Desideri, R. Vegliante and M. R. Ciriolo, Mitochondrial dysfunctions in cancer: genetic defects and oncogenic signaling impinging on TCA cycle activity, Cancer Lett., 2015, 356(2 Pt A), 217–223, DOI:10.1016/j.canlet.2014.02.023.
- S. Cardaci and M. R. Ciriolo, TCA Cycle Defects and Cancer: When Metabolism Tunes Redox State, Int. J. Cell Biol., 2012, 161837, DOI:10.1155/2012/161837.
- J. Nunnari and A. Suomalainen, Mitochondria: in sickness and in health, Cell, 2012, 148(6), 1145–1159, DOI:10.1016/j.cell.2012.02.035.
- G. Zsurka and W. S. Kunz, Mitochondrial involvement in neurodegenerative diseases, IUBMB Life, 2013, 65(3), 263–272, DOI:10.1002/iub.1126.
- C. E. Nichols, D. L. Shepherd, Q. A. Hathaway, A. J. Durr, D. Thapa, A. Abukabda, J. Yi, T. R. Nurkiewicz and J. M. Hollander, Reactive oxygen species damage drives cardiac and mitochondrial dysfunction following acute nano-titanium dioxide inhalation exposure, Nanotoxicology, 2018, 12(1), 32–48 CrossRef CAS PubMed.
- K. C. Nguyen, Y. Zhang, J. Todd, K. Kittle, M. Lalande, S. Smith, D. Parks, M. Navarro, A. F. Tayabali and W. G. Willmore, Hepatotoxicity of Cadmium Telluride Quantum Dots Induced by Mitochondrial Dysfunction, Chem. Res. Toxicol., 2020, 33(9), 2286–2297, DOI:10.1021/acs.chemrestox.9b00526.
- J. Skalska, B. Dąbrowska-Bouta, M. Frontczak-Baniewicz, G. Sulkowski and L. Strużyńska, A Low Dose of Nanoparticulate Silver Induces Mitochondrial Dysfunction and Autophagy in Adult Rat Brain, Neurotox. Res., 2020, 38(3), 650–664, DOI:10.1007/s12640-020-00239-4.
- M. Enea, E. Pereira, M. P. de Almeida, A. M. Araújo, M. de Lourdes Bastos and H. Carmo, Gold Nanoparticles Induce Oxidative Stress and Apoptosis in Human Kidney Cells, Nanomaterials, 2020, 10(5), 995 Search PubMed.
- M. A. Siddiqui, H. A. Alhadlaq, J. Ahmad, A. A. Al-Khedhairy, J. Musarrat and M. Ahamed, Copper oxide nanoparticles induced mitochondria mediated apoptosis in human hepatocarcinoma cells, PLoS One, 2013, 8(8), e69534, DOI:10.1371/journal.pone.0069534.
- C. V. Pereira, A. C. Moreira, S. P. Pereira, N. G. Machado, F. S. Carvalho, V. A. Sardão and P. J. Oliveira, Investigating drug-induced mitochondrial toxicity: a biosensor to increase drug safety?, Curr. Drug Saf., 2009, 4(1), 34–54, DOI:10.2174/157488609787354440.
- R. D. Shannon, G. D. Boardmann and A. M. Dietrich, Mitochondrial response to chlorophenols as a short-term toxicity assay, Environ. Toxicol. Chem., 1991, 10, 57–66 CrossRef CAS.
- L. C. Thomassen, A. Aerts, V. Rabolli, D. Lison, L. Gonzalez, M. Kirsch-Volders, D. Napierska, P. H. Hoet, C. E. Kirschhock and J. A. Martens, Synthesis and characterization of stable monodisperse silica nanoparticle sols for in vitro cytotoxicity testing, Langmuir, 2010, 26(1), 328–335 CrossRef CAS PubMed.
- S. Runa, M. Lakadamyali, M. L. Kemp and C. K. Payne, TiO2 Nanoparticle-Induced Oxidation of the Plasma Membrane: Importance of the Protein Corona, J. Phys. Chem. B, 2017, 121(37), 8619–8625 CrossRef CAS PubMed.
- C. F. Borgognoni, M. Mormann, Y. Qu, M. Schäfer, K. Langer, C. Öztürk, S. Wagner, C. Chen, Y. Zhao, H. Fuchs and K. Riehemann, Reaction of human macrophages on protein corona covered TiO2 nanoparticles, Nanomedicine, 2015, 11(2), 275–282 CrossRef CAS PubMed.
- M. Ansar, D. Serrano, I. Papademetriou, T. K. Bhowmick and S. Muro, Biological functionalization of drug delivery carriers to bypass size restrictions of receptor-mediated endocytosis independently from receptor targeting, ACS Nano, 2013, 7(12), 10597–10611 CrossRef CAS PubMed.
- D. Breznan, D. D. Das, C. MacKinnon-Roy, S. Bernatchez, A. Sayari, M. Hill, R. Vincent and P. Kumarathasan, Physicochemical Properties Can Be Key Determinants of Mesoporous Silica Nanoparticle Potency in Vitro, ACS Nano, 2018, 12(12), 12062–12079, DOI:10.1021/acsnano.8b04910.
- E. Huerta-Garcia, A. Montiel-Dayalos, M. Ramos-Godinez, E. Alfaro-Moreno and R. Lopez-Marure, Efffect of titanium dioxide nanoparticles on the inflammatory process, Mater. Sci., 2014, 8(3), 303–326 CAS.
- A. Manke, L. Wang and Y. Rojanasakul, Mechanisms of nanoparticle-induced oxidative stress and toxicity, BioMed Res. Int., 2013, 942916, DOI:10.1155/2013/942916.
- M. Xia, Y. Zhang, K. Jin, Z. Lu, Z. Zeng and W. Xiong, Communication between mitochondria and other organelles: a brand-new perspective on mitochondria in cancer, Cell Biosci., 2019, 9, 27, DOI:10.1186/s13578-019-0289-8.
- P. Schertl, L. Danne and H. P. Braun, 3-Hydroxyisobutyrate Dehydrogenase Is Involved in Both, Valine and Isoleucine Degradation in Arabidopsis thaliana, Plant Physiol., 2017, 175(1), 51–61, DOI:10.1104/pp.17.00649.
- X. Dong, Z. Wu, X. Li, L. Xiao, M. Yang, Y. Li, J. Duan and Z. Sun, The Size-dependent Cytotoxicity of Amorphous Silica Nanoparticles: A Systematic Review of in vitro Studies, Int. J. Nanomed., 2020, 15, 9089–9113 CrossRef CAS PubMed.
- L. Sun, Y. Li, X. Liu, M. Jin, L. Zhang, Z. Du, C. Guo, P. Huang and Z. Sun, Cytotoxicity and mitochondrial damage caused by silica nanoparticles, Toxicol. in Vitro, 2011, 25(8), 1619–1629, DOI:10.1016/j.tiv.2011.06.012.
- C. Wang and R. J. Youle, The role of mitochondria in apoptosis*, Annu. Rev. Genet., 2009, 43, 95–118, DOI:10.1146/annurev-genet-102108-134850.
- A. Cormeo, F. Sanguedolce, V. Pesce and C. Musicco, Mitochondrial Ccaseinolytic protease P: A possible novel prognostic marker and therapeutic target in cancer, Int. J. Mol. Sci., 2012, 22, 6228, DOI:10.3390/ijms22126228.
- M. E. Witte, P. G. Nijland, J. A. R. Drexhage, W. Gerritsen, D. Geerts, B. V. H. Hof, A. Reijerkerk, H. E. de Vries, P. V. D. Valk and J. V. Horssen, Reduced expression of PGC-1a partly underlies mitochondrial changes and correlates with neuronal loss in multiple sclerosis cortex, Acta Neuropathol., 2013, 125, 231–243, DOI:10.1007/s00401-012-1052-y.
- S. Y. Lee, I. Y. Kim, M. B. Heo, J. H. Moon, J. G. Son and T. G. Lee, Global Proteomics to Study Silica Nanoparticle-Induced Cytotoxicity and Its Mechanisms in HepG2 Cells, Biomolecules, 2021, 11(3), 375, DOI:10.3390/biom11030375.
- M. J. Aardema and J. T. MacGregor, Toxicology and genetic toxicology in the new era of “toxicogenomics”: impact of “-omics” technologies, Mutat. Res., 2002, 499(1), 13–25, DOI:10.1016/s0027-5107(01)00292-5.
- K. E. Tollefsen, S. Scholz, M. T. Cronin, S. W. Edwards, J. de Knecht, K. Crofton, N. Garcia-Reyero, T. Hartung, A. Worth and G. Patlewicz, Applying Adverse Outcome Pathways (AOPs) to support Integrated Approaches to Testing and Assessment (IATA), Regul. Toxicol. Pharmacol., 2014, 70(3), 629–640, DOI:10.1016/j.yrtph.2014.09.009.
Footnote |
| † Electronic supplementary information (ESI) available. See DOI: https://doi.org/10.1039/d2an00569g |
| This journal is © The Royal Society of Chemistry 2022 |