A novel AIE-active camphor-based fluorescent probe for simultaneous detection of Al3+ and Zn2+ at dual channels in living cells and zebrafish†
Shuai
Gong
a,
Yan
Zhang
a,
Ahui
Qin
a,
Mingxin
Li
a,
Yu
Gao
a,
Chenglong
Zhang
a,
Jie
Song
b,
Xu
Xu
 a,
Zhonglong
Wang
*a and
Shifa
Wang
 *a
*a
aCo-Innovation Center of Efficient Processing and Utilization of Forest Resources, International Innovation Center for Forest Chemicals and Materials, College of Chemical Engineering, Nanjing Forestry University, Nanjing, 210037, China. E-mail: wangshifa65@163.com; wang_zhonglong@njfu.edu.cn; Fax: +86-25-8548369; Tel: +86-25-85428369
bDepartment of Natural Sciences, University of Michigan-Flint, 303 E. Kearsley Street, Flint, MI 48502, USA
First published on 11th November 2021
Abstract
A novel dual-functional probe N′-(2-hydroxy-5-((4,7,7-trimethyl-3-oxobicyclo[2.2.1] heptan-2-ylidene)methyl) benzylidene)picolinohydrazide (PSH) was constructed from natural camphor. This probe showed strong yellow-green fluorescence at 535 nm due to its aggregation-induced emission (AIE) feature. Interestingly, the probe PSH displayed a significant turn-on fluorescence response towards Al3+ (green fluorescence at 500 nm) and Zn2+ (orange fluorescence at 555 nm) at two different emissive channels. The detection limits of PSH towards Al3+ and Zn2+ were found to be 12.1 nM and 14.2 nM, respectively. PSH exhibited excellent selectivity and anti-interference performance and could distinguish between Al3+/Zn2+ and identify whether Zn2+ exists in the PSH-Al3+ complex by adding ATP. The binding mechanisms between PSH and Al3+/Zn2+ ions were supported by 1H NMR, HRMS analysis, and density functional theory (DFT) calculations. Based on its outstanding sensing properties, the probe PSH was used to establish molecular logic function gates. Moreover, the probe PSH could be applied to detect Al3+ and Zn2+ in real environmental water, and fluorescence detection was well demonstrated by test strips. Furthermore, the probe PSH was employed for imaging Al3+ and Zn2+ in HeLa cells and zebrafish.
Introduction
Metal ions have a great impact on human life, which causes biological denaturation by coordinating with bioactive molecules.1–3 For example, zinc ions are not only an essential trace element for the human body but also for all living organisms. They play a key role in regulating cell apoptosis, nucleic acid and protein metabolism, neural signal transmission, the immune system, and many other molecular mechanisms. However, the metabolic disorder of zinc ions is related to neurodegenerative diseases such as Alzheimer's disease, Parkinson's disease, epilepsy,4–7etc. Aluminum is the most abundant metal element in the Earth's crust, and it is also an essential element for the human body.8–10 Aluminum is widely present in our lives, so we don't have to worry about insufficient intake, but excessive intake can cause some diseases such as Alzheimer's disease, Parkinson's disease, osteoporosis, nervous system problems, etc.11–13 Therefore, it is very important to design and develop a biosensor that can effectively detect Zn2+ and Al3+ in biological systems and environments.Nowadays, several methods such as electrochemical analysis, atomic absorption spectroscopy, isotope chromatography, and chromatography have been reported for trace metal element detection.14–17 However, these traditional detection methods have issues such as complex pretreatment, expensive equipment, cumbersome operation, and time-consuming detection, which make them unsuitable for real-time detection of on-site samples.18–20 Compared with traditional detection methods, fluorescent probe detection technology has the advantages of simple sample preparation, fast response, high sensitivity, good selectivity, and easy operation.21–23 It has been widely used in chemistry, medicine, environmental science, life science, and other fields. Especially in recent years, the fluorescent probe has seen gradual development in high efficiency and trace, microscopic, and real-time analysis.
Aggregation-induced emission (AIE), a special photophysical phenomenon, was first reported by Tang and co-workers.24 AIE is characterized by molecules in a dilute solution that have no fluorescence, but their fluorescence would be enhanced in an aggregated state. AIE luminogens have the advantage of superior biological imaging and excellent photo-stability compared with aggregation-caused quenching (ACQ).25,26 Therefore, it is of great significance to construct fluorescent probes with AIE properties.
In recent years, a great number of organic small-molecule fluorescent probes for detecting metal ions have been developed. However, some of these fluorescent probes had poor water solubility and limits to their applicability.27,28 Although many of the reported probes have high selectivity for a single analyte, differential response probes that can detect multiple analytes would be more effective and are needed for practical applications. Compared to one-to-one type probes, one probe for multiple analyses is more advantageous in regards to efficiency, simplicity, time consumption, and cost, which has attracted more attention for metal ion detection.29–33 Hence, it was important to develop fluorescent probes with high water solubility and simultaneous detection of multiple targets.
Camphor, traditionally acquired through the distillation of the wood of Lauraceae trees, is an important and renewable source of natural terpenoids, and can also be chemically synthesized mainly with turpentine as a raw material. Camphor plays a crucial medicinal role with insecticidal, antimicrobial, antiviral, anticancer and antitussive activities.34–37 Furthermore, the rigid structure of the camphor molecule could effectively reduce the energy consumption during a molecular collision, which provides camphor with good photophysical properties.38–40 Therefore, based on the physical properties and medicinal value of camphor, it was very meaningful to synthesize fluorescent probes from camphor.
Herein, we present a novel camphor-derived fluorescent turn-on probe PSH with AIE properties for the dual detection of Al3+/Zn2+. The probe PSH contains imino, carbonyl, and phenolic hydroxyl groups and can provide multiple sites for binding with Al3+ and Zn2+. This probe PSH shows excellent sensitivity and selectivity and a low detection limit toward Al3+ and Zn2+. After binding with Al3+, the PSH-Al3+ complex was responsive to ATP and released the probe free. The complexation mechanism of PSH towards Zn2+/Al3+ was confirmed by 1H NMR, HRMS analysis, and density functional theory (DFT) calculations. Based on its outstanding sensing properties, the probe PSH was used to establish molecular logic function gates. Moreover, the probe PSH could be applied to detect Al3+ and Zn2+ in real environmental water, and fluorescence detection was well demonstrated by test strips. Furthermore, the probe PSH was used to detect Al3+ and Zn2+ in HeLa cells and zebrafish by bioimaging.
Results and discussion
AIE performance of PSH
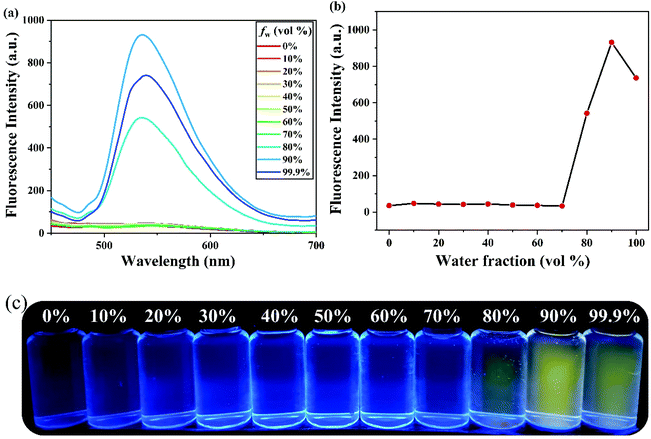
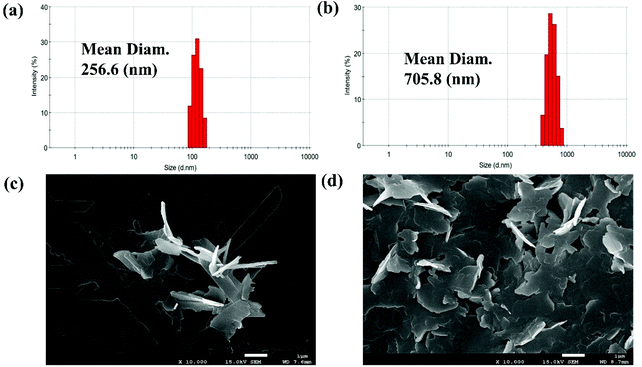
The fluorescence feature of PSH was evaluated in the state of solid powder that showed strong yellow fluorescence at 535 nm (Fig. S1†). Moreover, to investigate the AIE properties of PSH, acetonitrile was used as a decent solvent system while water was used as a poor solvent system. As shown in Fig. 1(a and b), the PSH showed a very weak fluorescence intensity in the decent solvent system(fw = 0 vol%); however, a strong fluorescence emission intensity was observed in the poor solvent system (fw = 99.9 vol%). As presented in Fig. 1c, the fluorescence color change of the probe in different water contents was obtained under a 365 nm UV light. It was observed that the yellow fluorescence gradually enhances with a water content of more than 80% and reached maximum fluorescence intensity at 90% water content, which indicated the formation of an aggregated status in a poor solvent system and that the probe PSH has good AIE performance. Moreover, the fluorescence quantum yields of PSH in the solution system (ACN/water = 3/7) and solution system (ACN/water = 1/9) were calculated as 0.58% and 15.18%, respectively, which also proved the emission enhancement effect. Therefore, PSH as the AIE fluorescent material has a potential application prospect in fluorescence detection.The AIE properties of probe PSH was also confirmed by dynamic light scattering (DLS) and scanning electron microscopy (SEM) studies. As shown in Fig. 2a, the average size of probe PSH was 256.6 nm in the 70% water volume fraction solutions. As expected, the average size of probe PSH was 705.8 nm in the 90% water volume fraction solutions, which is significantly higher than the former and confirms that molecular aggregation has occurred (Fig. 2b). In addition, scanning electron microscopy (SEM) analysis visually reveals that the probe PSH forms larger aggregated nanoparticles in a solution with a higher water content.
Spectroscopic responses of PSH towards Al3+ and Zn2+
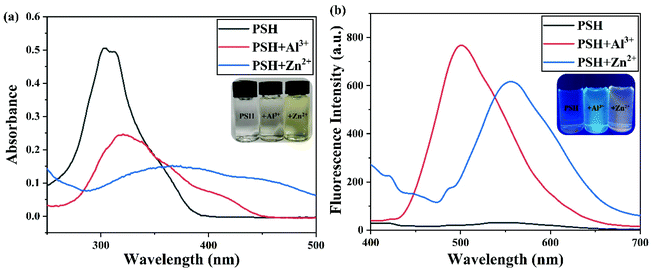
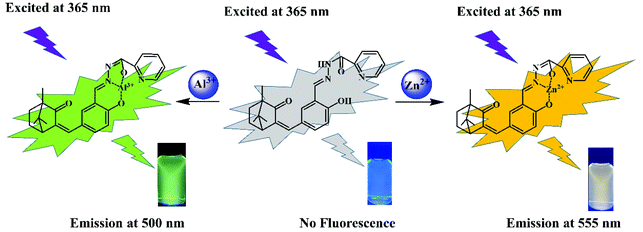
The probe PSH, which has multiple oxygen and nitrogen sites, should be able to coordinate with metal ions. The spectroscopic responses of the probe PSH to Al3+/Zn2+ are shown in Fig. 3. In the UV-vis absorption spectra (Fig. 3a), the probe PSH emerged with a strong absorption peak at 302 nm. After the addition of Al3+/Zn2+ to the PSH solutions, the initial maximum absorption peak was bathochromic-shifted to 321 nm/375 nm, respectively, and the color of the solutions changed from colorless to faint yellow to the naked eye. Moreover, as shown in Fig. 3b, the probe PSH showed a faint emission at about 550 nm (λex = 365 nm) in the fluorescence spectra. Interestingly, after adding Al3+ or Zn2+, a remarkable “turn on” fluorescence enhancement with the two different wavelength responses (500 nm and 555 nm) was observed and accompanied with the fluorescent color exclusively changing from colorless to green and yellow respectively. When the probe was coordinated with Al3+ and Zn2+, the intramolecular charge density was transferred, which led to fluorescence emission changes. Based on the above fact and owing to different charge densities and radii between Al3+ and Zn2+, the Al3+/Zn2+-complexes exhibited a different charge density transfer thereby emitting two different emission wavelengths. As shown in Fig. S11,† we found that there was a greater enhancement of fluorescence intensity in the ACN/HEPES buffer (3/7, v/v) solution than in other ACN/HEPES buffer solvent mixtures, indicating that the ACN/HEPES buffer (3/7, v/v) solution is more suitable to investigate the recognition behavior of probe PSH towards Al3+ and Zn2+. Moreover, the fluorescence quantum yield of PSH increased from 0.58% to 12.87% and 10.37% in the presence of Al3+ and Zn2+, respectively. Therefore, after the addition of Al3+ or Zn2+, the PSH fluorescence enhancement phenomenon may be explained by the stable complexes formed between PSH and Al3+/Zn2+, leading to the chelation-enhanced fluorescence (CHEF) effect by a PSH complexation with metal ions.41,42 Besides, the fluorescence emission enhancement of PSH is because the –CH![[double bond, length as m-dash]](https://www.rsc.org/images/entities/char_e001.gif) N– isomerization and PET process can be restrained.43,44
N– isomerization and PET process can be restrained.43,44
Sensitivity of PSH for Zn2+ and Al3+
To assess the sensitivity of probe PSH toward Al3+/Zn2+, the fluorescence titration of PSH was investigated for each ion, respectively. The fluorescence spectra emission peak at 500 nm showed a 25-fold enhancement for emission peak intensity with the continued addition of Al3+ (0–15 μM) to the PSH solution (Fig. 4a). As shown in Fig. 4b, a similar phenomenon was observed with the addition of Zn2+ (0–15 μM), where the emission peak at 555 nm was accompanied by a 20-fold enhancement of the emission intensity. Two good linear relationships of probe PSH toward Al3+ (R2 = 0.995) or Zn2+ (R2 = 0.992) between the fluorescence intensity and the ion concentrations (0–14 μM or 0–12 μM) were formed (Fig. 5). The limit of detection (LOD) was calculated to be 12.1 nM for Al3+ and 14.2 nM for Zn2+ based on the formula 3σ/m where σ is the standard deviation of the control sample and m is the slope of the linearity of the equation. The results prove that PSH could effectively distinguish between Al3+ and Zn2+ with superior sensitivity.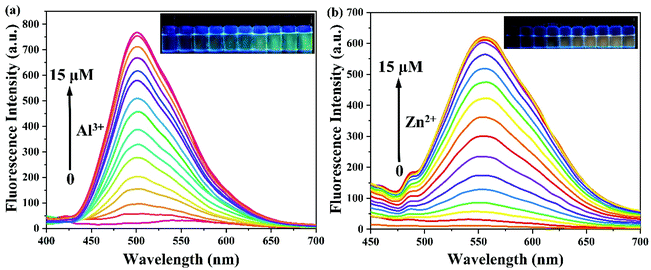 | ||
| Fig. 4 The fluorescence spectra of (a) 0–15 μM Al3+ and (b) 0–15 μM Zn2+ added to 10 μM PSH in ACN/HEPES buffer (v/v, 3/7, 10 mM, pH = 7.4). λex = 365 nm. | ||
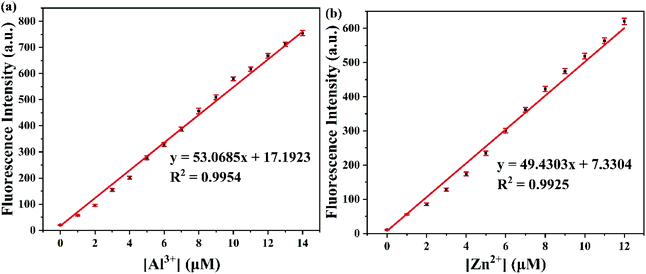 | ||
| Fig. 5 The linear curve of the emission intensity of PSH with Al3+ (a) and Zn2+ (b) concentrations (0–14 μM or 0–12 μM) in ACN/HEPES buffer (v/v, 3/7, 10 mM, pH = 7.4). | ||
Selectivity and interference of PSH for Zn2+ and Al3+
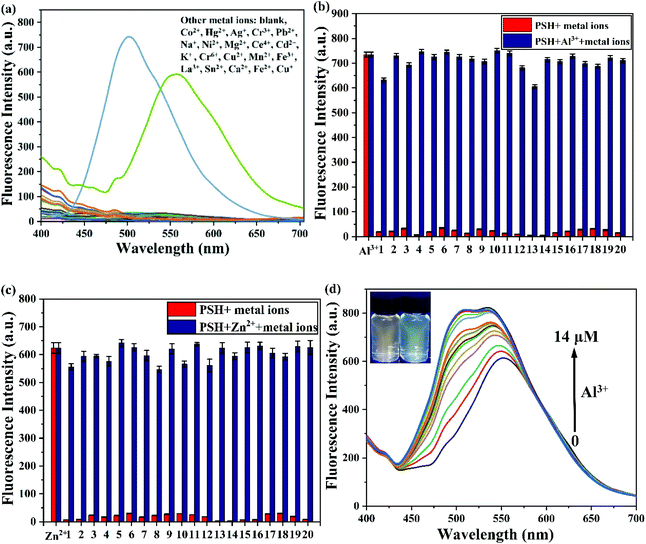
The selectivity of PSH toward Al3+/Zn2+ was measured by fluorescence. PSH was treated with various metal ions (Co2+, Hg2+, Ag+, Cr3+, Pb2+, Na+, Ni2+, Mg2+, Ce4+, Cd2+, K+, Cr6+, Cu2+, Mn2+, Fe3+, La3+, Sn2+, Ca2+, Fe2+, Cu+, Al3+ and Zn2+). As depicted in Fig. 6a, the probe PSH was non-fluorescent in the fluorescence spectra. Upon the addition of Al3+ and Zn2+, the fluorescence spectra signal intensity increased dramatically (500 nm and 555 nm, respectively). After adding various other metal ions, the fluorescence spectra did not show significant changes.To further evaluate the PSH anti-interference ability for Al3+/Zn2+, the specificity experiment was tested and replicated 5 times with other competing metal ions. As displayed in Fig. 6b and c, after the addition of the other metal ions into the PSH-Al3+ and PSH-Zn2+ solutions, respectively, there was negligible change in the fluorescence spectra. Interestingly, after gradually adding Al3+ to the PSH-Zn2+ solution, the fluorescence emission peak shifted from 555 nm to 500 nm and was accompanied by a fluorescence color transformation from orange to green (Fig. 6d), which could indicate that the PSH had better selectivity for Al3+ than Zn2+. This phenomenon could be attributed to a ligand-to-ligand transfer13 and that the PSH-Al3+ complex is more stable than the PSH-Zn2+ complex. The above results suggest that the probe PSH can selectively detect Al3+/Zn2+ over other metal ions and specifically identify Al3+/Zn2+ in the presence of other competing metal ions.
Furthermore, identifying whether Zn2+ exists in the PSH-Al3+ solution is also very important. Given the chelation of Al3+ for ATP,45 as shown in Fig. 7, when Zn2+ and Al3+ exist in the PSH solution at the same time, the addition of ATP will lead to the production of an Al3+−ATP complex, releasing free the probe PSH and allowing it to chelate with Zn2+, which is accompanied by a significant enhancement of the fluorescence emission intensity at 555 nm. Upon the addition of ATP into the PSH and PSH-Zn2+ solution, there was no change in the fluorescence spectrum. The above results indicate that the Al3+−ATP complex is more stable than the Al3+−PSH complex and that the PSH can selectively detect Al3+ and Zn2+.
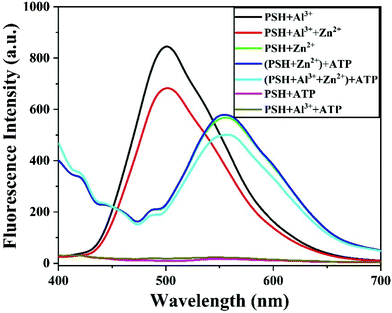 | ||
| Fig. 7 Fluorescence emission spectra of PSH + Al3+, PSH + Al3+ + Zn2+, PSH + Zn2+, and the addition of ATP in ACN/HEPES buffer (v/v, 3/7, 10 mM, pH = 7.4). | ||
Response time and pH effect
The time-dependent response of probe PSH toward the Al3+ and Zn2+ experiment was further investigated. The fluorescence emission intensity of PSH at 500 nm heightened quickly and reached its highest intensity within 10 min after adding Al3+ to the solution (Fig. 8a). Similarly, the response time of PSH to Zn2+ reached an equilibrium value within 13 min.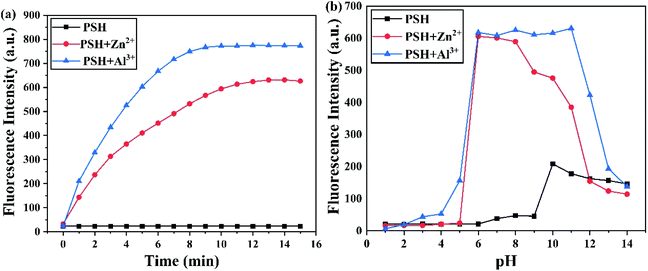 | ||
| Fig. 8 Fluorescence intensity changes at 500 nm and 555 nm for PSH (10 μM) at (a) different times and (b) different pH values with or without Al3+ and Zn2+. | ||
To explore the potential practical application of PSH, the change in the fluorescence spectra was recorded in different ranges of pH. As illustrated in Fig. 8b, compared with the probe PSH in a pH of 7.4, its fluorescence intensity showed little change in the pH range of 1.0–9.0, which verified that the PSH was stable in this pH range. Under strong alkaline conditions, the fluorescence enhancement phenomenon of PSH can be attributed to the deprotonation of –OH and –NH groups, leading to the PET effect being inhibited. As the blue line shows, after the addition of Al3+, the fluorescence intensity increased at pH 2.0 and reached its maximum at pH 6.0, and the most suitable condition for detection was found in the pH range from 6.0 to 12.0. Similarly, after adding the Zn2+ to the PSH solution, the fluorescence intensity showed its best enhancement in the pH range of 6.0–10.0. Therefore, the results show that the probe PSH has the capability of detecting Al3+ and Zn2+ in a wide pH range and is also suitable for the physiological pH range. When the pH value was greater than 10.0, the binding of Al3+/Zn2+ to hydroxide ions reduced the coordination of Al3+/Zn2+ with the probe; therefore, the fluorescence intensity of the PSH-Al3+/Zn2+ complexes decreased sharply. In summary, PSH can detect Al3+ and Zn2+ in real-time and is conducive to biological application detection.
Sensing mechanism of PSH for Al3+ and Zn2+
To clarify the reaction mechanism, the stoichiometric ratio of probe PSH toward Al3+ and Zn2+ was confirmed first by Job's plot studies. As presented in Fig. S2,† the inflection point occurred when the concentration of Al3+/Zn2+ accounts for 50% of the PSH + Al3+/Zn2+ total concentration, which indicated that the complex-ratios were 1![[thin space (1/6-em)]](https://www.rsc.org/images/entities/char_2009.gif) :
:![[thin space (1/6-em)]](https://www.rsc.org/images/entities/char_2009.gif) 1. The complex ratios were also definitively proven by HRMS analysis (Fig. S3†) and the HRMS of PSH-Al3+ shows peaks at 405.26 and 430.46 corresponding to [PSH+ 2H+]+ and [PSH+ Al3+]+ respectively. In the HRMS of PSH-Zn2+, the peaks at 436.68 and 468.11 were attributed to [PSH+ MeOH + H+]+ and [PSH+ Zn2+]+ respectively. In addition, according to the Benesi–Hildebrand equation, the binding constants of PSH toward Al3+ and Zn2+ were figured to be 3.77 × 10⁴ M−1 and 6.58 × 10⁴ M−1 respectively (Fig. S4†).46
1. The complex ratios were also definitively proven by HRMS analysis (Fig. S3†) and the HRMS of PSH-Al3+ shows peaks at 405.26 and 430.46 corresponding to [PSH+ 2H+]+ and [PSH+ Al3+]+ respectively. In the HRMS of PSH-Zn2+, the peaks at 436.68 and 468.11 were attributed to [PSH+ MeOH + H+]+ and [PSH+ Zn2+]+ respectively. In addition, according to the Benesi–Hildebrand equation, the binding constants of PSH toward Al3+ and Zn2+ were figured to be 3.77 × 10⁴ M−1 and 6.58 × 10⁴ M−1 respectively (Fig. S4†).46
The 1H NMR titration experiment was performed in DMSO-d6 to further investigate the sensing mechanism. As shown in Fig. 9, the 1H NMR spectra of probe PSH showed a proton peak at 12.56, 11.75, and 8.89 ppm, which corresponded to –NH, –OH, and HC![[double bond, length as m-dash]](https://www.rsc.org/images/entities/char_e001.gif) N respectively. After adding Al3+ or Zn2+, both –NH and –OH peaks at 12.56 and 11.75 ppm disappeared, which indicates that the binding sites of Al3+/Zn2+ to PSH are on the carbonyl and the phenolic hydroxyl groups. Furthermore, the signal of HC
N respectively. After adding Al3+ or Zn2+, both –NH and –OH peaks at 12.56 and 11.75 ppm disappeared, which indicates that the binding sites of Al3+/Zn2+ to PSH are on the carbonyl and the phenolic hydroxyl groups. Furthermore, the signal of HC![[double bond, length as m-dash]](https://www.rsc.org/images/entities/char_e001.gif) N at 8.89 ppm shifted. The analysis shows that the Al3+ and Zn2+ coordinate with phenolic hydroxyl, imine, and carbonyl. The above results verified the previous hypothesis that the C
N at 8.89 ppm shifted. The analysis shows that the Al3+ and Zn2+ coordinate with phenolic hydroxyl, imine, and carbonyl. The above results verified the previous hypothesis that the C![[double bond, length as m-dash]](https://www.rsc.org/images/entities/char_e001.gif) N in the PSH molecule inhibits the emission of fluorescence by isomerization. Otherwise, once Al3+/Zn2+ is complexed with the PSH, the C
N in the PSH molecule inhibits the emission of fluorescence by isomerization. Otherwise, once Al3+/Zn2+ is complexed with the PSH, the C![[double bond, length as m-dash]](https://www.rsc.org/images/entities/char_e001.gif) N structure is destroyed and the isomerization is restrained, which is why the fluorescence increases significantly.
N structure is destroyed and the isomerization is restrained, which is why the fluorescence increases significantly.
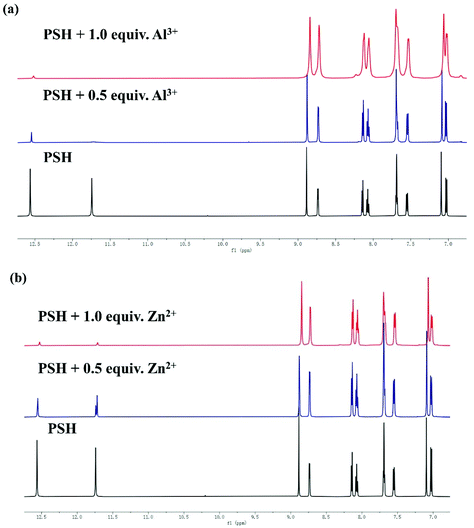 | ||
| Fig. 9 Partial 1H NMR spectra of PSH with or without 1 equiv. (a) Al3+ and (b) Zn2+ in DMSO-d6, respectively. | ||
To further explore the reaction mechanism of probe PSH toward Al3+/Zn2+, the density functional theory (DFT) computation was conducted by using the Gaussian 09 program with rb3lyp/6-311g (d,p) basis. The optimized structures of probe PSH, PSH-Al3+ and PSH-Zn2+ are presented in Fig. 10. For PSH-Al3+/Zn2+, Al3+/Zn2+ chelates with the phenolic hydroxyl, imine, and carboxide of the PSH. After the completion of structural optimization, the distance of the Al3+ from the phenolic hydroxyl, imine, and carbonyl was 1.721, 1.842, and 1.718 Å, and that of Zn2+ was 1.843, 2.021, and 1.905 Å, respectively, which were in line with the coordination bond distance range.47,48 These results indicate that the PSH-Al3+/Zn2+ forms a stable complex and verifies that the complex-ratios are 1![[thin space (1/6-em)]](https://www.rsc.org/images/entities/char_2009.gif) :
:![[thin space (1/6-em)]](https://www.rsc.org/images/entities/char_2009.gif) 1.
1.
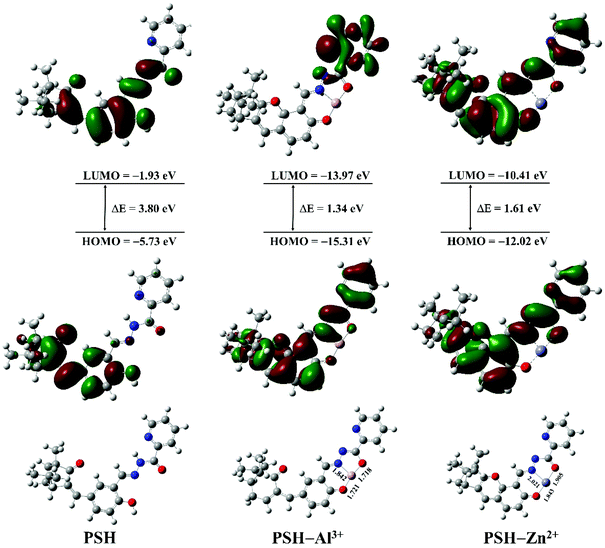 | ||
| Fig. 10 The frontier molecular orbitals and optimized geometry configurations of PSH, PSH-Al3+, and PSH-Zn2+ complexes. | ||
The highest occupied molecular orbitals (HOMO) and the lowest occupied molecular orbitals (LUMO) of PSH-Al3+/Zn2+ are also shown in Fig. 10. When the probe PSH is in a free state, in the transition of the HOMO to LUMO process, the free electrons on the detection group (donor) can be transferred to the HOMO of the excited fluorophore (acceptor) through the PET effect, which leads to fluorescence quenching. After Al3+/Zn2+ complex with the detection group of PSH, it causes the HOMO orbital energy level of the detection group to drop below the HOMO energy level of the excited state fluorophore (decreases from −5.73 eV to −15.31/−12.02 eV, respectively). The HOMO orbital energy level of the detection group (donor) is reduced, and the electrons cannot pass to the HOMO of the fluorophore (acceptor), so the probe will fluoresce, which is consistent with the previously reported PET mechanism of metal complexation. Furthermore, the HOMO–LUMO energy gap (ΔE) of PSH (3.80 eV) is higher than that of PSH-Al3+ (1.34 eV) and PSH-Zn2+ (1.61 eV), which also verifies that the complexation of PSH with Al3+/Zn2+ is more likely to occur, causing a dramatic enhancement of fluorescence intensity. According to Job's plot, HRMS analysis, the 1H NMR titration experiment, and DFT computation, the sensing mechanism of PSH with Al3+ or Zn2+ is presented in Fig. 11.
Molecular logic gate behavior of PSH
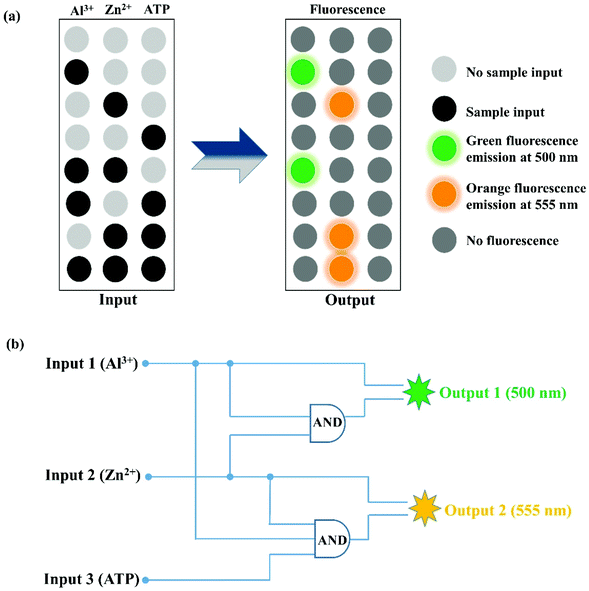
In recent years, due to the good practicability of molecular logic gates, the exploration of its development has gradually increased. The characteristics of PSH toward Al3+, Zn2+, and ATP showed that it can be applied to IMPLICATION logic gate applications, in which the Al3+ (input 1), Zn2+ (input 2), and ATP (input 3) are used as three chemical inputs and the fluorescence emission signal at 500 nm (output 1) and 555 nm (output 2) served as two outputs (Fig. 12 and Table 1). Meanwhile, the presence and absence of the chemical input were assigned “1” and “0”, respectively. In the above logic gates, when the fluorescence emission intensity is enhanced at 500 nm (output 1) or 555 nm (output 2) it is defined as “1” (on), otherwise it is defined as “0” (off). In the “Output 1 (500 nm)” logic gates, when the “Al3+” and “Al3+ + Zn2+” are present, the “Output 1” signal is “1” (500 nm fluorescence emission “turn-on”). In the “Output 2 (555 nm)” logic gates, either of the inputs “Zn2+”, “Zn2+ + ATP” and “Zn2+ + Al3+ + ATP” is defined with “1” (555 nm fluorescence emission “turn-on”), and all of the other “Input” combinations are defined as “0” (no fluorescence). The study of logic gates shows that the single fluorescent probe PSH has potential application prospects in molecular devices.| Input 1 (Al3+) | Input 2 (Zn2+) | Input 3 (ATP) | Output 1500 nm | Output 2555 nm |
|---|---|---|---|---|
| 0 | 0 | 0 | 0 | 0 |
| 1 | 0 | 0 | 1 | 0 |
| 0 | 1 | 0 | 0 | 1 |
| 0 | 0 | 1 | 0 | 0 |
| 1 | 1 | 0 | 1 | 0 |
| 1 | 0 | 1 | 0 | 0 |
| 0 | 1 | 1 | 0 | 1 |
| 1 | 1 | 1 | 0 | 1 |
Applications in real water and test strips
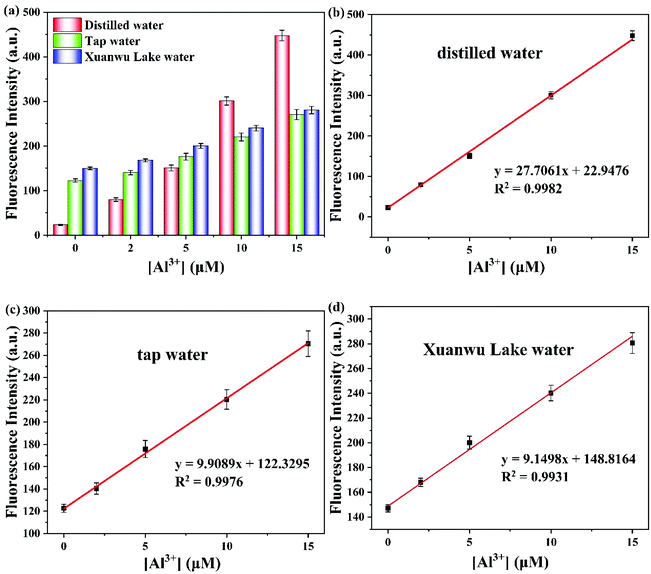
To further evaluate the applicability of the probe PSH toward Al3+/Zn2+, the specific recognition of probe PSH to Al3+/Zn2+ was evaluated in distilled water, tap water, and Xuanwu Lake water. As we all know, Al3+ and Zn2+ widely exist in daily life and have a great impact on human health. The fluorescence intensity of the PSH was enhanced after adding different concentrations of Al3+ (0, 2, 5, 10, 15μM) into the ACN/water samples (v/v = 3/7) solution system (Fig. 13). As shown in Table 2, the recovery of different concentrations of Al3+ (5, 10, 15 μM) was measured in three different kinds of water. From these results, the probe PSH could detect the Al3+ concentration in the three water samples with good recovery ranging from 92.2% to 102.2%, from 92.5% to 108.6%, and from 96.6% to 113.8%, respectively. The probe PSH toward Zn2+ is also presented in Fig. S5 and Table S1,† which also suggests that PSH had a good recovery percentage for Zn2+. Therefore, the probe PSH could be used to detect Al3+ with high sensitivity and good recovery in environmental water samples.| Water sample | Added Al3+ (μM) | Found Al3+ (μM) | Recovery (%) |
|---|---|---|---|
| Distilled water | 0 | Not detected | — |
| 2 | 2.04 ± 0.04 | 102.0 | |
| 5 | 4.61 ± 0.19 | 92.2 | |
| 10 | 10.03 ± 0.29 | 100.3 | |
| 15 | 15.33 ± 0.37 | 102.2 | |
| Tap water | 0 | 0.06 ± 0.05 | 0.0 |
| 2 | 1.85 ± 0.43 | 92.5 | |
| 5 | 5.43 ± 0.55 | 108.6 | |
| 10 | 9.93 ± 0.63 | 99.3 | |
| 15 | 14.97 ± 0.82 | 99.8 | |
| Xuanwu Lake water | 0 | 0.22 ± 0.12 | 0.0 |
| 2 | 2.18 ± 0.23 | 109.0 | |
| 5 | 5.69 ± 0.45 | 113.8 | |
| 10 | 10.07 ± 0.54 | 100.7 | |
| 15 | 14.49 ± 0.71 | 96.6 |
The test strip experiment was performed to further investigate its practical application. First, the test paper strips were immersed in an ethanol solution containing probe PSH (50 μM) and dried at room temperature, which showed a faint yellow color. Then the probe PSH-loaded test strips were exposed to different concentrations of Al3+ or Zn2+ (0, 20, 50, 80, 100, 120, 150, 200 μM); the results are shown in Fig. 14. It was observed that the color of the test strips changed from faint yellow to green or golden yellow and gradually enhanced as the Al3+/Zn2+ concentration increased under a 365 nm UV lamp. Hence, the probe PSH could be applied to the convenient and fast detection of Al3+/Zn2+.
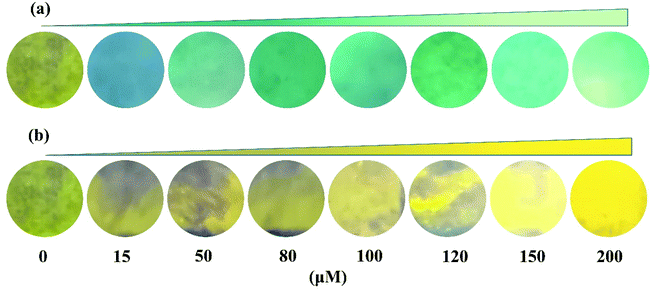 | ||
| Fig. 14 Photographs of test strips containing probe PSH with increasing concentrations of (a) Al3+ and (b) Zn2+ (0–200 μM). | ||
Bioimaging in HeLa cells and zebrafish
Inspired by the abovementioned responsive performance of probe PSH for Al3+/Zn2+, HeLa cell and zebrafish imaging experiments were performed to investigate the biological application. The MTT assay was first conducted to estimate the cytotoxicity of PSH for HeLa cells. As displayed in Fig. S6,† the HeLa cell viability exceeded 90% after incubation with 0–30 μM probe PSH at 37 °C for 24 h, which confirmed that the probe PSH has weak cytotoxicity and provides the possibility of bioimaging detection of Al3+/Zn2+ in HeLa cells. Fig. 15 shows the HeLa cell confocal fluorescence images (λex = 405 nm, collected fluorescence wavelength: 480–580 nm) of PSH and PSH that was treated with Al3+/Zn2+. In the HeLa cells where only the probe PSH (10 μM) was added, there was almost no fluorescence intensity (Fig. S7†). After adding different concentrations of Al3+/Zn2+(10, 20, 30 μM) into the PSH-loaded cells and incubating for 1 h, it exhibited a gradient-enhanced fluorescence change in the green or orange channel, which suggests that the probe PSH has good biocompatibility and can detect Al3+/Zn2+ in cells with high sensitivity. The 3D surface plot and Fig. S7† vividly and intuitively show the change of fluorescence intensity in HeLa cells.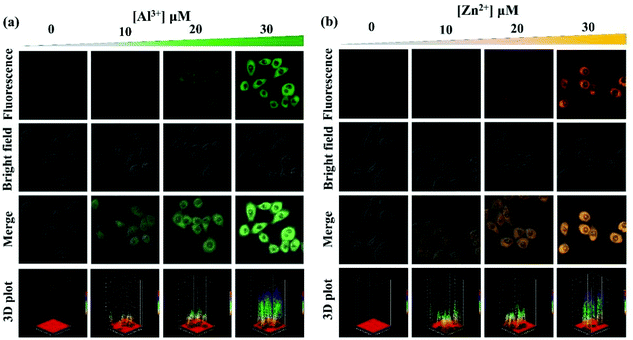 | ||
| Fig. 15 Fluorescence microscopy images and 3D surface plot of HeLa cells incubated with PSH for 2 h and then cultured with different concentrations of (a) Al3+ and (b) Zn2+ for 0.5 h. | ||
To further investigate the biological application of probe PSH, zebrafish, classic laboratory model organisms, were selected as the research objects to verify the feasibility of the probe to detect Al3+/Zn2+ in biological tissues. The two-day-old zebrafish were fed in the embryo medium and then the PSH (10 μM) was added for 20 min to ensure that the zebrafish absorbed the probe into their tissues and organs. As presented in Fig. 16, the control group that only contained PSH had almost no fluorescence emission intensity (λex = 405 nm). Upon the addition of Al3+ or Zn2+ (20 μM) in the PSH-loaded embryo medium for 10 min and rinsed twice with pure water, the abdomen of zebrafish showed strong green or orange fluorescence (Fig. 16b and c), which indicates that the PSH can detect Al3+ or Zn2+ in zebrafish. The above results suggest that the PSH has good tissue penetration and can be applied to visually detect Al3+ or Zn2+ in HeLa cells and zebrafish.
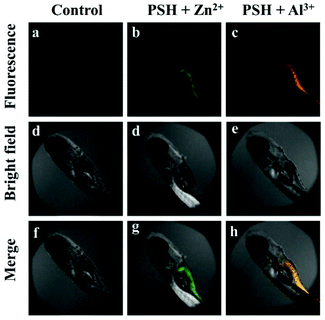 | ||
| Fig. 16 Fluorescence microscopy images of zebrafish: (a, d and f) incubated with PSH for 1 h; incubated with PSH for 1 h and then incubation with (b, d and g) Zn2+ and (c, e and h) Al3+ for 0.5 h. | ||
Experimental
Materials and instruments
The chemicals and biological reagents were purchased from Shanghai Haohong Scientific Co., Ltd, Titan, and Sigma-Aldrich without purification. 1H NMR and 13C NMR spectra were recorded in DMSO-d6 solutions with a Bruker AV 500 Spectrometer. The UV-vis absorption spectra were recorded on a Shimadzu UV-2450 spectrophotometer. The fluorescence spectrum was recorded using a PerkinElmer LS55 spectrophotometer. High-resolution mass spectra (HRMS) were recorded using an Agilent 5975c mass spectrometer. Fluorescence images were captured using a confocal laser scanning microscope (Zeiss LSM 710, Germany).Synthesis of compound PSH
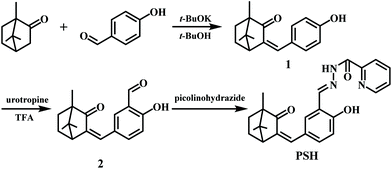
Compound PSH was synthesized as shown in Scheme 1. The intermediates 1 and 2 were prepared according to the literature.39 Compound 2 (0.284 g, 1 mmol), picolinohydrazide (0.137 g, 1 mmol), glacial acetic acid (0.12 g, 2 mmol), and ethanol (10 mL) were stirred and refluxed in a three-necked flask for 12 h until the conversion ratio of compound 1 exceeded 95% (monitored by TLC). After ending the reaction, the reaction mixture was evaporated under vacuum to remove excess solvents. The residue was extracted three times with 200 mL ethyl acetate and washed with saturated brine until neutral. The organic layer was dried with anhydrous sodium sulfate, filtered and concentrated to obtain a crude product which was purified by recrystallization in absolute ethanol to afford the white solid product PSH, yield 75%. 1H NMR (600 MHz, DMSO-d6) δ: 12.56 (s, 1H), 11.75 (s, 1H), 8.89 (s, 1H), 8.73 (d, J = 4.7 Hz, 1H), 8.14 (d, J = 7.8 Hz, 1H), 8.10–8.04 (m, 1H), 7.68 (q, J = 5.1 Hz, 2H), 7.55 (dd, J = 8.6, 2.2 Hz, 1H), 7.09 (s, 1H), 7.03 (d, J = 8.5 Hz, 1H), 3.14 (d, J = 4.1 Hz, 1H), 2.16 (tt, J = 11.7, 9.2, 4.5 Hz, 1H), 1.78 (ddd, J = 13.5, 11.2, 3.7 Hz, 1H), 1.48 (ddd, J = 12.4, 9.1, 3.7 Hz, 1H), 1.37 (ddd, J = 13.6, 9.1, 4.7 Hz, 1H), 0.97 (s, 3H), 0.92 (s, 3H), 0.73 (s, 3H). 13C NMR (150 MHz, DMSO-d6) δ: 207.11, 160.94, 158.76, 150.00, 149.55, 149.09, 140.50, 138.53, 132.98, 132.29, 127.68, 126.94, 126.54, 123.31, 119.46, 117.65, 56.80, 48.97, 46.79, 40.53, 30.65, 26.03, 20.64, 18.46, 9.76. HRMS (m/z): [M + H]+ calcd for C24H25N3O3 + H+, 404.1977; found, 404.1974.Spectral measurements
The probe PSH was dissolved in acetonitrile to obtain its stock solution (1 mM). The stock solutions (10 mM) of various metal ions (Co2+, Hg2+, Ag+, Cr3+, Pb2+, Na+, Ni2+, Mg2+, Ce4+, Cd2+, K+, Cr6+, Cu2+, Mn2+, Fe3+, La3+, Sn2+, Ca2+, Fe2+, Cu+, Al3+ and Zn2+) were prepared in deionized water. The absorption and fluorescence spectral data were measured in ACN/HEPES buffer (v/v, 3/7, 10 mM, pH = 7.4). The fluorescence spectral data were obtained at an excitation of 365 nm and the slit widths were set at 10 nm and 5 nm.DFT calculations
Geometry optimization of PSH, [PSH-Al3+], and [BDNOL-Zn2+] was performed by the opt rb3lyp/6-311g (d,p) method using Gaussian 09 software.49Detection Al3+/Zn2+ in real water samples
Distilled water, tap water, and Xuanwu Lake water were used as the water samples without purification after standing for 10 h. The probe PSH (10 μM) was added to the ACN/water samples (v/v = 3/7) and then different concentrations of Al3+ and Zn2+ (0–15 μM) were added.Detection of Al3+/Zn2+ on filter paper
The filter paper strips were first immersed in the solution of probe PSH (50 μM). After that, the test strips were taken out and dried in air and the treated strips were put into solutions of different concentrations of Al3+ or Zn2+ (0, 20, 50, 80, 100, 120, 150, 200 μM).Cytotoxicity assay
The cytotoxicity of PSH to HeLa cells was obtained by the standard MTT method. HeLa cells were cultured in 96-well plates containing DMEM complete medium (containing 10% fetal bovine serum and 1% penicillin–streptomycin) under an environment of 37 °C and 5% carbon dioxide. After 24 h, different concentrations of compound PSH (0, 10, 20, 30 μM) were added to the 96-well plates and incubated for 24 h. The cells in each well were then treated with MTT solution (10 μL). Then the solutions in the well plates was taken out and 150 mL DMSO was added to each well. The OD value of each well was recorded with a microplate reader at a wavelength of 540 nm.Cellular imaging
The probe PSH was dissolved in DMSO, and diluted with DMEM to obtain a final concentration of 10 μM. The HeLa cells were cultured in a 12-well plate containing 10 μM PSH. After 2 h, the HeLa cells were washed with PBS to wipe off the PSH on the cells’ surface, and then HeLa cells were incubated with Al3+ and Zn2+ (0, 10, 20, 30 μM) for 0.5 h. The treated cells were washed with PBS three times. The fluorescence imaging photos were acquired using a confocal laser scanning microscope (ZEISS LSM 710).Bioimaging in zebrafish
Zebrafish experiments were conducted in accordance with the National Care and Use of Laboratory Animals by the National Animal Research Authority (China) and guidelines of Animal Care and Use issued by the Medical School of Southeast University Institutional Animal Care and Use Committee, and the experiments were approved by the Institutional Animal Care and Use Committee of the Medical School of Southeast University. The two-day-old zebrafish were obtained from Shanghai FishBio Co., Ltd. The zebrafish were fed in the embryo medium containing PSH (10 μM) to ensure that the zebrafish absorbed the probe into their tissues and organs. After 1 h, the zebrafish were washed with PBS and then incubated with 20 μM Al3+ and Zn2+ for 0.5 h. The fluorescence imaging photos of zebrafish were observed using a confocal laser scanning microscope from the blue channel (λex = 405 nm, collected fluorescence wavelength: 480–580 nm).Conclusion
In summary, a simple Schiff base probe PSH with the AIE feature was synthesized and characterized based on natural camphor. This probe showed strong yellow-green fluorescence at 535 nm due to its aggregation-induced emission (AIE) feature. The probe could detect both Al3+ and Zn2+ with high sensitivity and two different wavelength responses (500 nm and 555 nm) accompanied by the fluorescence intensity enhancement. The detection limits of PSH towards Al3+ and Zn2+ were calculated to be 12.1 nM and 14.2 nM, respectively. PSH exhibited excellent selectivity and anti-interference performance and could distinguish between Al3+/Zn2+ and identify whether Zn2+ existed in the PSH-Al3+ complex by adding ATP. The complexation mechanism of the PSH for Al3+ and Zn2+ based on the CHEF effect and the inhibition of the PET process was strongly proven by 1H NMR, HRMS analysis, and density functional theory (DFT) calculations. Based on its outstanding sensing properties, the probe PSH was used to establish molecular logic function gates by using Al3+, Zn2+, and ATP as three chemical inputs. Moreover, probe PSH can be applied to detect Al3+ and Zn2+ in real environmental water, and the fluorescent detection was well demonstrated by test strips. Furthermore, probe PSH had good biocompatibility which was used for sensitive fluorescence images of Al3+ and Zn2+ in HeLa cells. The fluorescent probe PSH was also applied in bioimaging in zebrafish.Author contributions
Shuai Gong: investigation, methodology, formal analysis, writing–original draft. Yan Zhang: investigation, methodology. Ahui Qin: investigation, formal analysis. Mingxin Li: formal analysis. Yu Gao: formal analysis. Chenglong Zhang: formal analysis. Jie Song: computational chemistry. Xu: resources. Zhonglong Wang: supervision, writing-reviewing and editing. Shifa Wang: funding acquisition, writing-review and editing.Conflicts of interest
The authors declare no competing financial interest.Acknowledgements
We acknowledge the financial assistance from the National Natural Science Foundation of China (No. 32071707).References
- M. B. Gumpu, S. Sethuraman, U. M. Krishnan and J. B. B. Rayappan, Sens. Actuators, B, 2015, 213, 515–533 CrossRef CAS.
- D. Li, K. Morimoto, T. Takeshita and Y. Lu, Environ. Health Prev. Med., 2001, 6, 27–32 CrossRef CAS PubMed.
- J. Labuda, K. Bubnicova, L. Kovalova, M. Vanickova, J. Mattusch and R. Wennrich, Sensors, 2005, 5, 411–423 CrossRef CAS.
- L. M. Plum, L. Rink and H. Haase, Int. J. Environ. Res. Public Health, 2010, 7, 1342–1365 CrossRef CAS.
- S. Erdemir and S. Malkondu, Sens. Actuators, B, 2013, 188, 1225–1229 CrossRef CAS.
- E. L. Que, D. W. Domaille and C. J. Chang, Chem. Rev., 2008, 108, 1517–1549 CrossRef CAS PubMed.
- C. Migliorini, E. Porciatti, M. Luczkowski and D. Valensin, Coord. Chem. Rev., 2012, 256, 352–368 CrossRef CAS.
- M. Jaishankar, T. Tseten, N. Anbalagan, B. B. Mathew and K. N. Beeregowda, Interdiscip. Toxicol., 2014, 7, 60–72 CrossRef PubMed.
- J. Y. Jung, S. J. Han, J. Chun, C. Lee and J. Yoon, Dyes Pigm., 2012, 94, 423–426 CrossRef CAS.
- H. Liu, T. Liu, J. Li, Y. Zhang, J. Li, J. Song, J. Qu, W. Y. Wong and J. Mater, Chem. B, 2018, 6, 5435–5442 CAS.
- G. Zhao, G. Wei, Z. Yan, B. Guo, S. Guang, R. Wu and H. Xu, Anal. Chim. Acta, 2020, 1095, 185–196 CrossRef CAS PubMed.
- J. Fu, Y. Chang, B. Li, H. Mei, L. Yang and K. Xu, Analyst, 2019, 144, 5706–5716 RSC.
- R. Rahman and H. Upadhyaya, J. Plant Biol., 2020, 64, 101–121 CrossRef.
- M. Ghaedi, A. Shokrollahi, K. Niknam and M. Soylak, Sep. Sci. Technol., 2009, 44, 773–786 CrossRef CAS.
- J. Heilmann, S. F. Boulyga and K. G. Heumann, J. Anal. At. Spectrom., 2009, 24, 385–390 RSC.
- R. J. Cassella, O. I. Magalhaes, M. T. Couto, E. L. Lima, M. A. Neves and F. M. Coutinho, Talanta, 2005, 67, 121–128 CrossRef CAS PubMed.
- D. Omanović, C. Garnier, K. Gibbon-Walsh and I. Pižeta, Electrochem. Commun., 2015, 61, 78–83 CrossRef.
- W. W. Zhao, J. J. Xu and H. Y. Chen, Analyst, 2016, 141, 4262–4271 RSC.
- G. March, T. D. Nguyen and B. Piro, Biosensors, 2015, 5, 241–275 CrossRef PubMed.
- C. F. Harrington, R. Clough, H. R. Hansen, S. J. Hill and J. F. Tyson, J. Anal. At. Spectrom., 2010, 25, 1185–1216 RSC.
- Q. F. Niu, T. Sun, T. D. Li, Z. R. Guo and H. Pang, Sens. Actuators, B, 2018, 266, 730–743 CrossRef CAS.
- D. Udhayakumari, S. Velmathi, Y. M. Sung and S. P. Wu, Sens. Actuators, B, 2014, 198, 285–293 CrossRef CAS.
- Z. Chen, Y. Niu, G. Cheng, L. Tong, G. Zhang, F. Cai, T. Chen, B. Liu and B. Tang, Analyst, 2017, 142, 2781–2785 RSC.
- J. Luo, Z. Xie, J. W. Lam, L. Cheng, H. Chen, C. Qiu, H. S. Kwok, X. Zhan, Y. Liu, D. Zhu and B. Z. Tang, Chem. Commun., 2001, 18, 1740–1741 RSC.
- Y. Wang, Y. Qiu, A. Sun, Y. Xiong, H. Tan, Y. Shi, P. Yu, G. Roy, L. Zhang and J. Yan, Anal. Chim. Acta, 2020, 1133, 109–118 CrossRef CAS PubMed.
- S. M. Sayed, X.-F. Li, H.-R. Jia, S. Durrani, F.-G. Wu and X. Lu, Sens. Actuators, B, 2021, 343, 130128 CrossRef CAS.
- X. J. Sun, T. T. Liu, N. N. Li, S. Zeng and Z. Y. Xing, Spectrochim. Acta, Part A, 2020, 228, 117786 CrossRef CAS.
- T. T. Liu, J. Xu, C. G. Liu, S. Zeng, Z. Y. Xing, X. J. Sun and J. L. Li, J. Mol. Liq., 2020, 300, 112250 CrossRef CAS.
- K. Boonkitpatarakul, J. Wang, N. Niamnont, B. Liu, L. McDonald, Y. Pang and M. Sukwattanasinitt, ACS Sens., 2015, 1, 144–150 CrossRef.
- J. Sun, B. Ye, G. Xia and H. Wang, Sens. Actuators, B, 2017, 249, 386–394 CrossRef CAS.
- S. Zeng, S. J. Li, X. J. Sun, T. T. Liu and Z. Y. Xing, Dyes Pigm., 2019, 170, 107642 CrossRef CAS.
- H. Zhang, T. Sun, Q. Ruan, J.-L. Zhao, L. Mu, X. Zeng, Z. Jin, S. Su, Q. Luo, Y. Yan and C. Redshaw, Dyes Pigm., 2019, 162, 257–265 CrossRef CAS.
- X. J. He, Q. Xie, J. Y. Fan, C. C. Xu, W. Xu, Y. H. Li, F. Ding, H. Deng, H. Chen and J. L. Shen, Dyes Pigm., 2020, 177, 108255 CrossRef CAS.
- W. Chen, I. Vermaak and A. Viljoen, Molecules, 2013, 18, 5434–5454 CrossRef CAS.
- F. Juteau, V. Masotti, J. M. Bessiere, M. Dherbomez and J. Viano, Fitoterapia, 2002, 73, 532–535 CrossRef CAS PubMed.
- B. Tirillini, E. R. Velasquez and R. Pellegrino, Planta Med., 1996, 62, 372–373 CrossRef CAS PubMed.
- A. Viljoen, S. van Vuuren, E. Ernst, M. Klepser, B. Demirci, K. H. C. Baser and B. E. van Wyk, J. Ethnopharmacol., 2003, 88, 137–143 CrossRef CAS.
- Y. Zhang, Z. L. Wang, J. Song, M. X. Li, Y. Q. Yang, X. Xu, H. J. Xu and S. F. Wang, Anal. Methods, 2019, 11, 3958–3965 RSC.
- Z. L. Wang, Y. Zhang, J. Yin, M. X. Li, H. Luo, Y. Q. Yang, X. Xu, Q. Yong and S. F. Wang, Sens. Actuators, B, 2020, 320, 128249 CrossRef CAS.
- Z. Wang, Y. Zhang, J. Yin, Y. Yang, H. Luo, J. Song, X. Xu and S. Wang, ACS Sustainable Chem. Eng., 2020, 8, 12348–12359 CrossRef CAS.
- Y. Jeong and J. Yoon, Inorg. Chim. Acta, 2012, 381, 2–14 CrossRef CAS.
- S. Goswami, S. Das, K. Aich, D. Sarkar, T. K. Mondal, C. K. Quah and H. K. Fun, Dalton Trans., 2013, 42, 15113–15119 RSC.
- L. Wang, W. Qin, X. Tang, W. Dou and W. Liu, J. Phys. Chem. A, 2011, 115, 1609–1616 CrossRef CAS PubMed.
- H. L. Lu, W. K. Wang, X. X. Tan, X. F. Luo, M. L. Zhang, M. Zhang and S. Q. Zang, Dalton Trans., 2016, 45, 8174–8181 RSC.
- G. E. Jackson and K. V. Voyi, Polyhedron, 1987, 6, 2095–2098 CrossRef CAS.
- S. Gharami, K. Aich, L. Patra and T. K. Mondal, New J. Chem., 2018, 42, 8646–8652 RSC.
- L. J. Daumann, K. E. Dalle, G. Schenk, R. P. McGeary, P. V. Bernhardt, D. L. Ollis and L. R. Gahan, Dalton Trans., 2012, 41, 1695–1708 RSC.
- F. Wang, J. H. Moon, R. Nandhakumar, B. Kang, D. Kim, K. M. Kim, J. Y. Lee and J. Yoon, Chem. Commun., 2013, 49, 7228–7230 RSC.
- M. J. Frisch, Gaussian 09, Revision A.1, Gaussian Incorp, Wallingford, CT, 2009 Search PubMed.
Footnote |
| † Electronic supplementary information (ESI) available. See DOI: 10.1039/d1an01733k |
| This journal is © The Royal Society of Chemistry 2022 |

