
 Open Access Article
 This Open Access Article is licensed under a
 Creative Commons Attribution 3.0 Unported Licence
Pr3+ doped NaYF4 and LiYF4 nanocrystals combining visible-to-UVC upconversion and NIR-to-NIR-II downconversion luminescence emissions for biomedical applications†
Min Ying
Tsang
 a,
Patryk
Fałat
a,
Magda A.
Antoniak
a,
Roman
Ziniuk
c,
Szymon J.
Zelewski
b,
Marek
Samoć
a,
Marcin
Nyk
a,
Junle
Qu
c,
Tymish Y.
Ohulchanskyy
*c and
Dominika
Wawrzyńczyk
*a
a,
Patryk
Fałat
a,
Magda A.
Antoniak
a,
Roman
Ziniuk
c,
Szymon J.
Zelewski
b,
Marek
Samoć
a,
Marcin
Nyk
a,
Junle
Qu
c,
Tymish Y.
Ohulchanskyy
*c and
Dominika
Wawrzyńczyk
*a
aInstitute of Advanced Materials, Faculty of Chemistry, Wrocław University of Science and Technology, Wybrzeże Wyspiańskiego 27, 50-370 Wrocław, Poland. E-mail: dominika.wawrzynczyk@pwr.edu.pl
bDepartment of Semiconductor Materials Engineering, Faculty of Fundamental Problems of Technology, Wybrzeże Wyspiańskiego 27, 50-370 Wrocław, Poland
cCollege of Physics and Optoelectronic Engineering, Shenzhen University, Nanhai Avenue 3688, Nanshan District, 518060, Guangdong, China. E-mail: tyo@szu.edu.cn
First published on 13th September 2022
Abstract
Lanthanide-doped fluoride nanocrystals (NCs) are known to exhibit unique optical properties, such as upconversion and downconversion luminescence (UCL and DCL), which can be employed for various applications. In this work, we demonstrate that by doping praseodymium(III) and ytterbium(III) ions (Pr3+ and Yb3+) into a nanosized fluoride matrix (i.e. NaYF4 and LiYF4), it is possible to combine their UCL and DCL properties that can be concurrently used for biomedical applications. In particular, the emissive modes combined in a single nanoparticle co-doped with Pr3+ and Yb3+ include DCL emission (excited at 980 nm and peaked at 1320 nm), which can be used for near infrared (NIR) DCL bioimaging in the NIR-II window of biological tissue transparency (∼1000–1350 nm) and UCL emission (excited at 447 nm and peaked at 275 nm) that can be employed for germicide action (via irradiation by light in the UVC range). A possibility of the latter was demonstrated by the denaturation of double-stranded DNA (dsDNA) into single-stranded ones that was caused by the UVC UCL emission from the NCs under 447 nm irradiation; it was evidenced by the hyperchromicity observed in the irradiated dsDNA solution and also by a fluorometric analysis of DNA unwinding (FADU) assay. Concurrently, the possibility of NIR-II luminescence bioimaging through biological tissues (bovine tooth and chicken flesh) was demonstrated. The proposed concept paves a way for NIR-II imaging guided antimicrobial phototherapy using lanthanide-doped fluoride nanocrystals.
1 Introduction
Lanthanide-doped fluoride nanocrystals (NCs) are gaining increased interest as nanosized emitters for bioapplications due to their unique, predictable and designable optical properties, along with the facile modification of their size, shape and crystal structure synthetically. Owing to the defined energy level structure and shielding of optically active 4f valence electrons in lanthanide ions, highly characteristic luminescence emission in a broad spectral range can be achieved.1–4 Fluoride-based nanophosphors (e.g., NaYF4 and LiYF4 NCs) are in fact among the most studied host nanomaterials, since their synthetic adaptability and robust structure can accommodate various lanthanide ions without altering the nanocrystal lattices. The features of the lanthanide ion emission can also be precisely manipulated through design and synthetic methodologies.5,6 Efficient near-infrared (NIR)-to-visible (VIS), NIR-to-NIR, and VIS-to-ultraviolet (UV) upconversion and NIR-to-NIR or VIS-to-NIR downconversion luminescence emissions (UCL and DCL), which are exhibited by these nanomaterials, have been demonstrated to hold great potential for sensing,7,8 imaging9–11 and in situ photoactivation12–14 applications. In particular, NIR luminescence from fluoride NCs is frequently applied in in vivo bioimaging due to the deep penetration ability of both excitation and emission of NIR luminescence.15 Hence, special emphasis is put on doping these NCs with the lanthanide ions that possess characteristic emissions in the NIR spectral range and on increasing the NIR emission yield.14,16 For instance, NIR DCL excited at 980 nm can be employed for imaging in the NIR-II window of biological tissue transparency (∼1000–1350 nm), which is beneficial for deeper light penetration and higher imaging contrast due to negligible autofluorescence and significantly lower light scattering in this spectral region.17–23 On the other hand, NIR light used for excitation can also be upconverted to produce VIS or UV radiation.14,24 The latter is especially of interest as UV radiation is effective at disinfection or germicidal action, which is nowadays crucial to maintain hygiene and prevent spreading viruses and bacteria, thus reducing risks to human health.25–27 In particular, wavelengths in the range of 200 to 280 nm (the UVC region) are known to be able to damage/cut/nick DNA and RNA in microorganisms and viruses and, consequently, inhibit their multiplication.28–31NCs with UVC emission under NIR excitation have been proposed to be incorporated into various surfaces or fabrics for antibacterial and antiviral actions.16 Thus, engineered design and development of nanomaterials with efficient generation of the upconverted UVC radiation has a potentially high impact on biomedical applications.
However, the efficiency of NIR-to-UVC UCL is usually relatively low, as it involves three- or four-photon processes due to the large energy difference between the NIR excitation and UVC emission photons. In contrast, VIS-to-UVC UCL (mostly two-photon induced processes) is demonstrated as an alternative, involving the use of Pr3+, Tm3+ or Gd3+.32 Pr3+ doped materials are particularly attractive owing to the possibility of emitting UVC light at around 260 nm, fitting the position of an absorption peak of DNA and RNA molecules and enabling their optically driven degradation.33–37 Very recently, the successful synthesis of LiYF4:Pr3+ microcrystals that exhibited UVC emission under sunlight irradiation was reported.38 Besides, a possibility to co-dope fluoride NCs with Yb3+ and Pr3+ has also been revealed, demonstrating the functionality of those NCs through the efficient generation of NIR DCL emission under excitation at 980 nm.17,39–44 Therefore, we suggested that it is possible to obtain the Pr3+ doped NCs with UCL and DCL emissions switchable through the use of corresponding laser excitation wavelengths. The co-doping of Yb3+ and Pr3+ in fluoride phosphors for UCL and DCL has been reported previously, but it was mostly limited to microcrystals or bulk materials and for NIR-to-VIS/NIR UCL.17,39–42,44,45 The development of nanosized materials is known to be crucial for various biomedical applications (including NIR luminescence bioimaging) and the ability of nanomaterials to emit UVC UCL under visible irradiation can be essential for antimicrobial and antiviral activity. However, the development and utilization of nanosized phosphors with UVC UCL remain largely unexplored.
Herein, we report, for the first time, a combination of VIS-to-UVC UCL and NIR-to-NIR-II DCL emission processes within the same nanomaterials co-doped with Pr3+ and Yb3+. In particular, we report the synthesis of NaYF4 and LiYF4 NCs co-doped with Pr3+ and Yb3+, which exhibit the VIS(447 nm)-to-UVC UCL peaked at ∼275 nm. At the same time, these NCs exhibit NIR (980 nm)-to-NIR-II DCL (peaked at ca. 1320 nm). A scheme of electronic levels and transitions in Pr3+ and Yb3+ ions, which are related to VIS-to-UVC UCL and NIR-to-NIR DCL, is presented in Fig. 1. The synthesised bifunctional NCs allow germicide action (via UVC induced damage of DNA and RNA of targeted microorganisms or viruses) and simultaneously demonstrate high contrast NIR-II imaging capability. As a proof-of-concept, we demonstrate the denaturation of double-stranded DNA (dsDNA) into single-stranded ones (DNA unwinding) caused by UVC emission generated by Pr3+/Yb3+ doped NCs excited using a 447 nm laser, which was confirmed by two well-established independent experimental methods (i.e., hyperchromicity effect of dsDNA and fluorometric analysis of DNA unwinding (FADU) assay).46,47 Along with that, the NIR-II DCL imaging capability of these NCs for both steady-state and time-gated imaging modes and the possibility of NIR-II luminescence bioimaging through biological tissues (bovine tooth and chicken flesh) were also demonstrated.
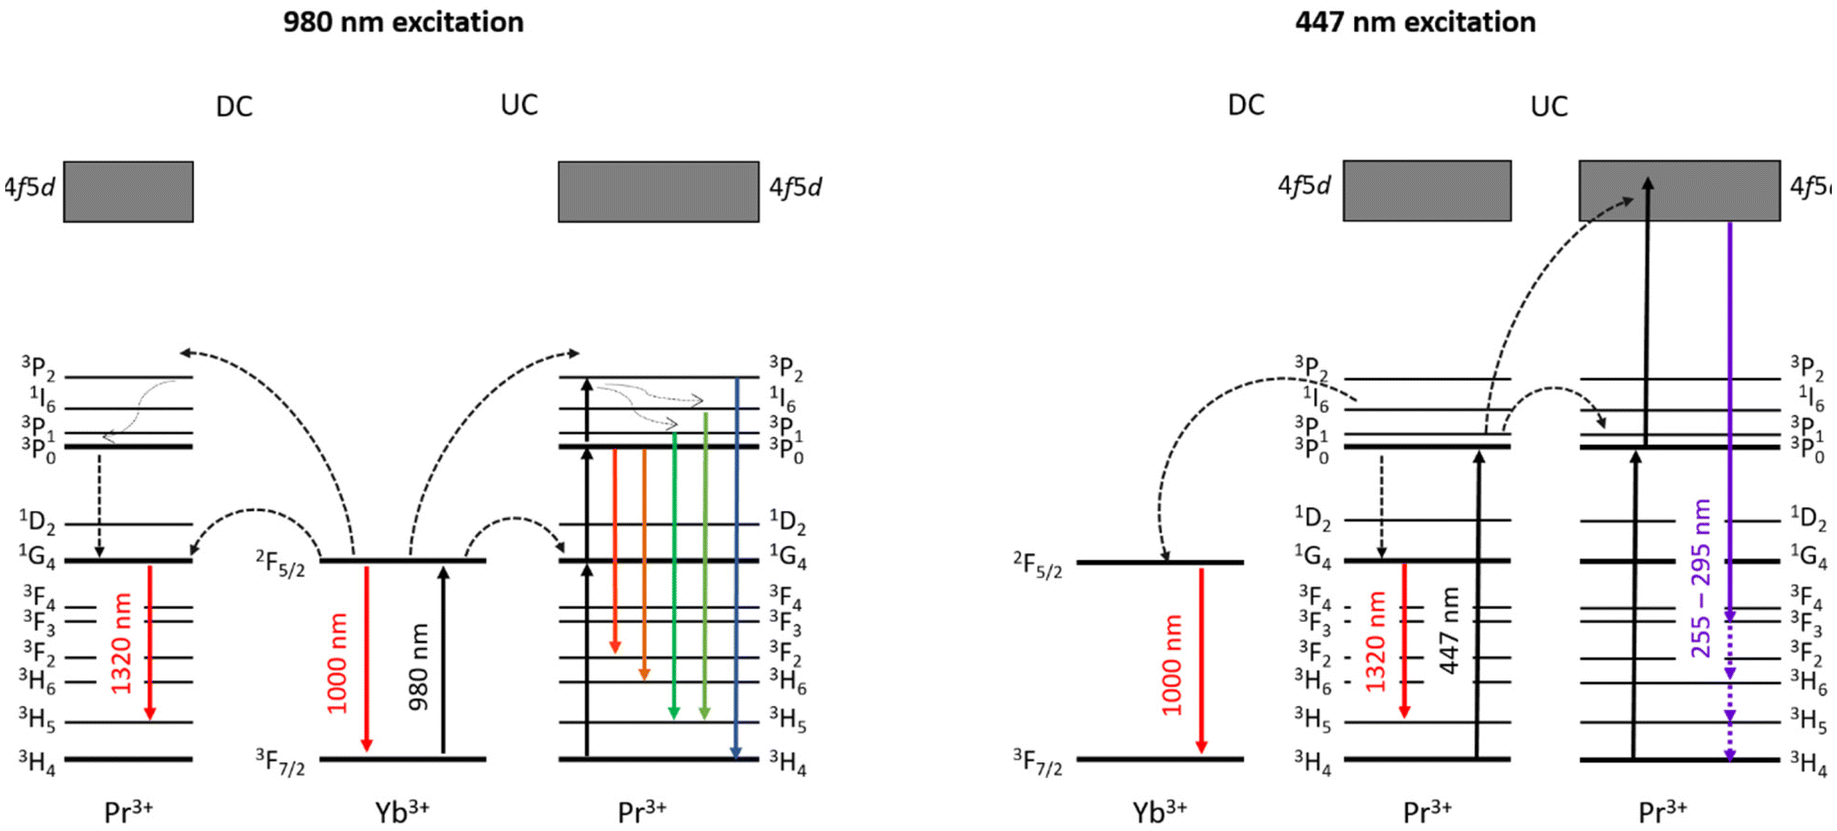 | ||
| Fig. 1 A scheme of electronic levels and transitions corresponding to VIS-to-UVC UCL and NIR-to-NIR-II DCL processes in Pr3+ and Yb3+ in fluoride NCs. The UCL and DCL mechanisms are illustrated under (a) 980 nm laser excitation for visible and NIR emissions and (b) 447 nm laser excitation for UVC and NIR emissions. | ||
2 Results and discussion
2.1 Synthesis and characterization of the structure and morphology
A series of NaYF4:Pr3+/Yb3+ and LiYF4:Pr3+/Yb3+ NCs were synthesized following the standard thermal decomposition methods (the detailed description of the synthetic protocols and sample compositions can be found in the Experimental section and in the ESI†).48–50 The morphologies and size distribution of NaYF4:Pr3+/Yb3+ and LiYF4:Pr3+/Yb3+ NCs were determined by high-resolution transmission electron microscopy (TEM) (Fig. 2). All samples contained tetrahedral shaped LiYF4:Pr3+/Yb3+ NCs (Fig. 2a, details in ESI 2, Fig. S1†) and hexagonal shaped NaYF4:Pr3+/Yb3+ NCs (Fig. 2b, details in ESI 2†), which are identical to the LiYF4 and β-NaYF4 matrices, respectively. The size distribution calculated from the TEM images presented in Fig. 2 showed the uniform formation of both NaYF4:Pr3+/Yb3+ NCs (size: 78 ± 10 nm) and LiYF4:Pr3+/Yb3+ NCs (size: 82 ± 6 nm). Moreover, elemental analysis conducted by energy dispersive X-ray (EDX) spectroscopy confirmed the presence of the corresponding Pr and Yb elements in both types of NCs (ESI 2, Fig. S2†). | ||
| Fig. 2 Selected TEM images of (a) LiYF4:Pr3+/Yb3+ and (b) NaYF4:Pr3+/Yb3+ NCs. The corresponding PXRD patterns of (c) LiYF4:Pr3+/Yb3+ and (d) NaYF4:Pr3+/Yb3+ NCs versus theoretical patterns from the database. | ||
The powder X-ray diffraction (PXRD) patterns (Fig. 1c and d, details in Fig. S4 and S5†) were also determined, peaks measured for LiYF4:Pr3+/Yb3+ and NaYF4:Pr3+/Yb3+ NCs are identical to those reported for undoped LiYF4 and β-NaYF4 crystals in the database (ICSD #51916 and #27896 standard patterns, respectively). In addition, the crystal structures of the synthesized LiYF4:Pr3+/Yb3+ and NaYF4:Pr3+/Yb3+ NCs remain unchanged after doping with different contents of Pr3+ and Yb3+ ions (ESI 2,†Fig. 1 and 3). The concentration of Pr3+ in all samples was also determined by inductively coupled plasma optical emission spectroscopy (ICP-OES) analysis and presented as the Yb/Pr ratio (ESI 2, Table S3†). The results confirmed that all NCs were with predetermined Pr3+ concentration (1 and 2 mol% for LiYF4:Pr3+/Yb3+ and NaYF4:Pr3+/Yb3+ NCs respectively), as expected.
 | ||
| Fig. 3 Selected luminescence spectra of LiYF4:Pr3+/Yb3+ (a and c) and NaYF4:Pr3+/Yb3+ (b and d) NCs with dopant concentrations that produced the highest emission intensity in the visible spectral range (CHCl3 suspensions). (a and b) DCL (Stokes shifted) emission under 447 nm excitation; (c and d) UCL emission under 980 nm excitation. (e and f): dependencies of emission intensities (606 nm peak) on different concentrations of Yb3+ for (e) the LiYF4:Pr3+/Yb3+ series and (f) the NaYF4:Pr3+/Yb3+ series. Excitation at 447 nm or 980 nm (visible luminescence emission spectra are shown in ESI 2, Fig. S6 and S7†). | ||
2.2 VIS-to-VIS and NIR-to-VIS upconversion luminescence from NaYF4:Pr3+/Yb3+ and LiYF4:Pr3+/Yb3+ nanocrystals
Praseodymium(III) ions doped within the crystalline matrices can be excited at 440–490 nm due to the presence of strong absorption bands in this spectral range.51 On the other hand, the incorporated Yb3+ ions exhibit strong absorption in the NIR region (peak at ca. 980 nm). Absorption of VIS and NIR light by Pr3+ and Yb3+ ions doped within NCs leads to various transitions between different electronic energy levels, followed by UCL and DCL emissions, as shown in Fig. 1. To assess the luminescence properties of the synthesized series of NaYF4:Pr3+/Yb3+ and LiYF4:Pr3+/Yb3+ NCs, we acquired emission spectra of NCs doped with a fixed low Pr3+ concentration (1 or 2% chosen for preventing concentration quenching and maximizing the Pr3+ emission yield) and with Yb3+ in a range of concentrations (1, 2, 5, 10, 15, 20, 40, 60 mol%). Selected luminescence spectra of NaYF4:Pr3+/Yb3+ and LiYF4:Pr3+/Yb3+ NCs with the highest visible range emission intensities are shown in Fig. 3 (all emission spectra obtained under 447 nm and 980 nm excitations are shown in Fig. S6 and S7†).The Stokes shifted PL emission spectra for both NaYF4:Pr3+/Yb3+ and LiYF4:Pr3+/Yb3+ NCs under 447 nm excitation show typical f–f emission of Pr3+ ions at ca. 478, 522, 555, 606, 639, 697, and 720 nm, which are attributed to 3P0 → 3H4, 1I6 → 3H5, 3P1 → 3H5, 3P0 → 3H6, 3P0 → 3F2, 3P1 → 3F3, and 3P0 → 3F4 electronic transitions, respectively (Fig. 3a and d).52 Similar Pr3+ emission bands have also been observed upon 980 nm excitation, indicating the efficient energy transfer (ET) from Yb3+ to Pr3+ followed by visible UCL emission from the 1G4 state to the 3P0 state (Fig. 3b and e).
2.3 VIS-to-UVC upconversion and NIR-to-NIR-II downconversion luminescence emissions from NaYF4:Pr3+/Yb3+ and LiYF4:Pr3+/Yb3+ nanocrystals
The characteristic Pr3+ luminescence emission bands overlap for the Stokes (excitation at 447 nm) and anti-Stokes (excitation at 980 nm) processes, confirming the energy transfer between Pr3+ and Yb3+ in the NaYF4:Pr3+/Yb3+ and LiYF4:Pr3+/Yb3+ NCs. Further studies were conducted to find the optimal combination of Pr3+/Yb3+ concentrations in both studied materials for the most efficient VIS-to-UVC UCL emission. It should be noted that even if Pr3+ ions were shown to produce UCL emission through the 4f5d → 3HJ/3FJ transition, these studies were performed for microsized or bulk materials;35,37 development of nanosized materials with efficient emission in the UVC range has not been reported. Thus, the observation of the VIS-to-UVC UCL emission and optimization of its efficiency in the synthesized nanosized NaYF4:Pr3+/Yb3+ and LiYF4:Pr3+/Yb3+ NC materials envisages novel functionality introduced within this work. The emitted UVC could be absorbed by DNA and RNA in microorganisms, resulting in the breaking of the hydrogen bonds within double-stranded DNA (dsDNA) and inducing linkage between thymine and the neighbouring cytosine thereafter, therefore the DNA replication is inhibited.53 The use of a 447 nm laser for excitation leads to the population of the 3PJ state of Pr3+ followed by UCL to the 4f5d band (Fig. 1).54 It should be emphasized that in this case the UVC light is generated as a result of UC by sequential two-photon absorption (excitation using an easily accessible 447 nm CW laser source), which is much more efficient than multi-photon processes used for NIR-to-UVC UCL (excitation with 980 nm) or simultaneous absorption of two photons in nonlinear optical processes.55–57 The observed UVC emission of NaYF4:Pr3+/Yb3+ and LiYF4:Pr3+/Yb3+ NCs peaks at ca. 275 nm (Fig. 4) is in agreement with the reported Pr3+ UVC emission.37 Screening the UVC emission of the series of synthesized samples revealed that the optimal concentration of Yb3+ for both NaYF4:Pr3+/Yb3+ and LiYF4:Pr3+/Yb3+ NCs was 10 mol% (Fig. S8†), though an increase in Yb3+ concentration beyond 10 mol% resulted in a significant decrease in the UVC emission intensity, which was due to the concentration quenching effect.58,59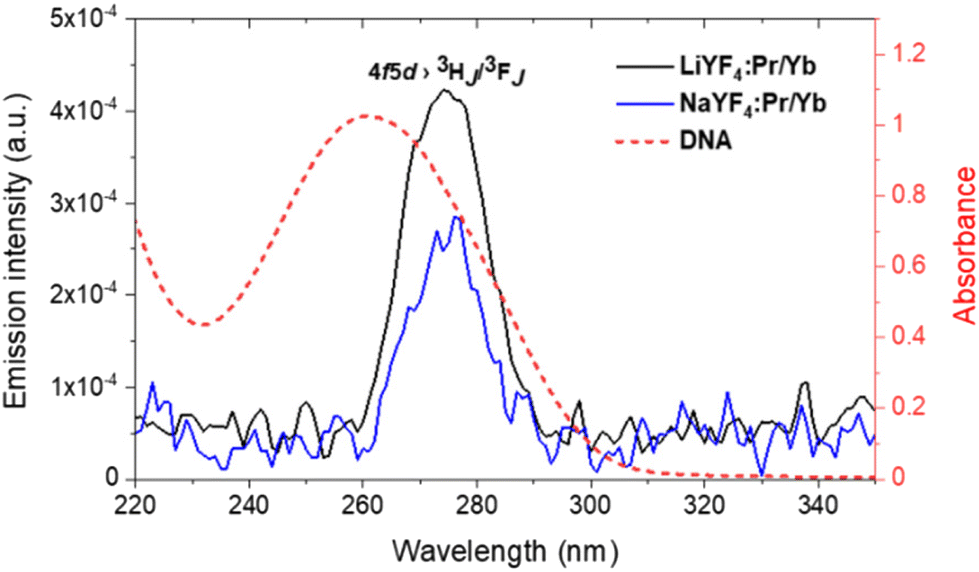 | ||
| Fig. 4 UVC UCL emission spectra of LiYF4:Pr3+/Yb3+ NC powder (black solid line) and NaYF4:Pr3+/Yb3+ NCs (blue solid line) with 10 mol% Yb3+ concentration under 447 nm laser excitation and comparison with the DNA absorption spectrum (red dotted line). | ||
Nevertheless, no UVC UCL emission was observed under 980 nm laser excitation, confirming that the NIR-to-UVC UC process in the studied NCs is much less efficient than that of VIS-to-UVC UC, as expected (ESI 3, Fig. S9†).
As shown in Fig. 1, after absorption of 447 nm photon by Pr3+ (3H4 → 3PJ transition), the NIR-II DCL emission peaked at ca. 1320 nm (1G4 → 3H5 transition) occurs. At the same time, the excitation energy is transferred from Pr3+ to Yb3+ and this energy transfer [3PJ (Pr3+) → 2F5/2 (Yb3+)] results in Yb3+ emission at ca. 1000 nm (details in ESI 3, Fig. S10†).16 As the excitation energy transfer between Yb3+ and Pr3+ has been revealed by Pr3+ UCL spectra excited at 980 nm, it is natural to assume that the NIR-II PL emission of NaYF4:Pr3+/Yb3+ and LiYF4:Pr3+/Yb3+ NCs can also result from the absorption of 980 nm photons by Yb3+(2F7/2 → 2F5/2 transition in Fig. 1). In addition to the deactivation of the 2F5/2 state through emission peaked at ca. 1000 nm, an energy transfer 2F5/2 (Yb3+) → 1G4 (Pr3+) can occur, followed by 1G4 → 3H5 radiative transition in Pr3+, which corresponds to the NIR-II PL peaked at ca. 1320 nm (Fig. 1). Fig. 5 shows selected NIR PL spectra of LiYF4:Pr3+/Yb3+ and NaYF4:Pr3+/Yb3+ NC suspensions excited using a 980 nm laser (details in ESI 3, Fig. S11†). As one can see, Pr3+ PL in the range of 1250–1500 nm arises under 980 nm excitation when the NCs are co-doped with Yb3+ and Pr3+ (Fig. 5), while no NIR-II luminescence is seen under 980 nm excitation when the NCs are doped solely with Pr3+.
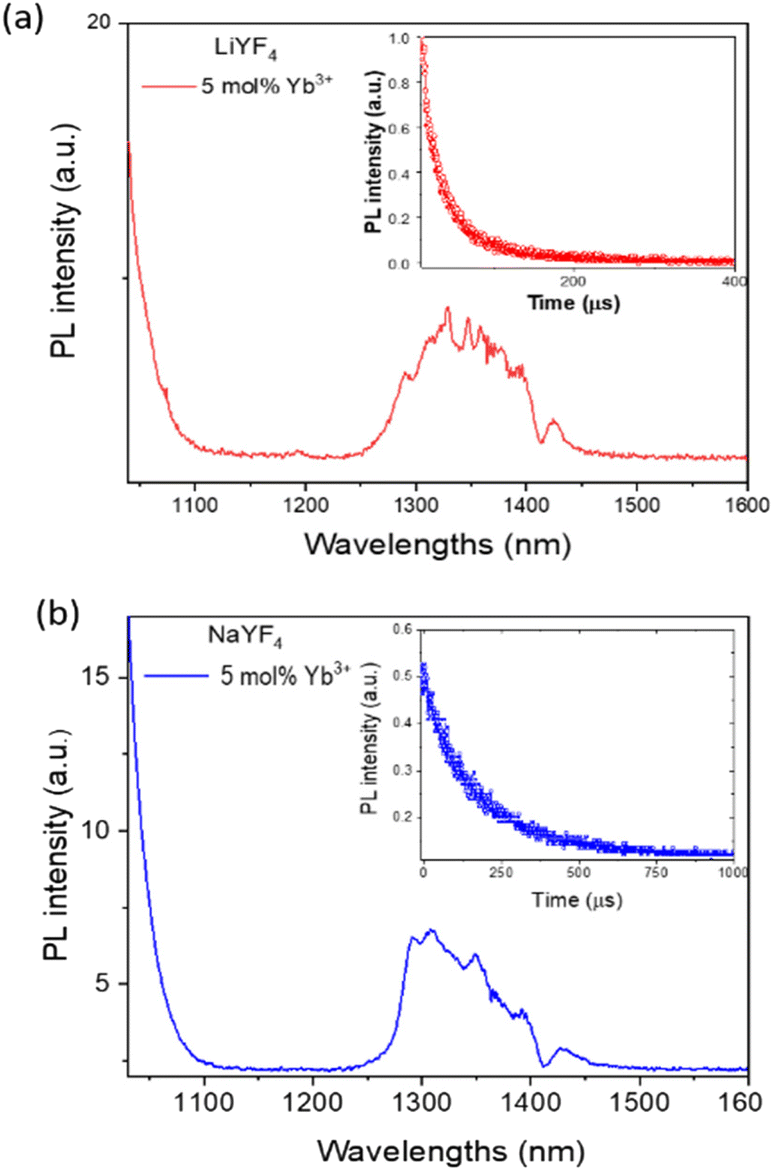 | ||
| Fig. 5 NIR-II PL spectra of LiYF4:Pr3+/Yb3+ (a) and NaYF4:Pr3+/Yb3+ (b) NCs in CHCl3. Insets of a and b show corresponding DCL decays acquired at 1320 nm under 980 nm excitation. | ||
NIR luminescence spectra of LiYF4:Pr3+/Yb3+ and NaYF4:Pr3+/Yb3+ NCs shown in Fig. 5 also reveal at 1030–1100 nm an edge of a NIR PL band from Yb3+ (the peak of Yb3+ PL at ca. 1000 nm is difficult to resolve due to scattering of the 980 nm laser used for excitation). It is worth noting that the spectral shape of Pr3+ DCL is quite different for LiYF4 and NaYF4 matrices, which is associated with a difference in the crystalline environment. The decays of NIR-II PL from LiYF4:Pr3+/Yb3+ and NaYF4:Pr3+/Yb3+ NCs are shown as insets of Fig. 5a and b; the luminescence lifetimes were found to be around 100 μs (ca. 80 μs for Pr3+ in LiYF4:Yb3+ NCs and ca. 130 μs for Pr3+ in NaYF4:Yb3+ NCs).
The presented spectroscopy results on 447 nm and 980 nm photon conversion in both NaYF4 and LiYF4 NCs doped with Pr3+/Yb3+ reveal promising multiple functionalities in the nanomaterials, where one can employ the VIS-to-UVC UCL emission peaked at ca. 275 nm for targeted deactivation of various types of microorganisms, including viruses and bacteria, and, simultaneously, the NIR-to-NIR-II DCL emission peaked at ca. 1320 nm for background-free high-contrast optical imaging of deeper biological tissues. This is why in the next step we have designed and performed a few proof-of-concept experiments showing the potential applicability of the synthesized nanomaterials.
2.4 Denaturation of dsDNA triggered by NaYF4:Pr3+/Yb3+ and LiYF4:Pr3+/Yb3+ nanocrystal VIS-to-UVC UCL emission
As stated before, UVC irradiation is known to damage the interaction between dsDNA strands and unwind them to single-stranded DNAs. As a result, DNA absorbance peaked at 260 nm is increased. This phenomenon is known as the hyperchromic effect or hyperchromicity.31,46,60,61 As illustrated in Fig. 4, the UVC emissions from NaYF4:Pr3+/Yb3+ and LiYF4:Pr3+/Yb3+ NCs spectrally overlay with the absorbance of DNA, so that the absorption of UVC radiation by dsDNA can eventually lead to dsDNA denaturation. In order to demonstrate the possibility to denature dsDNA by the UVC emitted from NaYF4:Pr3+/Yb3+ and LiYF4:Pr3+/Yb3+ NCs, the absorbance changes of the dsDNA solution upon irradiation of the highest UVC emission intensity NCs (10 mol% Yb3+) was monitored. The absorbance was measured at 447 nm excitation at 20 min intervals (ESI 4, Fig. S12†). In comparison with the DNA absorbance in the absence of NCs, the absorbance of the DNA solution at 260 nm in the presence of LiYF4:Pr3+/Yb3+ and NaYF4:Pr3+/Yb3+ NCs increased by ca. 6% and 13%, respectively (Fig. 6b and c). No change in DNA absorbance was observed in a control experiment in the absence of any NCs (Fig. 6a) or by using undoped NCs (ESI 3, Fig. S13†). This indicates that the hyperchromic effect in DNA absorbance is the result of the action of UVC emission from the Pr3+ dopant incorporated into the NCs. In order to confirm the dsDNA denaturation and quantify the amount of denatured dsDNA, the irradiated dsDNA solution was analysed using a well-established FADU assay following the standard protocol (details in ESI 4†).62,63 In this assay, a fluorescent probe Hoechst 32258 is employed, which is known to bind only with dsDNA (not with ssDNA) and, when bound, emit fluorescence peaked at ∼460 nm wavelength under excitation at 365 nm. Thus, while the dsDNA is unwound as a result of an external stimulus (e.g., UVC light irradiation), the intensity of Hoechst 32258 fluorescence decreases, demonstrating the dsDNA unwinding.47,62–64 The Hoechst 32258 fluorescence intensity was shown to decrease with a decrease in the concentration of dsDNA (ESI 4, Fig. S15a†). We therefore have employed the FADU assay to determine the denaturation ability of the NCs emitting UVC UCL under a 447 nm laser. First of all, we have confirmed that the Hoechst 32258 fluorescence intensity does decrease with a decrease in the dsDNA concentration (ESI 4, Fig. S15a†). Second, we have established that the Hoechst 32258 fluorescence intensity remains almost unchanged when the probe/dsDNA solution is irradiated using a 447 nm laser without the NCs (Fig. 6e) or when using undoped NCs (Fig. S16a†). Third, it was demonstrated that the irradiation of both LiYF4:Pr3+/Yb3+ and NaYF4:Pr3+/Yb3+ NCs with a 447 nm laser led to a decrease in the Hoechst 32258 fluorescence intensity, meaning that a smaller amount of dsDNA was present in the solutions after irradiation (i.e., denaturation of dsDNA to ssDNA did take place). Quantification of the denaturation process using the obtained calibration curve allowed us to conclude that around 23.9% and 20.7% of dsDNA was unwound after 40 min of 447 nm laser irradiation of NaYF4:Pr3+/Yb3+ and LiYF4:Pr3+/Yb3+ NCs, respectively (ESI 4, Fig. S15b†).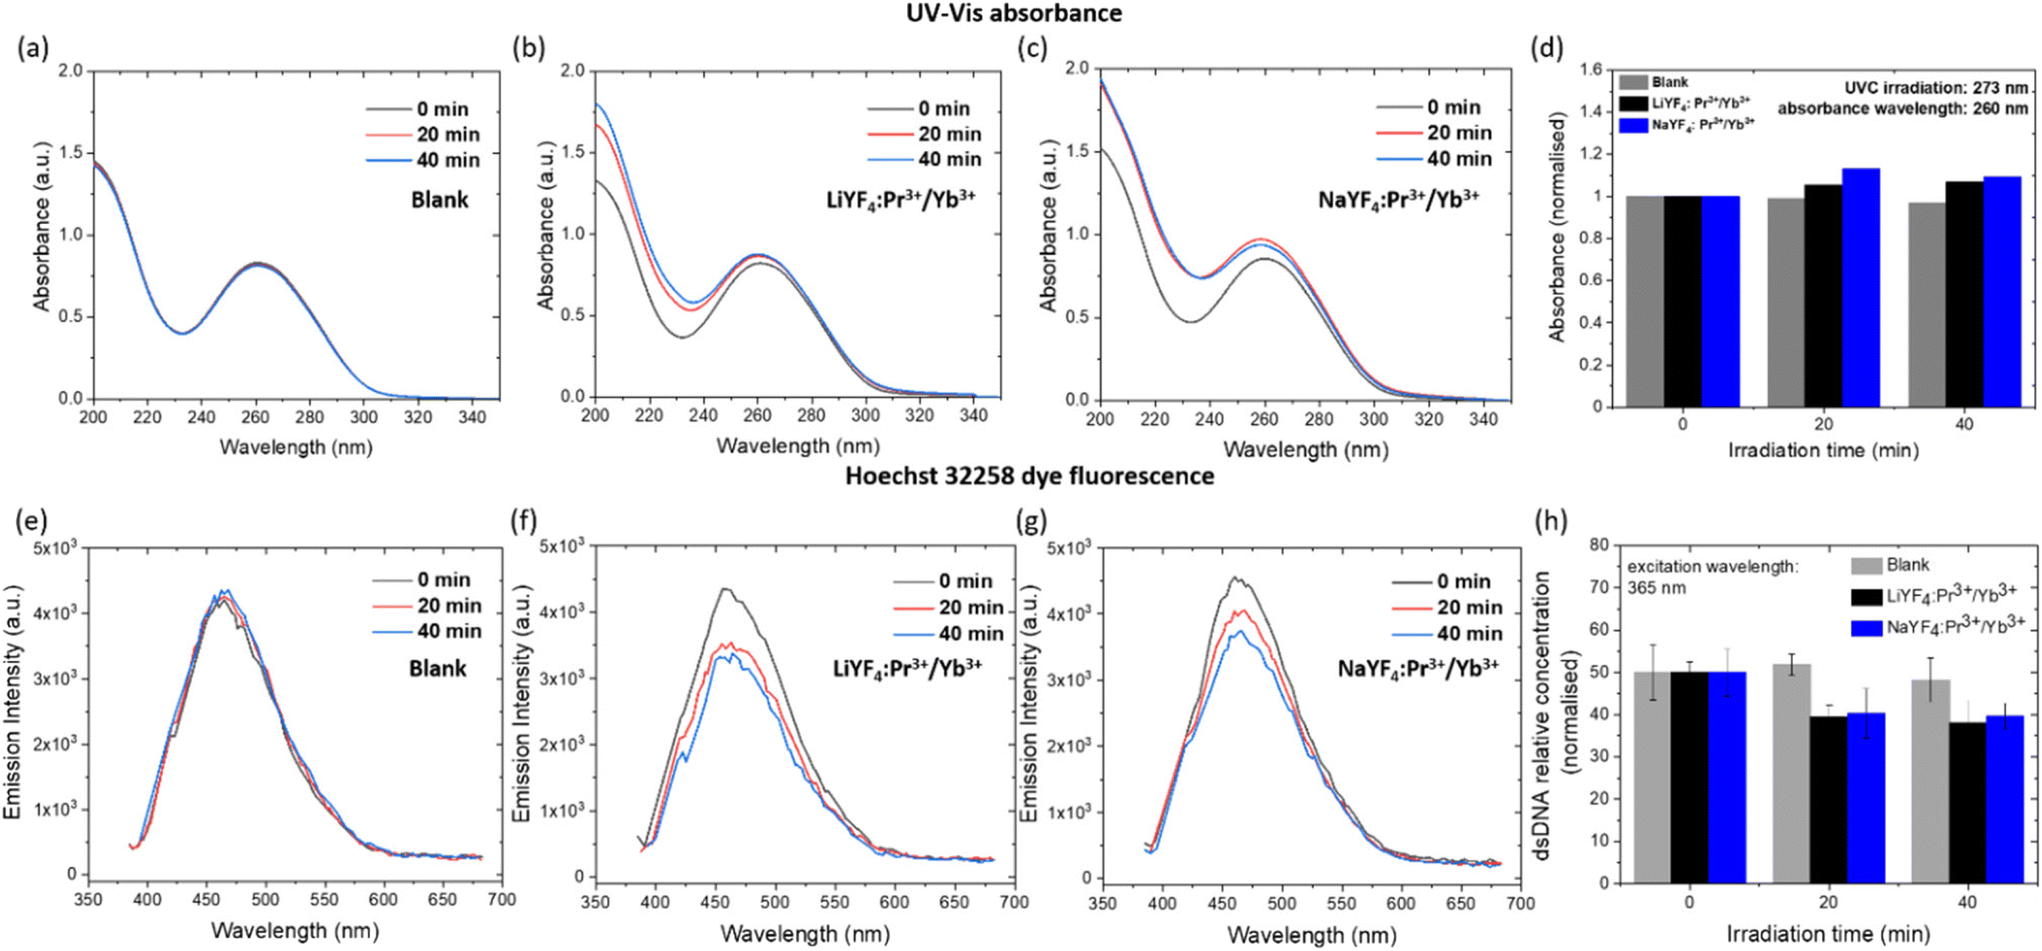 | ||
| Fig. 6 Determination of dsDNA denaturation caused by UVC UCL from NCs. (a–c): Optical absorption spectra of salmon sperm dsDNA solution without NCs (a), with LiYF4:Pr3+/10 mol% Yb3+ NCs (b) and with NaYF4:Pr3+/10 mol% Yb3+ NCs (c) after irradiation for 0, 20 and 40 min (d) Normalized absorbance of salmon sperm dsDNA solution at 260 nm without irradiation (0 min) and after irradiation (20 and 40 min) of blank (grey), LiYF4:Pr3+/Yb3+ NCs (black) and NaYF4:Pr3+/Yb3+ NCs (blue) containing 10 mol% Yb3+ concentration, fluorescence spectra of Hoechst 33258 dye added dsDNA solution (e) in the absence of NCs, (f) with LiYF4:Pr3+/10 mol% Yb3+ NCs and (g) with NaYF4:Pr3+/10 mol% Yb3+ NCs after irradiation using a 447 nm laser for 0, 20 and 40 min (g) The estimated amount of dsDNA after 0, 20 and 40 min of irradiation. NCs were irradiated using a 447 nm laser with a power density of ∼11 W cm−2. | ||
The presented results on the denaturation of dsDNA by the VIS-to-UVC UCL from LiYF4:Pr3+/Yb3+ and NaYF4:Pr3+/Yb3+ NCs provide an experimental proof-of-concept for utilization of these NCs for antibacterial and antiviral activities.
2.5 Application of NIR-to-NIR-II DCL from NaYF4:Pr3+/Yb3+ and LiYF4:Pr3+/Yb3+ nanocrystals for NIR-II bioimaging
The DCL PL emitted by NCs under 980 nm excitation allows us to exploit them as imaging probes in the NIR-II PL imaging modality. As shown in Fig. 7a, the Eppendorf tubes with Pr3+/Yb3+ NC suspensions provide an intense NIR-II DCL signal that can be easily imaged at a low level of background/noise. To illustrate the usability of our NCs as NIR-II luminescent probes in bioimaging, we used samples of biological tissues: bovine tooth and chicken breast. All animal tissue studies were carried out in accordance with the regulations of the Administrative Panel of Shenzhen University on Laboratory Animal Care and approved by the Animal Ethical and Welfare Committee at Shenzhen University (approval no. SZUHSC-01). A bovine tooth was prepared as described previously14 and then the cavity was drilled along the tooth axes. Next, a drop of NaYF4:Pr3+/Yb3+ suspension in CHCl3 (from the Eppendorf tube shown in Fig. 7a) was added to that cavity and the tooth was imaged. As one can see in Fig. 7b and c, an addition of the suspension allowed us to visualise the shape and deepness of the drilled cavity. It is worth noting that the thickness of the tooth tissue “wall” between the cavity and the surface was ∼1–2 mm. Moreover, the NIR-II DCL signal from the cavity could be clearly distinguished even after covering the tooth with a 4 mm thick chicken breast tissue, allowing us to visualise the cavity (Fig. 7d–g). The latter observation confirms the NIR-II bioimaging capability of our Pr3+/Yb3+ doped NCs. It should be noted that optical imaging at ∼1.3 μm has been reported to be advantageous in dentistry applications, and due to that dental enamel is most transparent in this spectral region. At the same time, highly conjugated organic molecules responsible for teeth stains do not absorb light beyond 1200 nm, and most stains are transparent at these wavelengths.65,66 In this regard, an idea about NIR-II imaging nanoprobes, which can visualise dental cavities and on demand produce localised germicide action inducible by irradiation at the specific wavelength, could be of great interest for dentistry applications.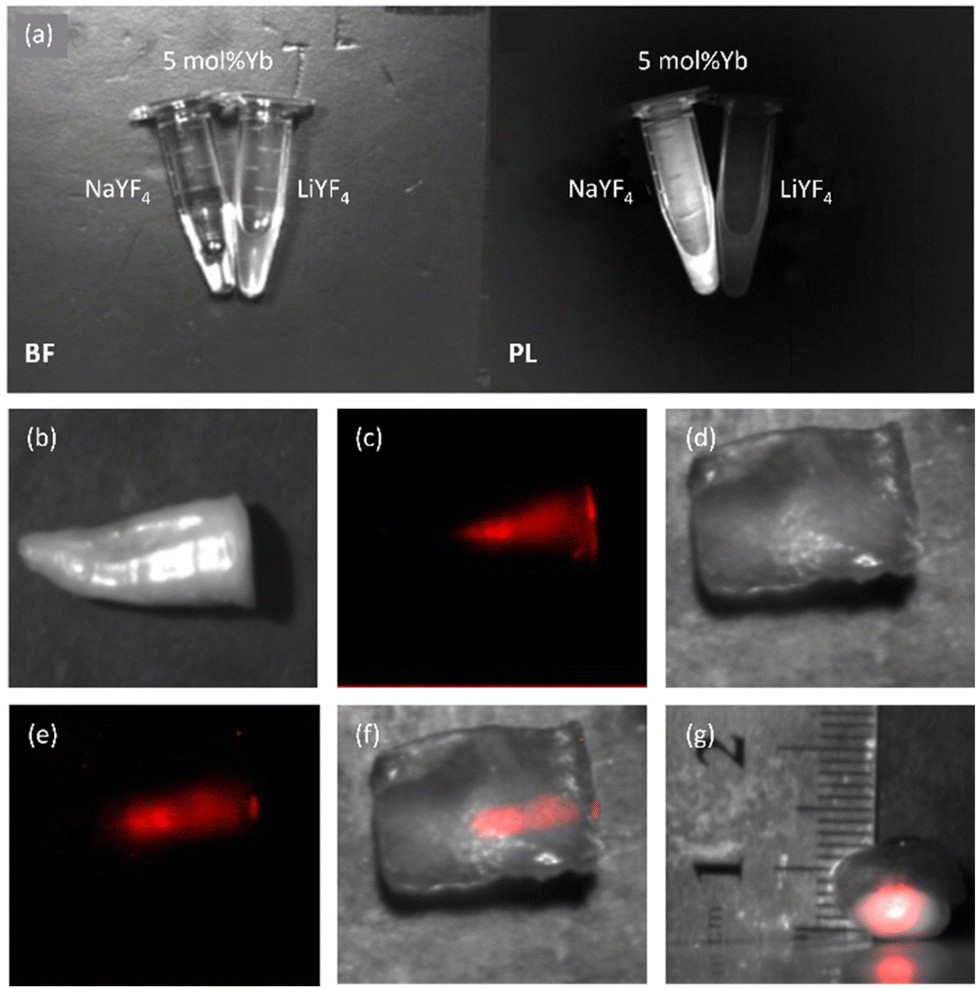 | ||
| Fig. 7 NIR-II DCL imaging ability of NCs. (a): Bright field (left) and NIR-II PL (right) images of the Eppendorf tubes with NC suspensions; (b): bright field (BF) image of the bovine tooth with a drilled cavity, where a drop of NaYF4:Pr3+/Yb3+ suspension was introduced; (c) NIR-II PL (shown in red) image of the tooth; (d): BF image of the tooth covered with 4 mm thick chicken breast flesh; (e) NIR-II PL (shown in red) image of the tooth covered with 4 mm thick chicken breast flesh; (f) merged (BF and NIR-II PL shown in red) image of the tooth covered with 4 mm thick chicken breast flesh; (g) merged (BF and NIR-II PL shown in red) side view image of the tooth covered with 4 mm thick chicken breast flesh. Excitation at 980 nm; the 1200 nm long-pass optical filter was used for NIR-II PL imaging. | ||
It is worth noting that as NIR-II DCL lifetimes are in the range of a hundred microseconds, it is possible to employ NCs as imaging agents in the time-gated NIR-II PL imaging, which provides a possibility of better imaging contrast [due to elimination (gating) of the excitation light scattering] and also can allow for PL lifetime imaging.67,68
3 Conclusions
In conclusion, we report the synthesis, characterization and proof-of-concept demonstration of possible biomedical applications for nanosized NaYF4:Pr3+/Yb3+ and LiYF4:Pr3+/Yb3+ NCs. The synthesised NCs generate UVC light under visible 447 nm excitation and, simultaneously, exhibit NIR-to-NIR-II DCL under 980 nm excitation. The NC generated UVC UCL emission peaked at ca. 275 nm was shown to cause a significant dsDNA denaturation, as it was revealed by the observation of the hyperchromicity of the irradiated dsDNA solution and by a standard FADU assay determining the unwinding of dsDNA under irradiation with UVC UCL from NCs. At the same time, the 980 nm laser excited NIR-II DCL (peaked at ca. 1320 nm) allowed for NIR-II imaging of NCs through biological tissues, as it was demonstrated using the samples of bovine tooth and chicken breast flesh. These results proved that the synthesised NaYF4 and LiYF4 nanocrystals are suitable hosts for co-doping with Pr3+ and Yb3+ to generate UVC UCL emission under visible excitation along with NIR-II DCL emission under both visible and NIR excitation. As the DCL and UCL processes are observed under different excitation wavelengths, precise control of the desirable modes of action (i.e., imaging or germicide in imaging guided antimicrobial or antiviral applications) is possible. The introduced approach opens up perspectives for the development of a whole class of bifunctional nanomaterials for optical imaging and photoactivation. The facile and well established surface functionalization methods can be applied to NaYF4 and LiYF4 NCs, allowing for their use in various application specific environments (e.g., transferring to water for biorelated applications or dispersing in organic solvents for application as a dopant in antimicrobial surface coatings). Further optimization of the design of bifunctional nanoparticles is on the way to improve the efficiency of both functionalities (photoactivation and imaging) for imaging guided antimicrobial and antiviral applications.Author contributions
M. Y. Tsang: material synthesis, characterization and spectroscopic study, data analysis, and manuscript drafting and editing. P. Fałat: material synthesis, characterization and spectroscopy, data analysis and manuscript editing. M. A. Antoniak: material synthesis and characterization, data analysis and manuscript editing. R. Ziniuk: NIR luminescence spectroscopy and imaging studies and data analysis. S. J. Zelewski: spectroscopic study, data analysis and manuscript editing. M. Samoć: guidance and manuscript review and editing. M. Nyk: conceptualization, experimental and material consultation, and manuscript review and editing. J. Qu: data analysis and manuscript review and editing. T. Y. Ohulchanskyy: conceiving the idea, funding acquisition, design and guidance of the research, supervision, and manuscript writing and editing. D. Wawrzyńczyk: funding acquisition, design and guidance of research project, supervision, and manuscript writing and editing.Conflicts of interest
There are no conflicts to declare.Acknowledgements
This work is supported by the National Science Centre, Poland (NCN) under the SHENG I research grant (no. UMO-2018/30/Q/ST5/00634) and by the National Natural Science Foundation of China (61875135 and 61961136005) and the Shenzhen Basic Research Project (JCYJ20170818090620324). M. Antoniak is supported by the Foundation for Polish Science (FNP). We thank Prof. Piotr Jamróz (Wroclaw University of Science and Technology) for help with ICP measurements and Siqi Gao (Shenzhen University) for help with NIR-II DCL imaging.References
- D. Kang, E. Jeon, S. Kim and J. Lee, BioChip J., 2020, 14, 124–135 CrossRef CAS.
- A. Nadort, J. Zhao and E. M. Goldys, Nanoscale, 2016, 8, 13099–13130 RSC.
- P. A. Tanner, Lanthanide Luminescence in Solids, Springer International Publishing, 2010 Search PubMed.
- X. Chen, Y. Liu and D. Tu, Lanthanide-Doped Luminescent Nanomaterials, 2014 Search PubMed.
- D. Kumar, K. Verma, S. Verma, B. Chaudhary and S. Som, Phys. B, 2018, 535, 278–286 CrossRef CAS.
- D. Kumar, S. K. Sharma, S. Verma, V. Sharma and V. Kumar, Mater. Today: Proc., 2020, 21, 1868–1874 CAS.
- A. A. Ansari, V. K. Thakur and G. Chen, Coord. Chem. Rev., 2021, 436, 213821 CrossRef CAS.
- E. S. Tsai, S. F. Himmelstoß, L. M. Wiesholler, T. Hirsch and E. A. H. Hall, Analyst, 2019, 144, 5547–5557 RSC.
- N. Chowdhury, N. Riesen and H. Riesen, ACS Appl. Nano Mater., 2021, 4, 6659–6667 CrossRef CAS.
- L. Shao, D. Liu, J. Lyu, D. Zhou, N. Ding, R. Sun, W. Xu, N. Wang, S. Xu, B. Dong and H. Song, Mater. Today Phys., 2021, 21, 100495 CrossRef CAS.
- C. Song, S. Zhang, Q. Zhou, H. Hai, D. Zhao and Y. Hui, Nanotechnol. Rev., 2017, 6, 233–242 CAS.
- H. Jee, G. Chen, P. N. Prasad, T. Y. Ohulchanskyy and J. Lee, Nanomaterials, 2020, 10, 1–9 CrossRef PubMed.
- J. Shen, G. Chen, T. Y. Ohulchanskyy, S. J. Kesseli, S. Buchholz, Z. Li, P. N. Prasad and G. Han, Small, 2013, 9, 3213–3217 CrossRef CAS.
- A. Yakovliev, T. Y. Ohulchanskyy, R. Ziniuk, T. Dias, X. Wang, H. Xu, G. Chen, J. Qu and A. S. L. Gomes, Part. Part. Syst. Charact., 2020, 37, 1–8 CrossRef.
- H. Li, X. Wang, T. Y. Ohulchanskyy and G. Chen, Adv. Mater., 2021, 33, 1–17 CAS.
- A. P. Jadhav, S. Khan, S. J. Kim and S.-H. Cho, Appl. Sci. Converg. Technol., 2014, 23, 221–239 CrossRef.
- L. R. R. Nunes, H. P. Labaki, F. J. Caixeta and R. R. Gonçalves, J. Lumin., 2022, 241, 118485 CrossRef CAS.
- G. Chen, T. Y. Ohulchanskyy, S. Liu, W. Law, F. Wu, M. T. Swihart and C. E. T. Al, ACS Nano, 2012, 6, 2969–2977 CrossRef CAS PubMed.
- S. Golovynskyi, I. Golovynska, L. I. Stepanova, O. I. Datsenko, L. Liu, J. Qu and T. Y. Ohulchanskyy, J. Biophotonics, 2018, 11, 1–12 CrossRef PubMed.
- D. Wang, B. Xue, T. Y. Ohulchanskyy, Y. Liu, A. Yakovliev, R. Ziniuk, M. Xu, J. Song, J. Qu and Z. Yuan, Biomaterials, 2020, 251, 120088 CrossRef CAS PubMed.
- Z. Yu, X. Fu, S. Zheng and H. Zhang, J. Lumin., 2021, 231, 117753 CrossRef CAS.
- C. Chen, R. Tian, Y. Zeng, C. Chu and G. Liu, Bioconjugate Chem., 2020, 31, 276–292 CrossRef CAS PubMed.
- J. Zhao, D. Zhong and S. Zhou, J. Mater. Chem. B, 2018, 6, 349–365 RSC.
- N. M. Idris, M. K. G. Jayakumar, A. Bansal and Y. Zhang, Chem. Soc. Rev., 2015, 44, 1449–1478 RSC.
- N. V. Clark, S. P. Endicott, E. M. Jorgensen, H. C. Hur, E. G. Lockrow, M. E. Kern, C. E. Jones-Cox, S. G. Dunlow, J. I. Einarsson and S. L. Cohen, J. Minim. Invasive Gynecol., 2018, 25, 1157–1164 CrossRef PubMed.
- J. H. Yoo, Infect. Chemother., 2018, 50, 101–109 CrossRef CAS PubMed.
- E. Z. Xu, C. Lee, S. D. Pritzl, A. S. Chen, T. Lohmueller, B. E. Cohen, E. M. Chan and P. J. Schuck, Opt. Mater.: X, 2021, 12, 100099 CAS.
- M. Raeiszadeh and B. Adeli, ACS Photonics, 2020, 7, 2941–2951 CrossRef CAS.
- T. Dai, M. S. Vrahas, C. K. Murray and M. R. Hamblin, Expert Rev. Anti-Infect. Ther., 2012, 10, 185–195 CrossRef CAS.
- C. C. Tseng and C. S. Li, Aerosol Sci. Technol., 2005, 39, 1136–1142 CrossRef CAS.
- M. D'Abramo, C. L. Castellazzi, M. Orozco and A. Amadei, J. Phys. Chem. B, 2013, 117, 8697–8704 CrossRef PubMed.
- Y. Du, X. Ai, Z. Li, T. Sun, Y. Huang, X. Zeng, X. Chen, F. Rao and F. Wang, Adv. Photonics Res., 2021, 2, 2000213 CrossRef.
- E. L. Cates and F. Li, RSC Adv., 2016, 6, 22791–22796 RSC.
- E. L. Cates and J. H. Kim, Opt. Mater., 2013, 35, 2347–2351 CrossRef CAS.
- A. M. Srivastava, J. Lumin., 2016, 169, 445–449 CrossRef CAS.
- Z. Yin, P. Yuan, Z. Zhu, T. Li and Y. Yang, Ceram. Int., 2021, 47, 4858–4863 CrossRef CAS.
- E. L. Cates, M. Cho and J. H. Kim, Environ. Sci. Technol., 2011, 45, 3680–3686 CrossRef CAS.
- Y. A. Y. Ang, Opt. Lett., 2016, 41, 792–795 CrossRef PubMed.
- K. J. Kim, A. Jouini, A. Yoshikawa, R. Simura, G. Boulon and T. Fukuda, J. Cryst. Growth, 2007, 299, 171–177 CrossRef CAS.
- D. Yang, Z. Peng, Q. Zhan, X. Huang, X. Peng, X. Guo, G. Dong and J. Qiu, Small, 2019, 15, 1–9 Search PubMed.
- P. A. Hansen, S. Kumar and A. Meijerink, J. Lumin., 2021, 235, 118012 CrossRef CAS.
- S. Hao, W. Shao, H. Qiu, Y. Shang, R. Fan, X. Guo, L. Zhao, G. Chen and C. Yang, RSC Adv., 2014, 4, 56302–56306 RSC.
- D. Wang, W. Wu, X. Tan, B. A. Goodman, S. Xu and W. Deng, Crystals, 2021, 11, 1328 CrossRef CAS.
- M. Seshadri, M. J. V. Bell, V. Anjos and Y. Messaddeq, J. Rare Earths, 2021, 39, 33–42 CrossRef CAS.
- M. R. M. de Sousa, T. O. Sales, W. Q. Santos, W. F. Silva and C. Jacinto, J. Lumin., 2021, 233, 117919 CrossRef CAS.
- K. Michaelian and N. S. Padilla, Heliyon, 2019, 5, 01902 CrossRef PubMed.
- S. Majumdar, T. Guha, F. Barman and R. Kundu, Natl. Acad. Sci. Lett., 2020, 43, 389–392 CrossRef CAS.
- D. Wawrzyńczyk, B. Cichy, J. K. ZarÈ©ba and U. Bazylińska, J. Mater. Chem. C, 2019, 7, 15021–15034 RSC.
- G. Chen, T. Y. Ohulchanskyy, A. Kachynski, H. Ågren and P. N. Prasad, ACS Nano, 2011, 5, 4981–4986 CrossRef CAS PubMed.
- K. A. Abel, J. C. Boyer and F. C. J. M. Van Veggel, J. Am. Chem. Soc., 2009, 131, 14644–14645 CrossRef CAS PubMed.
- Z. P. Bian, D. S. Li, X. Zhao and H. Lin, Radiat. Phys. Chem., 2018, 151, 126–132 CrossRef CAS.
- F. Reichert, F. Moglia, D. T. Marzahl, P. Metz, M. Fechner, N.-O. Hansen and G. Huber, Opt. Express, 2012, 20(18), 20387–20395 CrossRef CAS PubMed.
- M. Ploydaeng, N. Rajatanavin and P. Rattanakaemakorn, Photodermatol., Photoimmunol. Photomed., 2021, 37, 12–19 CrossRef CAS PubMed.
- S. L. Cates, E. L. Cates, M. Cho and J. H. Kim, Environ. Sci. Technol., 2014, 48, 2290–2297 CAS.
- A. Lyons, D. Oren, T. Roger, V. Savinov, J. Valente, S. Vezzoli, N. I. Zheludev, M. Segev and D. Faccio, Phys. Rev. A, 2019, 99, 1–5 CrossRef.
- S. L. Chen, J. Stehr, N. K. Reddy, C. W. Tu, W. M. Chen and I. A. Buyanova, Appl. Phys. B: Lasers Opt., 2012, 108, 919–924 CrossRef CAS.
- E. Robbins, S. Leroy-lhez, N. Villandier, M. Samoć and K. Matczyszyn, Molecules, 2021, 26, 6323 CrossRef CAS PubMed.
- B. Chen and F. Wang, Acc. Chem. Res., 2020, 53, 358–367 CrossRef CAS PubMed.
- Z. Wang and A. Meijerink, J. Phys. Chem. C, 2018, 122, 26298–26306 CrossRef CAS PubMed.
- C. M. Lovett, T. N. Fitzgibbon and R. Chang, J. Chem. Educ., 1989, 66, 526–528 CrossRef CAS.
- R. P. Rastogi, Richa, A. Kumar, M. B. Tyagi and R. P. Sinha, J. Nucleic Acids, 2010, 32 Search PubMed.
- C. Baumstark-Khan, U. Hentschel, Y. Nikandrova, J. Krug and G. Horneck, Photochem. Photobiol., 2000, 72, 477 CrossRef CAS.
- Y. Guan, R. Shi, X. Li, M. Zhao and Y. Li, J. Phys. Chem. B, 2007, 111, 7336–7344 CrossRef CAS.
- G. C. Jagetia and V. A. Venkatesha, Nutr. Res., 2006, 26, 303–311 CrossRef CAS.
- C. Ng, E. C. Almaz, J. C. Simon, D. Fried and C. L. Darling, J. Biomed. Opt., 2019, 24, 1 Search PubMed.
- D. Fried, Opt. Photonics News, 2020, 31, 48–53 CrossRef.
- R. Ziniuk, A. Yakovliev, H. Li, G. Chen, J. Qu and T. Y. Ohulchanskyy, Front. Chem., 2021, 9, 1–10 Search PubMed.
- R. Ziniuk, A. Yakovliev, J. Qu and T. Y. Ohulchanskyy, Proc. SPIE, 2019, 11209, 112095E Search PubMed.
Footnote |
| † Electronic supplementary information (ESI) available. See DOI: https://doi.org/10.1039/d2nr01680j |
| This journal is © The Royal Society of Chemistry 2022 |