 Open Access Article
Geometry transformation of ionic surfactants and adsorption behavior on water/n-decane-interface: calculation by molecular dynamics simulation and DFT study†
Wannian Zhang‡
abc,
Ming-Yuan Zhang‡c,
Kai Wangbc,
Ruixia Sunc,
Shanlin Zhaoac,
Zhiqiang Zhang*a,
Yu-Peng He *abc and
Fang Yu
 *bc
*bc
aKey Laboratory for Functional Material, Educational Department of Liaoning Province, School of Chemical Engineering, University of Science and Technology Liaoning, Anshan 114051, P. R. China. E-mail: zzq@ustl.edu.cn; yupeng.he@lnpu.edu.cn
bState Key Laboratory of Fine Chemicals, Ningbo Institute of Dalian University of Technology, No. 26 Yucai Road, Jiangbei District, Ningbo, 315016, P. R. China. E-mail: fang.yu@lnpu.edu.cn
cKey Laboratory of Petrochemical Catalytic Science and Technology, Liaoning Petrochemical University, Dandong Lu West 1, Fushun 113001, Liaoning, P. R. China. Tel: +86-2456860548
First published on 20th August 2021
Abstract
Understanding the effect of surfactant structure on their ability to modify interfacial properties is of great scientific and industrial interest. In this work, we have synthesized four amide based ionic surfactants under acidic or basic conditions, including CTHA·HCl, CTEA·HCl, CTHA−Na+ and CTEA−Na+. Experiments have proved that the anionic surfactant with polyethylene oxide groups (CTEA−Na+) had the lowest surface tension on the water/n-decane interface. Molecular dynamics simulations have been applied to investigate the structural effect on the adsorption behavior of four different surfactants. The surface tension, interface thickness, interface formation energy, density profiles, order parameters, radial distribution function on the water/n-decane interfaces were calculated and compared. During the equilibrium states, we found that the interface configuration of two cationic surfactants are almost linear while the two anionic surfactants are changed to bending shapes due to the different positions of the hydrophilic head groups. Further DFT study and wavefunction analysis of surfactants have shown that CTEA−Na+ can form stronger vdW interactions with n-decane molecules due to a more neutral electrostatic potential distribution. Meanwhile, the introduction of polyethylene oxide groups has offered more H-bonding sites and resulted in more concentrated H-bonding interactions with water molecules. The difference of weak interactions may contribute to the conformational change and finally affect the interface properties of these ionic surfactants.
Introduction
Amide based ionic surfactants,1 typically consisting of both amide bond and acidic or basic groups as hydrophilic moieties, have gained substantial interest during the past decades. Their amphiphilicity enables these amide based surfactants to adsorb on the interface and significantly reduce the interfacial tension. Due to the unique structural feature and interfacial properties, amide based ionic surfactants are widely used in daily life and industrial processes, including detergents, food and cosmetics, and especially in large-scale operations of oil extraction2 as oil displacement agents.Recently, due to the wide application of amide ionic surfactants in oilfield chemistry, research about structural influence on the related absorption behavior on water/n-decane interface to mimic a simplified oil environment has received substantial attentions.3 Molecular design and synthesis have a significant influence on absorption behavior of amide based ionic surfactants,4 including changing the type and position of hydrophilic heads or the component and length of hydrophobic tails.5 Moreover, adjusting pH value could obtain both cationic and anionic surfactant due to the structural feature of amide based ionic surfactants.6 However, investigation of the structural effect on interfacial properties of amide based ionic surfactants on water/n-decane interface is limited. Especially, research about interpretation the weak interactions between the ionic surfactants, oil phase and water molecules at a quantum level is extremely limited.
Recent elegant computational works have confirmed that molecular dynamics (MD) simulation is an effective tool to probe the adsorption behavior of surfactant7 on oil/water interfaces. Ding group studied the structural influence of sulfobetaine-type ionic surfactant to the water/n-decane interface.8 Shiling Yuan and co-workers have studied that when the attaching position of benzenesulphonate group has shifted from one side to the middle of the dodecyl chain of SDBS, the molecular aggregation behaviors have been dramatically changed.9 Despite these pioneering works, however, limited research has given deeper interpretation about the weak interactions between the ionic surfactants and oil environment the quantum level.
In this work, based on our previous research,4f we initially synthesized CTHA as an ionic surfactant. We then introduced polyethylene oxide groups to the hydrophobic tail and obtained CTEA. As a result, two cationic surfactants CTHA·HCl, CTEA·HCl, and then two anionic surfactants CTHA−Na+, CTEA−Na+ were formed by treatment of NaOH. The surface tension of these four surfactants was measured. Subsequently, molecular dynamics simulation at the water/n-decane interface was utilized for shedding light to the relationship between monomer geometry of ionic surfactants and their interfacial behavior. Next, conformational and dynamical properties of surfactant molecules were evaluated by the analysis of the molecular orientation, the interfacial formation energy, and the thickness of the system. In addition, in order to study the effect of polyethylene oxide groups in the carbohydrate chain, the radial distribution function (RDF) was measured between the hydrophilic ion head groups and water. Finally, further DFT study10 and wavefunction analysis of surfactants have offered a more fundamental study of weak interactions, including contribution and distribution of electrostatic and dispersion action.
Results and discussion
Synthesis
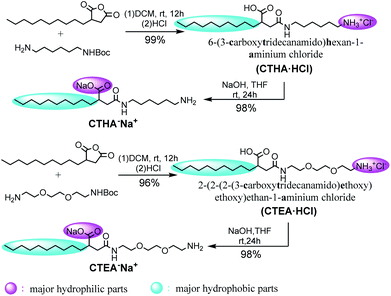
Four different surfactant molecules were designed and synthesized (Scheme 1). First, decylsuccinic anhydride underwent ring-opening reaction with Boc-protected diamine and glycol included diamine to obtain N-acetyl carboxylic acids CTHA·HCl and CHEA·HCl (at this time, the carboxyl group was not protonated). Then these cationic structures were converted to anionic molecules by treatment with NaOH and the carboxyl group was protonated to form sodium salts. The whole synthetic route featured a high yield and a mild condition under room temperature (detailed information see ESI†). The ionic structures differed in the polarity and position of the head groups as well as the component of the alkyl chain.Equilibrated system: surfactant conformation
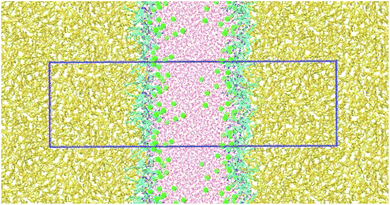
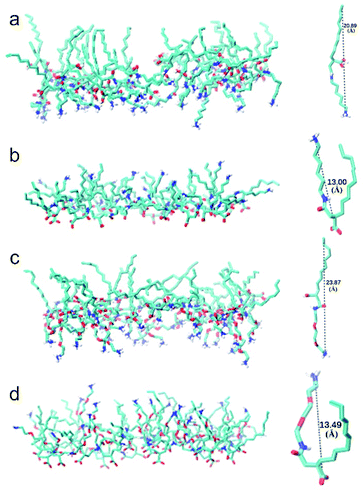
Snapshot of simulated CTHA·HCl monolayer was shown in Fig. 1. The water phase was in the middle and the n-decane phases were on both sides. All surfactants stayed at the interfaces, and none of them diffused into the bulk phases and alkyl chains were randomly oriented in monolayer systems during the whole simulation processes (all the equilibrium states of MD simulation are shown in the Fig. S3† and all the RMSD of MD simulation are shown in the Fig. S4.†). Direct contact between oil and water phases were still observed. The n-decane solvated the surfactant tails and prevented them from aggregating together. Monomolecular configurations of four surfactants at the equilibrium states were extracted and shown in Fig. 2. The extracted individual molecular configurations of four surfactants at the interface were altered with different pH values. The hydrophilic group of CTHA·HCl and CTEA·HCl anionic surfactants located at the terminal of the molecules, and the configurations were almost stretched to a liner shape. In contrast, the hydrophilic groups of CTHA−Na+ and CTEA−Na+ salts were in the middle of the main chain and the configurations were bent to a bending shape, while the hydrophobic alkyl chain went deeply into the oil phase.Interfacial tension
The interfacial tension (γsim) was calculated according to the Kirkwood–Buff theory.11
 | (1) |
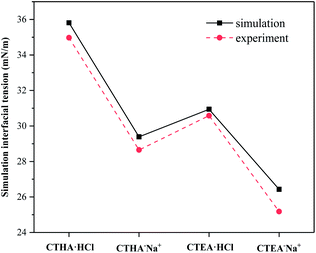
The interfacial tension of the bare water/n-decane interface was calculated to be 51.4 mN m−1, which corresponded perfectly with the experimental value of 51.7 mN m−1,12 and the interfacial tension γsim of the monolayer systems also agreed well with the experimental values at similar temperatures at the critical micelle concentration (CMC) γcmc (see ESI Table S1†). The critical surface tension of the anionic surfactants (CTHA−Na+ and CTEA−Na+) was lower than that of the cationic surfactants (CTHA·HCl and CTEA·HCl). Secondly, the surfactant CTEA−Na+ surfactant with polyethylene oxide groups has the lowest surface tension (experimental γcmc = 25.2 mN m−1 and calculated 26.4 mN m−1).
Interface formation energy
To compare the energetic stability of each system, the interface formation energy (IFE) was defined and calculated as follows:
 | (2) |
The value of IFE is a measure of the average intermolecular interaction per surfactant molecule arising from the insertion of one surfactant molecule into the n-decane–water interface. Etotal denoted the energies of the whole system. Esurfactant,single was calculated from a separate 5 ns MD simulation in vacuum at the same temperature of every single surfactant. Edecane–water was also calculated at the same temperature for 5 ns (Fig. 3).
Calculated IFE was summarized in Table 1. It can be seen from the table that the Etotal, Esurfactant,single of CTEA−Na+ surfactants and IFE were the lowest, which means that the CTEA−Na+-mediated interface was the most stable in terms of energy.
| System | Etotala (kJ mol−1) | Esurfactant,singleb (kJ mol−1) | IFEc (kJ mol−1) |
|---|---|---|---|
a The energy of whole system. The energy of bare n-decane–water system. Edecane–water: −146![[thin space (1/6-em)]](https://www.rsc.org/images/entities/char_2009.gif) 418 kJ mol−1.b The energy of single surfactant molecule.c Interface formation energy (IFE), the cross-sectional area is 5 × 5 nm2, IFE data is derived from the average of all equilibrium states. 418 kJ mol−1.b The energy of single surfactant molecule.c Interface formation energy (IFE), the cross-sectional area is 5 × 5 nm2, IFE data is derived from the average of all equilibrium states. |
|||
| CTHA·HCl | −183![[thin space (1/6-em)]](https://www.rsc.org/images/entities/char_2009.gif) 523 523 |
−386.098 | −232.318 |
| CTHA−Na+ | −188![[thin space (1/6-em)]](https://www.rsc.org/images/entities/char_2009.gif) 001 001 |
−403.245 | −285.149 |
| CTEA·HCl | −185![[thin space (1/6-em)]](https://www.rsc.org/images/entities/char_2009.gif) 277 277 |
−396.63 | −251.02 |
| CTEA−Na+ | −190![[thin space (1/6-em)]](https://www.rsc.org/images/entities/char_2009.gif) 153 153 |
−443.767 | −289.805 |
Density profiles
Density profiles along the z axis are shown in Fig. 4. It should be noted that the densities of each phase in the n-decane–surfactant–water system (black line, 0.723 ± 0.005 g cm−3 for n-decane and red line, 0.994 ± 0.005 g cm−3 for water) agreed well with those of the pure bulk phase (0.725 g cm−3 for n-decane13 and 0.997 g cm−3 for water).14 This showed that the simulation was sufficiently large enough to study a realistic interface between two bulk phases. Most of the ions stay between the water and the surfactant monolayer during simulation time and the Na+/Cl− ions (green line) bound to ionic head-groups (orange line) at the interface.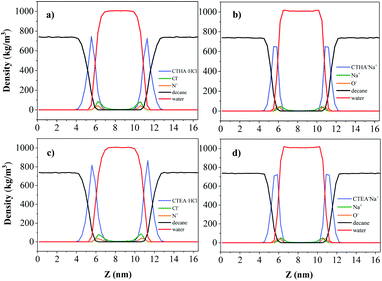 | ||
| Fig. 4 Density profiles along the z axis: n-decane (black), water (red), Na+/Cl− ions (green), N+/O− ions (orange) for (from left to right) (a) CTHA·HCl, (b) CTHA−Na+, (c) CTEA·HCl and (d) CTEA−Na+. | ||
Interfacial thickness
To further characterize the interface, we have calculated the interfacial thickness as shown in Table 2. Then, we defined the thickness as the distance between the two positions where the densities of the n-decane and water phases are at 90% of their respective bulk densities obtained from the density profiles.15 The thickness of the top and bottom interfaces were measured independently, and the reported thickness is an average thickness of the top and bottom.| System | tia (nm) | ttotalb (nm) | Lzc (nm) | |
|---|---|---|---|---|
| a i = oil or water. toil and twater are defined as the 10–90 thickness of the n-decane and water phases, respectively.b ttotal are defined as the 90–90 thickness of the n-decane and water phases.c Lz: height of the box. | ||||
| n-Decane–water | n-Decane | 0.33 | 0.41 | 15.004 |
| Water | 0.38 | |||
| CTHA·HCl | n-Decane | 1.16 | 1.71 | 16.860 |
| Water | 0.74 | |||
| CTHA−Na+ | n-Decane | 0.82 | 1.47 | 16.814 |
| Water | 0.50 | |||
| CTEA·HCl | n-Decane | 1.10 | 1.72 | 16.878 |
| Water | 0.79 | |||
| CTEA−Na+ | n-Decane | 0.85 | 1.50 | 16.842 |
| Water | 0.53 | |||
For the bare n-decane-water interface (in the absence of surfactants), the interfacial thickness was determined to be 4.10 Å, which was in good agreement with the measured thickness (4.6 ± 0.2 Å) observed from the reported synchrotron X-ray reflectivity experiment.12
From the results in Table 2, it was clear that the interfaces thickness (ti) of water/n-decane were broadened with the addition of a surfactant because n-decane and water penetrated hydrophobic alkyl tails and polar groups, respectively. Interestingly, this interface broadening occurred mainly in the n-decane side and was strongly dependent on the attachment position of hydrophilic groups in the surfactant backbones. When the attaching positions shifting form one side to the middle of molecules, configurations of individual molecules at the interface dramatically changed from linear to bending shape. It can be seen that interface thickness (ttotal) and box height (Lz) of CTHA·HCl and CTEA·HCl were both thicker and higher than those of CTHA−Na+ and CTEA−Na+. By comparing anionic surfactants (CTHA−Na+ and CTEA−Na+), we found that thicker thickness of the interface matched with lower the interfacial tension. Moreover, after careful observation, surfactant molecules with the addition of polyethylene oxide groups (CTEA·HCl and CTEA−Na+) had thicker interface for ttotal due to the better miscibility in the oil and water phases.
Order parameter
A previous simulation study4a found that when the monomer structure was similar to each other, the changing trend of the surface tension was contrary to that for order parameter. Calculation of order parameters for surfactants could be used to evaluate its capacity in the reduction of surface tension. To analyze the conformation of the surfactant molecules in the monolayer, we have calculated the order parameter for the 10 terminal carbons of the primary alkyl chain. These 10 carbons represent the effective length of the surfactant tail. The order parameter is given by
 | (3) |
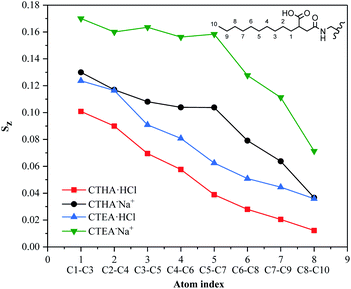
Sz, for all four surfactants was given in Fig. 5. The detailed information on how each tail atom was oriented could be seen from the average order parameters of each atom with the same index. The Sz of each atom for all surfactants decreased monotonically from near the interface to the far end of the tails from 1–10. The order of the vectors contacting the water phase was governed by the head group, they tended to interact with as many water molecules as possible to make the system more stable, so the vector value closer to the ion head group was higher (such as 1–3). Furthermore, the CTHA−Na+ and CTEA−Na+ tail chains were closer to the hydrophilic head groups, so the Sz value is higher (green and black line). The decrease of Sz indicated the surfactants were flexible and random in orientation.
Head group solvation
The structure of liquids can often be well characterized by the radial distribution function (RDF) of atomic density.| gAB(r) = 〈ρB(r)〉/〈ρB〉local | (4) |
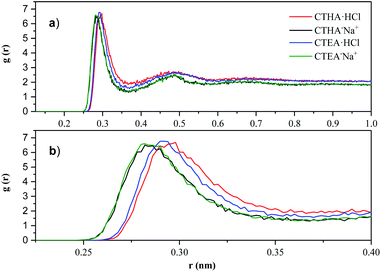 | ||
| Fig. 6 (a) N+-OW RDF of CTHA·HCl and CTEA·HCl (red line and blue line); O−-OW RDF of CTHA−Na+ and CTEA−Na+ (black line and green line). (b) Magnified image of the first peak of (a). | ||
In Fig. 6a, the peak heights of different surfactants and different concentrations were basically the same. However, at the peak position, the N+-OW RDF of CTHA·HCl and CTEA·HCl (red line and blue line) showed one large peak at 0.28 nm with a much smaller second peak at 0.49 nm, indicating the locations of the first and second solvation shell of the surfactant head groups, and a small third peak can be observed at around 0.65 nm. The first and second solvated shells of the O−-OW RDF for CTHA−Na+ and CTEA−Na+ (black line and green line) anionic surfactants were around 0.26 nm and 0.49 nm, respectively. Similarly, a small third peak could be observed at about 0.7 nm. As can be seen from Fig. 6b, the hydrophilic ion head group of CTHA−Na+ and CTEA−Na+ (black line and green line) was much closer to the oxygen atom in water, and the stronger the hydrogen bond could be formed.
Number of hydrogen bonds
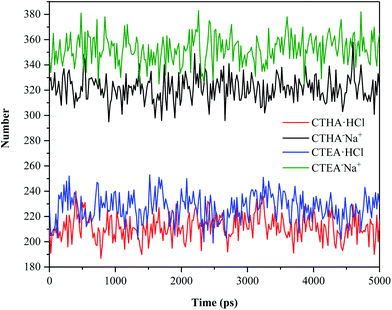
To compare the hydrophilicity of the four surfactants, the number of hydrogen bonds formed in the entire trajectories of the four systems was calculated (Fig. 7). The hydrogen bond geometry criterion we use defaults to R–A (3.5 Å to 30°).16 The number of hydrogen bonds between the two anionic surfactants and water was far greater than that between the two cationic surfactants and water (green and black line vs. blue and red line), which matched well with RDF data. However, as seen from anionic surfactants, CTEA−Na+ molecules also had more hydrogen bonds with water than CTHA−Na+ molecules due to the polyethylene oxide groups.DFT study and wavefunction analysis
Considering the structural modification of the hydrophilic groups and the different interface properties of the four surfactant molecules, it is meaningful to analyze the electrostatic potential (ESP) distribution (Fig. 8). ESP is a result of wavefunction analysis at a quantum level and could further display the details of dispersion and electrostatic interactions of surfactant molecules, offering crucial information to understand the weak interactions. In all the four ionic surfactants, the blue region is strongly negative while (amide group, ammonium salt, carboxylic acid and counter ion Cl−) the red region is strongly positive (H+ and counter ion Na+). Except these counter ions, sites that can act as H-bond donors and/or acceptors in the surfactant molecules were clearly exhibited. Moreover, the introduction of polyethylene oxide groups enhanced the negative potential of the hydrophilic group and resulted in more hydrogen bonding sites, which can form more density H-bonding interactions on the interface (Fig. 8c and d). In Fig. 8b and d (CTHA−Na+/CTEA−Na+), the ESP of the hydrophobic chains of the two anionic surfactants tends to be zero and is more neutral than cationic surfactants in Fig. 8a and c. Usually, neutral ESP is considered to be the dominant role of van der Waals effect of hydrocarbon chains, including dispersion and exchange- repulsion potential.7d Therefore, CTHA−Na+/CTEA−Na+ can better interact with n-decane through van der Waals than CTHA·HCl and CTEA·HCl (Fig. 8a and c).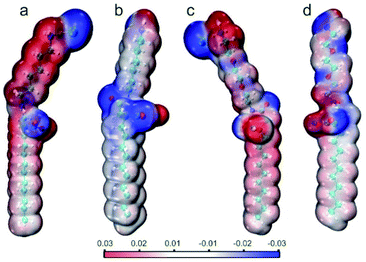 | ||
| Fig. 8 Electrostatic potential (ESP) distribution of (a) CTHA·HCl, (b) CTHA−Na+ (c) CTEA·HCl, and (d) CTEA−Na+. | ||
In order to better illustrate relationship between weak interactions and the adsorption conformation from a more microscopic respect, one target surfactant and other molecules within 5 Å (including water molecules, n-decane molecules and other surfactant molecules) during the MD equilibrium state were chosen as the research object and weak interactions were investigated by Multiwfn 3.8, mainly including H-bonding and vdW interactions.
It was clear from Fig. 9a and d, the conformation of cyan molecules was dramatically changed from an amine salt to a carboxylic sodium. The CTEA−Na+ was curved while CTEA·HCl presented relatively a linear conformation. Also, there were more n-decane molecules (gray) in the CTEA−Na+ system due to the more neutral ESP. Fig. 9b and e were magnified images of Fig. 9a and d. It was clear that introduction of polyethylene oxide groups made CTEA−Na+ form more H-bonds network with water. The water molecules surrounded more tightly with the central CTEA−Na+ and the thickness of the water layer is smaller. When we hided all the molecules in Fig. 9c and f, weak interactions were more obviously shown as green and blue plates (the green plates mainly stand for vdW interactions while blue plates mainly stand for H-bonding interactions). CTEA−Na+ has a more neutral ESP than CTEA·HCl, therefore there are much stronger vdW interactions with n-decane molecules (green plates) in Fig. 9f than 9c. Introduction of the polyoxyethyl ether units has offered more H-bonding sites and there are more H-bonding interactions (blue plates) in Fig. 9f than 9c and these H-bonds dragged the chain with polyoxyethyl ether lay down toward the water phase. These differences in weak interactions may mainly contribute the conformational change of surfactants, which finally affected the properties of the interface.
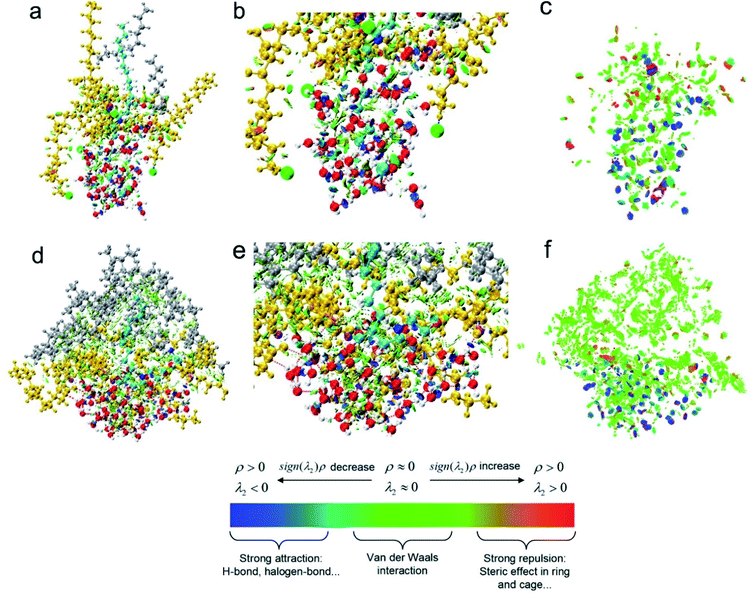 | ||
| Fig. 9 RDG analysis of weak interaction: (a) CTEA·HCl, (b) magnification of weak interactions of CTEA·HCl (c) only indicate the distribution of CTEA·HCl weak interaction (d) CTEA−Na+ (e) magnification of weak interactions of CTEA−Na+ (f) only indicate the distribution of CTEA−Na+ weak interaction. Cyan is the target surfactant molecule, gold is other surfactant molecules within 5 Å, gray is n-decane molecule, and red is water molecule. Weak effect in the color bar: red plate is repulsion interactions, blue plate is electrostatic interaction (mainly H-bonding interactions), and green plate is dispersion attraction (mainly van der Waals interactions).7d,17 | ||
Experimental
Materials
All organic solvents and reaction reagents were analytical grade and purchased from Inno-Chem GmbH. All reagents were used as received without further purification. The water used in the current study was of Millipore Milli-Q grade.Surfactant aqueous preparation
Four surfactants aqueous solutions with different concentrations were prepared by dispersing surfactant samples in water (Millipore) by sonication. The aqueous solutions were all homogeneous and clear at 25 °C.Equilibrium surface tension
The equilibrium surface tension was determined with the platinum ring method by using JK99B (Shanghai Zhongchen Digital Technic Apparatus Co., Ltd.). The maximum uncertainty on γ values is ±0.05 mN m−1. All the measurements were performed at 25.0 ± 0.1 °C and repeated at least three times to obtain the average value.Surfactant model
The water/n-decane simulation model consisted of an intermediate layer of water and two layers of n-decane on both sides. Table 3 listed information for constructing the studied models, including the number of surfactants per surfactant Nsur, the area per surfactant As. Surfactant molecules and n-decane molecules were optimized earlier with the ATB (version 3.0).18 After geometry optimization, Packmol program was utilized to include the listed molecules into the simulation model.19 The surfactants are initially aligned perpendicular and distributed at both sides of the equilibrated water cell with their head groups in the vicinity of the water layer. In order to keep the charge neutral, sodium or chloride ions were randomly inserted into the water, according to the default rules to achieve a reasonable protonation state by GROMACS. Periodic boundary conditions were implemented for all xyz directions. The initial simulation box for the oil–water–surfactant system measured around 5 × 5 × 17 nm3. The x and y dimensions (∼5 nm) of the systems were kept constant to maintain stable interfaces, leaving the z dimension (∼17 nm) adjustable for an appropriate pressure. Energy minimization was performed to remove any overlaps with a time step of 5.0 fs, Fmax ≤ 100 kJ mol−1 nm−1. At 298 K, an equilibration run of 1 ns was performed at an external pressure of 1 bar along the z-axis, which was perpendicular to the interface. The simulation time was extended to 5 ns, and the trajectories were kept every 1 ps.Simulation method
All simulations in the current work were performed with the GROMACS 2020.3 MD simulation package.20 The equations of motion were integrated with the leapfrog algorithm with a time step of 1.0 fs. The temperature was controlled by a v-rescale thermostat21 and the pressure was controlled using the Berendsen barostat.22 The (SPC/E) rigid water mode23 and the GROMOS 54A7 united-atom force field24 were used. The rigid structure of the water molecule was maintained using the Settle method,25 and the bond lengths of all other molecules were constraint with the LINCS algorithm.26 A cutoff of 0.9 nm was employed to calculate the short-range dispersion interactions, and the long-range dispersion corrections were also implemented for both energy and pressure. The long-range electrostatics were handled using the particle mesh Ewald (PME) method.27 The trajectories were visualized by VMD software (version 1.9.3).28Wavefunction analysis
Conclusions
Understanding the effect of surfactant structure on their ability to modify interfacial properties is of great scientific and industrial interest. In this work, we have synthesized four ionic surfactants, including CTHA·HCl, CTEA·HCl, CTHA−Na+ and CTEA−Na+. They differed in position of hydrophobic heads and component of hydrophobic tails. Experiment identified CTEA−Na+ has the lowest interfacial tension. MD simulations shown that when the cationic hydrophilic group located in the proximal position, the molecule was relatively stretched. However, the geometry changed to a bending shape and the head-tail distance was greatly shorted when the anionic hydrophilic group was in the middle of the molecular. The DFT study and wavefunction analysis provide more fundamental information from weak interaction respect, which have shown that the CTEA−Na+ could form a stronger vdW interactions with n-decane molecules. Moreover, introduction of polyethylene oxide groups made CTEA−Na+ form a concentrated H-bonding network with water molecules on the interface. These differences in weak interactions may mainly contribute the conformational change of surfactants, which finally affected the properties of the interface.In summary, the weak interactions and configuration of the surfactant molecules at the interface has a significant impact on its monolayers' properties. The insights gained from this work may offer a new sight to understand the surfactant structure and their adsorption behavior and may help improve the design of surfactants. Future work will focus on exploring more diverse surfactant structures as oil displacement, emulsification, oil extraction and other applications.
Author contributions
Conceptualization: Z. Z., F. Y.; formal analysis: Y. P. H.; investigation: W. Z., M. Y. Z.; methodology: Y. P. H., F. Y.; resources: Y. P. H., F. Y.; supervision: S. Z.; validation: R. S.; visualization: W. Z., M. Y. Z., K. W.; writing: Y. P. H., F. Y.Conflicts of interest
There are no conflicts to declare.Acknowledgements
This research work is supported by National Natural Science Foundation of China (Grant No. 21978124) and Key R&D Projects in Liaoning Province (Grant No. 2019JH2/10100005).Notes and references
- (a) A. Erfani, J. Seaberg, C. P. Aichele and J. D. Ramsey, Biomacromolecules, 2020, 21(7), 2557–2573 CrossRef CAS PubMed; (b) W. Shinoda, R. DeVane and M. L. Klein, J. Phys. Chem. B, 2010, 114(20), 6836–6849 CrossRef CAS PubMed.
- (a) D. Myers, Surfactant Science and Technology, VCH, New York, 1946 Search PubMed; (b) K. Bouchemal, S. Briançon, E. Perrier and H. Fessi, Int. J. Pharm., 2004, 280, 241–251 CrossRef CAS PubMed; (c) A. P. Gerola, P. F. A. Costa, F. H. Quina, H. D. Fiedler and F. Nome, Curr. Opin. Colloid Interface Sci., 2017, 32, 39–47 CrossRef CAS; (d) E. Dickinson, S. R. Euston and C. M. Woskett, Prog. Colloid Polym. Sci., 1990, 82, 65–75 CAS; (e) X. Tian, Q. Fan, J. Guo, Q. Yu, L. Xu and X. Kong, Spectrochim. Acta, Part A, 2021, 263, 120174 CrossRef CAS PubMed; (f) M. M. Hassan and C. M. Carr, Chemosphere, 2021, 265, 129087 CrossRef CAS PubMed.
- (a) O. Castellani, S. Al-Assaf, M. Axelos, G. O. Phillips and M. Anton, Food Hydrocolloids, 2010, 24, 121–130 CrossRef CAS; (b) S. Palchowdhury and B. L. Bhargava, J. Mol. Liq., 2017, 234, 249–259 CrossRef CAS; (c) Z. Liu, L. Jiang, X. Fu, J. Zhang and J. Lei, J. Therm. Anal. Calorim., 2020, 140(5), 2159–2170 CrossRef CAS; (d) H. Xiao, Z. Zhen, H. Sun, X. Cao, Z. Li, X. Song and X. Liu, Sci. China: Chem., 2010, 53(4), 945–949 CrossRef CAS; (e) Q. Tao, Y. N. Li, W. J. Tang, P. Y. Liu, F. Yu and Y.-P. He, Tetrahedron Lett., 2021, 74, 153158 CrossRef CAS; (f) Y. Yang, Z. Ma, F. Xia and X. Li, J. Water Process. Eng., 2020, 36, 101292 CrossRef; (g) G. Zhao, Z. Yuan, X. Liu, P. Wang, J. Yin and S. Ma, J. Mol. Liq., 2020, 317, 113980 CrossRef CAS; (h) W. Sun, Q. Ren, Z. Wang and F. Yang, Langmuir, 2019, 35, 911–920 CrossRef CAS; (i) R. Wu, M. Deng, B. Kong, Y. Wang and X. Yang, J. Phys. Chem. B, 2009, 113, 12680–12686 CrossRef CAS PubMed.
- (a) L. Zhang, Z. Liu, T. Ren, P. Wu, J. Shen, W. Zhang and X. Wang, Langmuir, 2014, 30(46), 13815–13822 CrossRef CAS PubMed; (b) H. Domínguez, J. Phys. Chem. B, 2011, 115(43), 12422–12428 CrossRef PubMed; (c) K. J. Schweighofer, U. Essmann and M. Berkowitz, J. Phys. Chem. B, 1997, 101(19), 3793–3799 CrossRef CAS; (d) J. Kubelka, S. Bai and M. Piri, J. Phys. Chem. B, 2021, 125(4), 1293–1305 CrossRef CAS PubMed; (e) C. V. Nguyen, T. V. Nguyen and C. M. Phan, Int. J. Heat Mass Transfer, 2017, 106, 1035–1040 CrossRef CAS; (f) J. Ma, X. Song, j. Luo, T. Zhao, H. Yu, B. Peng and S. Zhao, Langmuir, 2019, 35(42), 13636–13645 CrossRef CAS PubMed.
- (a) G. Rucker, X. Yu and L. Zhang, Fuel, 2020, 267, 117252 CrossRef CAS; (b) Y. Hu, J. Han and R. Guo, Langmuir, 2020, 36(35), 10494–10503 CrossRef CAS; (c) K. A. Becraft and G. L. Richmond, J. Phys. Chem. B, 2005, 109(11), 5108–5117 CrossRef CAS PubMed; (d) M. Wang, T. Fang, P. Wang, X. Tang, B. Sun, J. Zhang and B. Liu, Soft Matter, 2016, 12, 8177–8185 RSC; (e) C. Hill, Y. Umetsu, K. Fujita, T. Endo, K. Sato, A. Yoshizawa, S. E. Rogers, J. Eastoe and M. Sagisaka, Langmuir, 2020, 36(48), 14829–14840 CrossRef CAS PubMed; (f) R. Sun, K. Hong, Z. Lv, X. Ding and F. Yu, J. Surfactants Deterg., 2018, 21(4), 461–466 CrossRef CAS.
- (a) W. Wang, W. Lu and L. Jiang, J. Phys. Chem. B, 2008, 112(5), 1409–1413 CrossRef CAS PubMed; (b) F. Tu and D. Lee, J. Am. Chem. Soc., 2014, 136(28), 9999–10006 CrossRef CAS PubMed; (c) X. Li, Y. Yang, J. Eastoe and J. Dong, ChemPhysChem, 2010, 11, 3074–3077 CrossRef CAS PubMed; (d) J. Lee, Z. Zhou and S. H. Behrens, J. Phys. Chem. B, 2015, 119(22), 6628–6637 CrossRef CAS PubMed; (e) J. Hu, C. Sanders, S. Mekala, T.-Y. Chen, M. F. Cunningham and R. A. Gross, Macromolecules, 2019, 52, 1517–1525 CrossRef CAS.
- (a) H. Tao, C. Lian and H. Liu, Green Energy Environ., 2020, 5, 303–321 CrossRef; (b) T. Su, K. Hong, W. Zhang, F. Li, Q. Li, F. Yu, G. Luo, H. Gao and Y.-P. He, Soft Matter, 2017, 13(22), 4066–4073 RSC; (c) Z. Shen, Y. Jiang, T. Wang and M. Liu, J. Am. Chem. Soc., 2015, 137, 16109–16115 CrossRef CAS PubMed; (d) W. Zhang, Z. Zhang, S. Zhao, K. Hong, M. Zhang, L. Song, F. Yu, G. Luo and Y.-P. He, Langmuir, 2021, 37(9), 2954–2962 CrossRef CAS PubMed.
- C. Xue, G. Qu, Y. Han, S. Li, X. Gao and W. Ding, J. Dispersion Sci. Technol., 2016, 37, 1480–1485 CrossRef CAS.
- Y. Wei, G. Liu, Z. Wang and S. Yuan, RSC Adv., 2016, 6, 49708–49716 RSC.
- (a) F. Eisenhaber, P. Lijnzaad, P. Argos, C. Sander and M. Scharf, J. Comput. Chem., 1995, 16(3), 273–284 CrossRef CAS; (b) Y. Zhao and D. G. Truhlar, Theor. Chem. Acc., 2008, 120, 215–241 Search PubMed.
- J. G. Kirkwood and F. P. Buff, J. Chem. Phys., 1949, 17, 338–343 CrossRef CAS.
- D. M. Mitrinović, A. M. Tikhonov, M. Li, Z. Huang and M. L. Schlossman, Phys. Rev. Lett., 2000, 85(3), 582 CrossRef.
- (a) E. Calvo, P. Brocos, R. Bravo, M. Pintos, A. Amigo, A. H. Roux and G. Roux-Desgranges, J. Chem. Eng. Data, 1998, 43(1), 105–111 CrossRef CAS; (b) N. V. Sastry and M. K. Valand, J. Chem. Thermodyn., 1998, 30(8), 929–938 CrossRef CAS; (c) J. L. Trenzado, J. S. Matos, L. Segade and E. Carballo, J. Chem. Eng. Data, 2001, 46(4), 974–983 CrossRef CAS; (d) B. S. Bjola, M. A. Siddiqi, U. Fornefeld-Schwarz and P. Svejda, J. Chem. Eng. Data, 2002, 47(2), 250–253 CrossRef CAS.
- (a) N. G. Tsierkezos and I. E. Molinou, J. Chem. Eng. Data, 1998, 43(6), 989–993 CrossRef CAS; (b) Y. Pai and L. Chen, J. Chem. Eng. Data, 1998, 43(4), 665–667 CrossRef CAS.
- S. S. Jang, S. Lin, P. K. Maiti, M. Blanco, W. A. Goddard, P. Shuler and Y. Tang, J. Phys. Chem. B, 2004, 108(32), 12130–12140 CrossRef CAS.
- R. Kumar, J. R. Schmidt and J. L. Skinner, J. Chem. Phys., 2007, 126, 204107 CrossRef CAS.
- (a) T. Luand and Q. Chen, J. Mol. Model., 2020, 26(11), 1–9 Search PubMed; (b) S. Emamian, T. Lu, H. Kruse and H. Emamian, J. Comput. Chem., 2019, 40, 2868–2881 CrossRef CAS PubMed.
- M. Stroet, B. Caron, K. M. Visscher, D. P. Geerke, A. K. Malde and A. E. Mark, J. Chem. Theory Comput., 2018, 14(11), 5834–5845 CrossRef CAS PubMed.
- (a) J. M. Martínez and L. Martínez, J. Comput. Chem., 2003, 24, 819–825 CrossRef PubMed; (b) L. Martínez, R. Andrade, E. G. Birgin and J. M. Martínez, J. Comput. Chem., 2009, 30, 2157–2164 CrossRef PubMed.
- E. Lindahl, M. Abraham, B. Hess and D. Van Der Spoel, GROMACS 2020.3 Source code (Version 2020.3), 2020 Search PubMed.
- G. Bussi, D. Donadio and M. Parrinello, J. Chem. Phys., 2007, 126, 014101 CrossRef PubMed.
- H. J. C. Berendsen, J. P. M. Postma, W. F. Van Gunsteren, A. DiNola and J. R. Haak, J. Chem. Phys., 1984, 81, 3684–3690 CrossRef CAS.
- H. J. C. Berendsen, J. R. Grigera and T. P. Straatsma, J. Phys. Chem., 1987, 91(24), 6269–6271 CrossRef CAS.
- (a) N. Schmid, A. P. Eichenberger and A. Choutko, Eur. Biophys. J., 2011, 40, 843–856 CrossRef CAS PubMed; (b) W. Huang, Z. Lin and W. F. Gunsteren, J. Chem. Theory Comput., 2011, 7(5), 1237–1243 CrossRef CAS PubMed.
- S. Miyamoto and P. A. Kollman, J. Comput. Chem., 1992, 13(8), 952–962 CrossRef CAS.
- B. Hess, H. Bekker, H. J. C. Berendsen and J. G. E. M. Fraaije, J. Comput. Chem., 1997, 18(12), 1463–1472 CrossRef CAS.
- T. Darden, D. York and L. Pedersen, J. Chem. Phys., 1993, 98(12), 10089–10092 CrossRef CAS.
- W. Humphrey, A. Dalke and K. Schulten, J. Mol. Graphics, 1996, 14(1), 33–38 CrossRef CAS PubMed.
- M. J. Frisch, G. W. Trucks, H. B. Schlegel, G. E. Scuseria, M. A. Robb, J. R. Cheeseman, G. Scalmani, V. Barone, G. A. Petersson, H. Nakatsuji, X. Li, M. Caricato, A. V. Marenich, J. Bloino, B. G. Janesko, R. Gomperts, B. Mennucci, H. P. Hratchian, J. V. Ortiz, A. F. Izmaylov, J. L. Sonnenberg, D. Williams-Young, F. Ding, F. Lipparini, F. Egidi, J. Goings, B. Peng, A. Petrone, T. Henderson, D. Ranasinghe, V. G. Zakrzewski, J. Gao, N. Rega, G. Zheng, W. Liang, M. Hada, M. Ehara, K. Toyota, R. Fukuda, J. Hasegawa, M. Ishida, T. Nakajima, Y. Honda, O. Kitao, H. Nakai, T. Vreven, K. Throssell, J. A. Montgomery Jr, J. E. Peralta, F. Ogliaro, M. J. Bearpark, J. J. Heyd, E. N. Brothers, K. N. Kudin, V. N. Staroverov, T. A. Keith, R. Kobayashi, J. Normand, K. Raghavachari, A. P. Rendell, J. C. Burant, S. S. Iyengar, J. Tomasi, M. Cossi, J. M. Millam, M. Klene, C. Adamo, R. Cammi, J. W. Ochterski, R. L. Martin, K. Morokuma, O. Farkas, J. B. Foresman and D. J. Fox, Gaussian 16, Revision A.03, Gaussian, Inc., Wallingford CT, 2016 Search PubMed.
- (a) T. Lu and F. Chen, J. Comput. Chem., 2012, 33, 580–592 CrossRef CAS PubMed; (b) G. Chen, P.-Y. Liu, H. Zou, J. Hu, X. Fang, D. Xu, Y.-P. He, H. Wei and W. Xie, Org. Lett., 2021, 23, 2279–2284 CrossRef CAS PubMed; (c) Q. Tao, Y.-N. Li, W.-J. Tang, P.-Y. Liu, F. Yu and Y.-P. He, Tetrahedron Lett., 2021, 74, 153158 CrossRef CAS.
- (a) C. Bannwarth, E. Caldeweyher and S. Grimme, Wiley Interdiscip. Rev.: Comput. Mol. Sci., 2020, 11, e01493 Search PubMed; (b) P.-P. Niu, P.-Y. Liu, Y.-N. Meng, F. Yu and Y.-P. He, J. Org. Chem., 2021, 86, 3096–3106 CrossRef CAS PubMed.
- C. Bannwarth, S. Ehlert and S. Grimme, J. Chem. Theory Comput., 2019, 15(3), 1652–1671 CrossRef CAS PubMed.
- E. R. Johnson, S. Keinan, P. Mori-Sánchez, J. Contreras-García, A. J. Cohen and W. Yang, J. Am. Chem. Soc., 2010, 132, 6498–6506 CrossRef CAS PubMed.
Footnotes |
| † Electronic supplementary information (ESI) available: Detailed experimental procedures and spectroscopic data of all new compounds. See DOI: 10.1039/d1ra04669a |
| ‡ W. Zhang and M.-Y. Zhang contributed equally. |
| This journal is © The Royal Society of Chemistry 2021 |

