 Open Access Article
Research on the mechanism of particle deposit effects and process optimization of nanosecond pulsed laser truing and dressing of materials
Song Cai abc,
Wenhao Liu
 b,
Saiqiong Longd,
Yang Zhangc,
Rui Mingb,
Xingzu Mingb and
Jianfeng Xu*a
aState Key Laboratory of Digital Manufacturing Equipment & Technology, School of Mechanical Science and Engineering, Huazhong University of Science and Technology, Wuhan, Hubei 430074, China. E-mail: happy9918@sina.com; Fax: +86-027-87793402; Tel: +86-027-87793402
bSchool of Mechanical Engineering, Hunan University of Technology, Zhuzhou, Hunan 412000, China
cGreen Fan Manufacturing Collaborative Innovation Center in Hubei Province, Wuchang Institute of Technology, Wuhan, Hubei 430065, China
dGuangzhou Customs Technology Center, Guangzhou, Guangdong 510665, China
First published on 8th September 2021
Abstract
New plasma expansion models and change rate models of plasma excitation were established under cylindrical coordinates. Expansion models were used to numerically analyse the plasma expansion characteristics of the nanosecond pulsed laser truing and dressing of a bronze–diamond grinding wheel (LTDBDGW). The results showed that the plasma expansions in the X- and R-directions were approximately 8 × 10⁻⁴ m and 2.5 × 10⁻⁴ m, respectively. The plasma electron density calculated by the results was 1.0757 × 1016 cm−3. The calculation of the change rate models of the plasma excitation shows that the plasma excitation mechanism of LTDBDGW was controlled mainly by the thermal excitation effect. In response to high-temperature and high-speed collisions, black particles deposit onto the surface of the bronze–diamond grinding wheel, affecting the topography of the surface and reducing the height of the abrasive grains protruding from the binding agent. Plasma experiments were carried out via LTDBDGW. When the laser was vertically incident, and the laser power density was 3.359 × 10⁸ W cm−2, the Boltzmann plot method and the Stark broadening method were used to get the plasma electron temperature and the plasma electron density, which were approximately 9700 K and 1.6128 × 10¹⁶ to 2.0636 × 1016 cm−2, respectively. LTDBDGW experiments were conducted with and without assisted blowing. Surface quality improvement of the grinding wheel was confirmed with auxiliary blowing.
1 Introduction
During the interaction of a high-energy pulsed laser with metal materials, the excitation mechanism of plasma is complicated, and has been widely studied by scholars. V. Morel et al.1 proposed the OD numerical method for the laser plasma expansion irradiation model. Numerical analysis showed that the basic physical process of plasma formation is mainly determined by electron collision excitation and ionization, multiphoton ionization and inverse bremsstrahlung radiation. M. Y. Sun et al.2 built a numerical model of ultrafast laser plasma formation, and the evolution law between the photoionization and ablation threshold was obtained by analysis of the numerical model. It was proven that for pulses smaller than 1 ps, it is best to use a complete photoionization model. V. Pedro et al.3 studied the interaction between a high-intensity X-ray laser and matter, indicating that collision ionization played an important role in radiative transport when the density was lower than the solid density. The above studies reveal that the excitation mechanism of plasma is mainly photothermal processes, thermal ionization and collision ionization, meanwhile the above plasma model was applied to numerically analyse the plasma characteristics and can be used for experimental optimization and guidance.4,5However, in the study of the plasma excitation mechanism, the change rate model, the change rate size and efficiency of each the plasma excitation mechanism are complex and have not yet been reported.
Related studies show that the plasma excitation mechanism will affect its expansion characteristics. Therefore, the models of various plasma excitation mechanisms, the efficiency and magnitude of plasma excitation mechanism change can be studied according to the plasma expansion characteristics.
In the study of plasma expansion process, single particles collide with each other, leading to a complex and changeable physical state. Therefore, it is difficult to study the related expansion characteristics. However, plasma expansion can be regarded as a whole gas mass, and the study of plasma expansion characteristics can be carried out. S. B. Harris et al.6 proposed an expansion model for laser ablation plasma and studied the length scale of laser-induced material growth and modification of the expansion distance. Z. Lin et al.7 used the finite-difference time-domain (FDTD) method to study the propagation properties of Gaussian beams in expanded plasma. In order to establish a physical model more consistent with plasma expansion, our research group8,9 showed that in Cartesian coordinates, plasma expansion exhibits different distribution characteristics during the laser ablation of material, and plasma expansion equations were built. The plasma expansion dimensions, expansion velocity, distribution characteristics and expansion pressure were studied. However, due to the use of different distribution models, the structure of the plasma expansion models was found to be complicated.
The above plasma expansion models established in Cartesian coordinates include many parameters, but it is difficult to solve for the plasma expansion characteristics in the X-, Y- and Z-directions, and it is more difficult to establish the model of plasma laser mechanism and solve the change rate and efficiency of plasma excitation mechanism. Therefore, on the basis of accurately describing the characteristics of plasma expansion and studying the change rate of the plasma excitation mechanism, it is necessary to reduce the number of parameters used in plasma expansion models and establish new plasma expansion models with simpler structures and more convenient solutions.
Based on previous research, this paper further analyses the plasma expansion characteristics observed during the laser ablation of materials. According to the distribution law of mathematics and physics, the plasma concentration spatial distribution equation, the plasma expansion-induced external pressure equation and the plasma dynamic physical equation were obtained under cylindrical coordinates. Based on the plasma excitation model coupled with the plasma concentration spatial distribution equation, change rate models of plasma excitation were established, which included mainly the thermal excitation effect and collision excitation effect models.
Plasma expansion models were used to numerically analyse the plasma expansion characteristics for LTDBDGW. The evolution law of the plasma expansion velocity, plasma expansion dimensions and pulse time were obtained. The plasma expansion-induced external pressure was calculated. The change rates of the plasma thermal excitation and collision excitation for LTDBDGW were calculated using the plasma excitation change rate models. A spectrometer was used to obtain the plasma emission spectral data. Additionally, based on the Boltzmann distribution law and the Stark broadening method, the plasma attribute characteristics were obtained, and the laser transmittance was calculated. Experiments for LTDBDGW with and without auxiliary argon blowing were conducted. A high-speed camera was used to capture the plasma expansion profile. The topography of the grinding wheel surface was observed by an ultradeep three-dimensional microscope system. The maximum height of the abrasive grains was measured after laser truing and dressing.
2 Plasma expansion models and change rate models of plasma excitation for the nanosecond laser ablation of materials
In this section, plasma expansion models and change rate models of the plasma thermal excitation effect and the plasma collision excitation effect were established. The following assumptions were made before building the models:10–12In the process of nanosecond pulsed laser ablation of materials, the motion law of a single particle is relatively complicated. In practical research, plasma is regarded as an ideal gas sphere and satisfies local thermal equilibrium conditions. At the beginning of the simulation, the gas sphere is small and can expand rapidly.
In the expansion of the plasma gas sphere, the pressure gradient is high, and the expansion speed is fast. During the pulse irradiation time, the expansion is an uninterrupted process, and it can be approximately regarded as consistent with the continuous fluid motion characteristics.
In the expansion of the plasma gas sphere, the plasma concentration and the expansion pressure decrease exponentially with respect to the diffusion distance.8
2.1 Plasma expansion models
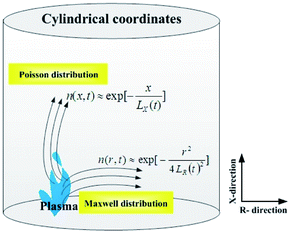
The centre coordinate is set as the laser ablation spot position. Fig. 1 shows a schematic diagram of the plasma spatial concentration distribution in cylindrical coordinates. In the X-direction, the laser irradiates the material to form the plasma, which will expand against the direction of the laser beam. In the R-direction, after laser irradiation, gasified particles spattered from the material surface have an initial velocity in line with the direction of the platform, and the particles collide violently, resulting in constant velocity and energy.Based on the above assumptions and the analysis, in the X-direction, the plasma is produced by a pulsed laser and has pulsating properties, and its expansion space is blocked by the target. The plasma concentration spatial distribution satisfies the Poisson distribution, and the relation is as follows:9
 | (1) |
In the R-direction, it is complicated and difficult to analyse and study the velocity law for a single particle. However, in a certain range of space, all particles can be regarded as a complete air mass, and the velocities of particles entering and leaving this range are approximately the same. Furthermore, the velocities of particles throughout the entire mass are close to the state of dynamic equilibrium after collisions with each other. This situation conforms to the characteristics of the Maxwell velocity distribution,6 and the relation is as follows:13
 | (2) |
Due to the plasma distribution characteristics in the directions perpendicular and parallel to the material surface, the plasma concentration spatial distribution equation should contain terms describing the Poisson distribution and Maxwell velocity distribution. Therefore, the distribution equation was established in cylindrical coordinates as:
 | (3) |
On the left side of the equation is the change in the number of particles. The first parenthesis on the right side of the equation indicate the change in the spatial positions of the particles in the X-direction and the change caused by self-expansion, which satisfies the Poisson distribution factor term. The second part on the right side of the equation indicate the change in the spatial position of the particles in the R-direction and the change caused by self-expansion, which satisfies the Maxwell velocity distribution factor term. We can thus obtain: (see Appendix A)
 | (4) |
 | (5) |
 | (6) |
 | (7) |
Taking into account the equation P = nkbT, the plasma expansion-induced external pressure equation was obtained:
 | (8) |
The above equation was derived from the assumption of the local conservation of mass and momentum. The local conservation law is much stricter than the global mass conservation law and momentum conservation law and more closely reflects the real ablation situation. Under a cylindrical coordinate system, the local mass conservation law can be expressed as:15
 | (9) |
 | (10) |
Eqn (10) needs to be identical, so both sides of the equation need to be functions of time t(q(t)), and we can obtain:
 | (11) |
 | (12) |
Eqn (11) and (12) are solved to obtain (see Appendix A)
 | (13) |
 | (14) |
In cylindrical coordinates, the momentum conservation equations are as follows:16,17
 | (15) |
 | (16) |
Substituting x = LX(t) and r = LR(t) into eqn (15) and (16), we obtain the plasma expansion edge kinetic equations (see Appendix A)
 | (17) |
 | (18) |
2.2 Change rate models of plasma excitation
The mechanism of the formation of plasma clouds produced by pulsed laser truing and dressing of metal materials is mainly controlled by the thermal excitation effect and collision excitation effect. The change rate models of the plasma excitation mainly include the change rate models of the plasma thermal excitation effect and the plasma collision excitation effect.Assuming that only one electron can be ionized in each atom, the thermal excitation effect change rate can be obtained by the Saha equation,18 and after coupling the plasma concentration spatial distribution equation, the change rate model of the plasma thermal excitation effect can be obtained (see Appendix A)
 | (19) |
 is the change rate of the thermal excitation effect.
When the laser energy absorbed by free electrons reaches a certain requirement, free electrons collide with electrons bound by atoms, and the bound electrons absorb more energy than the bound energy of the atoms, causing the atoms to ionize. Collision ionization means that free electrons collide with electrons bound by atoms, resulting in the ionization of atoms. The main process of inverse collision excitation is called three-body recombination or collision recombination.19 In three-body recombination, the greater the velocity of the electron is, the shorter the action time and the smaller the collision cross section. When two electrons interact with each other in ion attachment, one of the electrons transfers energy to the other. After its energy weakens, it ultimately falls into the electrostatic field of ions to form bound electrons.
Suppose that in unit time and unit volume, the collision excitation probability of a bound particle is αn and the collision recombination probability between two free electrons and an ion is βn. Assuming that the initial state of the ionized particle is the ground state, after coupling the plasma concentration spatial distribution equation, the change rate model of the plasma collision excitation effect can be obtained (see Appendix A)
 | (20) |
 is the change rate of the collision excitation effect.
In summary, plasma expansion models (eqn (7), (8), (17) and (18)) were obtained, and plasma excitation change rate models were established, namely, the change rate models of the plasma thermal excitation effect (19) and the plasma collision excitation effect (20). Compared with the plasma expansion models in Cartesian coordinates, the plasma expansion models in cylindrical coordinates have a simpler structure, fewer calculation parameters and simpler solutions.
3 Plasma characteristics and mechanism for LTDBDGW
High-power lasers are widely used in the truing and dressing of bronze–diamond grinding wheels. Researchers have considered pulsed laser truing and dressing of the cubic boron nitride (CBN) grinding wheels and bronze–diamond grinding wheels, which exhibit good dressing efficiency and quality.20–22 Plasma is formed in the process of laser truing and dressing and will expand and generate black particles that deposit on the surface of the grinding wheel, reducing the surface quality of the grinding wheel. However, during the laser truing and dressing process, the plasma expansion characteristics and the mechanism of black particle formation are not completely understood.In this section, the plasma expansion characteristics and the plasma formation mechanism for LTDBDGW were analysed using plasma expansion models and change rate models of plasma excitation. The finite difference method was used to numerically analyse the plasma expansion characteristics of the 1064 nm infrared pulsed laser ablation of a wheel. This work mainly considers the plasma expansion dimensions and the plasma expansion velocity. The change rates of the plasma thermal excitation and collision excitation are calculated, and the mechanism of black particle formation is studied in detail. The differential equations describing the plasma expansion edge kinetic equations ((17) and (18)) are as follows:
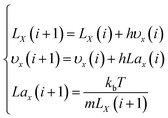 | (21) |
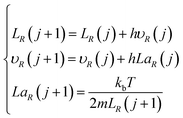 | (22) |
3.1 Plasma expansion dimension and expansion velocity
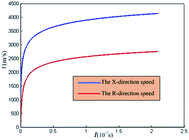
The plasma expansion process considers a single ideal gas with a high temperature and high density.10,23 Therefore, in the X- and R-directions, the initial velocity of the plasma expansion is approximately equal to that of the mean free path molecular motion. Based on the above analysis and the results presented in the literature,14 in the X- and R-directions, the initial expansions are both approximately 10−6 m, while the initial velocities are approximately 970 m s−1 and 1.53 m s−1, respectively, and the initial accelerations are approximately 958 × 109 m s−2 and 479 × 109 m s−2, respectively.Fig. 2 shows the evolution of the plasma expansion during the LTDBDGW process. The red curve represents the plasma edge expansion velocity in the X-direction, and the blue curve shows the plasma edge expansion velocity in the R-direction. The two curves exhibit a nonlinear increase. The rate of increase is the fastest in the range of 0 ns to 25 ns, and the maximum edge expansion velocities are 4300 m s−1 and 2700 m s−1 in the X-direction and R-direction, respectively. In the expansion process from 25 ns to 210 ns, the rate of velocity increase remains low, and the amplitude of the increase in the velocity decreases. The results showed that the laser energy irradiated the material surface at approximately 25 ns and that the particles collided violently, which enhanced the excitation effect and achieved the maximum plasma concentration. Subsequently, the plasma expanded in volume, and the expansion energy of the particles decreased, resulting in the velocity increasing slowly. With the recombination of electrons and ions, the plasma concentration was reduced.
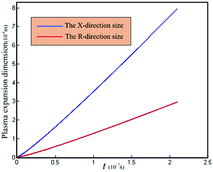
Fig. 3 shows the evolution diagram of the plasma expansion during the LTDBDGW process. In the X- and R-directions, the plasma expansion increased gradually with increasing pulse times, showing a linear evolution law, and the plasma expansions were approximately 8 × 10⁻⁴ m and 2.5 × 10⁻⁴ m, respectively, after the pulsed laser stopped. This is mainly because during the pulsed laser ablation time, the material continuously absorbed the laser energy to form the plasma that expanded into the space, resulting in a gradual increase in the dimension.
3.2 Spatial distribution of the plasma concentration and expansion-induced external pressure
Based on eqn (7) and (8), via substitution of the calculated parameters in Table 1 and the plasma expansion dimensions obtained through numerical simulation in the X- and R-directions, we can derive the following:
 | (23) |
 | (24) |
| Name | Symbol | Numerical value and units | Name | Symbol | Numerical value and units |
|---|---|---|---|---|---|
| Electron temperature | T | 9700 K (0.8358 eV) | Laser power density | I0 | 3.359 × 10⁸ W cm−2 |
| Gasification temperature | Tl | 2770 K | Spot size | S0 | 1.1341 × 10⁻⁹ m2 |
| Excitation energy | U | 7.6305 eV | Pulse time | τ | 2.1 × 10⁻⁷ s |
| Atomic mass | m | 1.0382 × 10⁻²⁵ kg | Refractive index | a | 1.18 |
| Laser wavelength | λ | 1.064 × 10⁻⁶ m | Solid phase density | ρs | 8620 kg m−3 |
| Photon energy | Hv | 1.16 eV | Average charge | Z | 2 |
| Boltzmann constant | kb | 1.3807 × 10⁻²³ J K−1 | Planck constant | H | 6.626 × 10⁻³⁴ J s |
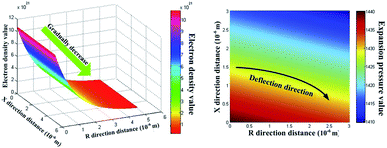
The units of plasma concentration and expansion-induced pressure are cm−3 and Pa. According to eqn (23) and (24), the distribution schematic diagram of the evolution law for the plasma concentration and the expansion-induced external pressure were obtained and are shown in Fig. 4. The plasma concentration and expansion pressure gradually decreased with increasing distance, showing high and low distribution laws with respect to the inside and outside. The maximum plasma concentration and the maximum expansion-induced pressure were achieved on the material surface and were approximately 1.0757 × 1016 cm−3 and 1440 Pa, respectively. At the same time, the initial expansion velocity of the spattered particles in the R-direction led to the deflection of the plasma expansion.
In the actual expansion process, after the plasma was formed on the material surface, the particles collided with each other in the high-temperature and high-pressure environment. Therefore, the energy was transferred, and the particles were further ionized, resulting in an increase in the plasma concentration. According to the above analysis and Saha equation, considering only the first-order ionization degree, the ionization degree was approximately 0.83 when the plasma electron temperature was 9700 K, and the maximum plasma concentration was approximately 1.9685 × 1016 cm−3. Meanwhile, the plasma expansion-induced external pressure was low, and the scale of plasma expansion was small. Then, the plasma eventually dissipated into the air.
3.3 Population probability of plasma thermal excitation and plasma collision excitation
Under the irradiation of nanosecond pulsed laser, the material absorbs energy by the way of incident photon-stimulated electron–phonon transformation, then the processing effect of the material is achieved through the three-phase hot melting process of solid–liquid–gaseous state.This is different from the ultrafast pulse laser, because the pulse width of the femtosecond laser is much smaller than the thermal diffusion time, and the electron–phonon coupling time in the material. The interaction between femtosecond laser and matter is mainly manifested in the process of electron excited absorption and storage of energy. Its fundamentally avoids the influence caused by the transfer and transformation of energy as well as the existence and diffusion of thermal energy.24
In this paper, the effects of thermal excitation and collision excitation are studied on the basis of nanosecond pulsed laser ablation.
During the LTDBDGW process, there are a large number of copper atoms and tin atoms in bronze. For a monatomic gas, when the gasification temperature is higher, the corresponding ionization potential is usually lower. In this case, even if the gasification particle number of bronze is not high after laser truing and dressing, there are many free electrons (approximately 1.0757 × 1016 cm−3) in the weakly ionized bronze vapour (approximately 0.83) when the vapour pressure is higher than the ambient pressure (approximately 1440 Pa).
If bronze is regarded as a composite material, in addition to the collisions between copper atoms and the collisions between tin ions, there will be collisions between copper atoms and tin atoms and between copper ions and tin ions. When a free electron collides with a copper atom or a tin atom and emits a bound electron, collision excitation will occur. At this time, the free electron remains in a free state. When two free electrons enter a volume of copper or tin ions at the same time, one electron transfers energy to another, and the electron that loses energy will be bound by ions. This process is called three-body recombination or collision recombination. The process of collision ionization and collision recombination can be shown as follows:
 | (25) |
 | (26) |
![[thin space (1/6-em)]](https://www.rsc.org/images/entities/char_2009.gif) :
:![[thin space (1/6-em)]](https://www.rsc.org/images/entities/char_2009.gif) 1 during the LTDBDGW process. In this paper, it is assumed that there is only one ionization step, which is similar to the ionization of a hydrogen-like atom. In the initial state, the gasification bronze material is in the unablated state (initial state or ground state). At this time, the bound electrons in the ground state cannot be ionized without obtaining the laser energy, and the probability of occupation is as follows: P1 = 1. The maximum plasma concentration values on the surface of the bronze–diamond grinding wheel and the calculation parameters of the plasma (Table 1) are substituted into the change rate model of the plasma thermal excitation effect, which can then be solved after the end of one laser pulse as follows: αn = 0.0029. By substituting αn = 0.0029, n = 1.0757 × 1016 cm−3, and P1 = 1 into eqn (19) and (20), we can obtain:
1 during the LTDBDGW process. In this paper, it is assumed that there is only one ionization step, which is similar to the ionization of a hydrogen-like atom. In the initial state, the gasification bronze material is in the unablated state (initial state or ground state). At this time, the bound electrons in the ground state cannot be ionized without obtaining the laser energy, and the probability of occupation is as follows: P1 = 1. The maximum plasma concentration values on the surface of the bronze–diamond grinding wheel and the calculation parameters of the plasma (Table 1) are substituted into the change rate model of the plasma thermal excitation effect, which can then be solved after the end of one laser pulse as follows: αn = 0.0029. By substituting αn = 0.0029, n = 1.0757 × 1016 cm−3, and P1 = 1 into eqn (19) and (20), we can obtain:
 | (27) |
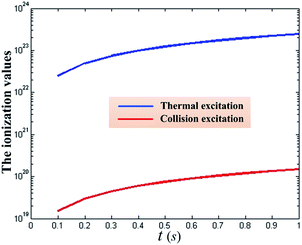
The values of the plasma thermal excitation and the collision excitation for LTDBDGW are shown in Fig. 5. Under the function of the thermal excitation mechanism, there are large numbers of copper and tin atoms in the plasma, and bound electrons in copper and tin atoms absorb energy in the ion Coulomb field. When a bound electron absorbs more energy than the bound energy, it will break through the bonds of the atom, leading to ionization. The change rate of the plasma was approximately 2.46 × 1023 cm−3 under the thermal excitation effect. In the LTDBDGW process, the charged particles (ions and electrons) of the copper and tin absorbed the laser energy and conducted energy through thermal collisions with neutral atoms. When the bound electrons in the copper and tin atoms receive sufficient energy to ionize, they collide with the vapourized atoms of the laser ablation material and the bound electrons in the solid medium and then manifest heat conduction. The change rate of the plasma was approximately 1.49 × 1020 cm−3 under the collision excitation effect. Fig. 5 shows that the change rate of the plasma number determined by the thermal excitation effect and collision excitation effect increased linearly, and the thermal excitation mechanism was an order of magnitude more influential than the collision excitation mechanism. The average plasma electron temperature is approximately 9700 K in the LTDBDGW. The solid medium on the grinding wheel surface is very dense. After ionization by thermal excitation and collision excitation, the density of the plasma concentration increased violently, and a dense plasma zone was formed on the surface of the grinding wheel, resulting in an extremely high number of particles on its surface.
In conclusion, plasma formation by LTDBDGW mainly occurs through a thermal excitation mechanism supplemented by a collision excitation mechanism.
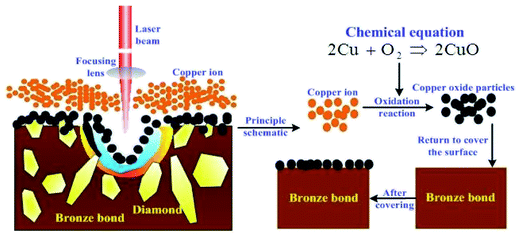
Numerical calculations show that under relevant process parameters, the plasma excitation mechanism of LTDBDGW is controlled by the thermal excitation effect and collision excitation effect. The change rate of the number of copper ions is approximately 1.0757 × 1016 cm−3, resulting in the formation of a dense plasma zone dominated by copper ions on the surface of the grinding wheel. As shown in Fig. 6, in plasma with a high temperature and high density, copper ions form black copper oxide particles in a proportion of 1![[thin space (1/6-em)]](https://www.rsc.org/images/entities/char_2009.gif) :
:![[thin space (1/6-em)]](https://www.rsc.org/images/entities/char_2009.gif) 1 with oxygen in air (equation: 2Cu + O2 = 2CuO). It is concluded that under the mechanism of collision excitation, the movement direction of the particles is complex, and the black copper oxide particles will cover the grinding wheel surface, affecting the topography of the grinding wheel surface and reducing the height of the abrasive grains protruding from the binding agent.
1 with oxygen in air (equation: 2Cu + O2 = 2CuO). It is concluded that under the mechanism of collision excitation, the movement direction of the particles is complex, and the black copper oxide particles will cover the grinding wheel surface, affecting the topography of the grinding wheel surface and reducing the height of the abrasive grains protruding from the binding agent.
In summary, the plasma expansion velocity and plasma expansion dimensions increased rapidly during pulsed laser treatment. The maximum plasma concentration value was reached at 25 ns at a distance of 0.05 mm from the material surface. The plasma formed by LTDBDGW is mainly formed due to the thermal excitation mechanism. In plasma with a high temperature and high density, copper ions formed black copper oxide particles in a proportion of 1![[thin space (1/6-em)]](https://www.rsc.org/images/entities/char_2009.gif) :
:![[thin space (1/6-em)]](https://www.rsc.org/images/entities/char_2009.gif) 1 with oxygen in the air.
1 with oxygen in the air.
4 Experiments for the nanosecond laser ablation of materials
4.1 Experimental equipment, materials and methods
The ablation threshold is dependent on the laser wavelength and pulse duration, in which the laser wavelength can determine the absorptivity of the material. The removal threshold Ith of laser power density of bronze bond was calculated, and the approximate range of laser power density Ip can be determined preliminarily. The threshold Ith for laser power density removal of bronze bond can be determined by formula calculation, as shown below :25–28
 | (28) |
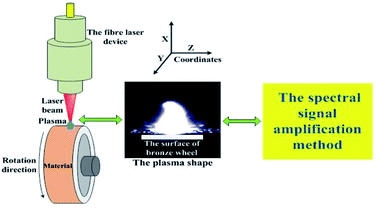
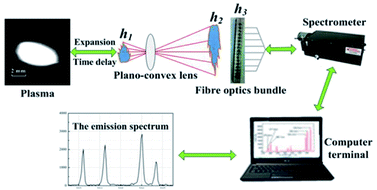
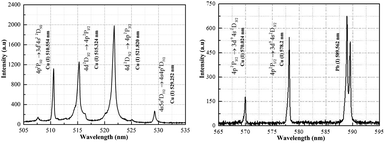
Fig. 8 shows the schematic diagram of the spectral signal amplification method. A spectrometer (SpectraPro-2300i, manufactured by Princeton Instruments, U.S.A) equipped with high-performance charge-coupled devices (parameters: 1340 × 400 pixel 400F) was used to collect the spectral signals. The central wavelengths measured through the diffraction grating (600 lines per m) were 520 nm and 580 nm. The width of a single measurement was 130 nm, and the optical resolution was 0.1 nm. The amplified spectral signals were collected by the optical fibre beam probe and then stored on a computer. Finally, the space-resolved emission spectrum signal of the plasma was obtained and displayed on a computer screen.
The plasma image is amplified by a quartz glass plano-convex lens with a radius of 10 mm and a focal length of 100 mm. The actual size is d, and the image size used for spectral measurement is 5d. Therefore, after obtaining the plasma spectrum, it is necessary to restore it to the actual size.
4.2 Spectral measurement experiment for LTDBDGW
In this section, the bronze–diamond grinding wheel (model: 100D10T5X31.75*8#) is ablated by the pulsed laser. The concentration of bronze is high, and the thermophysical properties of the bronze are quite different from those of the diamond. Therefore, this approach can comprehensively measure the spectral lines of the copper atoms without the influence of diamond.In the experiment, the laser wavelength was 1064 nm, the laser power was 40 W, the laser pulse frequency was 20 kHz, the rotation velocity was 300 rpm, the delay time of the spectrometer was approximately 2 μs, and the integration time of a pulse was approximately 25 μs. After 20 pulses were selected successively from the laser irradiation, that is, after the time is about 1 × 10⁻³ s, the data acquisition was stopped, and then the collected data were stored on a computer and integrated to produce a spectrum.
In the experiment, the pulse repetition rate was 20 kHz, which means that the laser outputs 2 × 10⁴ laser pulses per second, that is, the time of each pulse was approximately 5 × 10⁻⁵ s (50 μs). It has been reported8 in the literature that the period from formation to disappearance of plasma produced by the laser power density (2 × 10⁶ W cm−2) is usually approximately 5 μs, and the plasma period is usually of the order of 10 μs. Therefore, in this experiment the plasma generated between laser pulses and pulses did not affect each other.
The Boltzmann plot method and the Stark broadening method were used to calculate the plasma electron temperature and plasma electron density, respectively.29,30 The main purpose of the experiment was to verify the correctness of the plasma expansion models.
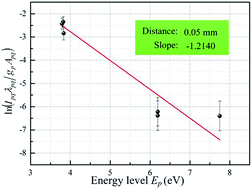
The Boltzmann plot method was applied to calculate the plasma electron temperature. That is, the plasma electron temperature was calculated using the slope of the straight line. Table 2 shows the Cu atomic spectral parameters used for calculation.9
| Line (nm) | 510.554 | 515.324 | 521.820 | 529.252 | 570.024 | 578.213 | |
| Statistical weight | gq | 6 | 2 | 4 | 8 | 4 | 4 |
| gp | 4 | 4 | 6 | 8 | 4 | 2 | |
| Transition probability, Apq (s−1) | 2.0 × 10⁶ | 6.0 × 10⁷ | 7.5 × 10⁷ | 1.09 × 10⁷ | 2.4 × 10⁵ | 1.65 × 10⁶ | |
| Excitation energy, Ep (eV) | 3.83 | 6.191 | 6.192 | 7.75 | 3.82 | 3.79 | |
Based on the spectral line intensity and spectral parameters of the Cu atomic line, the Boltzmann plot is presented in Fig. 10. The slope value of the line was determined to be approximately −1.214 with linear fitting.
To verify the plasma models and ensure the accuracy of the measurements, the plasma emission spectrum at different distances (range: 0–0.55 mm) from the material surface was measured in the experiment. The measurement error was approximately 5%. Table 3 shows the slope values of these fitting lines.
| Distance (mm) | Slope | Distance (mm) | Slope | Distance (mm) | Slope |
|---|---|---|---|---|---|
| 0 | −1.1835 | 0.2 | −1.2140 | 0.4 | −1.1925 |
| 0.05 | −1.2410 | 0.25 | −1.2332 | 0.45 | −1.1747 |
| 0.1 | −1.1495 | 0.3 | −1.2402 | 0.5 | −1.1739 |
| 0.15 | −1.1690 | 0.25 | −1.1947 | 0.55 | −1.1763 |
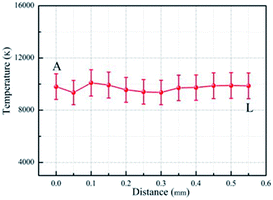
The Boltzmann curve method shows that Te = −1/(kbXS), where XS is the slope value of the straight line. By substituting the slope values (XS) into the temperature calculation formula, the plasma electron temperature values (position from the material surface) can be calculated and are shown in Fig. 11. The values were approximately (0 mm) 9805 ± 981 K, (0.05 mm) 9351 ± 935 K, (0.1 mm) 10![[thin space (1/6-em)]](https://www.rsc.org/images/entities/char_2009.gif) 095 ± 1010 K, (0.15 mm) 9927 ± 993 K, (0.2 mm) 9559 ± 956 K, (0.25 mm) 9410 ± 941 K, (0.30 mm) 9359 ± 936 K, (0.35 mm) 9714 ± 971 K, (0.40 mm) 9731 ± 973 K, (0.45 mm) 9879 ± 988 K, (0.50 mm) 9886 ± 989 K, and (0.55 mm) 9865 ± 987 K. By averaging the above values, the average plasma electron temperature was determined to be approximately 9700 ± 970 K. The calculation error was approximately 10% and was mainly due to measurement error, parameter error and data fitting error.
095 ± 1010 K, (0.15 mm) 9927 ± 993 K, (0.2 mm) 9559 ± 956 K, (0.25 mm) 9410 ± 941 K, (0.30 mm) 9359 ± 936 K, (0.35 mm) 9714 ± 971 K, (0.40 mm) 9731 ± 973 K, (0.45 mm) 9879 ± 988 K, (0.50 mm) 9886 ± 989 K, and (0.55 mm) 9865 ± 987 K. By averaging the above values, the average plasma electron temperature was determined to be approximately 9700 ± 970 K. The calculation error was approximately 10% and was mainly due to measurement error, parameter error and data fitting error.
In summary, the fluctuation in the plasma electron temperature was from approximately 9350 K ± 935 K to 10![[thin space (1/6-em)]](https://www.rsc.org/images/entities/char_2009.gif) 095 K ± 1010 K in the range of A (0)–L (0.55 mm) on the material surface. The change in temperature with increasing distance was small. This stage reflects the plasma isothermal expansion process; that is, the laser energy absorbed by the plasma is the same as the energy consumed by the plasma expansion. The plasma electron temperature obtained experimentally was basically the same as that obtained by the numerical calculation, providing proof for the subsequent verification of the plasma expansion models.
095 K ± 1010 K in the range of A (0)–L (0.55 mm) on the material surface. The change in temperature with increasing distance was small. This stage reflects the plasma isothermal expansion process; that is, the laser energy absorbed by the plasma is the same as the energy consumed by the plasma expansion. The plasma electron temperature obtained experimentally was basically the same as that obtained by the numerical calculation, providing proof for the subsequent verification of the plasma expansion models.
The most effective and reliable method to measure the plasma electron density is to calculate the plasma electron density by obtaining the spectral line broadening parameters. In practice, spectral line broadening is composed of many factors, including Stark broadening, Doppler broadening, resonance broadening, self-absorption broadening, and the influence of measuring instruments on spectral line broadening. It is reported in the literature that the contributions of Doppler broadening, resonance broadening and self-absorption broadening are very small and are usually negligible.31 Therefore, Stark broadening and instrument broadening represent the main contributions to spectral line broadening. Four spatial-spectral lines (Cu(I) 510.554, 515.324, 521.820 and 578.213 nm) were selected to calculate the plasma electron density. The full width at half maximum (FWHM) of the peak intensity of the spectral lines can be obtained by using the measured spectral line data through Lorentz fitting, where the final FWHM of the spectral line (Δλ1/2) is the FWHM of the peak intensity of the spectral lines minus the effect of the measuring instrument on the spectral line broadening (approximately 0.15 nm). Then by substituting the result (Δλ1/2) into the Stark broadening formula, the plasma electron density can be calculated. Fig. 13 shows the curve of the spectral data (Cu(I) 515.324 nm) after Lorentz fitting. In the figure, the Δλ1/2 values of the spectral line at different distances (0 mm, 0.05 mm, 0.1 mm, 0.15 mm, 0.2 mm, 0.25 mm, 0.3 mm, 0.35 mm, 0.4 mm, 0.45 mm, 0.5 mm and 0.55 mm) from the material surface are 0.54431, 0.58265, 0.53616, 0.51312, 0.48387, 0.42932, 0.45736, 0.50876, 0.52106, 0.49772, 0.50330 and 0.50585, respectively. The curve characteristics of the other spectral lines after Lorentz fitting are similar. To ensure the accuracy of the measurement, Table 4 shows the FWHM (Δλ1/2) of the other copper atomic spectral lines (Cu(I) 510.45, 521.820 and 578.213 nm) after Lorentz fitting.
| Line (nm) | Distance (nm) | |||
|---|---|---|---|---|
| Δλ1/2 (the error: 10%) | ||||
| Cu I 510.45 | Cu I 515.324 | Cu I 521.820 | Cu I 578.213 | |
| 0 | 0.27056 | 0.54431 | 0.61382 | 0.24691 |
| 0.05 | 0.28776 | 0.58265 | 0.69170 | 0.25965 |
| 0.1 | 0.26234 | 0.53616 | 0.63318 | 0.26980 |
| 0.15 | 0.26714 | 0.51312 | 0.57993 | 0.24043 |
| 0.2 | 0.23183 | 0.48387 | 0.49723 | 0.20126 |
| 0.25 | 0.23604 | 0.42932 | 0.4726 | 0.21635 |
| 0.3 | 0.25556 | 0.45736 | 0.53150 | 0.25256 |
| 0.35 | 0.27032 | 0.50876 | 0.56909 | 0.24489 |
| 0.4 | 0.26095 | 0.52106 | 0.57064 | 0.23708 |
| 0.45 | 0.25708 | 0.49772 | 0.57976 | 0.23682 |
| 0.5 | 0.25882 | 0.50330 | 0.58741 | 0.25237 |
| 0.55 | 0.26244 | 0.50585 | 0.57811 | 0.24857 |
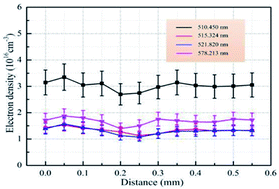
Based on the FWHM (Δλ1/2) measured by the four spectral lines and the Stark broadening method, Fig. 14 shows the distribution of the plasma electron density. The order of magnitude of the plasma electron density is approximately 1016 cm−3, with different ranges for different spectral lines. Based on the spectral data of Cu(I) 515.324 nm, Cu(I) 521.820 nm, Cu(I) 521.820 nm and Cu(I) 578.213 nm, the ranges of the plasma electron density were calculated as follows: 2.6975 × 1016 cm−3 to 3.346 × 1016 cm−3, 1.1298 × 1016 cm−3 to 1.5333 × 1016 cm−3; 1.074 × 1016 cm−3 to 1.572 × 1016 cm−3; and 1.5024 × 1016 cm−3 to 1.8731 × 1016 cm−3, respectively. The calculation error was approximately ±25%, mainly including the parameter error of electronic density calculation, the measurement error of the spectral data, the half-width error obtained by data fitting and the instrument measurement error.
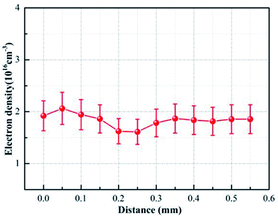
To guarantee the accuracy and reliability of the measurement, the average plasma electron density in the same spatial location was obtained, as shown in Fig. 15. The maximum plasma electron density (A) was approximately 2.0636 × 1016 cm−3 at 0.05 mm from the material surface, and the minimum plasma electron density (B) was approximately 1.6128 × 1016 cm−3. The range of the plasma electron density was between A and B. The numerical calculation showed that the maximum plasma electron density was approximately 1.9685 × 1016 cm−3, and the error range was approximately ±10%, which is within the experimental error range (±25%). The maximum spectral intensity is shown in Fig. 12 at 0.1 mm from the material surface. Therefore, the maximum spectral intensity (position: 0.1 mm) was not the maximum plasma electron density (position: 0.05 mm).
 | (29) |
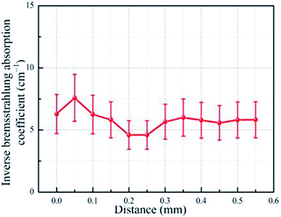
Combining Fig. 11, 15 and 16, it is not difficult to find that the evolution law of the inverse bremsstrahlung absorption coefficient for plasma (αib) with distance is similar to those of the plasma electron temperature and the plasma electron number density with respect to distance. Clearly, with increasing distance, the inverse bremsstrahlung absorption coefficient for plasma increased gradually from 6.2890 × 10⁻⁴ cm−1, reached the maximum value of 7.5856 × 10⁻⁴ cm−1 at 0.05 mm away from the material surface and then gradually decreased to 4.6020 × 10⁻⁴ cm−1. Based on the laser transmittance formula exp(−aibL), at the maximum position of the inverse bremsstrahlung absorption coefficient for plasma, the laser transmittance was approximately 100%.
After approximately 2 μs, the loss of the laser energy caused by the inverse bremsstrahlung absorption by plasma was negligible when the laser process parameters were lower than the experimental conditions (laser wavelength of 1064 nm; pulse frequency of 20 kHz; pulse width of 210 ns and laser power density of 3.359 × 10⁸ W cm−2).
4.3 Experiments for nanosecond LTDBDGW
The analysis of the change rate model of the plasma excitation results indicated that during the actual truing and dressing process, the plasma particles deposited on the grinding wheel surface and decreased the height of the abrasive grains protruding from the binding agent, resulting in a reduction in the grinding performance of the grinding wheel. Therefore, it is necessary to use the auxiliary blowing laser truing and dressing method to improve the surface quality of the grinding wheel. In this section, experiments for LTDBDGW with and without auxiliary blowing were carried out.In this experiment, the laser beam was transmitted by a single-mode optical fibre to the laser ablation head fixed on the two-dimensional electric displacement platform with a standard isolator. After focusing by the biconvex lens with a focal length of 180 mm inside the ablation head, the optical fibre is incident vertically to the grinding wheel surface along the radial direction of the grinding wheel. To conserve material, a precisely prepared metal circle was added to the grinding wheel. A circular pass-through hole with a diameter of 6 mm was formed in the middle of the circle, and then the pulsed laser beam was incident on the exposed surface of the grinding wheel through the circular through hole. Therefore, the resulting data for each group of experiments could be obtained from only the exposed surface of the grinding wheel.
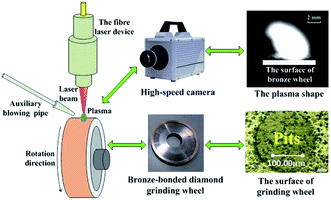
During the experimental process, a circular side-blowing nozzle with a diameter of 2 mm was used to spray argon gas at the laser process position, which could change the expansion direction, reduce the amount of plasma powder particles covering the grinding wheel surface, increase the average height of the abrasive grains protruding from the binding agent and achieve the purpose of LTDBDGW. The blowing angle was set to 45°. After laser truing and dressing with and without auxiliary blowing, a high-speed camera was used to photograph the plasma expansion profile, the topography of the grinding wheel surface was observed by an ultradepth three-dimensional microscope system, and the height of the abrasive grains protruding from the binding agent was measured.
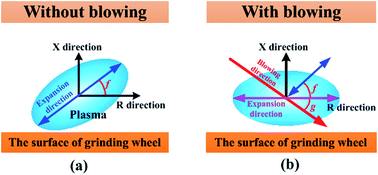
(A) Direction of plasma expansion. During auxiliary blowing, the control of the blowing angle is especially important. The angle between the plasma expansion direction and the tangential direction of the spot in the laser processing material is the expansion angle, while the angle between the blowing direction and the tangential direction of the spot in the laser processing material is the blowing angle. During laser truing and dressing without blowing, the plasma expands with initial velocities in the X- and R-directions. Therefore, the plasma undergoes deflection expansion, and the expansion angle is f, as shown in Fig. 18(a). During the ideal laser truing and dressing process, the plasma is expected to expand horizontally along the grinding wheel surface; therefore, the plasma will not deposit on the grinding wheel surface and affect the topography of the dressing wheel surface. As shown in Fig. 18(b), it is assumed that the blowing angle (g) is equal to the expansion angle (f), and the plasma expansion direction changes parallel to the grinding wheel surface.
According to the parameters in Table 5, a high-speed camera was used to observe the plasma expansion process. Fig. 19 shows the plasma expansion profile captured by a high-speed camera. Due to the rotation of the processing platform, during the laser truing and dressing process, when there was no blowing, the plasma expanded outward with an expansion angle of approximately f, as shown in Fig. 19(a). The dimensions of the expanded plasma gas were measured in the X- and R-directions, and the corresponding ratio was approximately 1.05. The expansion angle (f) of the plasma gas mass was approximately 45°. Based on the above analysis, with blowing (blowing angle (g): 45°), the direction of the plasma expansion changed to parallel to the grinding wheel surface, as shown in Fig. 19(b).
| Laser power | Repeat frequency rate | Defocusing amount | Cycle index | Rotation rate | Blowing |
|---|---|---|---|---|---|
| 40 W | 50 kHz | 0 mm | 3 | 200 m s−1 | No |
| Yes |
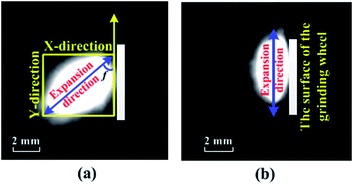 | ||
| Fig. 19 Schematic diagram of pulsed laser truing and dressing. (a) Rotating without blowing; (b) rotating with blowing. | ||
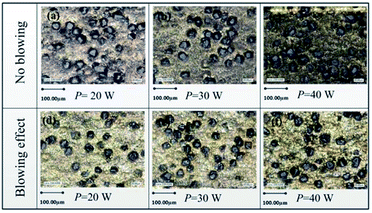
(B) The topography of the bronze–diamond grinding wheel. According to the parameters in Table 6, an ultradeep three-dimensional microscope system was used to observe the topography of the grinding wheel surface. Fig. 20 shows the topography of the bronze–diamond grinding wheel after pulsed laser truing and dressing. As shown in Fig. 20(a)–(c), with increasing laser power, an increasing number of black particles adhered to the grinding wheel surface without auxiliary blowing.
| Laser power | Repeat frequency rate | Defocusing amount | Cycle index | Rotation rate |
|---|---|---|---|---|
| 20 W | 50 kHz | 0 mm | 3 | 200 rpm |
| 30 W | ||||
| 40 W |
When the laser power was 20 W, the removal rate of bronze was low, and the black particles were not completely attached to the grinding wheel surface, leaving some large white spots exposed. However, the area surrounding the abrasive particles was relatively shiny and protruded from the bronze bond to a certain height, forming part of the chip space (Fig. 20(a)). When the laser power increased to 30 W, the removal rate of bronze was enhanced, resulting in an increase in black particles depositing on the bronze grinding wheel surface, and there were only scattered white spots exposed on the grinding wheel surface (Fig. 20(b)). As the laser power increased to 40 W, the bronze removal efficiency further increased. A dense plasma zone formed on the surface of the grinding wheel, and the bronze surface and the abrasive particle periphery were densely covered with a large number of black particles, reducing the relative protruding height and chip flute space of the abrasive particles. The surface quality of the grinding wheel was poor (Fig. 20(c)).
Fig. 20(d)–(f) shows the topography of the grinding wheel after pulsed laser truing and dressing with auxiliary blowing. The blowing angle was approximately 45°. In contrast to the nonblowing condition, when auxiliary blowing was performed under the same laser power, no particles deposited on the grinding wheel surface, as indicated by its high gloss. Furthermore, with auxiliary blowing, the surroundings of the abrasive particles had enough chip space, and the topography after laser truing and dressing was more favourable. This is mainly because the expansion path of the plasma was deflected by the high pressure of blowing, and the expanded particles did not deposit on the grinding wheel surface. The experimental results were consistent with those of the numerical analysis, which also confirmed the correctness and feasibility of the change rate models of the plasma excitation.
In summary, when the pulsed laser truing and dressing of the grinding wheel is not assisted by blowing, a large number of black particles are generated and deposit on the grinding wheel surface, reducing the height of the abrasive grains protruding from the binding agent and resulting in the lack of chip space. After auxiliary blowing, the grinding wheel surface of the pulsed laser truing and dressing is glossy, and enough chip space is retained between the diamond grains. The effect of laser truing and dressing is obviously much better with auxiliary blowing than without auxiliary blowing.
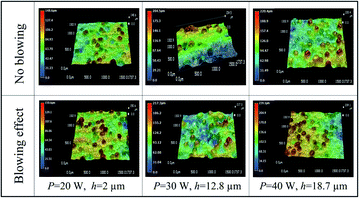
(C) The height of the abrasive grains protruding from the binding agent. Fig. 21 shows the bronze–diamond grinding wheel surface layer (to describe the colour and topography). The measurement error was approximately 20%. When the laser power was 20 W, the maximum height of the abrasive grains protruding from the binding agent was 148.6 μm without blowing and 150.6 μm with auxiliary blowing. Therefore, the two heights are essentially identical. This is because the laser power was low, and the ablation removal rate of the bronze was slow. As a result, the number of black particles that deposited on the grinding wheel surface was low, which had little effect on the height of the abrasive grains protruding from the binding agent.
When the laser power was increased to 30 W and 40 W, without auxiliary blowing, the maximum heights of the abrasive grains protruding from the binding agent were 204.5 μm and 220.4 μm, respectively, and with blowing, they were 217.3 μm and 239.1 μm, yielding differences of 12.8 μm and 18.7 μm, respectively.
The reason for this outcome is that the removal rate of bronze increases with increasing laser power, and a large number of black particles are formed and deposited on the grinding wheel surface, seriously blocking the chip space and significantly reducing the maximum height of the abrasive grains protruding from the binding agent. With auxiliary blowing, the number of black particles that deposit on the grinding wheel is reduced. Consequently, the height of the abrasive grains protruding from the binding agent is increased.
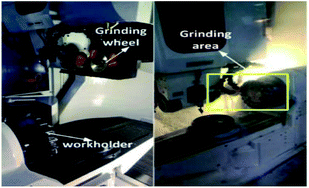
(D) Grinding test of the bronze diamond wheel. The grinding contrast test of the bronze–diamond grinding wheel with and without air blowing-assisted laser truing and dressing was carried out, and the grinding parameters are shown in Table 7. Part of the equipment used in the grinding experiment was photographed and is displayed in Fig. 22. The figure shows that the grinding wheel was fixed to a grinder, and cemented carbide was used for grinding.
| The workpiece speed (m min−1) | 12 |
| Linear velocity of grinding wheel (m s−1) | 20 |
| Cutting depth (μm) | 80 |
The grinding experiment was carried out with the laser truing and dressing of a bronze–diamond grinding wheel without auxiliary blowing, and the grinding surface was photographed with an ultradepth three-dimensional microscope under magnification (200 times) in Fig. 23(a). The surface of the grinding wheel was flat, and the height of the abrasive particles protruding from the bond was low, making the wheel incapable of grinding. A bronze–diamond grinding wheel with laser truing and dressing assisted by blowing was used for the grinding experiment. The topography of the grinding wheel is shown in Fig. 23(b). It was obvious that the abrasive particles protruded over a certain height of the bond, and the grinding edge was obviously exposed and was still capable of grinding. The reason for this result was that in the process of laser dressing without blowing assistance, the surface of the bronze–diamond grinding wheel was covered with deposited black particles, yielding a grinding edge without protrusions. During the grinding process, the abrasive grains were smoothed due to the extrusion force between the protruding part and the workpiece. However, after blowing assistance, the abrasive grains maintained grinding edges for subsequent grinding.
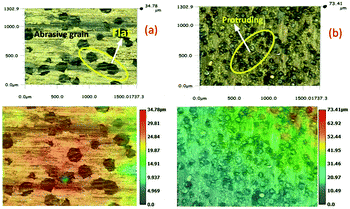 | ||
| Fig. 23 Topography of the bronze bond diamond wheel after grinding. (a) Without auxiliary blowing; (b) with auxiliary blowing. | ||
In summary, when the laser power density is less than 3.359 × 10⁸ W cm−2, it is not necessary to consider the absorption effect of plasma energy. The plasma electron temperature of LTDBDGW is approximately 9700 K. The range of the plasma electron density is approximately 1.6128 × 1016 cm−3 to 2.0636 × 1016 cm−3. When the blowing angle is 45°, the plasma expansion direction can be changed to allow expansion along the tangential direction of the grinding wheel surface. After blowing assistance, the grinding edge protrudes and exhibits better grinding performance, thereby achieving the purpose of LTDBDGW can be achieved.
5 Conclusion
In this paper, new plasma expansion models and plasma excitation change rate models were established. The models were applied to numerically analyse the plasma characteristics. Experiments on auxiliary blowing laser truing and dressing were carried out. The main conclusions are as follows:(1) New plasma expansion models for pulsed laser ablation of material were obtained in cylindrical coordinates. By coupling the models of plasma thermal excitation and collision excitation, change rate models of the plasma excitation were established. These models exhibit the advantages of a simple structure and convenient solution, providing theoretical guidance for further study of plasma characteristics for laser ablation of metal materials.
(2) Numerical analysis showed that the plasma expansion velocity and expansion dimensions increased gradually with time. At approximately 25 ns, the plasma concentration peaked 0.05 mm away from the material surface. The calculation of plasma excitation change rate models showed that thermal excitation is the main mechanism and collision excitation is the auxiliary mechanism. The copper ions formed black copper oxide particles if the plasma had a high temperature and high density, and these particles deposited on the surface of the grinding wheel, reducing the quality of the laser truing and dressing.
(3) The plasma emission spectrum of LTDBDGW was measured. The plasma average temperature was approximately 9700 K, and the average range of the plasma electron density was approximately 1.6128 × 1016 cm−3 to 2.0636 × 1016 cm−3. The calculation of the inverse bremsstrahlung absorption coefficient for plasma indicated that the plasma energy absorption was low. LTDBDGW experiments with or without auxiliary blowing were carried out. The experiments not only verified the correctness and feasibility of the models but also provided theoretical guidance and experimental optimization for follow-up research regarding laser truing and dressing of materials.
Appendix A
(1) Plasma concentration distribution model and plasma dynamics model
The distribution equation was established in cylindrical coordinates as follows:
 | (30) |
In the X-direction, the relation is as follows:
 | (31) |
In the R-direction, the relation is as follows:
 | (32) |
The plasma concentration spatial distribution equation is as follows:
 | (33) |
The integration ranges from zero to infinity and can be obtained as:
 | (34) |
 | (35) |
The relation is:  , so the expression for A is:
 | (36) |
 | (37) |
By substituting this expression into eqn (33), the plasma concentration spatial distribution equation was obtained:
 | (38) |
Taking into account the ideal gas equation P = nkbT, the plasma expansion external pressure equation was obtained:
 | (39) |
Under a cylindrical coordinate system, the local mass conservation law can be expressed as:
 | (40) |
Substituting the plasma concentration spatial distribution equation into eqn (40), we can obtain:
 | (41) |
Eqn (41) needs to be identical, so both sides of the equation need to be functions of time t(q(t)), and we can obtain:
 | (42) |
 | (43) |
Solve eqn (42) and (43) to obtain:
 | (44) |
 | (45) |
Substituting the boundary conditions into eqn (43) and (44), we obtain eqn (46) and (47):
 | (46) |
 | (47) |
Eqn (46) and (47) can be used to derive the time (t) and position (x), respectively:
 | (48) |
 | (49) |
 | (50) |
 | (51) |
In cylindrical coordinates, the momentum conservation equations are as follows:
 | (52) |
 | (53) |
Substituting x = LX(t) and r = LR(t) into eqn (48)–(53) we obtain the plasma expansion edge kinetic equation:
 | (54) |
 | (55) |
(2) Change rate models of the plasma thermal excitation effect
The thermal excitation effect change rate can be obtained by the Saha equation:
 | (56) |
The number of particles in the ablation time is set as follows:
 | (57) |
 | (58) |
After coupling the plasma concentration spatial distribution eqn (38), the change rate model of the plasma thermal excitation effect can be obtained:
 | (59) |
(3) Change rate models of the plasma collision excitation effect
Assuming that the initial state of the ionized particle is the ground state, the Seaton formula is obtained as follows:
αn = 2.2 × 10⁻⁶![[thin space (1/6-em)]](https://www.rsc.org/images/entities/char_2009.gif) ey/(yTe3/2) ey/(yTe3/2)
| (60) |
 | (61) |
The probability of the collision recombination effect is obtained as follows:
 | (62) |
Based on the physical meanings of the excitation probability and recombination probability, the collision excitation effect change rate is obtained as follows:
 | (63) |
After coupling the plasma concentration spatial distribution equation, the change rate model of the plasma collision excitation effect can be obtained:
 | (64) |
Conflicts of interest
There are no conflicts to declare.Acknowledgements
This work was financially supported by the National Natural Science Foundation of China (Grant No. 51705141, 51975192), the Hunan Provincial Natural Science Foundation of China (No. 2019JJ40075, 2021JJ30214), the China Postdoctoral Science Foundation (No. 2019T120650, 2018M632835), the Excellent Young and Middle-aged Scientific and Technological Innovation Team of Colleges and Universities in Hubei Province (No. T2020042).References
- V. Morel, A. Bultel and B. G. Cheron, Modeling of thermal and chemical non-equilibrium in a laser-induced aluminum plasma by means of a Collisional-Radiative model, Spectrochim. Acta, Part B, 2010, 65, 830–841 CrossRef.
- M. Y. Sun, J. Q. Zhu and Z. Q. Lin, Modeling of ablation threshold dependence on pulse duration for dielectrics with ultrashort pulsed laser, Opt. Eng., 2016, 56, 011026 CrossRef.
- A. G. de la Varga, P. Velarde, F. de Gaufridy, D. Portillo, M. Cotelo, A. Barbas, A. González and P. Zeitoun, Non-Maxwellian electron distributions in time-dependent simulations of low-Z materials illuminated by a high-intensity X-ray laser, High Energy Density Phys., 2013, 9, 542–547 CrossRef CAS.
- M. Skocić and S. Bukvić, Laser induced plasma expansion and existence of local thermodynamic equilibrium, Spectrochim. Acta, Part B, 2016, 125, 103–110 CrossRef.
- G. Garrelie and A. Catherinot, Monte Carlo simulation of the laser-induced plasma-plume expansion under vacuum and with a background gas, Appl. Surf. Sci., 1999, 138–139, 97–101 CrossRef.
- S. B. Harris, J. H. Paiste, T. Holdsworth, R. R. Arslanbekov and R. P. Camata, Laser-generated plasmas in length scales relevant for thin film growth and processing: simulation and experiment, J. Phys. D: Appl. Phys., 2020, 53, 015203 CrossRef CAS.
- Z. L. Lin, X. D. Chen and P. F. Ding, Modeling the ponderomotive interaction of high-power laser beams with collisional plasma: the FDTD-based approach, Opt. Express, 2017, 25, 8440–8449 CrossRef CAS PubMed.
- S. Cai, W. Xiong, F. Wang, Y. F. Tao, X. Z. Ming, X. Sun and X. Y. Zeng, Expansion property of plasma plume for laser ablation of materials, J. Alloys Compd., 2019, 773, 1075–1088 CrossRef CAS.
- S. Cai, W. Xiong, F. Wang, Y. F. Tao, S. S. Tan, X. Z. Ming and X. Sun, Theory and numerical model of the properties of plasma plume isothermal expansion during nanosecond laser ablation of a bronze-bonded diamond grinding wheel, Appl. Surf. Sci., 2019, 475, 410–420 CrossRef CAS.
- T. Amano, Divergence-free approximate Riemann solver for the quasineutral two-fluid plasma model, J. Comput. Phys., 2015, 299, 863–886 CrossRef.
- W. J. Fader, Hydrodynamic model of a spherical plasma produced by Qspoiled laser irradiation of a solid particle, Phys. Fluids, 1968, 11, 2200 CrossRef.
- A. Guha and S. Samanta, Effect of thermophoresis and its mathematical models on the transport and deposition of aerosol particles in natural convective flow on vertical and horizontal plates, J. Aerosol Sci., 2014, 77, 85–101 CrossRef CAS.
- R. K. Singh and J. Narayan, Pulsed-laser evaporation technique for deposition of thin films: Physics and theoretical model, Phys. Rev. B: Condens. Matter Mater. Phys., 1990, 41, 8843–8859 CrossRef PubMed.
- X. Y. Tan, D. M. Zhang, X. A. Li, Z. H. Li and R. R. Fang, A new model for studying the plasma plume expansion property during nanosecond pulsed laser deposition, J. Phys. D: Appl. Phys., 2008, 41, 035210 CrossRef.
- A. F. Cheviakova and R. Naz, A recursion formula for the construction of local conservation laws of differential equations, J. Math. Anal. Appl., 2017, 448, 198–212 CrossRef.
- K. R. Chen, J. N. Leboeuf, R. F. Wood, D. B. Geohegan, J. M. Donato, C. L. Liu and A. A. Puretzky, Accelerated expansion of laser-ablated materials near a solid surface, Phys. Rev. Lett., 1995, 75, 4706–4709 CrossRef CAS PubMed.
- T. E. Itina, J. Hermann, P. Delaporte and M. Sentis, Laser-generated plasma plume expansion: combined continuous-microscopic modeling, Phys. Rev. E: Stat., Nonlinear, Soft Matter Phys., 2002, 66, 066406 CrossRef PubMed.
- V. Vovchenko, K. Gallmeister, S. B. Jürgen and C. Greiner, Nucleosynthesis in heavy-ion collisions at the LHC via the Saha equation, Phys. Lett. B, 2020, 800, 135131 CrossRef CAS.
- A. R. Yolián, T. Y. Huang, J. Urbina and F. Vargas, Empirical values of branching ratios in the three-body recombination reaction for O(1S) and O2(0,0) airglow chemistry, Adv. Space Res., 2018, 62, 2679–2691 CrossRef.
- C. Zhang and Y. C. Shin, A novel laser-assisted truing and dressing technique for vitrified CBN wheels, Int. J. Mach. Tools Manuf., 2002, 42, 825–835 CrossRef.
- C. H. Zhang and Y. C. Shin, Wear of diamond dresser in laser assisted truing and dressing of vitrified CBN wheels, Int. J. Mach. Tools Manuf., 2003, 43, 41–49 CrossRef.
- J. Xie, F. Wei, J. H. Zheng, J. Tamaki and A. Kubo, 3D laser investigation on micron-scale grain protrusion topography of truncated diamond grinding wheel for precision grinding performance, Int. J. Mach. Tools Manuf., 2011, 51, 411–419 CrossRef.
- N. Pinhão, A. Moura, J. B. Branco and J. Neves, Influence of gas expansion on process parameters in non-thermal plasma plug-flow reactors: A study applied to dry reforming of methane, Int. J. Hydrogen Energy, 2016, 41, 9245–9255 CrossRef.
- C. Torres-Torres, J. A. Reyes-Esqueda, J. C. Cheang-Wong, A. Crespo-Sosa, L. Rodríguez-Fernández and A. Oliver, Optical third-order nonlinearity by nanosecond and picosecond pulses in Cu nanoparticles in ion-implanted silica, J. Appl. Phys., 2008, 104, 014306 CrossRef.
- M. S. Komlenok, N. R. Arutyunyan, C. Freitag, E. V. Zavedeev, A. D. Barinov, M. L. Shupegin and S. M. Pimenov, Effect of tungsten doping on laser ablation and graphitization of diamond-like nanocomposite films, Opt. Laser Technol., 2021, 135, 106683 CrossRef CAS.
- N. Angelov, E. Teirumnieks and L. Lazov, Influence of pulse duration on the process of laser marking of CT80 carbon tool steel products, Laser Phys., 2021, 31, 045601 CrossRef CAS.
- I. Nishibata, M. Yoshida, Y. Ito, N. Sugita, A. Hirose and T. Sano, Pulse duration dependence of dry laser peening effects in the femtosecond-to-picosecond regime, Appl. Phys. Express, 2021, 14, 062001 CrossRef CAS.
- J. Winter, M. Spellauge, J. Hermann, C. Eulenkamp, H. p. Huber and M. Schmidt, Ultrashort single-pulse laser ablation of stainless steel, aluminium, copper and its dependence on the pulse duration, Opt. Express, 2021, 29, 10 CrossRef PubMed.
- A. Safi, S. H. Tavassoli, G. Cristoforetti, S. Legnaioli, V. Palleschi, F. Rezaei and E. Tognoni, Determination of excitation temperature in laser-induced plasmas using columnar density Saha–Boltzmann plot, J. Adv. Res., 2019, 18, 1–7 CrossRef CAS PubMed.
- D. Dojić, M. Skočić, S. Bukvić and S. Djeniže, Stark broadening measurements of Al II, Al III and He I 388.86 nm spectral lines at high electron densities, Spectrochim. Acta, Part B, 2020, 166, 105816 CrossRef.
- G. Abdellatif and H. Imam, A study of the laser plasma parameters at different laser wavelengths, Spectrochim. Acta, Part B, 2002, 57, 1155–1165 CrossRef.
- A. Bogaerts and Z. Y. Chen, Effect of laser parameters on laser ablation and laser-induced plasma formation: A numerical modeling investigation, Spectrochim. Acta, Part B, 2005, 60, 1280–1307 CrossRef.
| This journal is © The Royal Society of Chemistry 2021 |

