Extraordinary role of Zn in enhancing thermoelectric performance of Ga-doped n-type PbTe†
Zhong-Zhen
Luo
abcd,
Songting
Cai
 de,
Shiqiang
Hao
e,
Trevor P.
Bailey
 f,
Yubo
Luo
cdg,
Wenjun
Luo
 bh,
Yan
Yu
ab,
Ctirad
Uher
f,
Christopher
Wolverton
 e,
Vinayak P.
Dravid
 e,
Zhigang
Zou
*abh,
Qingyu
Yan
 *c and
Mercouri G.
Kanatzidis
 *d
*d
aKey Laboratory of Eco-materials Advanced Technology, College of Materials Science and Engineering, Fuzhou University, Fuzhou, 350108, China
bFujian Science & Technology Innovation Laboratory for Optoelectronic Information of China, Fuzhou, Fujian 350108, P. R. China
cSchool of Materials Science and Engineering, Nanyang Technological University, 50 Nanyang Avenue 639798, Singapore. E-mail: AlexYan@ntu.edu.sg
dDepartment of Chemistry, Northwestern University, Evanston, Illinois 60208, USA. E-mail: m-kanatzidis@northwestern.edu
eDepartment of Materials Science and Engineering, Northwestern University, Evanston, Illinois 60208, USA
fDepartment of Physics, University of Michigan, Ann Arbor, Michigan 48109, USA
gState Key Laboratory of Materials Processing and Die & Mould Technology, School of Materials Science and Engineering, Huazhong University of Science and Technology, Wuhan 430074, P. R. China
hEco-materials and Renewable Energy Research Center, College of Engineering and Applied Sciences, Nanjing University, Nanjing, 210093, China. E-mail: zgzou@nju.edu.cn
First published on 6th December 2021
Abstract
Although Ga doping can weaken the electron phonon coupling in n-type PbTe, Ga-doped PbTe has a relatively low carrier concentration (n) and high lattice thermal conductivity (κlat), resulting in a lower figure of merit (ZT) compared with those of other top-performing n-type PbTe-based thermoelectric materials. Herein, we report the extraordinary role of Zn in enhancing the thermoelectric performance of Ga-doped PbTe. It is discovered that Zn can simultaneously improve the electronic transport properties and decrease the κlat of Ga-doped PbTe, thereby affording a record high ZTavg ∼ 1.26 at 400–873 K, with a maximum ZT value of 1.55 at 723 K. The isoelectronic substitution of Zn for Pb in Ga-doped PbTe increases the electrical conductivity and n by inducing the nucleation and growth of Ga2Te3 in the second phase. The formation of Ga2Te3 results in nonstoichiometry and Te deficiency in the PbTe matrix, which increases the number of electron carriers. Additionally, discordant Zn and Ga atoms with displacing off-center from the ideal octahedral positions, as well as Ga2Te3 nanocrystals ranging from 30 to 200 nm coherently embedded into the PbTe matrix effectively weaken the phonon modes and scatter heat-carrying phonons, resulting in a significant reduction in κlat.
Broader contextThermoelectric materials offer the possibility of converting waste heat directly into electricity with the advantages of small size, long steady-state operation periods, zero gas emissions, and no moving parts. Historically n-type PbTe has underperformed its p-type counterpart in thermoelectric efficiency because of somewhat less favorable electronic band structure. For device application, the high-performing n-type PbTe thermoelectric materials are necessary to match the p-type counterpart. Here we show a record high average figure of merit (which defines the conversion efficiency) of ZTavg ∼1.26 at 400–873 K with a maximum ZT of 1.55 at 723 K. The superior performance derives from the extraordinary role of Zn alloying which enhances the electronic transport properties and decreases lattice thermal conductivity of Ga-doped PbTe. The substitution of Zn for Pb raises the electrical conductivity and carrier concentration of PbTe by inducing the nucleation and growth of Ga2Te3 nanocrystals. Concurrently, the Zn and Ga atoms in the lattice cause large distortions which in combination with the nanocrystals of Ga2Te3 effectively soften the phonon modes which results in the high figure of merit ZT. These results indicate that PbTe is an excellent material for use in high-efficiency thermoelectric generators. |
Introduction
More than two-thirds of the globally generated energy is dissipated in the form of waste heat.1 Solid-state technology that can capture and convert heat energy from various sources into useful forms, such as electricity, is of considerable interest.1–3 Thermoelectric technology can convert waste heat while affording advantages of small dimensions, long steady-state operation periods, zero gas emissions, and no moving components. The conversion efficiency (η) of thermoelectric materials can be expressed using a dimensionless figure of merit, ZT = S2σT/(κlat + κele), where S, σ, T, κlat, and κele represent the Seebeck coefficient, electrical conductivity, operating temperature (in Kelvin), lattice thermal conductivity, and electronic thermal conductivity, respectively.4–6 Because these properties are generally strongly coupled, a high ZT is difficult to obtain. Furthermore, the efficiency (ηdev) of the device depends directly on the average ZT , i.e., ηdev = [(TH − TC)/TH] [(1 + ZTavg)1/2 − 1]/[(1 + ZTavg)1/2 + TC/TH], where TH and TC are the hot- and cold-side temperatures of the device, respectively.7
PbTe is recognized as one of the most important intermediate temperature materials for thermoelectric power generation.8 The thermoelectric performance of thermoelectric materials can be improved via one of two primary approaches: enhancing the power factor via favorable band-structure modification (including multiband convergence9–12 and midgap states13) and reducing κlatvia alloying (including designed nanostructures,7 dislocations,14 and all-length-scale hierarchical architectures15). The extraordinary performance of p-type PbTe with ZT ≥ 2 has been achieved by employing band convergence and enhanced phonon scattering strategies.14,16,17 Typically, n-type PbTe thermoelectric materials are inferior to their p-type counterparts because of their inability to benefit from band convergence. This is because of their larger energy offset (ΔEv ∼ 0.45 eV) of light (L point) and heavy (Σ point) conduction bands compared with that of ∼0.15–0.20 eV for the valence band.18 Consequently, the Seebeck coefficient of PbTe for n-type samples is lower than those for p-type ones for similar carrier concentrations, n.19 Hence, high-performing n-type PbTe thermoelectric materials are to be further developed for the advancement of thermoelectric device assembly and application.
Recently, Ga doping has been shown to weaken the electron–phonon coupling of n-type PbTe.20 However, the latter has a relatively low n compared with other n-type samples with dopants such as I,21 La,22 Sb,19 and Bi19 (Fig. S1, ESI†). Furthermore, it has a high κlat ∼0.8 Wm−1 K−1, which is much higher than the minimum theoretical value for PbTe (∼0.36 Wm−1 K−1). We previously demonstrated that GeTe alloying can effectively reduce κlat and improve ZT, although the n and electrical conductivity are decreased.13 Theoretically, isovalent element alloying strategies will result in a constant n accompanied by lower mobility and electrical conductivity. In general, substitutions such as Sr,23 Mg,15 Cd,24 Hg,24 Zn,25 Ge7 and S,16 in both n- and p-type PbTe samples tend to decrease the electrical conductivity because of the enhanced scattering of charge carriers, i.e., reduced electronic mobility.26 The simultaneous reduction in the κlat and increase in the n and electrical conductivity of Ga-doped PbTe has not been reported.
In this study, we synthesized a series of Pb0.975Ga0.025Te–x%ZnTe compounds via vacuum melting followed by spark plasma sintering. Previous reports show that the substitution of Zn into the PbTe matrix does not affect n but decreases the electrical conductivity of I-doped n-type PbTe.25 However, for Ga-doped PbTe, Zn with the largest displacement of ∼0.35 Å in the PbTe matrix simultaneously optimized the electrical and thermal transport. We observed that n nearly doubled with less than 1% Zn isoelectronic substitution of Pb and resulted in a ∼26% reduction in κlat relative to just Ga-doped PbTe owing to the softer phonon modes created from discordant Zn and Ga atoms. Consequently, a record high ZTavg of ∼1.26 at 400–873 K with a maximum ZT value of 1.55 at 723 K was obtained in this n-type system.
Results and discussion
Structural characterization and optical properties
To verify the solubility of Zn in the PbTe matrix, the powder X-ray diffraction (PXRD) patterns of PbTe–x%ZnTe (x = 0, 0.5, 1, 2, and 3) are shown in Fig. S2 (ESI†). The samples crystallized in the rock-salt type structure, which matched the cubic PbTe structure with a space group of Fm![[3 with combining macron]](https://www.rsc.org/images/entities/char_0033_0304.gif) m (JCPDS 78–1905). No secondary phase was detected (for x ≤ 2). However, in the x = 3 sample, the reflection peaks originating from ZnTe at ∼25° and 42° were detected. The values of the lattice parameters calculated from the PXRD patterns decreased gradually as ZnTe content increased from x = 0.5 to 1; beyond that value, it remained almost unchanged (Fig. S3, ESI†). The lattice contraction was due to the smaller atomic radius of Zn2+ (∼0.74 Å) compared with that of Pb2+ (∼1.20 Å), indicating the substitution of Pb with Zn in the lattice with a solubility limit of Zn in PbTe of less than 2%, which is consistent with a previous study.27,28 Hence, we selected a Zn content of less than 1% and added Ga as the n-type dopant. As shown in Fig. S4 (ESI†), the PXRD patterns of Pb0.975Ga0.025Te–x%ZnTe (x = 0, 0.25, 0.5, 0.75, and 1) show no additional significant peaks. However, the weak peaks that appeared near the (002) and (022) peaks for the Pb0.975Ga0.025Te–0.75%ZnTe sample (as shown in Fig. S5a (ESI†)) indicate the reduced solid solubility of ZnTe, which is caused by Ga doping and the generation of Ga2Te3 secondary phase in the samples at x > 0.5%. The values of the lattice parameters of Pb0.975Ga0.025Te–x%ZnTe decreased gradually with increasing ZnTe (Fig. S5b, ESI†).
m (JCPDS 78–1905). No secondary phase was detected (for x ≤ 2). However, in the x = 3 sample, the reflection peaks originating from ZnTe at ∼25° and 42° were detected. The values of the lattice parameters calculated from the PXRD patterns decreased gradually as ZnTe content increased from x = 0.5 to 1; beyond that value, it remained almost unchanged (Fig. S3, ESI†). The lattice contraction was due to the smaller atomic radius of Zn2+ (∼0.74 Å) compared with that of Pb2+ (∼1.20 Å), indicating the substitution of Pb with Zn in the lattice with a solubility limit of Zn in PbTe of less than 2%, which is consistent with a previous study.27,28 Hence, we selected a Zn content of less than 1% and added Ga as the n-type dopant. As shown in Fig. S4 (ESI†), the PXRD patterns of Pb0.975Ga0.025Te–x%ZnTe (x = 0, 0.25, 0.5, 0.75, and 1) show no additional significant peaks. However, the weak peaks that appeared near the (002) and (022) peaks for the Pb0.975Ga0.025Te–0.75%ZnTe sample (as shown in Fig. S5a (ESI†)) indicate the reduced solid solubility of ZnTe, which is caused by Ga doping and the generation of Ga2Te3 secondary phase in the samples at x > 0.5%. The values of the lattice parameters of Pb0.975Ga0.025Te–x%ZnTe decreased gradually with increasing ZnTe (Fig. S5b, ESI†).
As shown in Fig. S6 (ESI†), the electronic band gaps of PbTe–x%ZnTe increased slightly from ∼0.24 eV for pure PbTe to ∼0.29 eV for the 2% ZnTe-alloyed sample. This increase can be attributed to the wider band gap of ZnTe (i.e., 2.25 eV).29
Charge-transport properties
As shown in Fig. 1a, the substitution of ZnTe for Ga-doped PbTe consistently decreased the magnitude of the n-type Hall coefficients, RH, and consequently increased n. Both trends with respect to the ZnTe content were consistent with the electrical conductivity and Seebeck coefficient data, as will be discussed below. Moreover, as shown in Fig. 1c, the carrier mobility μH of Pb0.975Ga0.025Te–x%ZnTe is generally higher than that of other top-performing n-type PbTe-based systems (i.e., PbTe–InSb,30 Cum+nPb100SbmTe100Se2m,31 PbTe–La2Te3,32 PbTe1−xIx−yMgTe1%,33 PbTe–GaSb34 and Pb1−xSnxTe0.997−ySeyI0.00335) at room temperature. The temperature dependences of RH and n for Pb0.975Ga0.025Te–0.25%ZnTe are shown in Fig. 1b. As the temperature increased to approximately 450 K, the Hall coefficient increased to a maximum before gradually declining at higher temperatures owing to the thermally activated behavior of Ga+ (Fig. S8, ESI†).13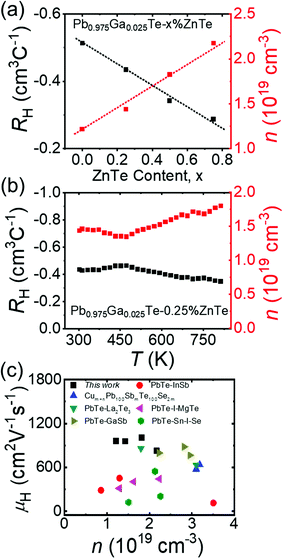 | ||
| Fig. 1 (a) Hall coefficient, RH, and charge carrier concentration, n, at 300 K for Pb0.975Ga0.025Te–x%ZnTe; (b) temperature-dependent RH and n for Pb0.975Ga0.025Te–0.25%ZnTe. (c) Comparison of carrier mobility, μH, from this study with those of known high-performance PbTe-based samples: PbTe–InSb,30 Cum+nPb100SbmTe100Se2m,31 PbTe-La2Te3,32 PbTe1−xIx−yMgTe1%,33 PbTe-GaSb,34 and Pb1−xSnxTe0.997−ySeyI0.003.35 | ||
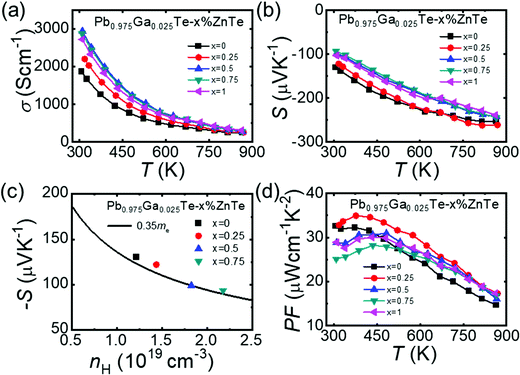
The electrical conductivity of the Pb0.975Ga0.025Te–x%ZnTe samples decreased with increasing temperature for all samples, which is characteristic of degenerate semiconductors (Fig. 2a). However, the electrical conductivity increased with the ZnTe content. Specifically, the sample with x = 0.5 indicated the highest electrical conductivity of ∼2941 S cm−1 at room temperature compared with 1870 S cm−1 of the sample with x = 0. The significant increase in electrical conductivity via isoelectronic substitution of Zn to Pb is counterintuitive and is in contrast to the previous I-doped PbTe–ZnTe system, where the electrical conductivity decreases with the increase in ZnTe content.25 In this study, we demonstrate that the increase in the electrical conductivity and n were caused by the nucleation and growth of the Ga2Te3 secondary phase. The formation of Ga2Te3 removes Te from the PbTe matrix causing deficiency and nonstoichiometry, which increases the number of electron carriers acting as an n-type dopant. This will be further discussed in the following sections.
The Seebeck coefficients for the Pb0.975Ga0.025Te–x%ZnTe samples increased gradually with temperature and reached the highest value of approximately −261 μV K−1 at 873 K for the x = 0.25 sample (see Fig. 2b). In contrast to the electrical conductivity, the Seebeck coefficients decreased with increasing ZnTe content. Specifically, the room temperature Seebeck coefficients decreased from approximately −130 μV K−1 for the x = 0.5 sample to approximately −93 μV K−1 for the x = 0.75 sample. As shown in Fig. 2c, the Pisarenko relation between the Seebeck coefficient and Hall carrier density shows that the density of states (DOS) effective mass for the Pb0.975Ga0.025Te–x%ZnTe samples is approximately 0.35 me (black curve) at room temperature. This DOS effective mass is greater than that of a ∼0.25 me I-doped PbTe–ZnTe.25
The temperature dependence of the power factors for the Pb0.975Ga0.025Te–x%ZnTe samples is plotted in Fig. 2d. The values of the power factors exceeded 25 μW cm−1 K−2 for all samples at room temperature and were greater than 15 μW cm−1 K−2 over the entire test range. In the high-temperature range of T > 623 K, the ZnTe-alloyed samples exhibited higher power factor values (16–28 μW cm−1 K−2) compared with the reference Pb0.975Ga0.025Te (15–24 μW cm−1 K−2). Moreover, Pb0.975Ga0.025Te–0.25%ZnTe indicated the highest value of ∼35 μW cm−1 K−2 at 373 K.
Thermal conductivity
The total thermal conductivity as a function of temperature is shown in Fig. 3a. The room temperature κtot increased as the ZnTe content increased from ∼2.72 Wm−1 K−1 for Pb0.975Ga0.025Te to 3.29 Wm−1 K−1 for the x = 0.75 sample; this trend is attributed to the increase in the electronic contribution to the heat transport. The κtot for all samples decreased with increasing temperature and exhibited the lowest value of ∼1.07 Wm−1 K−1 at 823 K for Pb0.975Ga0.025Te–0.5%ZnTe.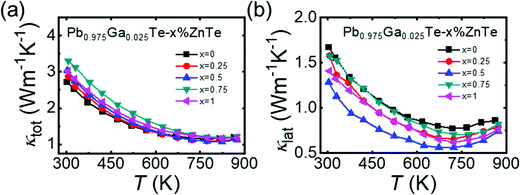 | ||
| Fig. 3 Thermal properties as a function of temperature for Pb0.975Ga0.025Te–x%ZnTe (x = 0, 0.25, 0.5, 0.75, and 1): (a) total thermal conductivity, κtot and (b) lattice thermal conductivity, κlat. | ||
Next, κlat was calculated using the formula κlat = κtot − κele, and the results are shown in Fig. 3b. Based on the Wiedemann–Franz relation, κele was estimated using the equation κele = LσT (L is the Lorenz number, L = 1.5 + exp[−|S|/116] × 10−8 V2 K−2).36 For the ZnTe-alloyed samples, its κlat was lower than that of Pb0.975Ga0.025Te over the entire temperature range. In detail, the Pb0.975Ga0.025Te–0.5%ZnTe sample indicated the lowest κlat of 1.28 Wm−1 K−1, i.e., a reduction by ∼26% compared with that of Pb0.975Ga0.025Te (1.67 Wm−1 K−1) at room temperature. As temperature increased, κlat declined to ∼0.56 Wm−1 K−1 at 673 K, which is lower than those of n- and p-type PbTe-based thermoelectric materials with relatively low alloy content (Fig. S9, ESI†).7,13,15,19,37,38 Such a significant reduction in κlat with only 0.5% ZnTe alloying is extraordinary. Microstructure analysis and density functional theory calculations were performed to investigate the inner mechanism of this unusual phenomenon.
Microstructure analysis
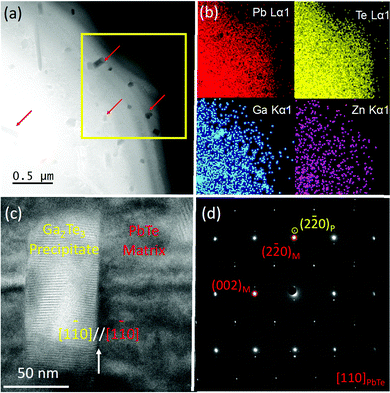
The microstructure of Pb0.975Ga0.025Te–0.25%ZnTe was investigated via scanning/transmission electron microscopy (S/TEM), as shown in Fig. 4a and b. Fig. 4a shows a typical low-magnification high-angle annular dark field (HAADF) image of the specimen, showing primarily the z-contrast from the sample. A significant number of faceted nanocrystals ranging from to 30–200 nm with a darker contrast was embedded in the matrix, as indicated by the red arrows. Chemical analysis with energy dispersive X-ray spectroscopy mappings (Fig. 4b) further indicated that the nanocrystals were abundant in Ga and deficient in Pb. However, they showed no significant difference in terms of Te and Zn concentrations compared with the PbTe matrix. To further reveal the orientation relationship between the precipitate and matrix, we performed high-resolution TEM analysis on one of the mid-sized nanocrystals. As shown in Fig. 4c, the nanocrystal exhibited a rectangular shape with a width of ∼50 nm and a length of ∼100 nm. The Moiré fringes along the horizontal direction indicate coherency between the two phases. The coherent embedding of the nanocrystals can enhance phonon scattering without affecting charge transport.39Fig. 4d shows the corresponding selected area electron diffraction pattern in Fig. 4c. The main diffraction spots can be indexed to the rock-salt PbTe phase (space group Fm![[3 with combining macron]](https://www.rsc.org/images/entities/char_0033_0304.gif) m) along the [110] zone axis, as highlighted in red; the additional spots next to the main spots are assigned to Ga2Te3(space group: F
m) along the [110] zone axis, as highlighted in red; the additional spots next to the main spots are assigned to Ga2Te3(space group: F![[4 with combining macron]](https://www.rsc.org/images/entities/char_0034_0304.gif) 3m). The lattice relationship between the two phases is (2
3m). The lattice relationship between the two phases is (2![[2 with combining macron]](https://www.rsc.org/images/entities/char_0032_0304.gif) 0)Ga2Te3//(2
0)Ga2Te3//(2![[2 with combining macron]](https://www.rsc.org/images/entities/char_0032_0304.gif) 0)PbTe, a misfit between which introduces significant strain and distortion. It is well known that the type of nanostructure present in the Pb0.975Ga0.025Te–0.25%ZnTe sample is favorable for maintaining superb electrical transport properties while significantly disrupting phonon propagation to reduce κlat.39
0)PbTe, a misfit between which introduces significant strain and distortion. It is well known that the type of nanostructure present in the Pb0.975Ga0.025Te–0.25%ZnTe sample is favorable for maintaining superb electrical transport properties while significantly disrupting phonon propagation to reduce κlat.39
DFT calculations
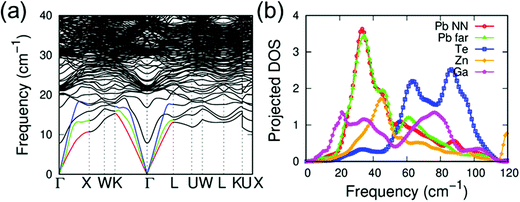
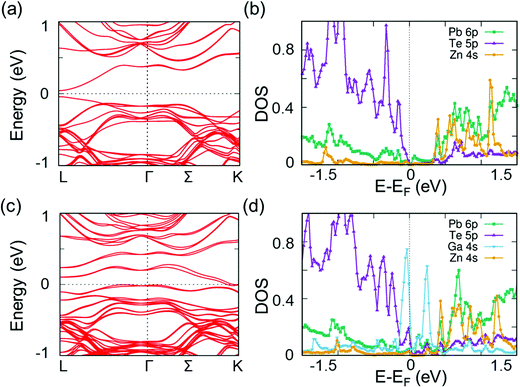
Based on our previous studies13,40–42 and the significantly reduced κlat, we analyzed the local atomic configurations of Zn and Ga doped in the host of PbTe. We discovered that the Zn atom preferred an energetically more favorable configuration, where the Zn atoms were distorted off-center from the appropriate octahedral position (Fig. S10, ESI†). This is attributed to the small size of the Zn atom at the Pb site in the rock-salt PbTe structure, as well as the strong preference for a tetrahedral coordination geometry of Zn2+, particularly when the Zn atom is bonded to chalcogenide anions. As shown in Fig. S10 (ESI†), the total energy of a Zn atom in an off-center position from the ideal octahedral site is slightly lower than that of Zn in the center position. The distortion of Zn in PbTe is similar to that of previous examples of Ge in PbQ (Q = Te and Se), Hg, and Cd in PbSe.13,40–42 Energetically, these off-centered atoms shift away from their appropriate sites along the [111] direction. It is suggested theoretically that Zn shifts from the regular octahedral site by approximately 0.36 Å, which is the largest displacement compared with those of the other off-centered elements in different crystalline matrices, as shown in Table 1. As reported previously, Ga in PbTe34 prefers a distorted off-center position in PbTe. However, the Ga distortion magnitude is much smaller than that of the single Zn case. To investigate the effects of co-doping Zn and Ga on the κlat of PbTe, we further performed phonon dispersion calculations to compare the results with those from single Zn doping. For the Ga-doped and Zn-alloyed PbTe, the Zn and Ga atoms preferred to form a ZnGa substitution complex, where the Zn and Ga atoms were the nearest neighbors to each other. Based on the phonon dispersions, we evaluated the decrease in κlat upon the addition of a single Zn and a ZnGa complex. Similar to the previous case involving Ge or Cd in PbSe,40,42 the κlat of Zn doped in PbTe exhibited a substantial decrease. As shown in Fig. S12 (ESI†), the single off-centered Zn addition induced a κlat reduction of approximately 10% at 300 K. By contrast, Ga doping and Zn alloying resulted in a reduction of approximately 22%. This significant decrease can be attributed to several factors. Beyond the mass fluctuation of Zn and Ga introduction, the calculated average phonon velocity LA branch of the ZnGa case (approximately 2350 m s−1) was much smaller than that of pure PbTe (3160 m s−1). By contrast, the off-centered Zn induced a relatively large atomic local strain, resulting in longer bond lengths of Pb–Te compared with those of regular cases; hence, relatively lower Pb vibration frequencies were induced. The low-frequency peak of the Pb phonon DOS is characterized as a left shift to a lower frequency, as shown in Fig. S11b (ESI†). Moreover, in the ZnGa complex case, the Ga atom generated low-frequency optical vibration modes, as shown at the Γ point with a frequency of approximately 7 cm−1. This model exhibited a small peak in the phonon DOS in the extremely low frequency range (Fig. 5), which is attributed to the off-centered Zn atom yielding a relatively loose atomic environment for Ga in the ZnGa complex. Hence, the off-centered Zn and related ZnGa complex contributed significantly to κlat reduction.Additionally, we investigated the electronic band structure of PbTe with off-centered Ga and Zn atoms. For the Zn-alloyed PbTe, the conduction and valence bands of PbTe did not change significantly with respect to the Pb 6p and Te 5p states (Fig. 6). For the Ga-doped and Zn-alloyed PbTe, the Ga atom addition introduced additional gap states that crossed the Fermi level near the Γ and K points.45,46 This phenomenon occurred similarly in the corresponding DOS, where the two peaks of the Ga 4s state significantly overlapped the Te 5p state at the top of the valence band and overlapped the Pb 6p state at the conduction band minimum. Additionally, the gap states induced by Ga enhanced the electronic transport properties of Pb0.975Ga0.025Te–x%ZnTe.13
Figure of merit
With the simultaneous enhanced power factor and reduced thermal conductivity, ZnTe alloying improved the thermoelectric performance of the n-type Ga-doped PbTe (Fig. 7a). The highest ZT of ∼1.55 at 723 K was demonstrated by Pb0.975Ga0.025Te–0.25%ZnTe, i.e., ∼30% higher than ∼1.20 by the Pb0.975Ga0.025Te sample. The Pb0.975Ga0.025Te–0.25%ZnTe compound indicated a record high ZTavg ∼1.26 (Fig. 7b), which was higher than those of other top-performing n-type PbTe-based thermoelectric materials.18–20,33,47–49 In fact, the value was approximately the ZTavg value of ∼1.58 for the top p-type PbTe material over the range of 400–873 K.23ZTavg is more important than a high peak ZT value during device fabrication for achieving maximum conversion efficiency. A theoretical η of ∼14% for TC = 400 K and TH = 873 K were estimated for Pb0.975Ga0.025Te–0.25%ZnTe based on the record high ZTavg. Combined with the top p-type PbTe material, the ZnTe-alloyed and Ga-doped n-type PbTe is an ideal pair of material for developing highly efficient thermoelectric devices.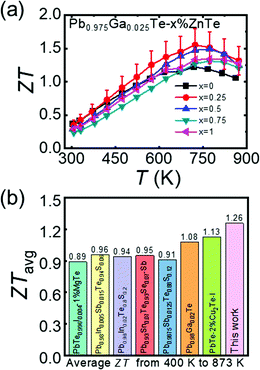 | ||
| Fig. 7 (a) Figure of merit, ZT, as a function of temperature for Pb0.975Ga0.025Te–x%ZnTe (x = 0, 0.25, 0.5, 0.75, and 1), and (b) comparison of ZTavg values at 400–873 K for top-performing n-type PbTe-based thermoelectric materials.18–20,33,47–49 | ||
Conclusions
ZnTe-alloyed and Ga-doped n-type PbTe samples were successfully synthesized and exhibit thermoelectric properties comparable to their p-type counterparts and are promising for real-world device applications. In regard to the isoelectronic substitution of Pb in the PbTe matrix, with the discordant Zn results in large lattice displacement and significantly enhanced thermoelectric performance of Ga-doped PbTe: (i) Zn enhanced the σ and n by inducing precipitation of Ga2Te3 as a secondary phase, thereby generating Te deficiencies in the matrix; (ii) Zn enables a relatively loose atomic environment for Ga, that results in low-frequency optical vibration modes and thus significantly reduced κlat; (iii) Zn induced coherent Ga2Te3 nanocrystals, which further impeded phonon propagation without affecting charge transport. Finally, a record high ZTavg of ∼1.26 from 400 to 873 K with a maximum ZT of ∼1.55 at 723 K was obtained for Pb0.975Ga0.025Te–0.25%ZnTe. Owing to the high ZTavg value of Pb0.975Ga0.025Te–0.25%ZnTe, its theoretical efficiency is estimated at ∼14%. Combined with high performance of p-type PbTe systems, this new n-type PbTe system is an excellent material for high-efficiency thermoelectric generators.Author contributions
Z. L., Z. Z., Q. Y and M. G. K. conceived of and planned the experiments. Z. L. prepared the samples and carried out thermoelectric experiments. S. C. and V. P. D. conducted TEM measurement of the samples. Hall measurements. S. H. and C. W. carried out the DFT calculations. T. P. B. and C. U. carried out the Hall measurements. Z. L., Z. Z., Q. Y., and M. G. K. interpreted all results and wrote and edited the manuscript. All authors have reviewed, discussed and approved the results and conclusions of this article.Conflicts of interest
The authors declare no conflict of interest.Acknowledgements
This study was supported primarily by the Department of Energy, Office of Science Basic Energy Sciences under grant DE-SC0014520, DOE Office of Science (sample preparation, synthesis, XRD, TE measurements, TEM measurements, DFT calculations), and Fujian Science & Technology Innovation Laboratory for Optoelectronic Information of China (2021ZZ127). The authors acknowledge the Minjiang Scholar Professorship (GXRC-21004) and the National Natural Science Foundation of China (61728401). The authors acknowledge the EPIC facility of Northwestern University's NUANCE Center, which received support from the Soft and Hybrid Nanotechnology Experimental (SHyNE) Resource (NSF ECCS-1542205); the MRSEC program (NSF DMR-1720139) at the Materials Research Center, International Institute for Nanotechnology (IIN), Keck Foundation, State of Illinois, through the IIN; and the Office of Science of the U.S. Department of Energy under Contract No. DE-AC02-06CH11357 and DE-AC02-05CH11231. Access to facilities for high-performance computational resources at the Northwestern University is acknowledged. The authors acknowledge Singapore MOE AcRF Tier 2 under Grant No. 2018-T2-1-010, Singapore A*STAR project A19D9a0096, and the support from FACTs of Nanyang Technological University for sample analysis.References
- G. Tan, L.-D. Zhao and M. G. Kanatzidis, Chem. Rev., 2016, 116, 12123–12149 CrossRef CAS PubMed.
- G. J. Snyder and E. S. Toberer, Nat. Mater., 2008, 7, 105 CrossRef CAS PubMed.
- L.-D. Zhao, S.-H. Lo, Y. Zhang, H. Sun, G. Tan, C. Uher, C. Wolverton, V. P. Dravid and M. G. Kanatzidis, Nature, 2014, 508, 373–377 CrossRef CAS PubMed.
- K. F. Hsu, S. Loo, F. Guo, W. Chen, J. S. Dyck, C. Uher, T. Hogan, E. K. Polychroniadis and M. G. Kanatzidis, Science, 2004, 303, 818–821 CrossRef CAS PubMed.
- Z.-Z. Luo, S. Hao, S. Cai, T. P. Bailey, G. Tan, Y. Luo, I. Spanopoulos, C. Uher, C. Wolverton, V. P. Dravid, Q. Yan and M. G. Kanatzidis, J. Am. Chem. Soc., 2019, 141, 6403–6412 CrossRef CAS PubMed.
- Z.-Z. Luo, Y. Zhang, C. Zhang, H. T. Tan, Z. Li, A. Abutaha, X.-L. Wu, Q. Xiong, K. A. Khor, K. Hippalgaonkar, J. Xu, H. H. Hng and Q. Yan, Adv. Energy Mater., 2017, 7, 1601285 CrossRef.
- Z.-Z. Luo, X. Zhang, X. Hua, G. Tan, T. P. Bailey, J. Xu, C. Uher, C. Wolverton, V. P. Dravid, Q. Yan and M. G. Kanatzidis, Adv. Funct. Mater., 2018, 0, 1801617 CrossRef.
- A. D. LaLonde, Y. Pei, H. Wang and G. Jeffrey Snyder, Mater. Today, 2011, 14, 526–532 CrossRef CAS.
- Y. Tang, Z. M. Gibbs, L. A. Agapito, G. Li, H.-S. Kim, M. B. Nardelli, S. Curtarolo and G. J. Snyder, Nat. Mater., 2015, 14, 1223–1228 CrossRef CAS PubMed.
- Z.-Z. Luo, S. Cai, S. Hao, T. P. Bailey, I. Spanopoulos, Y. Luo, J. Xu, C. Uher, C. Wolverton, V. P. Dravid, Q. Yan and M. G. Kanatzidis, Angew. Chem., Int. Ed., 2021, 60, 268–273 CrossRef CAS PubMed.
- Q. Yan and M. G. Kanatzidis, Nat. Mater., 2011 DOI:10.1038/s41563-021-01109-w.
- L.-D. Zhao, G. Tan, S. Hao, J. He, Y. Pei, H. Chi, H. Wang, S. Gong, H. Xu, V. P. Dravid, C. Uher, G. J. Snyder, C. Wolverton and M. G. Kanatzidis, Science, 2016, 351, 141–144 CrossRef CAS PubMed.
- Z.-Z. Luo, S. Cai, S. Hao, T. P. Bailey, X. Su, I. Spanopoulos, I. Hadar, G. Tan, Y. Luo, J. Xu, C. Uher, C. Wolverton, V. P. Dravid, Q. Yan and M. G. Kanatzidis, J. Am. Chem. Soc., 2019, 141, 16169–16177 CrossRef CAS PubMed.
- Y. Wu, Z. Chen, P. Nan, F. Xiong, S. Lin, X. Zhang, Y. Chen, L. Chen, B. Ge and Y. Pei, Joule, 2019, 3, 1276–1288 CrossRef CAS.
- L.-D. Zhao, H. J. Wu, S. Q. Hao, C. I. Wu, X. Y. Zhou, K. Biswas, J. Q. He, T. P. Hogan, C. Uher, C. Wolverton, V. P. Dravid and M. G. Kanatzidis, Energy Environ. Sci., 2013, 6, 3346 RSC.
- D. Wu, L.-D. Zhao, X. Tong, W. Li, L. Wu, Q. Tan, Y. Pei, L. Huang, J.-F. Li, Y. Zhu, M. G. Kanatzidis and J. He, Energy Environ. Sci., 2015, 8, 2056–2068 RSC.
- H. J. Wu, L.-D. Zhao, F. S. Zheng, D. Wu, Y. L. Pei, X. Tong, M. G. Kanatzidis and J. Q. He, Nat. Commun., 2014, 5, 4515 CrossRef CAS PubMed.
- D. Wang, Y. Qin, S. Wang, Y. Qiu, D. Ren, Y. Xiao and L.-D. Zhao, Ann. Phys., 2020, 532, 1900421 CrossRef CAS.
- G. Tan, C. C. Stoumpos, S. Wang, T. P. Bailey, L.-D. Zhao, C. Uher and M. G. Kanatzidis, Adv. Energy Mater., 2017, 7, 1700099 CrossRef.
- X. Su, S. Hao, T. P. Bailey, S. Wang, I. Hadar, G. Tan, T. B. Song, Q. Zhang, C. Uher and C. Wolverton, Adv. Energy Mater., 2018, 8, 1800659 CrossRef.
- A. D. LaLonde, Y. Pei and G. J. Snyder, Energy Environ. Sci., 2011, 4, 2090–2096 RSC.
- Y. Pei, Z. M. Gibbs, A. Gloskovskii, B. Balke, W. G. Zeier and G. J. Snyder, Adv. Energy Mater., 2014, 4, 1400486 CrossRef.
- G. Tan, F. Shi, S. Hao, L.-D. Zhao, H. Chi, X. Zhang, C. Uher, C. Wolverton, V. P. Dravid and M. G. Kanatzidis, Nat. Commun., 2016, 7, 12167 CrossRef CAS PubMed.
- K. Ahn, K. Biswas, J. He, I. Chung, V. Dravid and M. G. Kanatzidis, Energy Environ. Sci., 2013, 6, 1529 RSC.
- P. K. Rawat, B. Paul and P. Banerji, ACS Appl. Mater. Interfaces, 2014, 6, 3995–4004 CrossRef CAS PubMed.
- J.-H. Bahk and A. Shakouri, Appl. Phys. Lett., 2014, 105, 052106 CrossRef.
- B. J. Sealy and A. J. Crocker, J. Mater. Sci., 1973, 8, 1731–1736 CrossRef CAS.
- K. Ahn, H. Shin, J. Im, S. H. Park and I. Chung, ACS Appl. Mater. Interfaces, 2017, 9, 3766–3773 CrossRef CAS PubMed.
- T. L. Chu, S. S. Chu, F. Firszt and C. Herrington, J. Appl. Phys., 1986, 59, 1259–1263 CrossRef CAS.
- J. Zhang, D. Wu, D. He, D. Feng, M. Yin, X. Qin and J. He, Adv. Mater., 2017, 29, 1703148 CrossRef PubMed.
- S. Wang, Y. Xiao, Y. Chen, S. Peng, D. Wang, T. Hong, Z. Yang, Y. Sun, X. Gao and L.-D. Zhao, Energy Environ. Sci., 2021, 14, 451–461 RSC.
- Y. Pei, A. D. LaLonde, H. Wang and G. J. Snyder, Energy Environ. Sci., 2012, 5, 7963–7969 RSC.
- P. Jood, M. Ohta, M. Kunii, X. Hu, H. Nishiate, A. Yamamoto and M. G. Kanatzidis, J. Mater. Chem. C, 2015, 3, 10401–10408 RSC.
- S. Sarkar, X. Hua, S. Hao, X. Zhang, T. P. Bailey, T. J. Slade, P. Yasaei, R. J. Korkosz, G. Tan, C. Uher, V. P. Dravid, C. Wolverton and M. G. Kanatzidis, Chem. Mater., 2021, 33, 1842–1851 CrossRef CAS.
- Y. Xiao, W. Li, C. Chang, Y. Chen, L. Huang, J. He and L.-D. Zhao, J. Alloys Compd., 2017, 724, 208–221 CrossRef CAS.
- H.-S. Kim, Z. M. Gibbs, Y. Tang, H. Wang and G. J. Snyder, APL Mater., 2015, 3, 041506 CrossRef.
- J. Luo, L. You, J. Zhang, K. Guo, H. Zhu, L. Gu, Z. Yang, X. Li, J. Yang and W. Zhang, ACS Appl. Mater. Interfaces, 2017, 9, 8729–8736 CrossRef CAS PubMed.
- S. Sarkar, X. Zhang, S. Hao, X. Hua, T. P. Bailey, C. Uher, C. Wolverton, V. P. Dravid and M. G. Kanatzidis, ACS Energy Lett., 2018, 3, 2593–2601 CrossRef CAS.
- K. Biswas, J. He, Q. Zhang, G. Wang, C. Uher, V. P. Dravid and M. G. Kanatzidis, Nat. Chem., 2011, 3, 160–166 CrossRef CAS PubMed.
- Z.-Z. Luo, S. Hao, X. Zhang, X. Hua, S. Cai, G. Tan, T. P. Bailey, R. Ma, C. Uher, C. Wolverton, V. P. Dravid, Q. Yan and M. G. Kanatzidis, Energy Environ. Sci., 2018, 11, 3220–3230 RSC.
- J. M. Hodges, S. Hao, J. A. Grovogui, X. Zhang, T. P. Bailey, X. Li, Z. Gan, Y. Y. Hu, C. Uher, V. P. Dravid, C. Wolverton and M. G. Kanatzidis, J. Am. Chem. Soc., 2018, 140, 18115–18123 CrossRef CAS PubMed.
- S. Cai, S. Hao, Z.-Z. Luo, X. Li, I. Hadar, T. P. Bailey, X. Hu, C. Uher, Y.-Y. Hu, C. Wolverton, V. P. Dravid and M. G. Kanatzidis, Energy Environ. Sci., 2020, 13, 200–211 RSC.
- M. Dutta, R. K. Biswas, S. K. Pati and K. Biswas, ACS Energy Lett., 2021, 6, 1625–1632 CrossRef CAS.
- H. Xie, X. Su, S. Hao, C. Zhang, Z. Zhang, W. Liu, Y. Yan, C. Wolverton, X. Tang and M. G. Kanatzidis, J. Am. Chem. Soc., 2019, 141, 18900–18909 CrossRef CAS PubMed.
- K. Hoang and S. D. Mahanti, Phys. Rev. B: Condens. Matter Mater. Phys., 2008, 78, 085111 CrossRef.
- S. Ahmad, S. D. Mahanti, K. Hoang and M. G. Kanatzidis, Phys. Rev. B: Condens. Matter Mater. Phys., 2006, 74, 155205 CrossRef.
- Y. Xiao, H. Wu, D. Wang, C. Niu, Y. Pei, Y. Zhang, I. Spanopoulos, I. T. Witting, X. Li, S. J. Pennycook, G. J. Snyder, M. G. Kanatzidis and L.-D. Zhao, Adv. Energy Mater., 2019, 9, 1900414 CrossRef.
- Y. Xiao, H. Wu, W. Li, M. Yin, Y. Pei, Y. Zhang, L. Fu, Y. Chen, S. J. Pennycook, L. Huang, J. He and L.-D. Zhao, J. Am. Chem. Soc., 2017, 139, 18732–18738 CrossRef CAS PubMed.
- Q. Zhang, E. K. Chere, Y. Wang, H. S. Kim, R. He, F. Cao, K. Dahal, D. Broido, G. Chen and Z. Ren, Nano Energy, 2016, 22, 572–582 CrossRef CAS.
Footnote |
| † Electronic supplementary information (ESI) available. See DOI: 10.1039/d1ee02986j |
| This journal is © The Royal Society of Chemistry 2022 |

