Bi(Mg1/2Zr1/2)O3–PbZrO3–PbTiO3 relaxor ferroelectric ceramics with large and temperature-insensitive electric field-induced strain response
Hongrui
Jia
 a,
Zhigang
Liang
b,
Zhen
Li
a,
Fei
Li
a and
Linghang
Wang
a,
Zhigang
Liang
b,
Zhen
Li
a,
Fei
Li
a and
Linghang
Wang
 *a
*a
aElectronic Materials Research Laboratory, Key Laboratory of the Ministry of Education and International Center for Dielectric Research, School of Electronic Science and Engineering, Xi’an Jiaotong University, Xi’an, 710049, P. R. China. E-mail: lhwang@xjtu.edu.cn
bNorthwest Institute of Nuclear Technology, Xi’an, 710613, P. R. China
First published on 25th November 2021
Abstract
Ferroelectric ceramic materials with large and temperature-insensitive strain responses are highly desired for the practical application of actuators in harsh environmental conditions. In this work, novel xBi(Mg1/2Zr1/2)O3–(0.55 − x)PbZrO3–0.45PbTiO3 (xBMZ-PZ-0.45PT) ternary ferroelectric ceramics were successfully fabricated by a solid-state reaction process. The phase structure of xBMZ-PZ-0.45PT ceramics gradually evolves from rhombohedral-tetragonal coexistence phases to rhombohedral phase with an increase in the BMZ content and the diffuse phase transition behavior becomes increasingly evident. The relaxation behavior is strongest for x = 0.35 composition. Pmax and Pr values first gradually increased, and then gradually decreased with increasing BMZ content, while Ec values display an increasing trend. A large strain response of 0.33% at 5 kV mm−1 was obtained in this ternary ferroelectric ceramics with x = 0.35, which can be attributed to the electric field-induced reversible ergodic relaxation phase to the ferroelectric phase transition. The strain was simultaneously temperature-insensitive with a slight decrease from 0.33% at 30 °C to 0.32% at 150 °C. The results indicate that BMZ-PZ-PT ternary ferroelectric ceramics are promising candidate materials for actuator applications in harsh environmental conditions.
1. Introduction
Since the piezoelectric effect was discovered in 1880, it has been studied extensively. Similar to other energy coupling effects, such as the magnetoelectric effect and the photoelectric effect, the piezoelectric effect plays also an important role in the application and development of information technology.1 Piezoelectric material showing the piezoelectric effect is a kind of important functional material, which can realize the conversion between mechanical energy and electrical energy. As special piezoelectric materials, ferroelectric ceramic materials have been widely studied and used in electronic components such as actuators, sensors, transducers, ultrasonic motors, generators and energy harvesters due to their outstanding electromechanical properties.2–6 As one of the important application fields of ferroelectric ceramic materials, the piezoelectric actuator is regarded as an ideal micro-displacement device because of the advantages of small size, large driving force, high-precision displacement and fast response.7–9 The large strain, high-temperature stability and low hysteresis of ferroelectric materials are three extremely important factors for the practical application of actuators, especially, as the temperature stability becomes critical for the use of actuators in harsh environmental conditions.10,11 It is thus of much significance to develop a kind of ferroelectric ceramics with large strain, high-temperature stability and relatively low hysteresis for the practical application of piezoelectric actuators in harsh environments.The low strain hysteresis has been found in many lead-based ferroelectric ceramics such as Pb(Yb1/2Nb1/2)O3–Pb(Sc1/2Nb1/2)O3–PbTiO3 (PYN–PSN–PT),12 Pb(Lu1/2Nb1/2)O3–Pb(In1/2Nb1/2)O3–PbTiO3 (PLN–PIN–PT),13 Pb(Mg1/3Nb2/3)O3–PbTiO3–Bi(Li1/2Nb1/2)O3 (PMN–PT–BLN).14 Although these lead-based ferroelectric ceramics exhibit low strain hysteresis, the value of strain is very small and the temperature stability of strain is very poor. In recent years, lead-free BNT-based ceramics have been found to have giant electric field-induced strain responses and are considered the most promising candidate materials for commercial piezoelectric actuator applications. Fan et al. reported that large strain values were observed in Bi0.5Na0.5TiO3–Bi0.5K0.5TiO3–NaNbO3 (BNKT–NN) and (Bi0.5Na0.5)(Bi0.2Sr0.7)Ba0.005TiO3 (BNBT–BST) ferroelectric ceramics, with strain values of 0.445% at 55 kV cm−1 and 0.428% at 60 kV cm−1, respectively.15,16 Yi et al. reported that the maximum strain value could reach 0.4% at 55 kV cm−1 for Bi0.5Na0.5TiO3–BaTiO3–Sr2MnSbO6 (BNBT–SMS) ceramics.17 Zhai et al. reported that a large strain value of 0.35% at 60 kV cm−1 was obtained in (Bi0.5Na0.5)TiO3–BaTiO3–Bi(Ni0.5Ti0.5)O3 (BNBT–BNiT) ceramics.18 Unfortunately, the fatal disadvantage of these lead-free BNT-based ceramics in the practical application of piezoelectric actuators is that strain hysteresis is very severe and the temperature stability of strain is also very poor. Zuo et al. reported a new Bi(Mg1/2Ti1/2)O3–Pb(Mg1/3Nb2/3)O3–PbTiO3 (BMT–PMN–PT) ternary ceramic with a large strain value of 0.42% at 7 kV mm−1, and its strain hysteresis was significantly smaller than that of lead-free BNT-based ceramics.19 Recently, our group conducted texturing for this new BMT–PMN–PT ternary ceramic and we were surprised to find that a giant strain value of 0.42% was obtained under a 4 kV mm−1 electric field, and the hysteresis was also relatively smaller than that in lead-free BNT-based ceramics. However, the temperature stability of the strain was slightly lower, decreasing from 0.42% to 0.28% as the temperature increased from 20 °C to 100 °C.20
Among the above-mentioned Bi-containing ferroelectric ceramics, the generation of large strain is usually accompanied by relaxation behavior, which provides a new idea for the development of ferroelectric ceramics with large strain and high-temperature stability. Previous studies have found that BMZ–PT and PZT ceramics have relatively high-temperature stability, but both strain values are far inferior to those of lead-free BNT-based ceramics.21,22 Therefore, in this work, we expect to form a relaxation behavior in a new ternary system by the substitution of BMZ for PZ in PZT ceramics and greatly to increase the strain value of PZT ceramics. As expected, both large strain (0.33% at 5 kV mm−1) and high-temperature stability were obtained in new xBMZ-PZ-0.45PT ternary ceramics, and strain hysteresis was also found to be smaller than that of lead-free BNT-based ferroelectric ceramics. What exhilarated us most was that the temperature stability of the strain was very good, decreasing slightly from 0.33% at 30 °C to 0.32% at 150 °C. A comparison of the dielectric and ferroelectric properties of xBMZ-PZ-0.45PT ceramics with x = 0.35 and other reported bismuth-based ferroelectric ceramics are shown in Table 1. In addition, effects of BMZ content on phase structures, dielectric behavior, ferroelectric and strain properties of new xBMZ-PZ-0.45PT ternary ceramics were investigated, as well as their relaxation behavior.
| Ceramics | T m (°C) | S max (%) | Hys. (%) | ΔS (%) | Ref. |
|---|---|---|---|---|---|
| a Represent applied electric fields of 50 kV cm−1. b Represent applied electric fields of 55 kV cm−1. c Represent applied electric fields of 60 kV cm−1. Each parameter was calculated from the corresponding Figure in the reference. ΔS represents the maximum variation of Smax within the temperature range of 30–120 °C, ΔS = (Smax − Sv)/Smax ×100%, where Smax is the strain value at 30 °C and Sv is the minimum strain value within the temperature range of 30–120 °C. | |||||
| BNKT-NNb | 250 | 0.44 | 64 | <28 | 15 |
| BNBT-BSTa | 330 | 0.37 | 73 | <32 | 16 |
| BNBT-SMSb | 300 | 0.40 | 63 | <50 | 17 |
| BNBT-BNiTc | 275 | 0.35 | 64 | <57 | 18 |
| BNBT-FNa | 250 | 0.42 | 71 | <40 | 23 |
| BMZ-PZ-PTa | 200 | 0.33 | 40 | <8 | This work |
2. Materials and methods
The xBi(Mg1/2Zr1/2)O3–(0.55 − x)PbZrO3–0.45PbTiO3 (xBMZ–PZ–0.45PT, x = 0, 0.05, 0.15, 0.25, 0.35, 0.45, 0.55) ternary ferroelectric ceramics with excess 2 mol% Bi and Pb to compensate for evaporation were fabricated using the solid-state reaction process. The raw chemicals Bi2O3 (99.9%) and PbO (99.9%) were purchased from Alfa Aesar and MgO (99.9%), ZrO2 (99.99%) and TiO2 (99.99%) were purchased from Aladdin. Firstly, the stoichiometric raw chemicals were weighed and mixed thoroughly in ethanol solvent by ball-milling for 24 h. After drying, the powder was calcined at 800 °C for 4 h. Then, the powder was ground and was granulated with PVA binder, and then was pressed into pellets with 10 mm and 1.5 mm in diameter and thickness, respectively. The pellets were buried in homologous powders and heated in crucibles at 1050–1150 °C for 2 h.The crystal structure and phase purity of ceramics were determined using an X-ray diffractometer (Rigaku D/MAX-2400, Japan) in the 2θ range of 20–60°. The ceramic samples with a thickness of 0.5 mm were covered with silver electrodes for testing of subsequent electrical properties. Dielectric properties were measured as a function of temperature and frequency using an LCR meter (Agilent E4980A, USA) along with a furnace. Ferroelectric loops and strain curve measurement were displayed at different temperatures using a ferroelectric measuring system with a laser interferometer (TF analyzer 2000, aixACCT, Germany).
3. Results and discussion
XRD patterns of xBMZ-PZ-0.45PT ferroelectric ceramics at different levels of substitution with BMZ content are shown in Fig. 1. As shown in Fig. 1a, for x < 0.45 compositions, it is obvious that a pure perovskite phase was formed and without any apparent secondary phase or impurities appeared, which demonstrated that xBMZ-PZ-0.45PT ternary ferroelectric ceramics was formed as a new stable solid solution. When the BMZ content exceeds 0.45, additional non-perovskite phase diffraction peaks to appear, indicating that the secondary phase was formed. To clearly show the effect of BMZ content substitution on PZT, the locally magnified (200) peak in the 2θ range of 42°–48° is shown in Fig. 1b. With the increase of BMZ content, we can obviously observe that (200) peak shifts to higher angles, suggesting the shrinkage of the lattice constant. The possible reason for this phenomenon is that Bi3+ has a smaller radius (RBi = 1.45 Å) than that of Pb2+ (RPb = 1.49 Å) at the A-site of the perovskite structure.24 In addition, the phase structure of xBMZ-PZ-0.45PT ceramics can be determined according to the (200) diffraction peak. Around the morphotropic phase boundary (MPB), (002) and (200) diffraction peaks usually merge as a broad coexistence peak, and individual (002) peak or split (002) and (200) peaks appear for rhombohedral and tetragonal phases.25 According to XRD results from Fig. 2b, for x = 0 composition, the (002) and (200) diffraction peaks are a coexistence broad peak. With the increase in the BMZ content from 0 to 0.35, the coexistence broad peak merged as a single (200) peak by degrees, suggesting that the crystal structure tends to evolve from the rhombohedral-tetragonal coexistence phase (MPB) to the rhombohedral phase. With the further increase of BMZ content from 0.35 to 0.55, the diffraction peak of (200) seems to show signs of slightly broad peaks.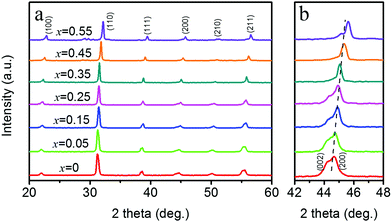 | ||
| Fig. 1 XRD patterns and corresponding enlarged patterns of xBMZ-PZ-0.45PT ternary ferroelectric ceramics with different BMZ contents. | ||
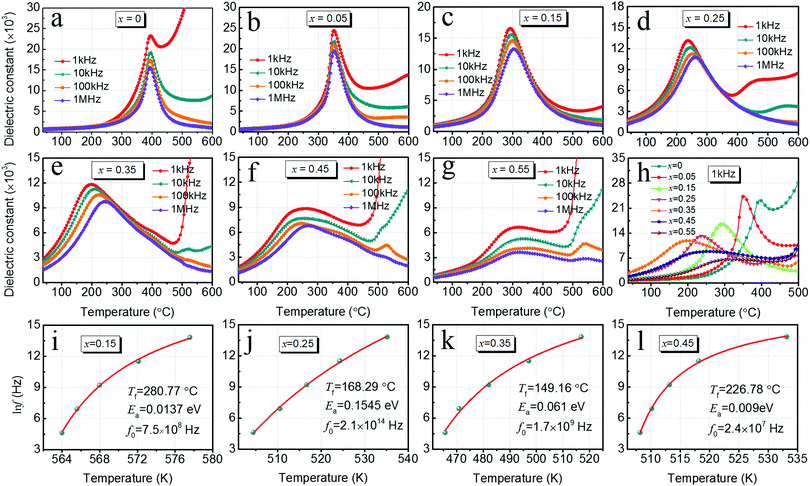
The temperature dependence of the dielectric constant for xBMZ-PZ-0.45PT ceramics was studied at different frequencies, and the results are shown in Fig. 2a–g. Fig. 2h shows the dielectric spectra of xBMZ-PZ-0.45PT ceramics at different BMZ contents at 1 kHz measured frequency, and the variation tendency of the temperature corresponding to maximum dielectric constant (Tm), maximum dielectric constant (εm) and room temperature dielectric constant (εr) with the BMZ content are summarized in Fig. 3a. As shown in Fig. 2h and 3a, Tm, εm and εr values are very sensitive to the BMZ content, and εm decreases all the time as the BMZ content increases from 0.05 to 0.55, while Tm decreases first and then increases, and the minimum value appears at x = 0.35 composition. Moreover, the variation tendency of εr is just opposite to that of Tm. From the dielectric spectra of different compositions, it can be found that for x < 0.35 compositions, the frequency dispersion of the dielectric constant (the position of dielectric peak varies with the frequency in the same composition) gradually becomes stronger with the increase of BMZ content, while for x > 0.35 composition, the frequency dispersion gradually becomes weaker. In addition, the dielectric peak gradually becomes broader with increasing BMZ content from 0 to 0.55, which is typically the diffuse phase transition behavior (DPT). For the x = 0.55 composition, the position of the dielectric peak hardly changed with the frequency, but the dielectric constant shows a very broad peak, that is to say, the sample only shows the DFT behavior without frequency dispersion phenomenon. In relaxor ferroelectrics, both frequency dispersion and DPT exist at the same time. DPT is only one of the causes of relaxation, and the presence of frequency dispersion is the main basis for the identification of relaxation behavior.26
The frequency dispersion generally satisfies the Volgel–Fulcher relation as follows:27
![[thin space (1/6-em)]](https://www.rsc.org/images/entities/char_2009.gif) f with Tm is consistent with the Volgel–Fulcher relation. The fitting parameters Tf, Ea and f0 of xBMZ-PZ-0.45PT ternary ceramics are also displayed in Fig. 2i–l, and the variation tendency of Tf with BMZ content are shown in Fig. 3c. With the increase of BMZ content from 0.15 to 0.45, Tf value decreases first and then increases, and the minimum value appears at x = 0.35 composition. In addition, ΔTm can also be introduced to study the relaxation behavior of xBMZ-PZ-0.45PT ternary ceramics, which represents the difference between Tm at 1 kHz and 1 MHz,28 and the variation of ΔTm with BMZ content is also shown in Fig. 3c. The change of ΔTm is just opposite to that of Tf, and its maximum value appears at x = 0.35 composition.
f with Tm is consistent with the Volgel–Fulcher relation. The fitting parameters Tf, Ea and f0 of xBMZ-PZ-0.45PT ternary ceramics are also displayed in Fig. 2i–l, and the variation tendency of Tf with BMZ content are shown in Fig. 3c. With the increase of BMZ content from 0.15 to 0.45, Tf value decreases first and then increases, and the minimum value appears at x = 0.35 composition. In addition, ΔTm can also be introduced to study the relaxation behavior of xBMZ-PZ-0.45PT ternary ceramics, which represents the difference between Tm at 1 kHz and 1 MHz,28 and the variation of ΔTm with BMZ content is also shown in Fig. 3c. The change of ΔTm is just opposite to that of Tf, and its maximum value appears at x = 0.35 composition.
The diffuse phase transition behavior can be analyzed using a modified Curie–Weiss formula, which is shown as follows:29
As above mentioned, it can be inferred that the relaxation behavior is strongest for xBMZ-PZ-0.45PT ternary ceramics with x = 0.35 composition among all the studied compositions. At present, it was generally believed that the occurrence of the dielectric relaxation phenomenon is usually related to the existence of polar nanoregions (PNRs).31–33 The PNRs are generally believed to be caused by the disruption of the long-range order of ferroelectrics such that ferroelectrics are ordered only on a very small scale. When the relaxation frequency is close to the test frequency, the size of PNRs increases, which leads to the frequency dispersion of the dielectric constant, thus the sample exhibits relaxation characteristics. However, the size of PNRs is almost unchanged for the diffuse phase transition behavior, so it does not show the frequency dispersion phenomenon, which is also the main basis to distinguish the relaxation behavior and diffuse phase transition behavior.34 In this system, with the increase of the BMZ content, DPT becomes increasingly evident, suggesting that a gradual increase in PNRs. Therefore, the decrease of εm and Tm values in this system is believed to be connected to the size and dynamics of PNRs, and the small size and relatively weak interactions of PNRs lead to the decrease of εm and Tm values.14,35,36 In addition, the variation tendency of εr value is just opposite to that of Tm, thus, we believe that the variation of εr may also be related to PNRs and the small size and relatively weak interactions of PNRs may result in a higher room-temperature dielectric constant.
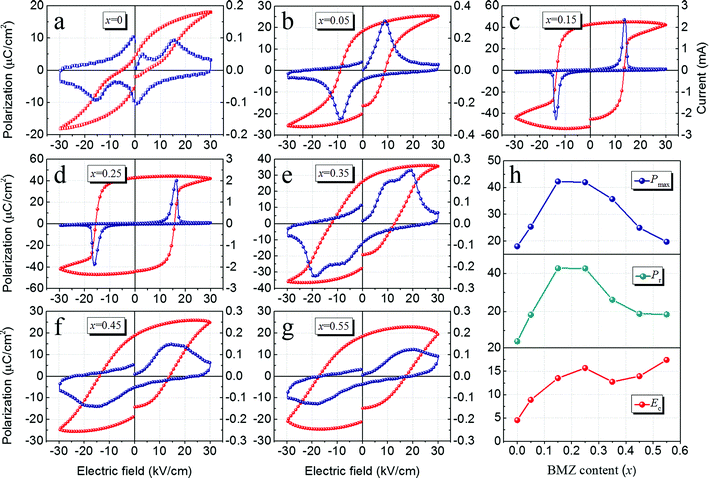
Fig. 4a–g shows the P–E and J–E loops of xBMZ-PZ-0.45PT ceramics with different BMZ contents, which can be used to analyze the domain conversion process in more detail. For x ≤ 0.25 compositions, P–E loops gradually change from a slim and unsaturated shape to a square-like and saturated shape with the increase of the x value, and the corresponding J–E loops display that the polarization current peak changes from a single broad peak to a single sharp peak. xBMZ-PZ-0.45PT ternary ceramics with x = 0.15 and 0.25 are typical normal ferroelectric with macro-domain switching. For x > 0.25 compositions, P–E loops become slim and unsaturated again. At the same time, a double current peak appears in the J–E loop of xBMZ-PZ-0.45PT ternary ceramics with x = 0.35, while J–E loops of ternary ceramics with x > 0.35 show a broad and flat current platform. The appearance of non-single current peaks indicates different types of domain switching process, which is related to the disruption of the long–range order of normal ferroelectric and the presence of PNRs with short–range order.37 The variation tendency of Pmax, Pr as well as Ec with BMZ content is depicted in Fig. 4h. With increasing BMZ content from x = 0 to 0.15, Pmax and Pr values are gradually increased, indicating that the ferroelectricity of xBMZ-PZ-0.45PT ternary ceramics was gradually improved. Pmax and Pr values did not obviously change in x = 0.15 and 0.25 compositions. With a further increase in BMZ content from x = 0.25 to 0.55, the Pmax and Pr values gradually decreased. This may be attributed to the fact that PNRs are easier back to the incipient state after removing the electric field and the polarization intensity is contributed only by the long–range ferroelectric domains. Moreover, Ec values display an increasing trend with the increases in BMZ content from 0 to 0.25, indicating that the domain switch is becoming more difficult under electric fields. However, it is noted that Ec has an obvious decrease at x = 0.35 compositions, which may be related to the appearance of PNRs. With an increase in the x value further, Ec gradually increases again. This may be related to the fact that BMZ-PT binary system has a larger Ec.
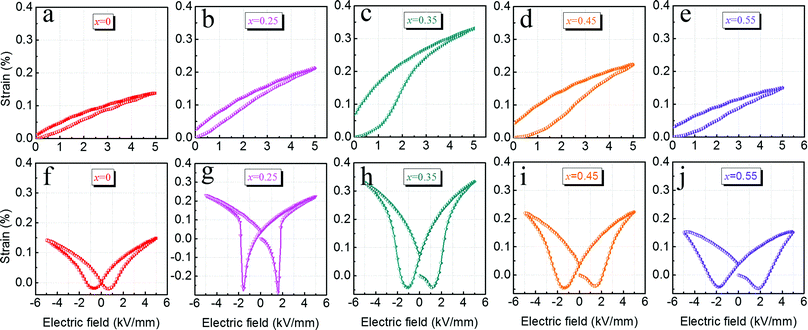
Fig. 5 displays room temperature unipolar and bipolar S–E curves for xBMZ-PZ-0.45PT ceramics with different BMZ contents and measured at 1 Hz and 5 kV mm−1. As can be clearly observed from the unipolar S–E curves that the strain value of xBMZ-PZ-0.45PT ceramics first gradually increases, and then reached a maximum value and finally gradually decreases with increasing BMZ content. The maximum strain value was obtained at x = 0.35 composition. Based on the dielectric and ferroelectric analysis, the generation of large strain response could be related to the electric field induced ergodic relaxation phase to the ferroelectric phase transition.19 In addition, for x < 0.35 compositions, an almost linear strain curve can be observed, which may be mainly because of the achievable strain response contributed by the piezoelectric effect. Compared with other compositions, for x = 0.35 composition, it can be obviously found from the unipolar strain curve that the remnant strain is very large after the removal of the electric field. The variation tendency of the bipolar positive strain shown in Fig. 5f–j is consistent with the unipolar strain. As can be seen from bipolar strain curves, all compositions exhibit typical butterfly-like strain curves and an obvious negative strain is observed, which is a typical characteristic of ferroelectric materials. A gradual increase for xBMZ-PZ-0.45PT ternary ceramics in the negative strain can be observed with increasing BMZ content and reaching a maximum at x = 0.25 composition, then rapidly decreasing with further increase in the BMZ content (also shown in Fig. 6a). Therefore, the increase in negative strain in this ternary ceramics may be due to the increase in the contribution from non-180° irreversible domain switching.38 In addition, from the significant characteristics of the P–E loop and negative strain, it can be concluded that xBMZ-PZ-0.45PT ternary ceramics with x = 0.25 composition is a ferroelectric material with a typical ferroelectric phase, and its domain is dominated by long-range order domains. Moreover, for x = 0.35 composition, it can also be found that the generation of large positive strain is accompanied by the rapid decrease in negative strain, which further proves the existence of ergodic relaxation phase-ferroelectric phase transition under the action of the external electric field.
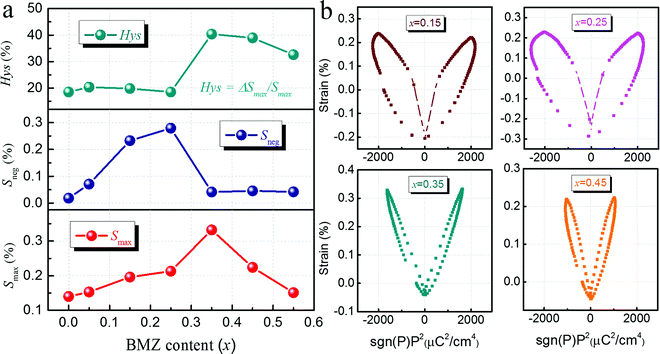
The variation tendency of strain value and hysteresis with BMZ content for xBMZ-PZ-0.45PT ceramics is shown in Fig. 6a. It is obviously found that both Smax and Sneg increase first and then decrease with the increase of the BMZ content, and the maximum values of Smax and Sneg were obtained at x = 0.35 and 0.25 compositions, respectively, with values of 0.33% and 0.28%. Moreover, for x = 0.35 composition, it not only exhibits a maximum strain value (0.33%) in the studied composition range, but also has a lower negative strain value (0.04%) than other compositions, and the maximum strain value is almost 2.5 times higher than that of PZ-0.45PT ceramics. In addition, the hysteresis can be estimated using the formula: Hys = ΔSmax/Smax × 100%, where ΔSmax and Smax are the maximum differences in strain during the application and removal of the electric field and the maximum strain value, respectively. It can be seen in Fig. 4a that the strain hysteresis almost remains unchanged for x < 0.35 compositions, while the hysteresis suddenly increases and reaches 40% for x = 0.35 composition, and then gradually decreases for x > 0.35 compositions.
Previous studies have suggested that the strain behavior of relaxor ferroelectrics can be analyzed similarly by the electrostrictive coefficient Q33.39 The electrostrictive strain (S33) can usually be expressed by the following equation: S33 = Q33·P32. For pure electrostrictive materials, the relationship between S33 and P32 is linear and there is no negative strain.40Fig. 6b shows S–P2 curves for xBMZ-PZ-0.45PT relaxor ferroelectric ceramics with x = 0.15, 0.25, 0.35 and 0.45 compositions. It can be found that the S–P2 curve of xBMZ-PZ-0.45PT relaxor ferroelectric ceramics with x = 0.35 composition is almost linear, and its negative strain is the smallest among ceramics with four different compositions, indicating that the electrostriction-like strain behavior. Moreover, for xBMZ-PZ-0.45PT relaxor ferroelectric ceramics with x = 0.35 composition, the S–P2 curve does not completely show pure electrostrictive-like strain characteristics, as such, the generation of large strain should also include the contribution of a small amount of converse piezoelectric effect and domain wall motion.
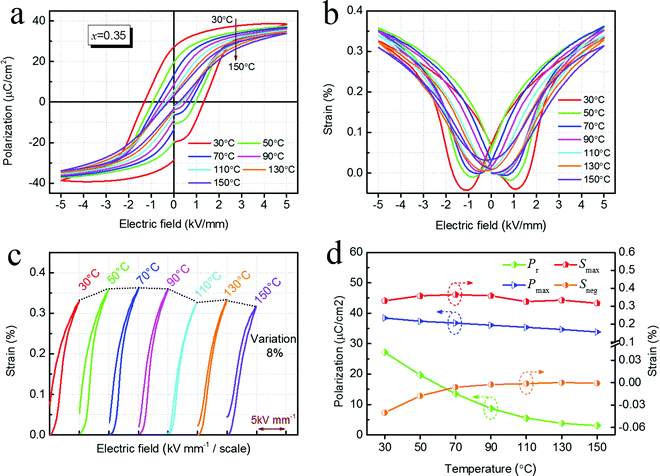
The temperature stability of the strain value is also crucial for the practical application of the actuator. The temperature-sensitive strain response will affect the positioning accuracy of the actuator in harsh environmental conditions. In order to determine the strain temperature stability of xBMZ-PZ-0.45PT relaxor ferroelectric ceramics with x = 0.35 composition, the strain behavior from 30 °C to 150 °C was investigated. It is exhilarating that the temperature-insensitive strain value was observed, with the variation of less than 8% of its room-temperature value in the investigated temperature range. Fig. 7a–c shows the temperature dependence of P–E loops as well as bipolar and unipolar S–E curves. As can be seen from the unipolar curves in Fig. 7c, when the temperature is below 90 °C, the strain value increases slightly with the increase of temperature. When the temperature is above 90 °C, the strain value begins to decrease with the increase of temperature, which may be related to depolarization at high temperatures. In addition, the unipolar strain curve gradually became slim (low hysteresis) with increasing temperature. The variation tendencies of various parameters with the increase in temperature, e.g., Pmax, Pr, Smax, Sneg, are presented in Fig. 7d. It can be observed that the value of Pmax decreases slightly with an increasing temperature while the value of Pr decreases rapidly. The value of Smax does not change much (0.33% at 30 °C and 0.32% at 150 °C) in the measured temperature range, while the absolute value of Sneg gradually decreases with an increase in temperature.
These phenomena may be related to the temperature-induced ferroelectric phase-ergodic relaxation phase transition of xBMZ-PZ-0.45PT relaxor ferroelectric ceramics with x = 0.35. The freezing temperature (Tf) is indeed marked as a boundary between the coexistence zone of the ferroelectric phase and ergodic relaxation phase and individual ergodic relaxation phase, which can be obtained from the Volgel–Fulcher relationship fitting.19 According to the Volgel–Fulcher fitting results of xBMZ-PZ-0.45PT ceramics with x = 0.35, the value of Tf is about 150 °C. As the temperature increases from 30 °C to 150 °C, the ratio of the ferroelectric phase of the system is gradually reduced (this can also be explained by the gradual decrease of Sneg with the increase of temperature), while the ergodic relaxation phase gradually enhances, that is, long-range ferroelectric domains decrease and polar nanodomains (PNRs) increase. However, the polar nanodomains can transform into long–range ferroelectric domains under the external electric field, as such, the Pmax value of the sample changed slightly. After the removal of the external electric field, these polar nanodomains quickly revert to an incipient disordered state, so the value of Pr and the strain hysteresis gradually decrease as the temperature increases.41,42 However, the strain of xBMZ-PZ-0.45PT relaxor ferroelectric ceramics with x = 0.35 composition has good temperature stability, which may be due to the reason that PNRs with different sizes and dynamics exhibit different stability to the temperature change.19
4. Conclusion
Based on the fact that the generation of a large strain of ferroelectric ceramics is usually accompanied by relaxation behavior, a novel xBMZ-PZ-0.45PT ternary relaxor ferroelectric ceramics with both large strain response and high-temperature stability was designed and fabricated in this work. XRD results show that the phase structure of ternary ceramics gradually evolves from the rhombohedral-tetragonal coexistence phase (MPB) to the rhombohedral phase with increasing BMZ content. The dielectric spectrum shows that εm was gradually decreased with increasing BMZ content, and the diffuse phase transition behavior becomes increasingly evident. In addition, the frequency dependence of the dielectric constant is strongest in the x = 0.35 composition. The P–E loops become slim and unsaturated, and the J–E curve shows a double current peak in the x = 0.35 composition indicating the coexistence of long-range ferroelectric domains and polar nanodomains. A large electric-field induced strain of 0.33% at 5 kV mm−1 was obtained in ternary ceramics with x = 0.35 and the strain does not change much in the investigated temperature range, which is less than 8% of its room-temperature value. This novel ternary ferroelectric ceramics with large and temperature-insensitive strain response will further provide a promising candidate material for actuator applications in harsh environmental conditions.Conflicts of interest
The authors declare no conflicts of interest.Acknowledgements
This work was supported by the National Natural Science Foundation of China (Grant No. 51002116), the Key R&D Program of Shaanxi Province (Grant No. 2020GY-296), Open Project from State Key Laboratory of Military Stomatology (Grant No. 2019KB02), and the “111 Project” of China (B14040).References
- T. Zheng, J. G. Wu, D. Q. Xiao and J. G. Zhu, Prog. Mater. Sci., 2018, 98, 552–624 CrossRef CAS
.
- M. V. Talanov, A. A. Pavelko and L. A. Reznichenko, J. Adv. Dielectr., 2020, 10, 206004 Search PubMed
.
- J. F. Tressler, S. Alkoy and R. E. Newnham, J. Electroceram., 1998, 2, 257–272 CrossRef CAS
.
- L. E. Cross, Mater. Chem. Phys., 1996, 43, 108–115 CrossRef CAS
.
- S. R. Anton and H. A. Sodano, Smart Mater. Struct., 2007, 16, 1–21 CrossRef
.
- Y. Chen, Y. Zhang, L. Zhang, F. Ding and O. G. Schmidt, Nano Energy, 2017, 31, 239–246 CrossRef CAS
.
- H. G. Haertling, Ferroelectrics, 1994, 154, 101–106 CrossRef
.
- J. G. Hao, W. Li, J. W. Zhai and H. D. Chen, Mater. Sci. Eng., R, 2019, 135, 1–57 CrossRef
.
- X. Y. Liu, J. H. Han, Y. L. Huang, J. Yin and J. G. Wu, J. Am. Ceram. Soc., 2021, 104, 1391–1401 CrossRef CAS
.
- X. Y. Tong, Z. Z. Du, Y. T. Yang, M. W. Song, J. J. Zhou, H. B. Zhang, C. L. Guan, H. Liu and J. Z. Fang, J. Alloys Compd., 2021, 857, 158237 CrossRef CAS
.
- N. S. Zhao, H. Q. Fan, X. H. Ren, J. W. Ma, J. Bao, Y. J. Guo and Y. Y. Zhou, J. Eur. Ceram. Soc., 2019, 39, 4096–4102 CrossRef CAS
.
- D. B. Lin, C. C. Li, S. B. Ge, E. Gorzkowski, S. Zhou, W. G. Liu and F. Li, J. Eur. Ceram. Soc., 2019, 39, 2082–2090 CrossRef CAS
.
- D. Hu, K. Wang, L. H. Wang, M. H. Zhang, H. C. Thong, Y. B. Liu, Z. Xu and F. Li, J. Am. Ceram. Soc., 2018, 101, 5514–5523 CrossRef CAS
.
- L. Jin, J. Pang, W. T. Luo, Y. Lan, H. L. Du, S. Yang, F. Li, Y. Tian, X. Y. Wei, Z. Xu, D. Guo and F. Gao, J. Alloys Compd., 2019, 806, 206–214 CrossRef CAS
.
- G. Z. Dong, H. Q. Fan, J. Shi and M. M. Li, J. Am. Ceram. Soc., 2015, 98, 1150–1155 CrossRef CAS
.
- J. Shi, H. Q. Fan, X. Liu and Q. Li, J. Eur. Ceram. Soc., 2014, 34, 3675–3683 CrossRef CAS
.
- Y. Y. Gong, X. He, C. Chen and Z. G. Yi, Ceram. Int., 2019, 45, 7173–7179 CrossRef CAS
.
- W. F. Bai, P. Li, L. Y. Li, J. J. Zhang, B. Shen and J. W. Zhai, J. Alloys Compd., 2015, 15, 772–781 CrossRef
.
- W. L. Zhao, R. Z. Zuo and J. Fu, J. Eur. Ceram. Soc., 2014, 34, 4235–4245 CrossRef CAS
.
- H. R. Jia, W. T. Zhu, S. Yang, F. Li and L. H. Wang, J. Eur. Ceram. Soc., 2021, 41, 6406–6413 CrossRef CAS
.
- F. X. Li, Q. Z. Wang and H. C. Miao, J. Appl. Phys., 2017, 122, 074103 CrossRef
.
- L. L. Fan, J. Chen, Q. Wang, J. X. Deng, R. B. Yu and X. R. Xing, Ceram. Int., 2014, 40, 7723–7728 CrossRef CAS
.
- R. F. Cheng, Z. J. Xu, R. Q. Chu, J. G. Hao, J. A. Du and G. R. Li, J. Eur. Ceram. Soc., 2016, 36, 489–496 CrossRef CAS
.
- R. D. Shannon, Acta Crystallogr., 1976, 32, 751–767 CrossRef
.
- T. L. Zhao, C. L. Fei, X. Y. Dai, J. J. Song and S. X. Dong, J. Alloys Compd., 2019, 806, 11–18 CrossRef CAS
.
- V. Mueller, H. Beige and H. P. Abicht, Appl. Phys. Lett., 2004, 84, 1341–1343 CrossRef CAS
.
- M. Sutapun, T. Charoonsuk, T. Kolodiazhnyi and N. Vittayakorn, J. Am. Ceram. Soc., 2018, 101, 1957–1966 CrossRef CAS
.
- W. Chen, X. Yao and X. Y. Wei, Appl. Phys. Lett., 2007, 90, 182902 CrossRef
.
- Z. Z. Xi, Q. Q. Bu, P. Y. Fang, W. Long and X. J. Li, J. Alloys Compd., 2015, 618, 14–18 CrossRef CAS
.
- K. Uchino and S. Critical, Ferroelectrics, 2011, 44, 55–61 Search PubMed
.
- K. Hirota, Z. G. Ye, S. Wakimoto, P. M. Gehring and G. Shirane, Phys. Rev. B: Condens. Matter Mater. Phys., 2002, 65, 104105 CrossRef
.
- A. A. Bokov and Z. G. Ye, J. Mater. Sci., 2006, 41, 31–52 CrossRef CAS
.
- M. Paściak, T. R. Welberry, J. Kulda, M. Kempa and J. Hlinka, Phys. Rev. B: Condens. Matter Mater. Phys., 2012, 85, 224109 CrossRef
.
- S. G. Lu, Z. K. Xu and H. Chen, Appl. Phys. Lett., 2004, 85, 5319–5321 CrossRef CAS
.
- S. Y. Choi, S. J. Jeong, D. S. Lee, M. S. Kim, J. S. Lee, J. H. Cho, B. I. Kim and Y. Ikuhara, Chem. Mater., 2012, 24, 3363–3369 CrossRef CAS
.
- W. L. Zhao, R. Z. Zuo, J. Fu and M. Shi, J. Eur. Ceram. Soc., 2014, 2299–2309 CrossRef CAS
.
- W. L. Zhao, R. Z. Zuo, D. G. Zheng and L. T. Li, J. Am. Ceram. Soc., 2014, 97, 1855–1860 CrossRef CAS
.
- J. Fu and R. Z. Zuo, Acta Mater., 2013, 61, 3687–3694 CrossRef CAS
.
- X. Y. Liu, J. H. Han, Y. L. Huang, J. Yin and J. G. Wu, J. Am. Ceram. Soc., 2021, 104, 1391–1401 CrossRef CAS
.
- F. Li, L. Jin, Z. Xu and S. J. Zhang, Appl. Phys. Rev., 2014, 1, 011103 Search PubMed
.
- Q. R. Hu, Y. P. Wang, K. Yan, L. Chen, G. L. Yuan, J. Chen and Y. Yang, Ceram. Int., 2019, 45, 17962–17968 CrossRef CAS
.
- X. Xia, X. G. Jiang, J. T. Zeng, L. Y. Zheng, Z. Y. Man and G. R. Li, J. Materiomics, 2021, 7, 1143–1152 CrossRef
.
| This journal is © The Royal Society of Chemistry 2022 |

