Narrow-band red phosphors of high colour purity based on Eu3+-activated apatite-type Gd9.33(SiO4)6O2†
Received
23rd March 2021
, Accepted 4th May 2021
First published on 4th May 2021
Abstract
A series of new red phosphors based on apatite-type gadolinium silicate host, Gd9.33−xEux(SiO4)6O2 (0.03 < x < 1.87), have been synthesised and analysed. The phosphors show excellent chemical and thermal stability, losing only 10% of their emission intensity at 150 °C (working LED temperature) relative to that at room temperature through the electric dipole–dipole interaction. They exhibit efficient Eu3+ narrow-band red emission (quantum yield up to 75%; full-width at half-maximum (FWHM) = 7 nm; CIE colour coordinates x = 0.65, y = 0.35) of exceptional colour purity (94.2%), and the host can be heavily doped with Eu3+ (up to 10 at%) without concentration quenching of the emission. Variable-temperature powder X-ray diffraction, photoluminescence spectroscopy and Judd–Ofelt analysis of the phosphors’ radiative properties reveal the favourable influence of the structural properties of the apatite-type host on the efficiency and thermal stability of the Eu3+-activated Gd9.33(SiO4)6O2 emission.
1. Introduction
The conventional technology for lighting based on incandescence or fluorescence activated by electric discharge is increasingly being replaced by more efficient and reliable white light-emitting diodes (WLEDs). There is much interest in the development of efficient WLEDs to reduce the amount of energy consumed for the new generation of ambient lighting. However, the development faces several challenges, one of which is to produce red phosphors with high chemical and thermal stability that also have high quantum yields to ensure efficient energy conversion.1–4 Phosphors for WLEDs should also possess high colour-rendering index (CRI). The issue is that the higher the CRI, the lower the luminous efficacy (the light output per unit energy), as the human visual response peaks in the green region of the spectrum. For white lighting, the best possible balance between lighting quality and efficiency is a CRI of 90, where the luminous efficacy of radiation (LER) is 408 lm W−1. For white light generated by the combination of red, green and blue emitters (RGB), the emission wavelength for the red component that maximises efficiency is at 614 nm.5–7 For the green component, where the human eye response is stronger, narrow emission linewidths are not critical for efficiency, nor are they for the blue component, which makes only a low contribution to white light. On the other hand, the red component linewidth is critical and must be narrower than 20 nm in order to minimise spillover into deeper red, where the human visual response drops very steeply.8
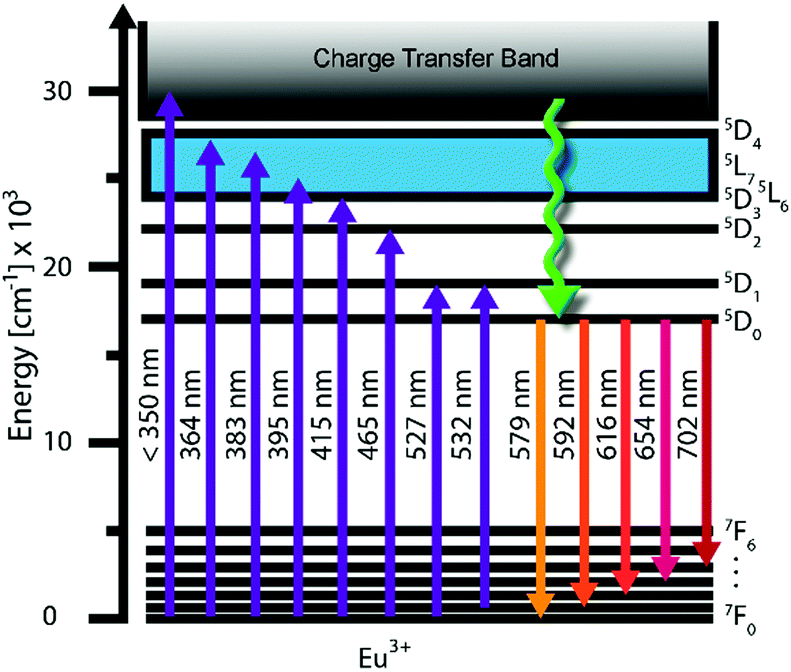
Some trivalent lanthanide ions have f–f emission bands in the visible spectrum. Eu3+ is one such ion: its hypersensitive 5D0 → 7F2 transition is often used to generate light at about 617 nm.9 Of the seven possible 5D0 → 7FJ transitions, the 5D0 → 7F1 (at around 593 nm) is the only one with purely magnetic dipole character. This transition is allowed by the Laporte selection rule but, in low symmetry environments, it tends to show weaker emission than the 5D0 → 7F2 of the remaining six transitions of electric dipole character (parity-forbidden).10 A further overview of these transitions (shown in Fig. 1) is given in Table S1 (ESI†).9
 |
| | Fig. 1 Energy level diagram for Eu3+ ion showing the relevant transitions. | |
The emission spectra of Eu3+ ions strongly depend on the symmetry of the site in the host lattice, which is why Eu3+ can be used as a spectral probe for the point symmetry of the doping site. If the Eu3+ is located on an inversion centre, the 5D0 → 7F1 transition dominates over the 5D0 → 7F2 transition, resulting in bright orange luminescence.11 The 5D0 and 7F0 levels cannot undergo splitting, but each of the 7FJ levels (J = 1 to 6) can be split into up to 2J + 1 Stark sub-levels according to the symmetry (Table S2, ESI†) leading to fine structure. The 5D0 → 7F0 transition (at around 580 nm) comprises only a single band and thus can be used to determine the minimum number of different sites occupied by the Eu3+ including possible silent transitions, if the spectral resolution is sufficiently high.
The symmetry of the doping site that the Eu3+ ion occupies will dictate the broadening of the emission peak. Selected illustrative examples of Eu3+-doped narrow-band red phosphors are given in Fig. 1.
In Table 1, these materials are arranged based in the order of increasing full-width at half-maximum (FWHM) measured for the 5D0 → 7F2 emission. The red phosphor with the smallest FWHM of 3 nm is Y2MoO6:Eu3+ with an emission maximum at 611 nm,12 whilst Y2SiO5:Ce3+,Tb3+,Eu3+ shows λmax = 612 nm and FWHM = 5 nm.13 Amongst apatite-type phosphors, an FWHM of 7 nm has been reported for Sr2(La1−xEux)8(GeO4)6O2, for which λmax = 612 nm.14
Table 1 Optical and crystallographic properties of Eu3+-doped narrow-band red phosphors
| Material |
FWHM [nm] |
5D0 → 7F2 emission [nm] |
Wyckoff sites |
Site symmetries |
Splitting of 5D0 → 7F2 emission peak |
Y2MoO6:Eu3+![[thin space (1/6-em)]](https://www.rsc.org/images/entities/char_2009.gif) 12 12 |
3 |
611 |
4e and 8f |
C
2 and C1 |
5 peaks |
| Y2SiO5:Ce3+,Tb3+,Eu3+13 |
5 |
612 |
8f |
C
1
|
5 peaks |
| Li2SiN2:Eu3+15 |
7 |
612 |
8c |
C
1
|
5 peaks |
| Sr2(La1−xEux)8(GeO4)6O214 |
7 |
613 |
4f and 6h |
C
3 and Cs |
3 and 5 peaks |
| Ba2La2.63Tb0.15Eu0.22(SiO4)3F16 |
10 |
616 |
4f and 6h |
C
3 and Cs |
3 and 5 peaks |
| Sr3Gd0.9Na(PO4)3F:0.1Eu3+17 |
10 |
615 |
2d |
C
3
|
3 peaks |
| Ba2Gd8(SiO4)6O2:Eu3+18 |
10 |
615 |
4f and 6h |
C
3 and Cs |
3 and 5 peaks |
| Sr5(PO4)1.9(SiO4)0.95:Eu3+19 |
14 |
614 |
4f and 6h |
C
3 and Cs |
3 and 5 peaks |
| LiLaMg(W,Mo)O6:Eu3+20 |
15 |
615 |
4g |
C
2
|
5 peaks |
| Ca5(PO4)3F:0.04Eu3+21 |
20 |
620 |
4f and 6h |
C
3 and Cs |
3 and 5 peaks |
| Sr4La6(SiO4)6F2:Eu3+22 |
25 |
615 |
4f and 6h |
C
3 and Cs |
3 and 5 peaks |
| Sr4La6(SiO4)6Cl2:Eu3+22 |
25 |
615 |
4f and 6h |
C
3 and Cs |
3 and 5 peaks |
| Gd2Mo2O9:Eu3+11 |
25 |
612 |
4a |
C
3
|
3 peaks |
| La2Mo3O12:Eu3+11 |
25 |
615 |
Three 8f |
C
1
|
5 peaks |
| La2Mo2O9:Eu3+11 |
25 |
612 |
4a |
C
3
|
3 peaks |
| TiO2:Eu3+23 |
27 |
610 |
2a |
D
2h
|
5 peaks |
In this paper we describe the preparation and properties of a new series of narrow-band red phosphors based on apatite-type gadolinium silicate, Gd9.33(SiO4)6O2. This material has been selected as the host because it can absorb energy efficiently in the near-UV region through the 8S → 6P5/2,7/2 transition of the Gd3+ sensitiser.24 Its suitability as a host has already been reported in studies of white-emitting phosphors.25–32 The series of red phosphors prepared in this work adopt the general formula Gd9.33−xEux(SiO4)6O2 (with x = 0.03, 0.05, 0.07, 0.09, 0.19, 0.28, 0.47, 0.65, 0.93, 1.40 and 1.87, corresponding to a maximum of 20 at% Eu3+ doping). Variable temperature powder X-ray diffraction (PXRD) and optical measurements were used to probe the structural and luminescence behaviour of the materials, with the aim of investigating concentration and thermal quenching, emission efficiency and colour purity.
2. Experimental
2.1. Synthesis
All samples were prepared using conventional solid-state synthesis. The starting materials were dried at 1200 °C and PXRD patterns were recorded to check reagent quality prior to using them in the synthesis. To prepare 2.0 g of each composition, stoichiometric amounts of the reagents were weighed (with a precision of ±0.0001 g), ground for around 30 minutes, and heated in cycles with intermittent grinding, first at 1400 °C for 100 h and then at 1500 °C for 200 h.
2.2. Powder X-Ray diffraction
Laboratory PXRD patterns were recorded at room temperature to monitor the purity of the samples between each heating cycle. The final recorded patterns were fitted using a modified structural model of Gd9.33(SiO4)6O2.24 A Bruker AXS d8 Advance33 diffractometer using CuKα1,2 radiation and a Lynxeye detector were used to record the patterns in a 2θ range from 10° to 70° using a step size of 0.02° and a step time of 1 s. All PXRD data were analysed using Topas Academic software.34,35 The refined variables included the background terms, diffractometer zero point, pseudo-Voigt peak shape function parameters, unit cell parameters and isotropic atomic displacement parameters for each phase. For the variable-temperature X-ray diffraction (VTXRD), a Bruker AXS d8 Advance diffractometer with CuKα1,2 radiation, a LynxEye detector and an Anton Parr HTK1200 high-temperature furnace were used. The patterns were recorded every 23.5 °C from 18 to 527 °C, with an initial heating and cooling cycle to eliminate any moisture. Temperature calibration in the diffractometer furnace was performed using an alumina standard.
2.3. Photoluminescence spectroscopy
Photoluminescent characterisation was performed using a high-stability solid-state laser at 532 nm as the excitation source. An optical diffraction grating with 300 lines/mm (Horiba Jobin Yvon FHR1000 monochromator) and iCCD camera (Horiba Jobin Yvon 3771) were used on the detection side. A Horiba Jobin Yvon Fluorolog-3 Model FL3-221 spectrofluorometer system was used to collect the variable-temperature emission spectra under excitation by a 450 W xenon lamp. Homogeneous, finely powdered samples of the materials were heated from room temperature to 475 °C with addition of MicrOptik temperature-controlled liquid nitrogen cooling/heating stage. For lifetime measurements, the radiation from the laser was modulated, and emission spectra were measured as a function of delay time from the falling edge (laser off). The Judd–Ofelt parameters and derived quantities were calculated using the JOES36 software package.
3. Results and discussion
3.1. Structural analysis
Fig. 2 shows the Rietveld fit for the Gd9.30Eu0.03(SiO4)6O2 compound. Corresponding fits for the Gd9.33−xEux(SiO4)6O2 (x = 0.03, 0.05, 0.07, 0.09, 0.19, 0.28, 0.47, 0.65, 0.93, 1.40 and 1.87) phosphor series are provided in the ESI,† Fig. S1. The patterns were fitted using the structural model of the hexagonal apatite in space group P63/m. Small amounts of Gd2SiO5 (peaks marked with ∇ in Fig. S1, ESI†) were detected in most samples (Table S3, ESI†).
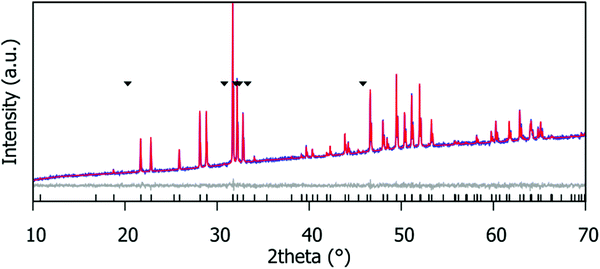 |
| | Fig. 2 Rietveld fit of the laboratory PXRD data for the Gd9.30Eu0.03(SiO4)6O2 phosphor. ∇ indicates the Gd2SiO5 impurity peaks; this impurity is present at 2.7(8)% by weight. | |
In the apatite structure type, which can be described in terms of the general formula A10(BO4)6X2±δ (where A is a larger cation, B is a smaller cation, and X is an anion), doping can potentially occur on two crystallographically independent A-sites on which Gd3+ is located: A1 (Wyckoff site 4f with site symmetry C3) and A2 (Wyckoff site 6h with site symmetry Cs). The distance between the Eu3+ dopants in the material is important as the emission intensity may decrease due to the energy transfer (ET) between activator ions. Fig. 3 shows the connectivity between different Gd3+ sites, labelled Gd1 (shown as pink polyhedra) and Gd2 (shown as purple polyhedra). Fig. 3a and b shows the connectivity in the ab plane, where a Gd1O6 trigonal prism shares all its six oxygen atoms with 7-coordinate Gd2O7 polyhedra and the distance between Gd1 and Gd2 sites is ∼4.1 Å. Fig. 3c shows the connectivity in the c-direction. The Gd1 sites are arranged in vertical chains formed by Gd1O6 trigonal prisms, sharing top and bottom faces, connected by their six oxygen atoms with two other Gd1O6 trigonal prisms, and where the distance between neighbouring Gd1 atoms is ∼3.4 Å. Fig. 3d shows the Gd2 sites connected by two rings that share two oxygen atoms between the top and bottom layers. Each ring has three Gd2O7 that share corners with a central oxygen atom. The distance between Gd2 and Gd2 ranges from 4.1 to 5.6 Å.
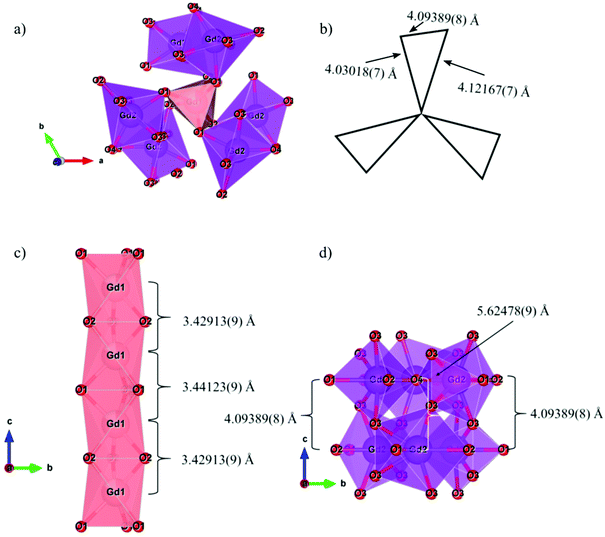 |
| | Fig. 3 (a) View of the ab plane, (b) schematic of the ab plane, (c) c-direction for Gd1 sites and (d) c-direction for Gd2 sites for the Gd9.33(SiO4)6O2 structure. | |
3.2. Photoluminescence of Gd9.33(SiO4)6O2:Eu3+ materials
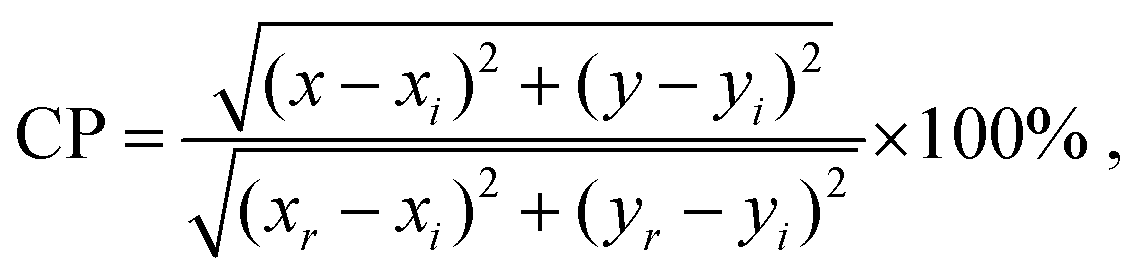
Fig. 4(a) shows the photoluminescence (PL) emission spectra for the phosphors recorded under 532 nm excitation. PL emission spectra are typical for the Eu3+ activated compounds and consist of five narrow peaks centred at 577, 591, 614, 653, and 705 nm arising from the 5D0 → 7F0–4 electronic f–f transitions. The emission centred at 614 nm is due to the hypersensitive 5D0 → 7F2 electric-dipole transition and dominates the spectrum since the Eu3+ is in non-centrosymmetric crystallographic sites: the site symmetries of the Eu3+ ions are C3 (4f) and Cs (6h). The expected splittings for the 5D0 → 7F2 manifold are 3 and 5 for each site (as seen in Table S2, ESI†), which leads to broadening of the band; however, the FWHM is only 7 nm, such that the compound could be categorised as a narrow-band red phosphor. For the most intensely emitting composition, Gd8.4Eu0.93(SiO4)6O2, the CIE colour coordinate of emission is (0.65, 0.35), Fig. 4b. For this phosphor composition, the colour purity (CP) is determined to be 94.2% using the following formula:37| |  | (1) |
where (x, y) = (0.65, 0.35) is the colour coordinate of the sample emission, (xi, yi,) = (1/3, 1/3) stands for the CIE E (equal energy) achromatic point, and (xr, yr) = (0.67, 0.33) is the coordinate of the primary red colour. The CP of the red emission displayed by this material is superior to that of SrMoO4:Eu3+ (CP = 85.8%),38 Ca0.5Sr0.5MoO4:Eu3+ (CP = 89.5%),39 NaBiF4:Eu3+ (CP = 90.2%),37 and almost equal to the colour purity of ultra-heavily doped Ba6Gd2Ti4O17:Eu3+ (CP = 94.4%).40
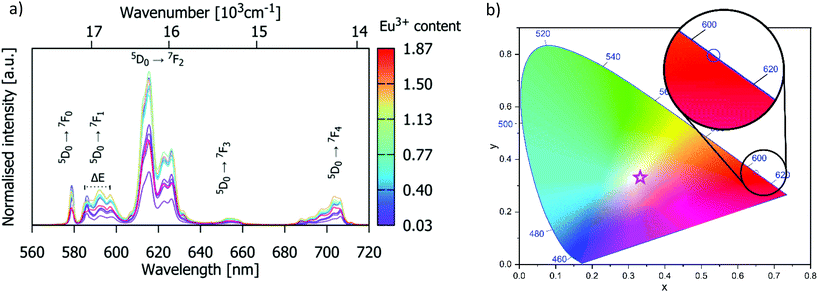 |
| | Fig. 4 (a) Room-temperature emission spectra of Gd9.33−xEux(SiO4)6O2 (0.03 < x < 1.87) recorded under 532 nm excitation. (b) CIE chromaticity diagram showing the Gd8.4Eu0.93(SiO4)6O2 emission colour coordinate of (0.65, 0.35); the star symbol represents the CIE E achromatic point (1/3, 1/3). | |
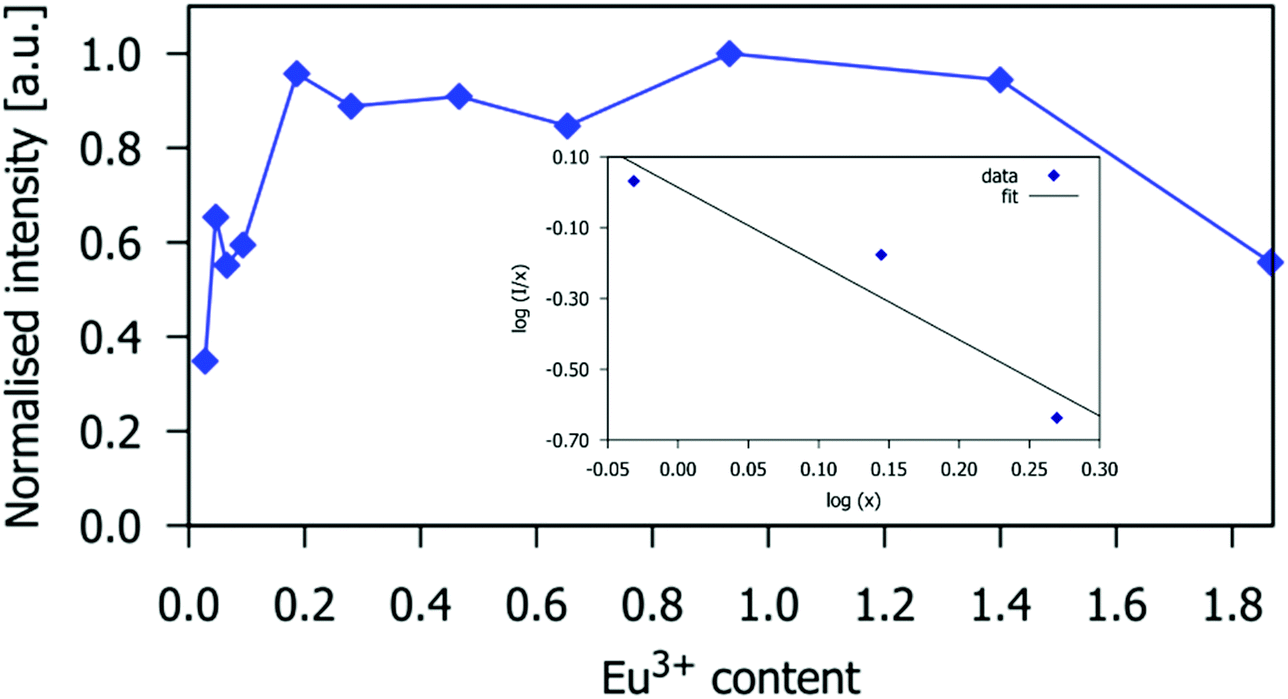
3.3. Concentration quenching of Eu3+ emission
The dependence of the 5D0 → 7F2 emission intensity at 614 nm on Eu3+ doping concentration is given in Fig. 5. The emission intensity is highest for Eu3+ concentration x = 0.93 (which corresponds to the critical concentration xc = 10 atom% with respect to the number of Gd3+ ions), beyond which it decreases slightly for x = 1.40, and significantly for the material containing x = 1.87. This demonstrates that apatite-type gadolinium silicates can be heavily doped with Eu3+ to achieve intense emission, more so than Sr2(1−x)Eu2xZnGe2O7, for which high emission intensity is retained only to x = 0.05,41 or NaSrLa1−x(MO4)3, where the highest emission intensity was found at x = 0.008 and x = 0.010 for M = Mo and W respectively.42
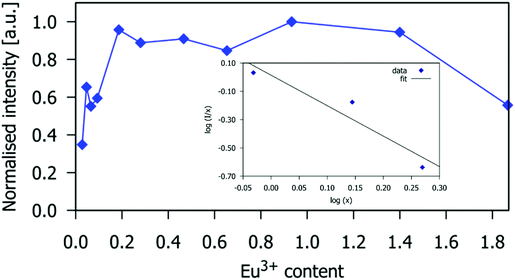 |
| | Fig. 5 The intensity of the Eu3+ 5D0 → 7F2 emission band of Gd9.33−xEux(SiO4)6O2 at 614 nm as a function of the Eu3+ concentration. (0.03 < x < 1.87). The intensities are normalised to the value of the highest intensity (x = 0.93). The inset shows the log10(I/xEu) vs. log10(xEu) plot for the Eu3+ doping concentrations larger than the critical concentration. | |
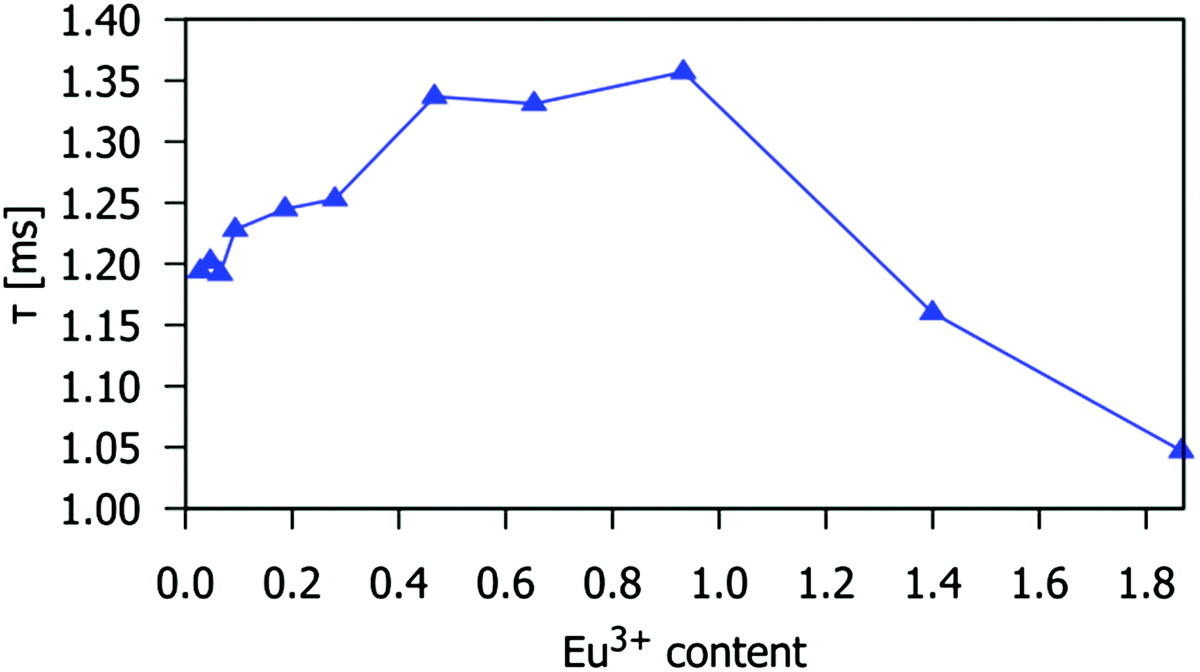
The Eu3+ 5D0 excited state lifetimes of gadolinium silicate apatite samples activated with different amounts of Eu3+ are shown in Table S4 (ESI†). The decay of the emission at 614 nm fits well to first-order kinetics, giving lifetimes of 1.05 to 1.35 ms. These values are similar to those of Eu3+-doped Sr2La8(GeO4)6O214 and Gd9.33−x−yEuxTby(SiO4)6O2,25 with lifetimes of 0.9 to 1.3 ms and 1.28 to 1.39 ms, respectively. The lifetime decreases for Eu3+x > 0.93, which is consistent with the observed intensity decrease for such compositions, and confirms that the drop-off in intensity is due to excited-state quenching (Fig. 5 and 6).
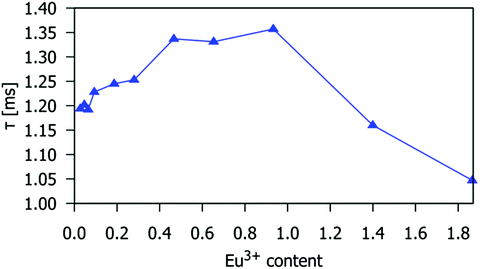 |
| | Fig. 6 The 5D0 excited state lifetime of the Eu3+ ion in the Gd9.33−xEux(SiO4)6O2 phosphors as a function of x. The temporal decay of the emission was monitored at 614 nm (5D0 → 7F2 transition). | |
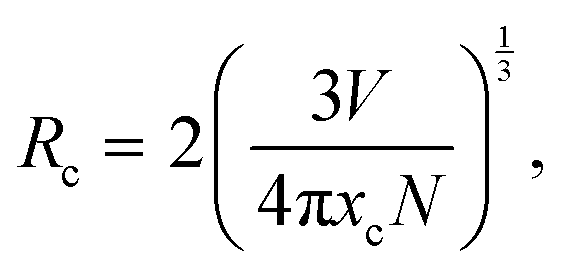
The distance between the activator ions (Eu3+) is important as the emission intensity may decrease due to the energy transfer (ET) between activator ions. The critical distance for ET can be calculated using the following equation:43,44
| | 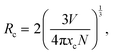 | (2) |
where
N and
V are the number of cations in the unit cell and the volume of the unit cell respectively. The critical concentration,
xc, is the Eu
3+ content in respect to the Gd
3+ in the host at which the emission intensity starts to decrease. The concentration quenching was found to begin at doping levels
xc = 10 atom% (
x = 0.1). Using this value with
N = 8 and
V = 530.75 Å
3, the critical transfer distance is calculated to be
Rc = 10.821(6) Å. In general, for distances
Rc > 5 Å, the mechanism of non-radiative energy transfer is through electric multipolar interaction.
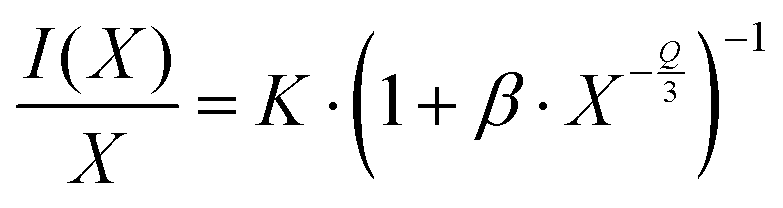
18 The character of interaction can be more closely described by Van Uitert's relationship between the emission intensity
I(
x) and dopant concentration
x (valid for
x ≥
xc):
45| | 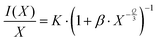 | (3) |
where
K,
β and
Q are constants to be determined. The value of
Q indicates the character of multipolar interactions:
Q = 6 for dipole–dipole interactions;
Q = 8 for dipole–quadrupole interactions; and
Q = 10 for quadrupole-quadrupole interactions. The graph log(
I/
x)
vs. log(
x) is depicted in inset of
Fig. 5, the slope -
Q/3 is around −2, so the value of
Q was found to be 6, implying that the emission quenching mechanism in Gd
9.33−xEu
x(SiO
4)
6O
2 occurs
via dipole–dipole interactions.
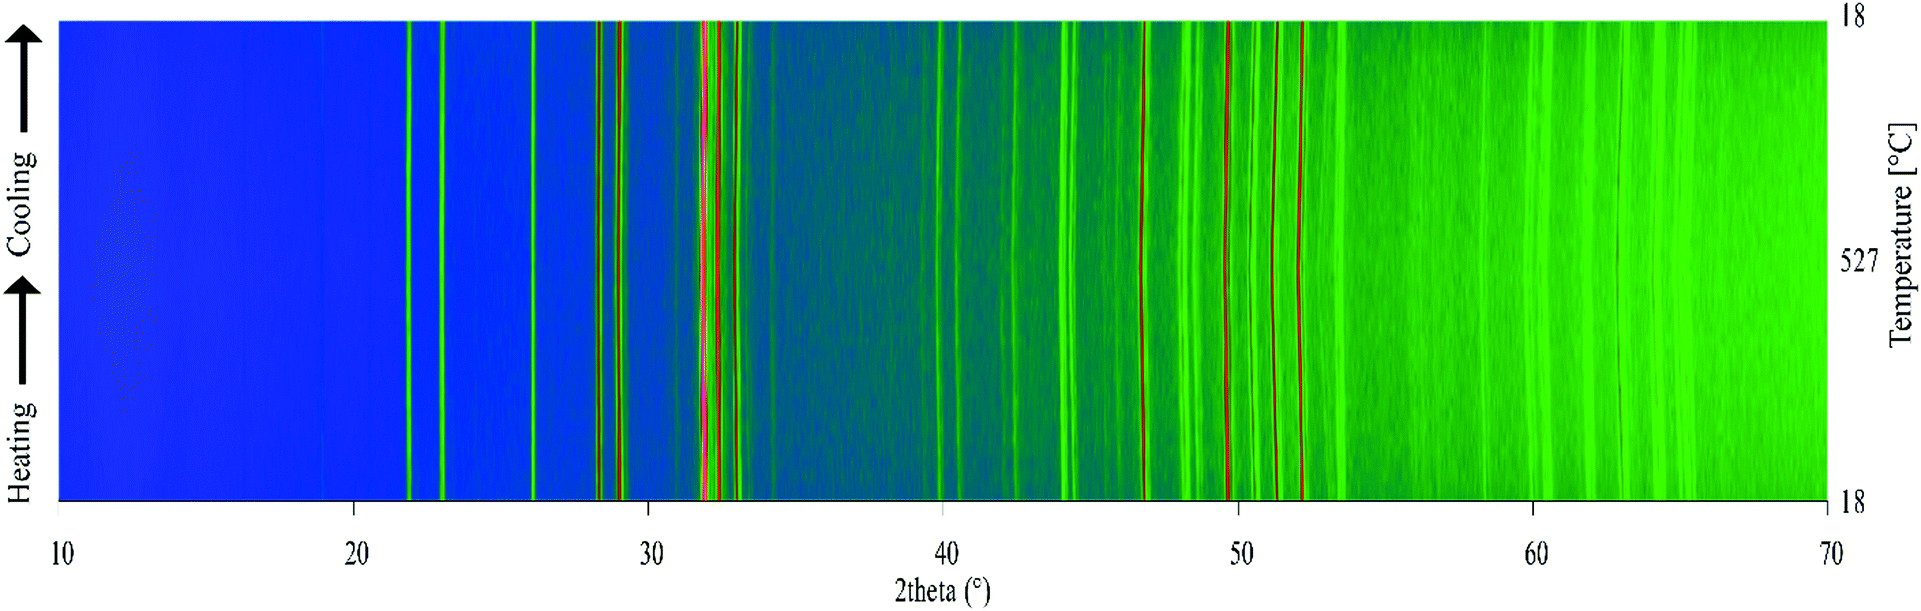
3.4. Thermal stability of the Gd9.05Eu0.28(SiO4)6O2 phosphor
Variable-temperature powder X-ray diffraction (PXRD) was used to assess the thermal stability of the materials prepared. Fig. 7 shows a surface plot of the 42 diffraction patterns recorded on warming and cooling between 18 °C and 527 °C. The Gd9.05Eu0.28(SiO4)6O2 phosphor does not undergo any phase transitions or abrupt changes in unit cell parameters, and it retains its crystallinity, demonstrating that it can be used in applications that require high temperature environments, e.g. 150 °C, a temperature typical of a working LED.
 |
| | Fig. 7 Variable-temperature laboratory PXRD patterns for the Gd9.05Eu0.28(SiO4)6O2 on warming and cooling between 18 °C and 527 °C. The artificial colour map shows intensity changes in the PXRD pattern. | |
Rietveld fitting of the different patterns was performed and the values of the lattice parameters obtained are presented in. The linear and volume thermal expansion coefficients αa = 8.87(9) × 10−6 K−1, αc = 5.90(1) × 10−6 K−1, and αV = 2.40(2) × 10−5 K−1. The variation of the unit cell parameters with temperature, shown in with green, yellow and blue lines and symbols, has a linear positive thermal expansion trend (further details are given in Table S4, ESI†). Anisotropic thermal expansion in the host material causes subtle changes in the shape of the Eu3+ emission bands (Fig. 4a). The maximal splitting of the 7F1 manifold emission spectrum (marked as ΔE in Fig. 4a) is proportional to the crystal field strength acting on Eu3+. In the present case, ΔE ≈ 320 cm−1 at room temperature, which is within the ranges reported in the literature for related red phosphors reported in the literature, e.g. 307–323 cm−1 for Eu2Mo3O12 and 350–374 cm−1 for Y2−xLuxO3:Eu3+.46,47 As the temperature increases, the unit cell of the host material becomes larger (V is increasing) so the ligating ions are on average further from the Eu3+ centre and the intensity of the crystal field decreases. This effect is manifested by a decrease in the ΔE value at higher temperatures, as seen in Fig. 8 (where the data points are shown as red symbols and the fit as the red line).
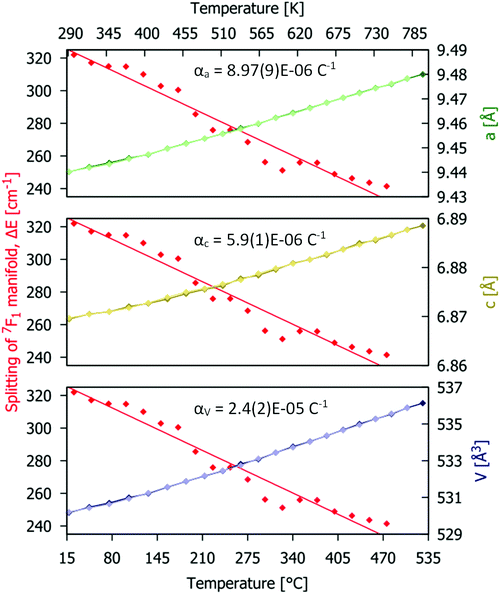 |
| | Fig. 8 Temperature dependences of structural parameters (obtained from the Rietveld fit for PXRD data; green, red and blue symbols and line) and maximal energy splitting ΔE of the Eu3+ 5D0 → 7F1 manifold (data as red symbols and fit as red lines) for the Gd9.05Eu0.28(SiO4)6O2 phosphor. | |
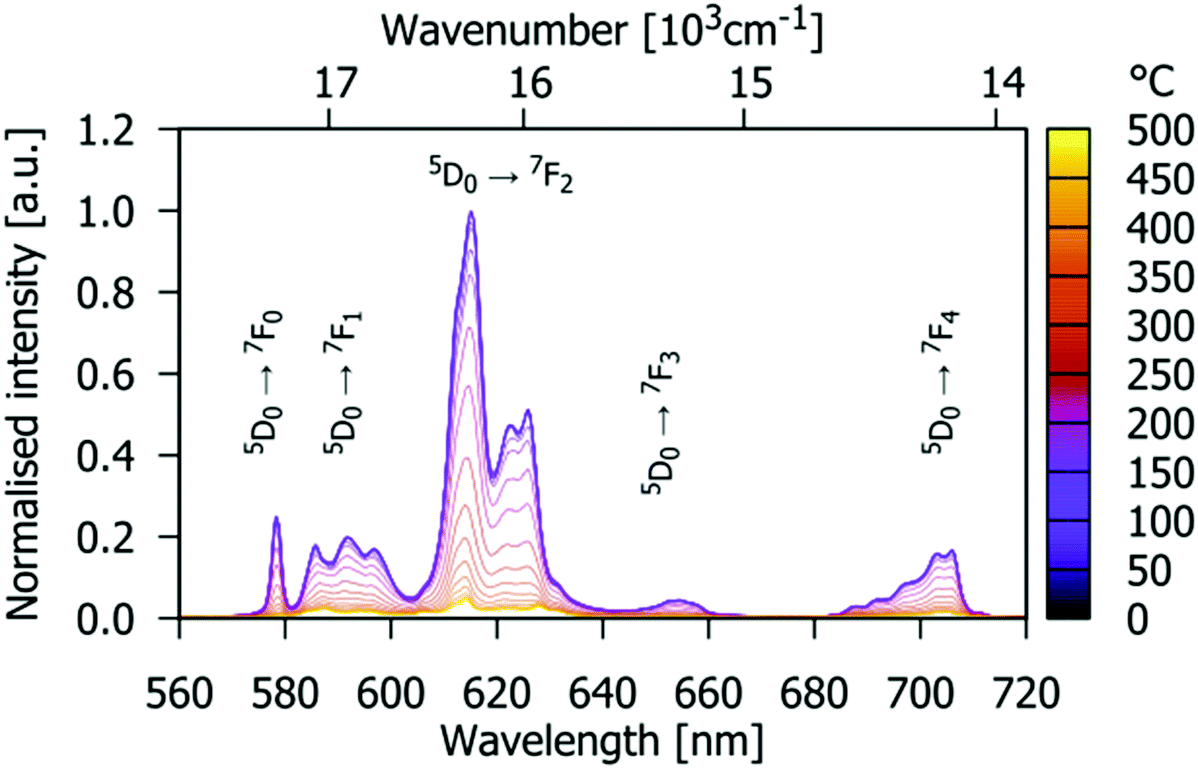
The PL emission spectra of Gd9.05Eu0.28(SiO4)6O2 recorded under 532 nm excitation at several different temperatures in the range 0–500 °C are shown in Fig. 9. Splitting of the emission line is observed at room temperature due to Eu3+ being located at two different crystallographic sites. Furthermore, broadening is observed as the temperature increases. This is related to more pronounced lattice vibrations at higher temperatures.
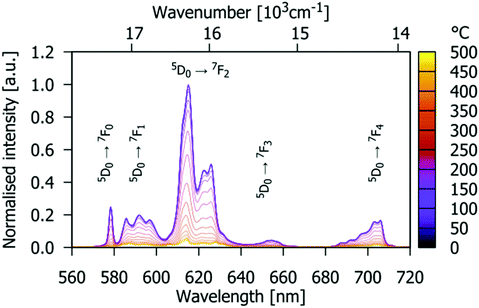 |
| | Fig. 9 Temperature-dependent PL emission spectra of the Gd9.05Eu0.28(SiO4)6O2 phosphor (excited by 532 nm radiation). Colour scale marks the temperature from 25 °C (purple) to 475 °C (yellow). | |
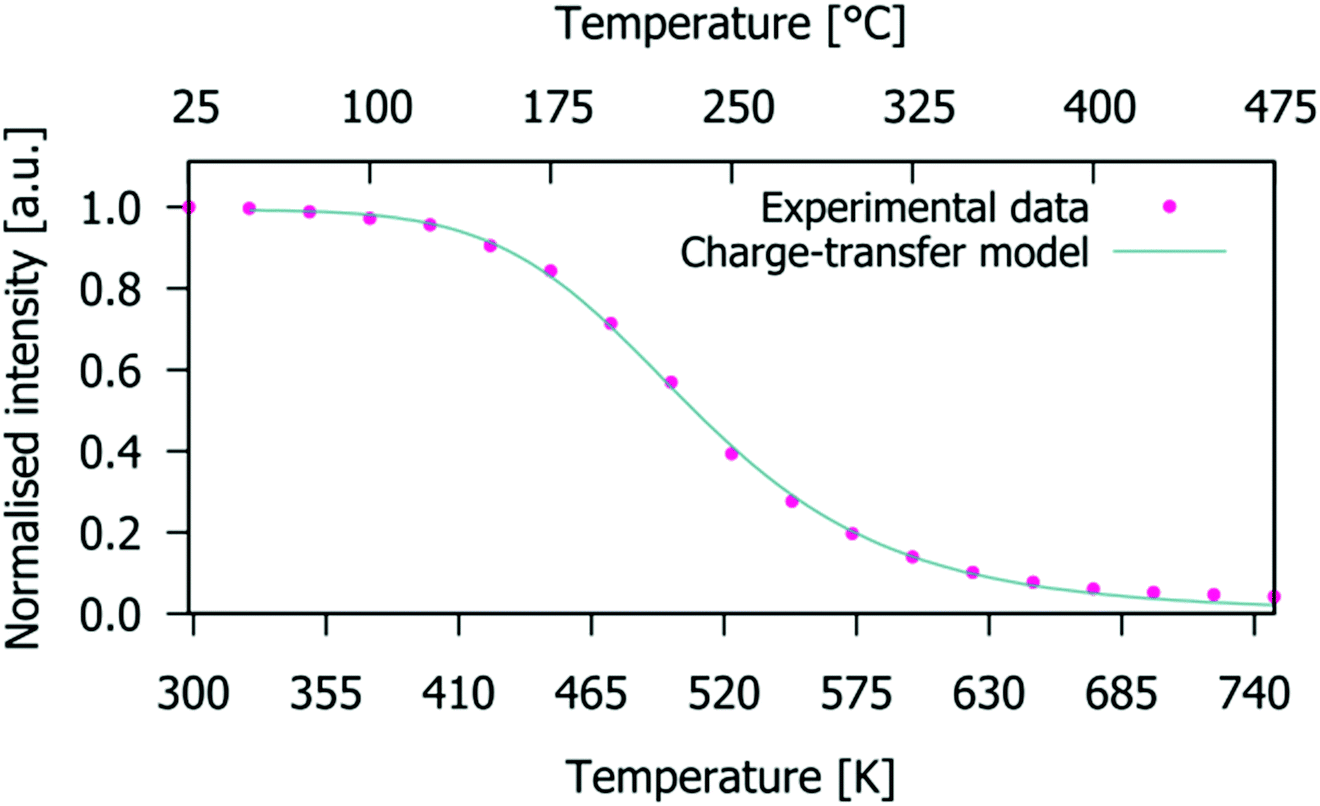
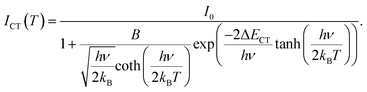
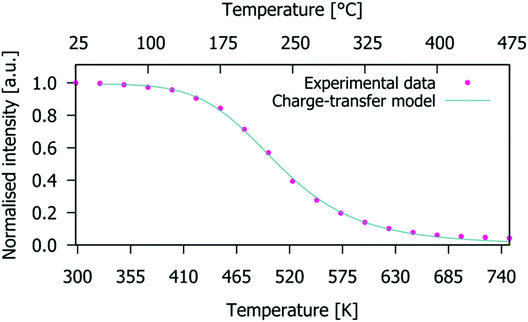
The normalised emission integrals obtained from the emission spectra are shown in Fig. 10 (normalised to the maximum intensity value obtained from the spectrum measured at 25 °C). At 150 °C, the normalised emission integral only decreases to 90% of its room temperature value. Hence, the Gd9.05Eu0.28(SiO4)6O2 phosphor presents good thermal quenching characteristics. This behaviour is superior to that reported in the literature for NaSrEu(MoO4)3 which decreased to 64% at 150 °C.48 To determine the activation energy of the thermally induced emission quenching process, the experimental data were fitted to the configurational coordinate charge transfer (CT) model:49
| |  | (4) |
Here,
ICT(
T) is the temperature-dependent emission integral,
I0 = 1 is the value of the emission integral at room temperature,
B =
kNR/
kR is the ratio of the non-radiative and radiative transition rates, Δ
ECT is the energy of the intersection between parabolas that represent the charge-transfer state and
5D
0 state in the configuration coordinate representation,
kB is the Boltzmann constant (8.617342 × 10
−5 eV K
−1), and
hv is the average energy of host phonons involved in the process.
 |
| | Fig. 10 Charge-transfer model fit (solid line) for temperature-dependent emission integrals of the experimental data (dots) for the Gd9.05Eu0.28(SiO4)6O2 phosphor (integral values are normalised to that obtained from the spectrum measured at 25 °C). | |
The charge-transfer model fit of the experimental temperature-dependent emission integrals (solid line and symbols, respectively, in Fig. 10) for the Gd9.05Eu0.28(SiO4)6O2 phosphor leads to a value for the activation energy of the emission thermal quenching process of 0.54(1) eV. This energy is a measure of the thermal stability of the Eu3+ emission; higher activation energies describe phosphors with high thermal stability of emission. The obtained value of gadolinium silicate apatite is superior to the values of 0.412 eV for Sr4La6(SiO4)6F2:Eu3+,22 0.481 eV for Sr4La6(SiO4)6Cl2:Eu3+,22 0.4(1) eV for Eu2Mo4O15,50 but lower than that of 0.84(4) eV for Tb2Mo3O12:Eu3+.46
3.5. Judd–Ofelt analysis of the intensities of the electronic transitions in Gd9.33−xEux(SiO4)6O2
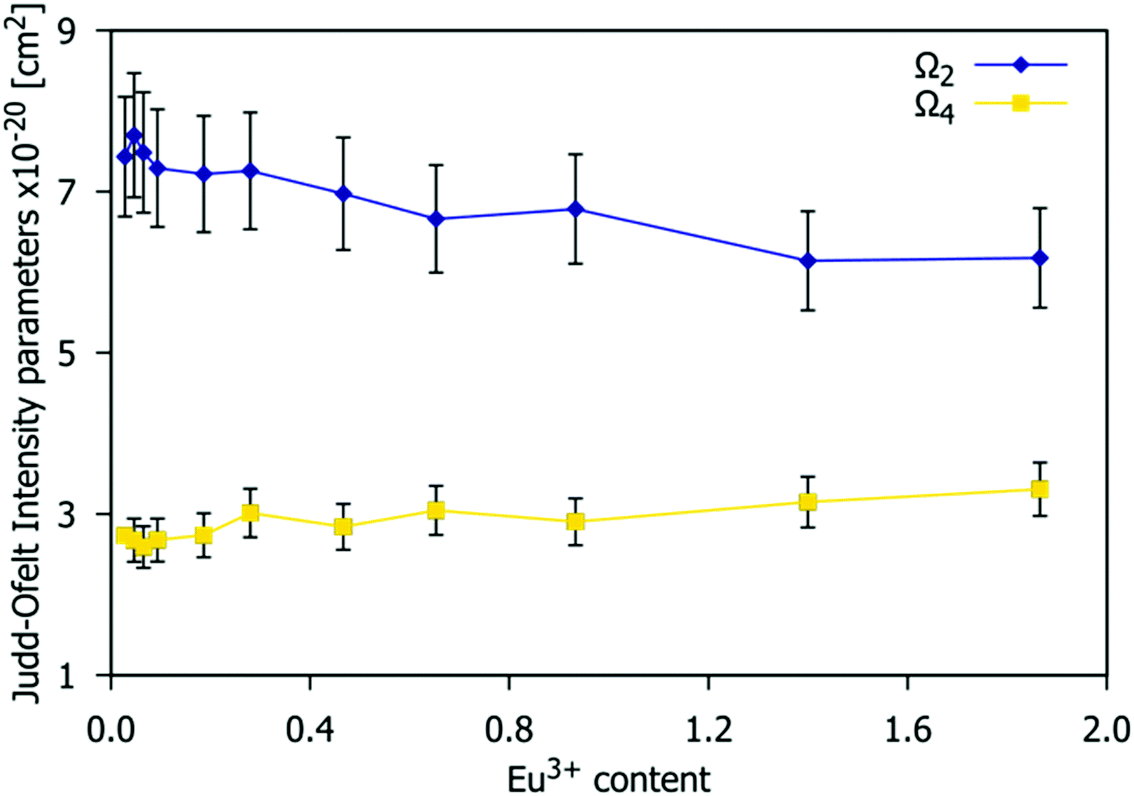
The Judd–Ofelt (JO) theory allows for the quantitative analysis of f–f electronic transitions of lanthanide ions and provides the Judd–Ofelt intensity parameters (Ω2 and Ω4), the value of radiative lifetime and the intrinsic quantum yield.51,52 The Ω2 and Ω4 parameters, as well as the relationship between both parameters, demonstrate the nature and extent of bonding of the Eu3+ with the ligands and the degree of asymmetry around the metal ion site.53 For Gd9.33−xEux(SiO4)6O2 phosphors, the JO intensity parameters Ω2 and Ω4, shown in Fig. 11 were calculated from the respective emission spectra using JOES software36 (see the ESI,† Section S1 for details of calculation) and assuming the refractive index to be 1.8.54
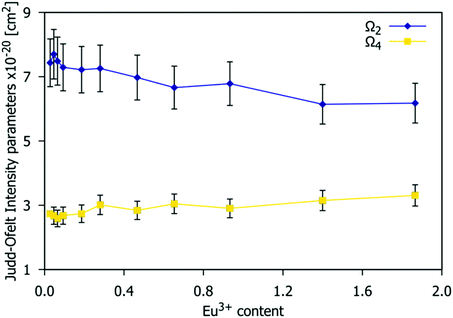 |
| | Fig. 11 Values of the Judd–Ofelt Ω2 and Ω4 intensity parameters estimated from the emission spectra as a function of the Eu3+ concentration of the Gd9.33−xEux(SiO4)6O2 (0.03 < x < 1.87) phosphors. | |
The Ω2 parameter is strongly dependent on the 5D0 → 7F2 transition rate and on the symmetry around Eu3+.55,56Fig. 11 shows that the Ω2 value decreases when the Eu3+ doping content increases, which implies a decrease in the average distortion of the Eu3+ cation coordination polyhedra and perhaps a reduction in covalent nature.53 As stated previously, the available crystallographic sites for Eu3+ are 4f and 6h with C3 and CS symmetry respectively. The decrease of Ω2 shown in Fig. 11 suggests that the higher local symmetry site (C3) is preferentially occupied at higher Eu3+ concentrations. This is consistent with the arrangements found in other series of phosphors based on the apatite structure type, such as A2Y8(SiO4)6O2 (A = Ca, Sr).57 The values obtained range from 6.9(7) to 6.2(6) × 10−20 cm2, which is in accordance with those reported in the literature for Sr0.2Ca9.65Eu0.1(PO4)6(OH)2,56Ω2 = 6.68 × 10⁻²⁰ cm2; Ca9.5Eu0.5(PO4)6(OH)2,58Ω2 = 6.85 × 10⁻²⁰ cm2; and Sr9.95Eu0.05(PO4)6(OH),59Ω2 = 6.83 × 10⁻²⁰ cm2.
The Ω4 value is dependent on the 5D0 → 7F4 transition (emission peak at 705 nm). This parameter is related to the viscosity and rigidity of the matrix. In Fig. 11, Ω4 experiences a small increase with an increasing Eu3+ concentration. The values obtained range from 2.3(2) to 2.7(3) × 10−20 cm2. Ω6 was not calculated as the very weak emission arising from the 5D0 → 7F6 transition is out of the measurement range of our device.
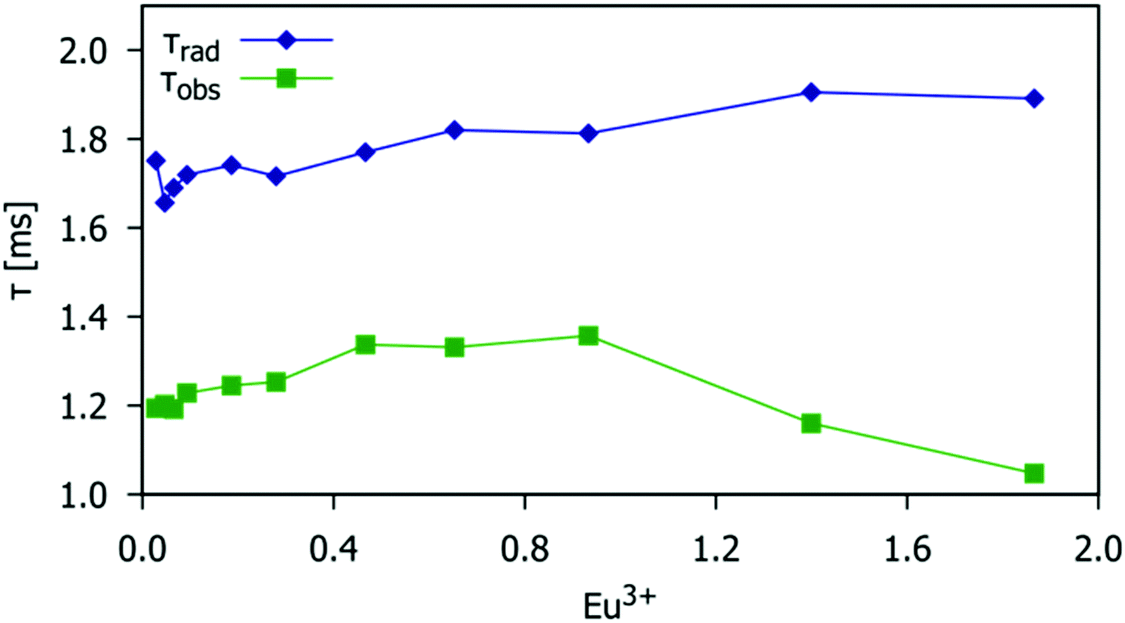
The observed lifetimes, τobs, were measured following the procedure described in the Experimental section. The natural radiative lifetimes, τrad, were calculated from the total spontaneous emission rate constant, τobs−1. Fig. 12 shows a comparison of the lifetime values as a function of the Eu3+ doping level. The difference in value between radiative and observed lifetimes represents the non-radiative lifetime, τobs−1 = τrad−1 + τnrad−1. The value of radiative lifetime slightly increases with the increase in Eu3+ doping concentration, Fig. 11 (blue symbols) due to small variations in symmetry around Eu3+ which is consistent with the previous discussion of the Ω2 value change with Eu3+ doping concentration (Fig. 10). However, the increase in Eu3+ concentration causes an increase in the non-radiative rate (i.e. the decrease in the non-radiative lifetime, τnrad) due to the energy migration between Eu3+. This effect becomes pronounced for Eu3+ concentrations larger than the critical concentration (x = 0.93) when the average distance between activator ions is small enough for the dipole–dipole mechanism to become significant. Then, the observed lifetime, Fig. 11 (red symbols) starts to decrease. The results of JO calculations are thus consistent with the analysis of the temperature-induced emission quenching discussed in Section 3.4.
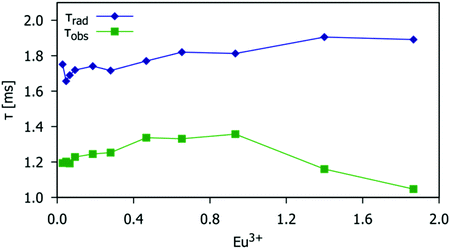 |
| | Fig. 12 The radiative and experimentally observed lifetimes (blue and green data points respectively) as a function of the Eu3+ doping level for the Gd9.33−xEux(SiO4)6O2 phosphors (0.03 < x < 1.87). | |
The intrinsic quantum efficiency of Eu3+ emission, η, was calculated (see the ESI,† Section S1 for details of calculation) for the different Eu3+ doping concentrations as given in Table 2. The highest intrinsic emission efficiency of 75% is found for x = 0.93, in agreement with the threshold for concentration quenching (note that JO theory may overestimate the value of quantum yield, but by no more than 10%60). The values listed in Table 2 are comparable to those reported in the literature for other apatite-type materials, e.g. η = 63% for Ca9.9Eu0.1(PO4)6(OH)2,61η = 62% for Ca9.85Eu0.1(PO4)6F2,62 and η = 66% for Ca9.95Eu0.05(PO4)6(OH)2.58
Table 2 Intrinsic efficiency of emission, η, for the Gd9.33−xEux(SiO4)6O2 phosphors
|
x
|
0.03 |
0.05 |
0.07 |
0.09 |
0.19 |
0.28 |
0.47 |
0.65 |
0.93 |
1.4 |
1.87 |
|
η (%) |
68 |
73 |
71 |
71 |
72 |
73 |
75 |
73 |
75 |
61 |
55 |
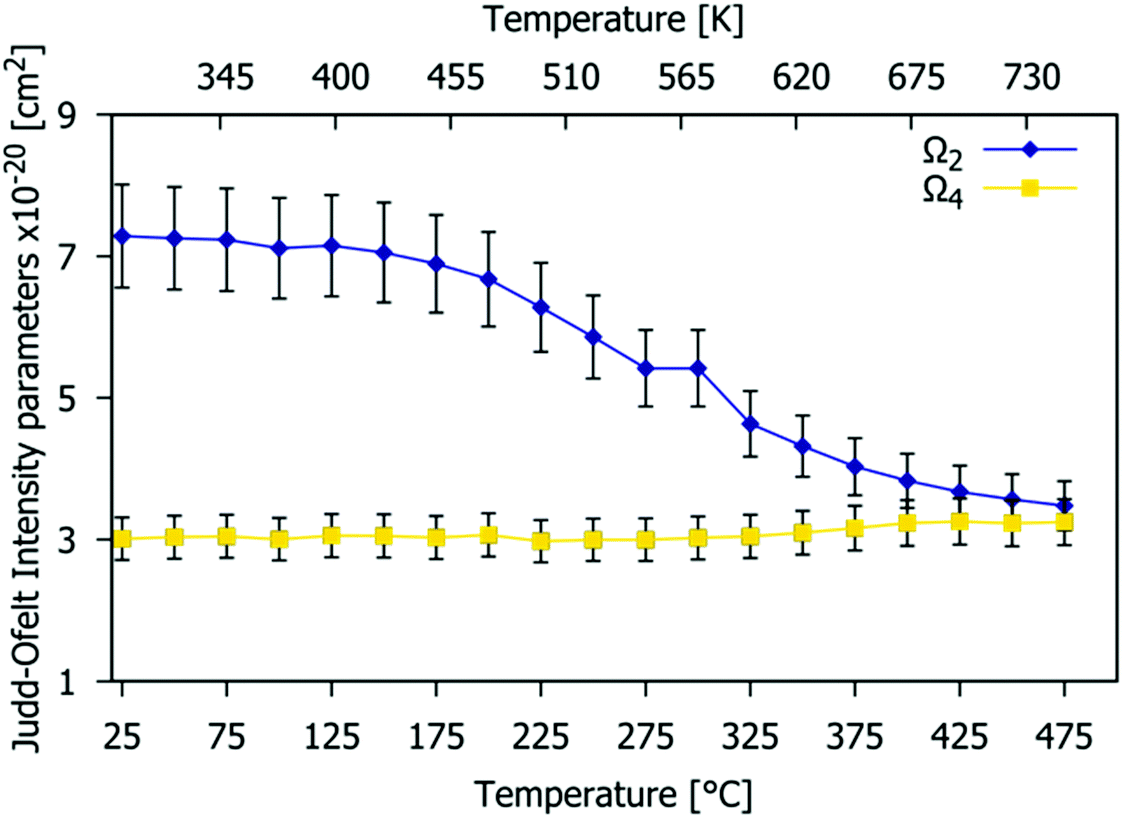
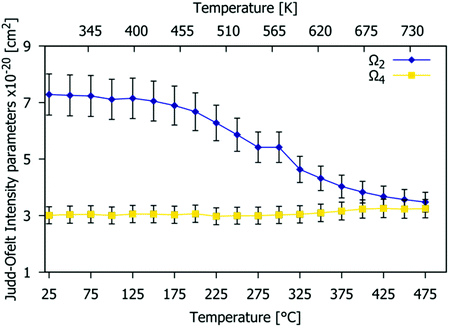
Fig. 13 shows the temperature dependence of the JO Ω2 and Ω4 parameters (the limitation of the calculation is the assumption that the refractive index is independent of temperature).63 Values were obtained for each temperature in 25 °C steps from 25 °C to 475 °C (see Table S5, ESI† for numerical values). The Ω2 value remains almost constant up to 150 °C but then decreases rapidly with temperature. This increase of local symmetry is related to the higher disorder presented for the structure at high temperature, with the Eu3+ coordination polyhedra becoming more regular, and perhaps due to a reduction in covalency. The Ω4 parameter stays constant because the Gd9.05Eu0.28(SiO4)6O2 structure is quite rigid and thermally stable (as confirmed by VT-PXRD), as expected for the apatite structure, and justifying the choice of this material as a phosphor host.
 |
| | Fig. 13 Temperature-dependence of the Ω2 and Ω4 Judd–Ofelt intensity parameters estimated from the emission spectra of the Gd9.05Eu0.28(SiO4)6O2 phosphor at different temperatures. | |
4. Conclusions
A new Gd9.33−xEux(SiO4)6O2 (0.03 < x < 1.87) phosphor series based on apatite-type silicate host shows narrow-band red emission centred at 614 nm, with exceptionally high colour purity of 94.2%. The structure of the host, together with the reduction in the covalent character of the interaction of Eu3+ with the counterions with increasing temperature, confer excellent optothermal stability on this phosphor: the emission intensity is reduced by only 10% at 150 °C compared to room temperature. Thermal quenching of emission was modelled using the charge-transfer model, and the activation energy of the thermal quenching process was found to be 0.54(1) eV. The highest quantum yield of about 75% is achieved with the relatively high doping level of 10% of Eu. Such high efficiency is a consequence of the highly asymmetric crystallographic sites where the Eu3+ ions are located and the large distance between them. The latter means that concentration quenching does not occur significantly until relatively high dopant concentrations are reached (>10% of Eu), beyond which electric dipole–dipole energy transfer between Eu3+ starts to compete with the radiative transition.
Conflicts of interest
There are no conflicts to declare.
Acknowledgements
Melissa M. Rodríguez-García (scholarship holder no. 607462) gratefully acknowledges the support of the Mexican Secretary of Energy that has been made thanks to CONACYT, financial support of SENER-CONACYT through the scholarship no. 447874. Authors from Serbia acknowledge support from the Ministry of Education, Science and Technological Development of the Republic of Serbia.
References
- K. Singh, M. Rajendran, R. Devi and S. Vaidyanathan, Dalton Trans., 2021, 50, 4986–5000 RSC.
- R. Devi, K. Singh and S. Vaidyanathan, J. Mater. Chem. C, 2020, 8, 8643–8653 RSC.
- M. Rajendran and S. Vaidyanathan, New J. Chem., 2020, 44, 14823–14836 RSC.
- R. Devi, R. Boddula, J. Tagare, A. B. Kajjam, K. Singh and S. Vaidyanathan, J. Mater. Chem. C, 2020, 8, 11715–11726 RSC.
-
J. Brodrick, Solid-state lighting R&D plan, US Department of Energy, 2016 Search PubMed.
- P. Morgan Pattison, M. Hansen and J. Y. Tsao, C. R. Phys., 2018, 19, 134–145 CrossRef CAS.
- J. Y. Tsao, M. E. Coltrin, M. H. Crawford and J. A. Simmons, Proc. IEEE, 2010, 98, 1162–1179 Search PubMed.
- J. M. Phillips, M. E. Coltrin, M. H. Crawford, A. J. Fischer, M. R. Krames, R. Mueller-Mach, G. O. Mueller, Y. Ohno, L. E. S. Rohwer, J. A. Simmons and J. Y. Tsao, Laser Photonics Rev., 2007, 1, 307–333 CrossRef CAS.
- K. Binnemans, Coord. Chem. Rev., 2015, 295, 1–45 CrossRef CAS.
-
C. Görller-Walrand and K. Binnemans, in Handbook on the Physics and Chemistry of Rare Earths, Elsevier, 1998, vol. 25, pp. 101–264 Search PubMed.
- F. Baur and T. Jüstel, Opt. Mater.: X, 2019, 1, 100015 CAS.
- X. He, D. Bian, H. Wang and J. Xu, Luminescence, 2013, 28, 973–976 CrossRef CAS PubMed.
- X. Zhang, L. Zhou, Q. Pang, J. Shi and M. Gong, J. Phys. Chem. C, 2014, 118, 7591–7598 CrossRef CAS.
- Y. C. Li, Y. H. Chang, B. S. Tsai, Y. C. Chen and Y. F. Lin, J. Alloys Compd., 2006, 416, 199–205 CrossRef CAS.
- J. Ding, Y. Li, Q. Wu, Q. Long, C. Wang and Y. Wang, J. Mater. Chem. C, 2015, 3, 8542–8549 RSC.
- X. Ma, L. Liao, Q. Guo, H. Liu, T. Zhou and L. Mei, RSC Adv., 2018, 8, 27332–27341 RSC.
- N. Guo, Q. Liang, S. Li, R. Ouyang and W. Lü, Opt. Mater., 2017, 73, 570–576 CrossRef CAS.
- Y. Liu, Z. Wang, J. Zhong, F. Pan, H. Liang and Z. Xiao, Mater. Lett., 2014, 129, 130–133 CrossRef CAS.
- H.-S. Roh, S. Lee, S. Caliskan, C. Yoon and J.-K. Lee, J. Alloys Compd., 2019, 772, 573–578 CrossRef CAS.
- L. Li, W. Chang, W. Chen, Z. Feng, C. Zhao, P. Jiang, Y. Wang, X. Zhou and A. Suchocki, Ceram. Int., 2017, 43, 2720–2729 CrossRef CAS.
- Z. Fu, X. Wang, Y. Yang, Z. Wu, D. Duan and X. Fu, Dalton Trans., 2014, 43, 2819–2827 RSC.
- L. Shi, S.-w. Zhao, Z. Ying, Y.-j. Han, M. Li, M.-y. Zhang and Z.-w. Zhang, J. Mater. Sci.: Mater. Electron., 2019, 30, 1803–1812 CrossRef CAS.
- P. Zhu, H. Zhu, W. Qin, B. H. Dantas, W. Sun, C.-K. Tan and N. Tansu, J. Appl. Phys., 2016, 119, 124305 CrossRef.
- A. M. Latshaw, K. D. Hughey, M. D. Smith, J. Yeon and H.-C. zur Loye, Inorg. Chem., 2015, 54, 876–884 CrossRef CAS PubMed.
- M. M. Rodríguez-García, J. A. G. Williams and I. R. Evans, J. Mater. Chem. C, 2019, 7, 7779–7787 RSC.
- S. Cui and G. Chen, Mater. Res. Express, 2019, 6, 096201 CrossRef CAS.
- A. S. de Oliveira, B. H. S. T. da Silva, M. S. Góes, A. Cuin, H. de Souza, L. F. C. de Oliveira, G. P. de Souza, M. A. Schiavon and J. L. Ferrari, J. Lumin., 2020, 227, 117500 CrossRef CAS.
- S. Li, M. Xu, L. Wang, D. Jia, N. Guo, C. Ji and H. Wu, Opt. Mater., 2020, 107, 110151 CrossRef CAS.
- N. Liu, L. Mei, L. Liao, J. Fu and D. Yang, Sci. Rep., 2019, 9, 15509 CrossRef PubMed.
- K. Nie, X. Ma, P. Lin, N. Kumar, L. Wang and L. Mei, J. Rare Earths, 2020 DOI:10.1016/j.jre.2020.10.019.
- C. Zeng, Y. Hu, Z. Xia and H. Huang, RSC Adv., 2015, 5, 68099–68108 RSC.
- G. Zhu, Y. Shi, M. Mikami, Y. Shimomura and Y. Wang, Opt. Mater. Express, 2013, 3, 229–236 CrossRef CAS.
- AXS Bruker, 2000.
- H. M. Rietveld, J. Appl. Crystallogr., 1969, 2, 65 CrossRef CAS.
- A. A. Coelho, J. S. O. Evans, I. R. Evans, A. Kern and S. Parsons, Powder Diffr., 2011, 26, S22 CrossRef CAS.
- A. Ćirić, S. Stojadinović, M. Sekulić and M. D. Dramićanin, J. Lumin., 2019, 205, 351–356 CrossRef.
- P. Du, X. Huang and J. S. Yu, Chem. Eng. J., 2018, 337, 91–100 CrossRef CAS.
- P. Du and J. S. Yu, RSC Adv., 2015, 5, 60121–60127 RSC.
- P. Du and J. S. Yu, J. Mater. Sci., 2016, 51, 5427–5435 CrossRef CAS.
- J. Li, Q. Liang, Y. Cao, J. Yan, J. Zhou, Y. Xu, L. Dolgov, Y. Meng, J. Shi and M. Wu, ACS Appl. Mater. Interfaces, 2018, 10, 41479–41486 CrossRef CAS PubMed.
- Y.-L. Chen, J. Wang and G.-Q. Wang, Opt. Mater., 2020, 106, 110022 CrossRef CAS.
- M. Rajendran and S. Vaidyanathan, J. Alloys Compd., 2019, 789, 919–931 CrossRef CAS.
- G. Blasse, Philips Res. Rep., 1969, 24, 131–144 CAS.
- D. L. Dexter, J. Chem. Phys., 1953, 21, 836–850 CrossRef CAS.
- L. Van Uitert, J. Electrochem. Soc., 1967, 114, 1048 CrossRef CAS.
- F. Baur, F. Glocker and T. Jüstel, J. Mater. Chem. C, 2015, 3, 2054–2064 RSC.
- Ž. Antić, R. Krsmanović, M. Wojtowicz, E. Zych, B. Bártová and M. D. Dramićanin, Opt. Mater., 2010, 32, 1612–1617 CrossRef.
- M. Rajendran and S. Vaidyanathan, Dalton Trans., 2020, 49, 9239–9253 RSC.
- R. Englman and J. Jortner, J. Lumin., 1970, 1, 134–142 CrossRef.
- M. Janulevicius, J. Grigorjevaite, G. Merkininkaite, S. Sakirzanovas and A. Katelnikovas, J. Lumin., 2016, 179, 35–39 CrossRef CAS.
- B. R. Judd, Phys. Rev., 1962, 127, 750–761 CrossRef CAS.
- G. S. Ofelt, J. Chem. Phys., 1962, 37, 511–520 CrossRef CAS.
- M. G. Brik, A. Zcaron, M. Eljka, K. Vukovic and M. D. Dramicanin, Mater. Trans., 2015, 56, 1416–1418 CrossRef CAS.
-
S. S. Batsanov, E. D. Ruchkin and I. A. Poroshina, Refractive Indices of Solids, Springer, 2016, pp. 51–56 Search PubMed.
- F. Auzel, J. Alloys Compd., 2004, 380, 9–14 CrossRef CAS.
- P. Sobierajska and R. J. Wiglusz, New J. Chem., 2019, 43, 14908–14916 RSC.
- T. Jansen, T. Justel, M. Kirm, H. Magi, V. Nagirnyi, E. Toldsepp, S. Vielhauer, N. M. Khaidukov and V. N. Makhov, J. Lumin., 2017, 186, 205–211 CrossRef CAS.
- K. Szyszka, J. Rewak-Soroczynska, A. Dorotkiewicz-Jach, K. A. Ledwa, A. Piecuch, M. Giersig, Z. Drulis-Kawa and R. J. Wiglusz, J. Inorg. Biochem., 2020, 203, 110884 CrossRef CAS PubMed.
- K. Zawisza and R. J. Wiglusz, Dalton Trans., 2017, 46, 3265–3275 RSC.
- R. Rolli, K. Gatterer, M. Wachtler, M. Bettinelli, A. Speghini and D. Ajo, Spectrochim. Acta, Part A, 2001, 57, 2009–2017 CrossRef CAS.
- R. J. Wiglusz, A. Bednarkiewicz, A. Lukowiak and W. Strek, Spectrosc. Lett., 2010, 43, 333–342 CrossRef CAS.
- P. Sobierajska, R. Pazik, K. Zawisza, G. Renaudin, J.-M. Nedelec and R. J. Wiglusz, CrystEngComm, 2016, 18, 3447–3455 RSC.
- A. Ćirić, S. Stojadinović and M. D. Dramićanin, Phys. B, 2020, 579, 411891 CrossRef.
Footnote |
| † Electronic supplementary information (ESI) available. See DOI: 10.1039/d1tc01330k |
|
| This journal is © The Royal Society of Chemistry 2021 |
Click here to see how this site uses Cookies. View our privacy policy here. 
 Open Access Article
 This Open Access Article is licensed under a Creative Commons Attribution-Non Commercial 3.0 Unported Licence
 a,
Aleksandar
Ciric
a,
Aleksandar
Ciric