 Open Access Article
Creative Commons Attribution 3.0 Unported Licence
Tailoring the nonlinear absorption of fluorescent dyes by substitution at a boron center†
Borys
Ośmiałowski
 *a,
Elizaveta F.
Petrusevich
b,
Katarzyna C.
Nawrot
 c,
Bartłomiej K.
Paszkiewicz
d,
Marcin
Nyk
 c,
Judyta
Zielak
 a,
Beata
Jȩdrzejewska
 e,
Josep M.
Luis
 f,
Denis
Jacquemin
 *g and
Robert
Zaleśny
 *b
*b
aFaculty of Chemistry, Nicolaus Copernicus University, Gagarina 7, PL-87100 Toruń, Poland. E-mail: Borys.Osmialowski@umk.pl
bDepartment of Physical and Quantum Chemistry, Faculty of Chemistry, Wrocław University of Technology, Wyb. Wyspiańskiego 27, PL-50370 Wrocław, Poland. E-mail: Robert.Zalesny@pwr.edu.pl
cAdvanced Materials Engineering and Modelling Group, Faculty of Chemistry, Wrocław University of Science and Technology, Wyb. Wyspiańskiego 27, PL-50370 Wrocław, Poland
dFaculty of Microsystem Electronics and Photonics, Wrocław University of Science and Technology, Wyb. Wyspiańskiego 27, PL-50370 Wrocław, Poland
eFaculty of Chemical Technology and Engineering, UTP University of Science and Technology, Seminaryjna 3, PL-85326 Bydgoszcz, Poland
fInstitute of Computational Chemistry and Catalysis and Department of Chemistry, University of Girona, Campus de Montilivi, 17003 Girona, Catalonia, Spain
gUniversité de Nantes, CNRS, CEISAM UMR 6230, F-44000 Nantes, France. E-mail: Denis.Jacquemin@univ-nantes.fr
First published on 12th April 2021
Abstract
The tuning of the spectroscopic signatures of boron-carrying fluorescent dyes is achieved by subtle chemical modifications. In more detail, we propose a new series of compounds incorporating up to three electron-donating moieties around the central accepting core, using various positions for the donating moieties, including the central boron atom. For all dyes, a thorough experimental and computational investigation of the absorption and emission properties is presented, with specific emphasis on two-photon absorption. Our key finding is that the two-photon absorption cross section, a property vital for bioimaging applications, can be tuned to a large extent (eightfold increase) by changing the topology of the molecule and using an optimal substitution pattern, while mainly conserving the position of the absorption/emission band and fluorescence quantum yield. In addition, these dyes combine significant values of two-photon absorption cross sections (exceeding 500 GM) to significant fluorescence quantum yields – a beneficial feature for several applications.
1 Introduction
Emissive molecules have found applications in numerous fields including biolabeling,1 molecular sensors,2,3 and light emitting devices.4 To this end, the optimization of the molecular structures is required to tailor the photophysical properties according to the needs of specific applications. Several fundamental properties of dyes can be relatively easily controlled: the position of both absorption and emission maxima, the molar attenuation coefficient (ε), and the affinity of dyes to other molecules. In contrast, some other features such as the fluorescence quantum yield (Φ) and the two-photon absorption (2PA) cross-sections (σ(2)) are typically more difficult to predict based on chemical intuition. This is due to the complicated mechanisms related to the non-radiative processes for the former and to the inherent non-linear character of the latter. There are nevertheless some general methods to improve these two properties. For instance, one of the methods used for improving the fluorescence quantum yield is to increase the rigidity of the molecular skeleton. For instance, our group has demonstrated the attractiveness of this approach for a series of BF2-carrying heterocycles by comparing phenantridines, quinolines, and isoquinolines.5–7 The effect of the benzannulation manifested itself by a redshift of the emission band and a smaller Stokes shift while preserving the quantum yield.In parallel to a high brightness (Φ × ε), the shift of absorption towards the red part of the spectrum is often needed for application of dyes in biolabeling. This is also a pivotal feature in the case of 2PA-based bioimaging, since the useful first biological window is located at ca. 650–1100 nm,8,9 meaning that one-photon absorption should be in the 325–550 nm domain. The two easiest strategies to redshift both absorption and emission are to extend the π-conjugation path by introducing aromatic or ethynyl/ethenyl spacers, and by building push–pull structures. The former approach was shown to be successful for BODIPY dyes, for which the extensive tuning of π-conjugation by the addition of various aromatic groups impacts not only the absorption and emission maxima, but also the Φ values.10 Indeed, this approach typically decreases the fluorescence quantum yield due to the increased flexibility that yields more efficient non-radiative pathways. The second approach to shift the optical spectra is to use groups of opposite accepting/donating character separated by a conjugated spacer, which means building a donor–acceptor architecture (DA-type molecules). This approach indeed allows creating an intramolecular charge-transfer (CT) transition.
It is indeed globally accepted that the presence of CT transition(s) is required to reach reasonably large values of 2PA cross section.11 Compounds of various topologies have been designed following this strategy, and it is well recognised that the dipolar or quadrupolar character of the molecule has a great impact on its 2PA behavior. Notably, the 2PA responses of the DA-type BODIPYs have been studied several times12–15 and their cross-sections were determined using fluorescencence properties,12,13 which is reliable owing to BODIPY's large fluorescence quantum yield. However, for maximizing the 2PA, the application of π-extended symmetric DAD-like (donor–acceptor–donor) compounds has been very successful.16–21 In the case of molecules with the DAD-type pattern, the angle between the lateral D and central A moieties does influence the 2PA response, highlighting that the relative orientation of the dipoles is a key factor.16 To sum up, the number and relative arrangements of the donors and acceptors as well as the length of the conjugation path are important factors that can be changed in order to obtain desirable properties, but obtaining a good compromise remains a challenge.22,23
Although for fluoroborates the above described strategies for optimizing 2PA have been mainly applied by tuning the electron-donating groups and the π-conjugated segment, adding substituents to the boron atom, that acts as a Lewis acid, may be an alternative appealing approach. Indeed, the Lewis acidity of the boron atom can be controlled,24,25 thus making the accepting properties of the B-carrying ring tunable. The Lewis acidity tuning may be achieved by directly adding suitable substituents to the boron (BR2 as, for example, BF2vs B(OMe)2) or by changing the R group in the B(-spacer-R)2 architecture.26,27 For BODIPY dyes, such boron-functionalization is well-known and was achieved using a variety of methods, e.g., (i) reaction of BF2-group with AlCl3 and methanol;28 (ii) reaction of BF2 with AlCl329 (or BCl3) and next N-nucleophiles30 or O-nucleophiles;31 and (iii) reaction with carbon-based nucleophiles.32 All these modifications led to changes in the optical properties of the dyes. For instance, the BODIPY dye displayed on the left in Fig. 1 absorbs and emits at 526 and 550 nm, respectively, whereas for the mono-substituted (BFOR) and di-substituted (B(OR)2) derivatives, the fluorescence maximum shifts to 546 and 540 nm, respectively.31 In contrast, the absorption is unaffected by the changes between BFOR and B(OR)2, allowing a fine control of the Stokes shift. Similar results have been obtained for BODIPYs substituted at boron with other nucleophiles.30 In addition, we underline that introducing new chemical functions at the boron atom also allows controlling both solubility33,34 and self-organization.35,36
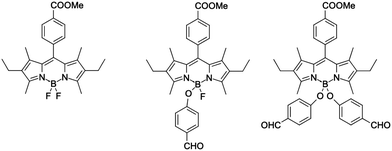 | ||
| Fig. 1 BODIPY dyes substituted at boron atom.31 | ||
Putting together all these findings, it can be straightforwardly concluded that the DAD-type dyes with a boron center located in the middle of the conjugation path (see, for instance, the dyes displayed in Fig. 2) should develop properties that can be tuned by subtle changes in close proximity of (or at) the boron.37,38 This approach may lead simultaneously to high fluorescence quantum yields, large Stokes shift, and sizeable values of the 2PA cross section. In addition, as illustrated in Fig. 2 one can go from the DAD pattern (MeO/NMe2) to an AAD architecture by changing one group only (O2N/NMe2), which offers another hand to control the optical signatures. This variation of the electron density distribution was already successfully used in benzothiazoles bearing a BF2 group,38 as well as in regular BODIPYs.39
 | ||
| Fig. 2 The DAD- and AAD-type structures carrying the BF2 group and exhibiting 2PA tuned by substituents.37 | ||
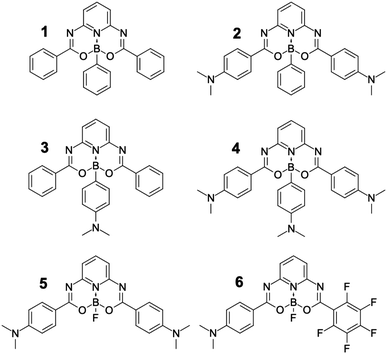
The fine tuning of the spectroscopic characteristics of the dye is the main motivation of the present study. We prepared and characterized new dyes showing modifications of the central part of a DAD-type system, allowing us to assess the impact of charge-transfer by tuning Lewis-acidity at the boron atom (Fig. 3). These molecules have been designed to obtain one, two, or three donor–acceptor sites in the same molecule. Additionally for comparison purposes, one parent molecule without electron-donating moieties and one dye of dipolar character have been synthesized as well. The modification at the boron atom leads to structures that present the substituent at the boron atom almost perpendicular to the π-conjugation plane. Recently, such axial substitution was used to develop lanthanum phtalocyanines exhibiting excellent non-linear properties.40 A similar approach was used41 in boron-carrying salicylic aldehyde derivatives and in boron subphtalocyanines.42–45 We note that the orthogonality may be essential to control the 2PA parameters.46 The aims of the current study are: (i) to characterise the absorption and emission properties of the six fluorophores exhibiting various charge-transfer strengths and orientations; (ii) to appraise the influence of distant substituents on the photophysical properties by modifying the Lewis acidity of the boron atom; (iii) to study the 2PA properties of these molecules and assess the usefulness of the modification of the boron electronic properties in fine-tuning the photophysical properties; and (iv) to investigate the influence of flexible NMe2 group(s) placed at various positions on fluorescence quantum yield.
2 Results and discussion
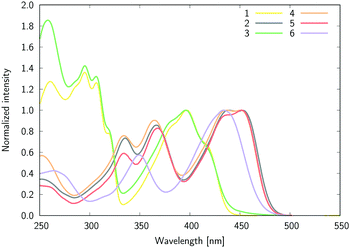
Let us start this section by discussing the structural features of the six dyes. The equilibrium geometries of compounds 1–6 in chloroform solution optimized at the DFT level show, as expected, a perpendicular arrangement with the angles between the B-Ph phenyl plane and the plane formed by the oxygen atoms and pyridine nitrogen atom of 88.3°, 89.0°, 89.3° and 88.8° for 1, 2, 3, and 4, respectively. The crystal structures of compounds 1, 3, and 6 have been reported recently.47 The same angle attains values of 88.7° and 87.9° in 1 and 3, respectively. Considering the differences between the solid-state and the polar solvent environments, the DFT results are in very good agreement with the crystallographic data. To a large extent the B-Ph phenyl plane perpendicularity hampers the conjugation between the boron-attached substituent (Ph and −C6H4–NMe2 groups) and the major π-conjugated plane of the molecule. Therefore, the changes in the dye properties are induced by tuning the Lewis-acidity of the boron atom only, and not by the direct conjugation effect between the moieties.The experimental absorption spectra of all compounds recorded in CHCl3 are shown in Fig. 4 (ε(λ) [dm3 mol−1 cm−1] is shown in Fig. S1 in the ESI†). The first (S0 → S1) band, demonstrating a clear vibrational fine structure for most compounds, has a maximum located in the visible region close to 450 nm for 2, 4, 5, and 6 and at ca. 400 nm for 1 and 3 (Fig. 4), while the short wavelength band is at ca. 300 nm for 1 and 3 and 360–370 nm for the remaining derivatives. We underline that in 1 and 3 the blue-shifted band is ca. 40% more intense (higher ε) than its visible counterpart, whereas for the other four derivatives the second band has a slightly lower intensity than the first one.
The high similarity between the absorption spectra of 1 and 3 indicates that the boron functionalization does not influence the excitation from the ground to the excited states, as it only leads to a trifling bathochromic shift of the long-wavelength band for 1vs3 (2 nm). This outcome is found in all solvents (vide infra, Table 1), and is observed as well when comparing the spectra of 2 and 4.
| MCH | CHCl3 | THF | ACN | |
|---|---|---|---|---|
| a A similar redshift in fluorescence was observed in non-polar toluene with clearly visible two bands in fluorescence and larger intensity of the red-shifted band. | ||||
| 1/λabs | 398 | 397 | 398 | 394 |
| ε | 17![[thin space (1/6-em)]](https://www.rsc.org/images/entities/char_2009.gif) 400 400 |
18![[thin space (1/6-em)]](https://www.rsc.org/images/entities/char_2009.gif) 600 600 |
20![[thin space (1/6-em)]](https://www.rsc.org/images/entities/char_2009.gif) 200 200 |
20![[thin space (1/6-em)]](https://www.rsc.org/images/entities/char_2009.gif) 600 600 |
| λ flu | 465 | 466 | 466 | 463 |
| Δ SS | 3620 | 3730 | 3666 | 3782 |
| Φ | 0.210 | 0.186 | 0.184 | 0.171 |
| 2/λabs | 427.5 | 439 | 453 | 447 |
| ε | — | 46![[thin space (1/6-em)]](https://www.rsc.org/images/entities/char_2009.gif) 200 200 |
43![[thin space (1/6-em)]](https://www.rsc.org/images/entities/char_2009.gif) 600 600 |
48![[thin space (1/6-em)]](https://www.rsc.org/images/entities/char_2009.gif) 700 700 |
| λ flu | 467 | 485 | 485 | 508 |
| Δ SS | 1979 | 2160 | 1456 | 2686 |
| Φ | 0.414 | 0.446 | 0.476 | 0.278 |
| 3/λabs | 386.5 | 395 | 396 | 393 |
| ε | 16![[thin space (1/6-em)]](https://www.rsc.org/images/entities/char_2009.gif) 600 600 |
16![[thin space (1/6-em)]](https://www.rsc.org/images/entities/char_2009.gif) 300 300 |
21![[thin space (1/6-em)]](https://www.rsc.org/images/entities/char_2009.gif) 800 800 |
17![[thin space (1/6-em)]](https://www.rsc.org/images/entities/char_2009.gif) 000 000 |
| λ flu | 509 | 467 | 467 | 463 |
| Δ SS | 6227 | 3903 | 3839 | 3847 |
| Φ | 0.045 | 0.015 | 0.006 | 0.004 |
| 4/λabs | 425 | 437 | 433 | 446 |
| ε | — | 43![[thin space (1/6-em)]](https://www.rsc.org/images/entities/char_2009.gif) 200 200 |
48![[thin space (1/6-em)]](https://www.rsc.org/images/entities/char_2009.gif) 300 300 |
32![[thin space (1/6-em)]](https://www.rsc.org/images/entities/char_2009.gif) 400 400 |
| λ flu | 463 | 489 | 481 | 499 |
| Δ SS | 1931 | 2433 | 2305 | 2281 |
| Φ | 0.432 | 0.106 | 0.018 | 0.011 |
| 5/λabs | 422.5 | 452 | 450 | 449 |
| ε | – | 47![[thin space (1/6-em)]](https://www.rsc.org/images/entities/char_2009.gif) 800 800 |
46![[thin space (1/6-em)]](https://www.rsc.org/images/entities/char_2009.gif) 800 800 |
38![[thin space (1/6-em)]](https://www.rsc.org/images/entities/char_2009.gif) 200 200 |
| λ flu | 459 | 484 | 482 | 510 |
| Δ SS | 1882 | 1463 | 1475 | 2644 |
| Φ | 0.439 | 0.385 | 0.511 | 0.089 |
| 6/λabs | 430 | 434 | 430 | 429.5 |
| ε | — | 40![[thin space (1/6-em)]](https://www.rsc.org/images/entities/char_2009.gif) 200 200 |
36![[thin space (1/6-em)]](https://www.rsc.org/images/entities/char_2009.gif) 400 400 |
39![[thin space (1/6-em)]](https://www.rsc.org/images/entities/char_2009.gif) 800 800 |
| λ flu | 459 | 525 | 480 | 480 |
| Δ SS | 1469 | 3994 | 2422 | 2450 |
| Φ | 0.319 | 0.041 | 0.002 | 0.001 |
The mirror-shape of the emission as compared to absorption (Fig. 5) hints at small geometric reorganizations after excitation. Nevertheless, by comparing the respective bands in CHCl3, one notices negligible variations between the absorption and emission spectra for 1, 3 and 6, but slightly different spectra for 2, 4 and 5 (compounds carrying lateral NMe2 groups). In the latter, the absorption spectrum clearly shows a vibronic structure in chloroform, with a separation of ca. 700 cm−1 between the peaks, while the fluorescence spectra display one sharp maximum with a shoulder red-shifted by 1010 cm−1.
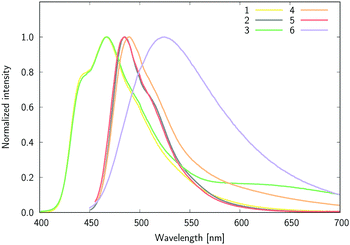 | ||
| Fig. 5 The normalized fluorescence for 1–6 in chloroform. Except 1 and 3, the spectra were recorded in the 450–700 nm range. | ||
To obtain more insights into the character of the electronic states involved in absorption and emission, four solvents of various dielectric constants have been used for spectroscopic measurements (Table 1). Significant changes in the position of the S0 → S1 absorption upon increase in polarity are observed for 2, 4, 5, and 6, whereas for both 1 and 3 almost no solvatochromism is noticeable, hinting at the lack of CT character in these two compounds, which is consistent with their molecular structure. In contrast, in 2, 4 and 5, positive solvatochromism is observed for both absorption and emission, indicative of a CT character. It is noteworthy that 3 could be considered as a CT dye as well due to the 1,4-substitution of the phenylene by a donor (NMe2) and an acceptor (boron), but it was recently shown47 that the putative 1,4-quinoid structure is absent in the phenylene in the ground state. Moreover, it was shown that the NMe2 group in 6 donates more electron density than the same group in 3 allowing to the formation of the 1,4-quinoidal structure.47 The attenuation coefficients (given in [dm3 mol−1 cm−1]) of the CT dyes 2, 4, 5, and 6 are in the 32![[thin space (1/6-em)]](https://www.rsc.org/images/entities/char_2009.gif) 000 and 48
000 and 48![[thin space (1/6-em)]](https://www.rsc.org/images/entities/char_2009.gif) 300 range (except for methylcyclohexane), whereas for 1 and 3 we measured values in the 16
300 range (except for methylcyclohexane), whereas for 1 and 3 we measured values in the 16![[thin space (1/6-em)]](https://www.rsc.org/images/entities/char_2009.gif) 600 to 21
600 to 21![[thin space (1/6-em)]](https://www.rsc.org/images/entities/char_2009.gif) 800 range. With possible bioimaging applications in mind, additional measurements were also performed for selected dyes in DMSO/water mixtures. The results, presented in the ESI† (Fig. S2–S7), demonstrate solubility and stability of dyes in DMSO/water mixtures.
800 range. With possible bioimaging applications in mind, additional measurements were also performed for selected dyes in DMSO/water mixtures. The results, presented in the ESI† (Fig. S2–S7), demonstrate solubility and stability of dyes in DMSO/water mixtures.
As stated above, a comparison of the data obtained for 1 and 3 indicates that the NMe2 group attached to the phenylene ring does not significantly impact the spectral properties (see Table 1). However, a comparison of the fluorescence quantum yields measured in the 1–4 series, demonstrates that the Φ value is higher in 2 than in 1 (by 0.26) and larger in 4 than in 3 (by 0.091). Therefore, adding the NMe2 group to the lateral parts of the conjugated DAD-type molecules improves the emission, likely because of the stiffening brought by contributions from the 1,4-quinoid-type structure. A similar effect was observed in other difluoroborates carrying conjugated electron-donating groups of similar efficacy.48 In contrast, the 3vs1 and 4vs2 comparisons show that the addition of the same NMe2 group on the aromatic ring attached to boron significantly decreases the fluorescence quantum yield (ΔΦ = −0.17 and ΔΦ = −0.34, respectively). This observation is, however, not fully preserved in methylcyclohexane, a non-polar solvent. Indeed, in this solvent, the fluorescence quantum yield for 4 slightly exceeds that of 2. The two brightest molecules in all solvents are 2 and 5. The introduction of phenyl instead of fluorine (2vs.5) seems to sterically protect the central part of the acceptor from interactions with surrounding solvent molecules yielding a three-fold increase in the fluorescence yield of 2 in acetonitrile. This steric hindrance may, on one hand, influence the efficiency of the non-radiative energy pathways originating from fluorophore–solvent interactions, and, on the other hand help in avoiding aggregation-induced quenching; both mechanisms contribute to larger Φ. The strength of the intermolecular interactions between a donor–acceptor-substituted dye in its electronic ground state and the environment usually increases with the polarity of the latter. This strength further increases in the excited states exhibiting an intramolecular charge transfer, as such dye typically undergoes an increase of its dipole moment after photon absorption. Therefore, the fluorescence quantum yield is usually reduced if the polarity of the solvent increases. Moreover, in very polar and protic environments, the protonation/deprotonation taking place between dye and solvent can also trigger non-radiative deactivation pathways.
| Compound | Wavelength [nm] | σ (2) [GM] | σ (2)/M [GM mol g−1] |
|---|---|---|---|
| 2 | 725 | 5.89 × 10² | 1.20 |
| 4 | 725 | 1.12 × 10³ | 2.10 |
| 5 | 725 | 6.51 × 10² | 1.51 |
| 6 | 800 | 1.37 × 10² | 0.29 |
Let us now discuss the electronic two-photon absorption spectra of compounds 1–6 (Table 2). Some of these structures might not exhibit significant two-photon absorption cross sections due to the lack of a clear push–pull nature; hence, we first performed the state-of-the-art electronic-structure calculations using coupled cluster theory to screen the properties prior to experimental measurements. Fig. 6 summarizes the CC2 results obtained for the three lowest-energy two-photon transitions. Note that these calculations correspond to molecules in CHCl3 solution. The key conclusion that can be drawn from the results shown in Fig. 6 is that compounds 1 and 3 show very low relative two-photon transition strengths, as compared to the other dyes. For this reason, we have not performed experimental measurements for these two compounds.
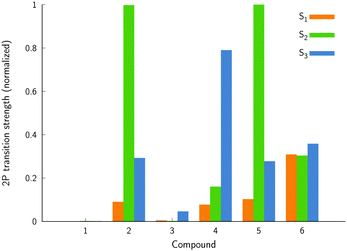 | ||
| Fig. 6 The normalized two-photon transition strengths for molecules in chloroform calculated using the coupled-cluster CC2 method. | ||
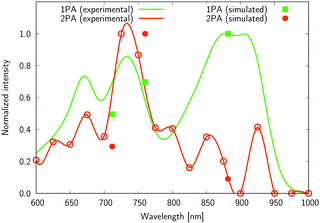
The experimental two-photon absorption spectra of compounds 2, 4, 5, and 6 measured using the Z-scan technique in CHCl3, are displayed in Fig. 7–10. These figures also contain wavelength-doubled one-photon absorption spectra for a direct comparison between one- and two-photon spectral features. In Fig. 7–10 we also show the results of CC2 calculations (indicated by points corresponding to one- and two-photon vertical excitations from the ground state to S1, S2, and S3). The theoretical wavelengths were red-shifted by 50 nm (in one-photon spectra) to match the experimental features and allow easier comparisons. This deviation is typical of the selected level of theory, e.g. using very accurate reference as CAS-PT2/TZVP, one obtains a mean average error for a large set of organic molecules of 0.27 eV for CC2/TZVP.49 The summary of electronic-structure calculations is shown in Table S1 in the ESI.†
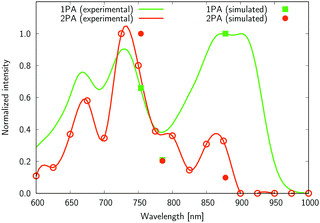 | ||
| Fig. 8 The normalized one- and two-photon absorption spectra of 4. See the caption of Fig. 7 for more details. | ||
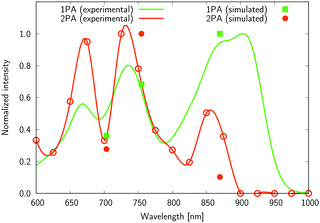 | ||
| Fig. 9 The normalized one- and two-photon absorption spectra of 5. See the caption of Fig. 7 for more details. | ||
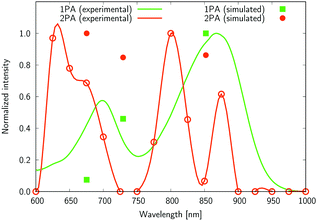 | ||
| Fig. 10 The normalized one- and two-photon absorption spectra of 6. See the caption of Fig. 7 for more details. | ||
Several interesting conclusions can be drawn from the analysis of Fig. 7–10. First, the S0 → S1 excitation does not yield the most intense two-photon response. The sole exception is compound 6 that present a 2PA spectrum showing two maxima of equal intensity. This specific results for 6 could have been crystal-balled. Indeed, relatively large values of two-photon absorption cross section for the S0 → S1 transition are typically obtained in DA-type chromophores. Second, 2 exhibits very similar ratios of two-photon intensities at 725 and 850 nm similar to 5. This highlights that replacing the fluorine atom bonded to the boron center by a –C6H5 moiety does not affect the nonlinear absorption spectra, at least in the 650–1100 nm range (first biological window). More quantitatively, the data listed in Table 1 demonstrate that the feature appearing at 725 nm in the experimental two-photon spectra of 2 and 5 corresponds to similar cross section values, i.e., 589 GM (2) and 651 GM (5). Third, aiming at increasing the two-photon absorption cross section value, it is highly beneficial to introduce a strong electron-donating moiety onto the boron atom (–C6H4–NMe2) – as shown by the results of Table 1, the σ(2) at 725 nm of 4 is roughly twice that of 2 or 5. Fourth, we highlight that, by and large, the relative band intensities in one- and two-photon absorption spectra are very well reproduced by the electronic-structure calculations based on the CC2 method. This satisfactory performance of the CC2 method gives confidence that an in-depth analysis of two-photon activity in terms of electronic-structure parameters can be performed using this approach. To this end, we have employed the generalized few-state model (GFSM)50 recently developed for electronic structure theories with a non-Hermitian structure.51 GFSM allows interpreting the two-photon transition strengths in terms of electronic structure parameters:
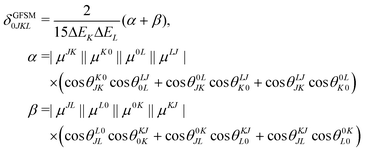 | (1) |
In eqn (1), the superscripts distinguish between the right (L0) and left (0L) moments, ΔEK =  , whereas the θRSPQ terms represent the angle between the transition dipole moment vectors μPQ and μRS. Although the summations in eqn (1) for K and L run over all the electronic states, any number of intermediate states K and L can be chosen to obtain an approximate value. Here, we use both two- (2SM) and three-state models (3SM, intermediate state taken from the S1–S5 manifold), in which K and L can be either the ground state 0, the final excited state J (two-state model), or an intermediate state (three-state-model). Table 3 summarises the results of the GFSM analysis performed using the CC2 data for the most intense features in the electronic two-photon absorption spectra of compounds 2, 4, 5, and 6. The labeling “key state” denotes an intermediate state that recovers at least 50% of the two-photon transition strength computed using response theory. The results shown in Table 3 deliver a complementary piece of information to that obtained from the measurement. First, it is confirmed that compounds 2 and 5 exhibit similar electronic structure patterns as far as 2PA intensity is concerned. In particular, one finds that in both 2 and 5 the two-photon S0 → S2 excitation is dominated, according to quantum-mechanical sum-over-state expression, by the product involving the |μ01|2·|μ12|2 transition moments. This indicates the importance of the intensity of the one-photon S0 → S1 transition in the S0 → S2 two-photon response. Hence, a possible route to further boost the two-photon S0 → S2 intensity could be accomplished by chemical modifications enhancing the one-photon S0 → S1 transition intensity. The same applies to two-photon S0 → S2 intensity of dye 4. However, there is a striking difference between compounds 2/5 and 4 in the case of two-photon S0 → S3 excitation, namely, for the former pair of compounds, the three-state model is insufficient to describe the two-photon S0 → S3 excitation, highlighting that contributions from high-lying excited states play a role, on the other hand, the two-photon S0 → S3 intensity of 4 is dominated by the product involving transition moments |μ01|2·|μ13|2. In the case of the asymmetric dipolar structure 6 the two-photon S0 → S1 intensity is, as expected, well described by the two-state model and the 0111 term makes the dominant contribution. This term involves the S0 → S1 transition moment and the dipole moment of the S1 excited state, typical of DA-type dyes. Nevertheless, the two-state model remains insufficient to describe the two-photon intensities to higher-lying states in that compound. Note that in the case of S0 → S2 intensity of 6, albeit the 0222 term is indicated as the largest one, the sum of symmetry related terms 0212 and 0221 prevails over the 0222 term.
| Compound | Transition | 2SM | 3SM | Key state | Dominant 0JKL term |
|---|---|---|---|---|---|
| 2 | S0 → S2 | NO | YES | S1 | 0211 |
| S0 → S3 | NO | NO | |||
| 4 | S0 → S2 | NO | YES | S1 | 0211 |
| S0 → S3 | NO | YES | S1 | 0311 | |
| 5 | S0 → S2 | NO | YES | S1 | 0211 |
| S0 → S3 | NO | NO | |||
| 6 | S0 → S1 | YES | 0111 | ||
| S0 → S2 | NO | YES | S1 | 0222 | |
| S0 → S3 | NO | YES | S1 | 0311 |
3 Experimental
3.1 Synthesis and structure confirmation
The structure of compounds 1, 3 and 5–6 has been already described,47 while compounds 2 and 4 are new structures obtained in the same way as 1 and 3. The only difference was the usage of the N,N-dimetylamino substituted substrate described in our previous publication.52 4-[(2Z,7Z)-7-[4-(Dimethylamino)phenyl]-5-phenyl-4,6-dioxa-2,8,13-triaza-5-borabicyclo[7.3.1]trideca-1(13),2,7,9,11-pentaen-3-yl]-N,N-dimethylaniline (2) orange solid, m.p. 246.5–248 °C. 1H NMR (DMSO from TMS) δ: 8.06 (t, 1H), 8.04 (d, 4H, J = 9.1 Hz), 7.13 (m, 5H), 7.01 (d, 4H, J = 8.0 Hz), 6.77 (d, 4H, J = 9.1 Hz), 3.03 (s, 12H). 13C δ: 165.33, 153.94, 150.53, 145.75, 131.19, 130.04, 128.09, 128.04, 118.80, 115.19, 111.52, 40.12. C29H28BN5O2 Calcd. C 71.17, H 5.77, N 14.31; found C 71.09, H 5.82, N 14.25. 4-[(2Z,7Z)-5,7-Bis[4-(dimethylamino)phenyl]-4,6-dioxa-2,8,13-triaza-5-borabicyclo[7.3.1]trideca-1(13),2,7,9,11-pentaen-3-yl]-N,N-dimethylaniline (4) orange-brown solid, m.p. 310 °C (dec.). 1H NMR (DMSO from TMS) δ: 8.04 (d, 4H, J = 9.2 Hz), 8.02 (t, 1H), 6.97 (d, 2H, J = 8.0 Hz), 6.95 (d, 2H, J = 8.9 Hz), 6.67 (d, 4H, J = 9.2 Hz), 6.48 (d, 2H, J = 8.9 Hz), 3.03 (s, 12H), 2.73 (s, 6H). 13C δ: 165.50, 153.87, 150.55, 131.15, 130.90, 119.13, 115.00, 112.37, 111.50, 40.13 (most quaternary carbons not visible in the spectra due to low solubility). C31H33BN6O2 caldc. C 69.93, H 6.25, N 15.78; found C 70.01, H 6.29, N 15.73. The NMR spectra are provided in the ESI† (Fig. S8–S11). The one-photon measurements were performed with the same equipment used in our previous works.533.2 Z-scan measurements
Chloroform solutions of 2, and 4–6 were prepared (0.2%) for the Z-scan measurement, while 1 and 3 were excluded due to their lack of CT features and insignificant values of computed two-photon transition strengths. Spectrally-resolved nonlinear optical properties have been studied with the open aperture and the closed aperture Z-scan techniques using the following laser system: a Quantronix Integra-C Ti:sapphire regenerative amplifier producing ∼130 fs, 800 nm pulses of 1 mJ energy per pulse with 1 kHz frequency and a Quantronix Palitra-FS optical parametric amplifier for wavelength tuning between 525 and 1100 nm. The Z-scan technique probes the changes in the signal from the laser beam as the sample is moved into and out of the region of the beam focus along the Z axis. The changes are monitored using three detectors: “open aperture” (OA) detector, “closed aperture” (CA) detector and reference detector. The first one measures the total power of the beam and thus indicates whether or not nonlinear absorption occurs. Only the central part of the beam is directed onto the CA detector; therefore, it allows to precisely detect changes in the geometry of the beam. The reference detector is set before the sample and the resulting signal is used to exclude any beam instabilities. To reduce data noise appearing in the traditional Z-scan technique we used a modified data acquisition system where the signal from the detectors is recorded by a data I/O acquisition card (National Instruments PCI-6143) with simultaneous sampling synchronized with the laser. Fig. S12–S15 in the ESI,† show representative open aperture and close aperture Z-scan measurement results at the maxima of nonlinear absorption, which were detected at 725 nm (2), 725 nm (4), 725 nm (5) and 800 nm (6), respectively, for the subsequent samples. In order to exclude the impact of molar mass on the results, we calculated a molar mass normalized merit factor σ(2)/M which, in fact, confirmed the ranking of the dyes as a function of their 2PA ability.3.3 Computational methods
The ground state geometry optimization of structures 1–6 was performed at the CAM-B3LYP/cc-pVDZ level of theory54,55 in a chloroform solvent modelled using the IEF-PCM method. The minima on the potential energy hypersurface were confirmed by evaluation of the Hessian at the same level. These calculations were performed using the GAUSSIAN 16 program.56Molecular dynamics simulations were carried out for the rigid geometry of each dye in a cubic chloroform box of edge 50 Å using NAMD57 combined with the CHARMM force field58 and the chloroform force field of Dietz and Heinzinger.59,60 The system was minimized for 10![[thin space (1/6-em)]](https://www.rsc.org/images/entities/char_2009.gif) 000 steps followed by constant temperature NVT dynamics for 2 ns (1 step = 2 fs) at 300 K using a Langevin thermostat, periodic boundary conditions were applied. From the resulting trajectory, 50 snapshots were taken for further electronic-structure calculations.
000 steps followed by constant temperature NVT dynamics for 2 ns (1 step = 2 fs) at 300 K using a Langevin thermostat, periodic boundary conditions were applied. From the resulting trajectory, 50 snapshots were taken for further electronic-structure calculations.
Based on the results of the MD simulations, electronic-structure calculations were carried out using the resolution-of-identity coupled-cluster CC2 model61 with the cc-pVDZ basis set55 and the corresponding optimized auxiliary basis set.62,63 In a study on 2PA of organoboron complexes it was showed that the differences between the two-photon transition strengths calculated at the RI-CC2/cc-pVDZ and RI-CC2/aug-cc-pVDZ levels do not exceed 5%.51 The electrostatic embedding was used to account for the discrete solvent representation. These CC2 calculations were carried out with the TURBOMOLE V.7.3 program.64 The results of electronic-structure calculations discussed in the body of manuscript were obtained for a single snapshot, selected to show the smallest deviation from the average S0 → S1 excitation energy.
4 Conclusions
In this work, combining the results of experimental and theoretical investigations, we tuned the spectroscopic signatures of new fluorescent dyes by chemical substitution. To this end, starting with a Λ-shaped parent dye, a new series of derivatives have been designed to obtain one, two, or three donor–acceptor sites in the same molecule. The position of the NMe2 group was found to be the key factor in the fine control of the position of the absorption and emission bands, the significant modification of the fluorescence quantum yield, and the strong variation of the amplitude of two-photon absorption cross-section. We underline that the two-photon absorption cross section can be boosted by substitution at the boron atom in the central moiety despite the insignificant conjugation of the substituent at this position. In other words, one can tune separately one- and two-photon optical signatures.Importantly, these dyes, which have significant values of two-photon absorption cross sections (exceeding 500 GM for DAD-type dyes), preserve large fluorescence quantum yields in most of the solvents used. In contrast to the typical asymmetric DA-type architecture, the symmetrically substituted dyes exhibit the largest two-photon absorption cross sections for transitions to electronic excited states above S1 (either S2 or S3), albeit still in the biological window. In short, this work clearly demonstrates that modifications at a boron center with appropriately chosen substituents can be an effective strategy for enhancing two-photon absorption properties while conserving the other properties so that they remain almost unaffected.
Conflicts of interest
There are no conflicts to declare.Acknowledgements
R. Z., M. N., D. J., B. J. and B. O. acknowledge the financial support from the National Science Centre Poland (Grant No. 2017/26/M/ST5/00327). K. N. acknowledges the support from the National Science Centre Poland under Grant no. 2018/29/B/ST4/02172. J. M. L. is grateful for the financial support from the Spanish MICIN PGC2018-098212-B-C22 and the Catalan DIUE 2017SGR39. The Wroclaw and French teams are indebted to the CNRS for supporting their collaborations in the framework of the ABSOLUTA IEA project. The authors gratefully acknowledge Wroclaw Centre for Networking and Supercomputing as well as the CCIPL center installed in Nantes (France) for the generous allotment of computer time.References
- K. M. Dean and A. E. Palmer, Nat. Chem. Biol., 2014, 10, 512–523 CrossRef CAS PubMed.
- D. Wu, A. C. Sedgwick, T. Gunnlaugsson, E. U. Akkaya, J. Yoon and T. D. James, Chem. Soc. Rev., 2017, 46, 7105–7123 RSC.
- B. Valeur and I. Leray, Coord. Chem. Rev., 2000, 205, 3–40 CrossRef CAS.
- L. Wang, L. Xiao, H. Gu and H. Sun, Adv. Opt. Mater., 2019, 7, 1801154 CrossRef.
- A. Zakrzewska, R. Zaleśny, E. Kolehmainen, B. Ośmiałowski, B. Jȩdrzejewska, H. Ågren and M. Pietrzak, Dyes Pigm., 2013, 99, 957–965 CrossRef CAS.
- B. Ośmiałowski, A. Zakrzewska, B. Jȩdrzejewska, A. Grabarz, R. Zaleśny, W. Bartkowiak and E. Kolehmainen, J. Org. Chem., 2015, 80, 2072–2080 CrossRef PubMed.
- A. M. Grabarz, B. Jȩdrzejewska, A. Zakrzewska, R. Zaleśny, A. D. Laurent, D. Jacquemin and B. Ośmiałowski, J. Org. Chem., 2017, 82, 1529–1537 CrossRef CAS PubMed.
- R. Weissleder, Nat. Biotechnol., 2001, 19, 316–317 CrossRef CAS PubMed.
- K. Podgorski, E. Terpetschnig, O. P. Klochko, O. M. Obukhova and K. Haas, PLoS One, 2012, 7, 1–7 CrossRef PubMed.
- S. Xu, R. E. Evans, T. Liu, G. Zhang, J. N. Demas, C. O. Trindle and C. L. Fraser, Inorg. Chem., 2013, 52, 3597–3610 CrossRef CAS PubMed.
- C. Katan, F. Terenziani, O. Mongin, M. H. V. Werts, L. Porrès, T. Pons, J. Mertz, S. Tretiak and M. Blanchard-Desce, J. Phys. Chem. A, 2005, 109, 3024–3037 CrossRef CAS PubMed.
- J. Yang, Y. Rousselin, L. Bucher, N. Desbois, F. Bolze, H.-J. Xu and C. P. Gros, ChemPlusChem, 2018, 83, 838–844 CrossRef CAS PubMed.
- L. Porrès, O. Mongin and M. Blanchard-Desce, Tetrahedron Lett., 2006, 47, 1913–1917 CrossRef.
- D. Zhang, Y. Wang, Y. Xiao, S. Qian and X. Qian, Tetrahedron, 2009, 65, 8099–8103 CrossRef CAS.
- X. Zhang, Y. Xiao, J. Qi, J. Qu, B. Kim, X. Yue and K. D. Belfield, J. Org. Chem., 2013, 78, 9153–9160 CrossRef CAS PubMed.
- K. Susumu, J. A. N. Fisher, J. Zheng, D. N. Beratan, A. G. Yodh and M. J. Therien, J. Phys. Chem. A, 2011, 115, 5525–5539 CrossRef CAS PubMed.
- M. Albota, D. Beljonne, J.-L. Brédas, J. E. Ehrlich, J.-Y. Fu, A. A. Heikal, S. E. Hess, T. Kogej, M. D. Levin, S. R. Marder, D. McCord-Maughon, J. W. Perry, H. Röckel, M. Rumi, G. Subramaniam, W. W. Webb, X.-L. Wu and C. Xu, Science, 1998, 281, 1653–1656 CrossRef CAS PubMed.
- S.-i. Kato, T. Matsumoto, T. Ishi-i, T. Thiemann, M. Shigeiwa, H. Gorohmaru, S. Maeda, Y. Yamashita and S. Mataka, Chem. Commun., 2004, 2342–2343 RSC.
- Y.-Z. Cui, Q. Fang, G. Xue, G.-B. Xu, L. Yin and W.-T. Yu, Chem. Lett., 2005, 34, 644–645 CrossRef CAS.
- S.-J. Chung, K.-S. Kim, T.-C. Lin, G. S. He, J. Swiatkiewicz and P. N. Prasad, J. Phys. Chem. B, 1999, 103, 10741–10745 CrossRef CAS.
- D. Beljonne, W. Wenseleers, E. Zojer, Z. Shuai, H. Vogel, S. Pond, J. Perry, S. Marder and J.-L. Brédas, Adv. Funct. Mater., 2002, 12, 631–641 CrossRef CAS.
- A. Bhaskar, G. Ramakrishna, Z. Lu, R. Twieg, J. M. Hales, D. J. Hagan, E. Van Stryland and T. Goodson, J. Am. Chem. Soc., 2006, 128, 11840–11849 CrossRef CAS PubMed.
- B. Jędrzejewska, M. Gordel, J. Szeremeta, P. Krawczyk and M. Samoć, J. Org. Chem., 2015, 80, 9641–9651 CrossRef PubMed.
- J. R. Lawson and R. L. Melen, Organometallic Chemistry: Volume 41, The Royal Society of Chemistry, 2017, vol. 41, pp. 1–27 Search PubMed.
- A. E. Ashley, T. J. Herrington, G. G. Wildgoose, H. Zaher, A. L. Thompson, N. H. Rees, T. Krämer and D. O'Hare, J. Am. Chem. Soc., 2011, 133, 14727–14740 CrossRef CAS PubMed.
- P. A. Deck, C. L. Beswick and T. J. Marks, J. Am. Chem. Soc., 1998, 120, 1772–1784 CrossRef CAS.
- I. B. Sivaev and V. I. Bregadze, Coord. Chem. Rev., 2014, 270–271, 75–88 CrossRef CAS.
- C. Tahtaoui, C. Thomas, F. Rohmer, P. Klotz, G. Duportail, Y. Mély, D. Bonnet and M. Hibert, J. Org. Chem., 2007, 72, 269–272 CrossRef CAS PubMed.
- C. A. Wijesinghe, M. E. El-Khouly, N. K. Subbaiyan, M. Supur, M. E. Zandler, K. Ohkubo, S. Fukuzumi and F. D'Souza, Chem. – Eur. J., 2011, 17, 3147–3156 CrossRef CAS PubMed.
- G. Zhang, M. Wang, F. R. Fronczek, K. M. Smith and M. G. H. Vicente, Inorg. Chem., 2018, 57, 14493–14496 CrossRef CAS PubMed.
- B. Brizet, C. Bernhard, Y. Volkova, Y. Rousselin, P. D. Harvey, C. Goze and F. Denat, Org. Biomol. Chem., 2013, 11, 7729–7737 RSC.
- S. Goeb and R. Ziessel, Tetrahedron Lett., 2008, 49, 2569–2574 CrossRef CAS.
- G. Fan, L. Yang and Z. Chen, Front. Chem. Sci. Eng., 2014, 8, 405–417 CrossRef CAS.
- S. Zhu, J. Zhang, G. Vegesna, F.-T. Luo, S. A. Green and H. Liu, Org. Lett., 2011, 13, 438–441 CrossRef CAS PubMed.
- H. Manzano, I. Esnal, T. Marqués-Matesanz, J. Bañuelos, I. López-Arbeloa, M. J. Ortiz, L. Cerdán, A. Costela, I. Garca-Moreno and J. L. Chiara, Adv. Funct. Mater., 2016, 26, 2756–2769 CrossRef CAS.
- K. Yuan, X. Wang, S. K. Mellerup, I. Kozin and S. Wang, J. Org. Chem., 2017, 82, 13481–13487 CrossRef CAS PubMed.
- J. Dipold, E. E. Romero, J. Donnelly, T. P. Calheiro, H. G. Bonacorso, B. A. Iglesias, J. P. Siqueira, F. E. Hernandez, L. D. Boni and C. R. Mendonca, Phys. Chem. Chem. Phys., 2019, 21, 6662–6671 RSC.
- M. A. Potopnyk, D. Volyniuk, M. Ceborska, P. Cmoch, I. Hladka, Y. Danyliv and J. V. Gražulevičius, J. Org. Chem., 2018, 83, 12129–12142 CrossRef CAS PubMed.
- P. K. Samanta, M. M. Alam, R. Misra and S. K. Pati, Phys. Chem. Chem. Phys., 2019, 21, 17343–17355 RSC.
- B. Li, Z. Cui, Y. Han, J. Ding, Z. Jiang and Y. Zhang, Dyes Pigm., 2020, 179, 108407 CrossRef CAS.
- B. Zhang, S. Wang, J. Tan and X. Zhang, Dyes Pigm., 2018, 155, 186–193 CrossRef CAS.
- S. Shimizu, Chem. Rev., 2016, 117, 2730–2784 CrossRef PubMed.
- Y. Takeuchi, A. Matsuda and N. Kobayashi, J. Am. Chem. Soc., 2007, 129, 8271–8281 CrossRef CAS PubMed.
- P. A. Stuzhin, I. A. Skvortsov, Y. A. Zhabanov, N. V. Somov, O. V. Razgonyaev, I. A. Nikitin and O. I. Koifman, Dyes Pigm., 2019, 162, 888–897 CrossRef CAS.
- S. Shimizu, T. Otaki, Y. Yamazaki and N. Kobayashi, Chem. Commun., 2012, 48, 4100 RSC.
- M. M. Alam, M. Chattopadhyaya, S. Chakrabarti and K. Ruud, Acc. Chem. Res., 2014, 47, 1604–1612 CrossRef CAS PubMed.
- B. Dziuk, B. Ośmiałowski, B. Zarychta, K. Ejsmont and L. Chęcińska, Crystals, 2019, 9, 662–678 CrossRef CAS.
- Y. Kubota, K. Kasatani, H. Takai, K. Funabiki and M. Matsui, Dalton Trans., 2015, 44, 3326–3341 RSC.
- D. Jacquemin, V. Wathelet, E. A. Perpéte and C. Adamo, J. Chem. Theory Comput., 2009, 5, 2420–2435 CrossRef CAS PubMed.
- M. M. Alam, M. Chattopadhyaya and S. Chakrabarti, Phys. Chem. Chem. Phys., 2012, 14, 1156–1165 RSC.
- M. T. P. Beerepoot, M. M. Alam, J. Bednarska, W. Bartkowiak, K. Ruud and R. Zalesny, J. Chem. Theory Comput., 2018, 14, 3677–3685 CrossRef CAS PubMed.
- A. M. Grabarz, A. D. Laurent, B. Jȩdrzejewska, A. Zakrzewska, D. Jacquemin and B. Ośmiałowski, J. Org. Chem., 2016, 81, 2280–2292 CrossRef CAS PubMed.
- B. Jȩdrzejewska, A. Skotnicka, A. D. Laurent, M. Pietrzak, D. Jacquemin and B. Ośmiałowski, J. Org. Chem., 2018, 83, 7779–7788 CrossRef PubMed.
- T. Yanai, D. P. Tew and N. C. Handy, Chem. Phys. Lett., 2004, 393, 51–57 CrossRef CAS.
- T. H. Dunning, J. Chem. Phys., 1989, 90, 1007–1023 CrossRef CAS.
- M. J. Frisch, G. W. Trucks, H. B. Schlegel, G. E. Scuseria, M. A. Robb, J. R. Cheeseman, G. Scalmani, V. Barone, G. A. Petersson, H. Nakatsuji, X. Li, M. Caricato, A. V. Marenich, J. Bloino, B. G. Janesko, R. Gomperts, B. Mennucci, H. P. Hratchian, J. V. Ortiz, A. F. Izmaylov, J. L. Sonnenberg, D. Williams-Young, F. Ding, F. Lipparini, F. Egidi, J. Goings, B. Peng, A. Petrone, T. Henderson, D. Ranasinghe, V. G. Zakrzewski, J. Gao, N. Rega, G. Zheng, W. Liang, M. Hada, M. Ehara, K. Toyota, R. Fukuda, J. Hasegawa, M. Ishida, T. Nakajima, Y. Honda, O. Kitao, H. Nakai, T. Vreven, K. Throssell, J. A. Montgomery, Jr., J. E. Peralta, F. Ogliaro, M. J. Bearpark, J. J. Heyd, E. N. Brothers, K. N. Kudin, V. N. Staroverov, T. A. Keith, R. Kobayashi, J. Normand, K. Raghavachari, A. P. Rendell, J. C. Burant, S. S. Iyengar, J. Tomasi, M. Cossi, J. M. Millam, M. Klene, C. Adamo, R. Cammi, J. W. Ochterski, R. L. Martin, K. Morokuma, O. Farkas, J. B. Foresman and D. J. Fox, Gaussian∼16 Revision C.01, Gaussian Inc., Wallingford CT, 2016 Search PubMed.
- J. C. Phillips, R. Braun, W. Wang, J. Gumbart, E. Tajkhorshid, E. Villa, C. Chipot, R. D. Skeel, L. Kalé and K. Schulten, J. Comput. Chem., 2005, 26, 1781–1802 CrossRef CAS PubMed.
- A. D. MacKerell, D. Bashford, M. Bellott, R. L. Dunbrack, J. D. Evanseck, M. J. Field, S. Fischer, J. Gao, H. Guo, S. Ha, D. Joseph-McCarthy, L. Kuchnir, K. Kuczera, F. T. K. Lau, C. Mattos, S. Michnick, T. Ngo, D. T. Nguyen, B. Prodhom, W. E. Reiher, B. Roux, M. Schlenkrich, J. C. Smith, R. Stote, J. Straub, M. Watanabe, J. Wiórkiewicz-Kuczera, D. Yin and M. Karplus, J. Phys. Chem. B, 1998, 102, 3586–3616 CrossRef CAS PubMed.
- W. Dietz and K. Heinzinger, Ber. Bunsen-Ges., 1985, 89, 968–977 CrossRef CAS.
- W. Yu, X. He, K. Vanommeslaeghe and A. D. MacKerell Jr., J. Comput. Chem., 2012, 33, 2451–2468 CrossRef CAS PubMed.
- D. H. Friese, C. Hättig and K. Ruud, Phys. Chem. Chem. Phys., 2012, 14, 1175–1184 RSC.
- F. Weigend, A. Köhn and C. Hättig, J. Chem. Phys., 2002, 116, 3175–3183 CrossRef CAS.
- C. Hättig, Phys. Chem. Chem. Phys., 2005, 7, 59–66 RSC.
- TURBOMOLE V7.3 2018, a development of University of Karlsruhe and Forschungszentrum Karlsruhe GmbH, 1989-2007, TURBOMOLE GmbH, since 2007; available from http://www.turbomole.com.
Footnote |
| † Electronic supplementary information (ESI) available: NMR spectra of compounds, data from the spectroscopic measurements, results from electronic-structure calculations. See DOI: 10.1039/d1tc00062d |
| This journal is © The Royal Society of Chemistry 2021 |

