A promising blue-emitting phosphor CaYGaO4:Bi3+ for near-ultraviolet (NUV) pumped white LED application and the emission improvement by Li+ ions
Yubin
Fu
a,
Puxian
Xiong
b,
Xiaoqi
Liu
b,
Xiu
Wang
b,
Sheng
Wu
a,
Quan
Liu
a,
Mingying
Peng
 *ab and
Yan
Chen
 a
a
aSchool of Applied Physics and Materials, Wuyi University, Jiangmen, China
bSchool of Physics and Optoelectronic, The State Key Laboratory of Luminescent Materials and Devices, Guangdong Provincial Key Laboratory of Fiber Laser Materials and Applied Techniques, South China University of Technology, Guangzhou, 510640, P. R. China. E-mail: pengmingying@scut.edu.cn
First published on 2nd November 2020
Abstract
In this paper, a blue-emitting phosphor CaYGaO4:Bi3+ is reported, which has a broad emission band peaked at 435 nm covering the 375 nm to 575 nm spectral region. The CIE coordinates of CaYGaO4:Bi3+ is (0.1536, 0.0885) with color purity of 85.2%. Importantly, when Bi3+ ions are introduced into the CaYGaO4 host, the excitation peak of Bi3+ is located at 370 nm, which matches well with the efficient near-ultraviolet (NUV) light emitting diode (LED) chips. Furthermore, the emission intensity of the CaYGaO4:Bi3+ phosphor increased ∼1.47 times by adding Li2CO3 as a fluxing agent. The quantum efficiency of the prepared CaYGaO4:Bi3+,Li+ phosphor reaches 45.7% under 370 nm excitation, and the PL intensity remains 76.3% of that at room temperature at 423 K. Using the CaYGaO4:Bi3+,Li+ phosphor, coupled only with an orange phosphor (Sr,Ba)3SiO5:Eu2+ and a 370 nm NUV chip driven by 20 mA current, a NUV-based WLED, with chromaticity coordinates of (0.3610, 0.3360), correlated color temperature (CCT) = 4304 K and color rendering index (CRI) = 86.9, has been achieved. The white light emitting diodes employing CaYGaO4:Bi3+ as a blue-emitting component exhibit superior electroluminescence properties. All results demonstrate that CaYGaO4:Bi3+ is a promising blue component for application in NUV-based WLEDs.
1. Introduction
Solid-state lighting devices based on white-light-emitting diodes (WLEDs) have shown various advantages of energy saving, environmental protection, small size, light weight, fast response and long service life, and they have already replaced conventional incandescent, and are fluorescent and widely used in lighting display and decoration fields.1–8 WLEDs are most commonly fabricated by combining a blue LED chip with yellow or yellow/red phosphors.9–11 WLEDs where a blue LED chip is combined with only a yellow phosphor often manifest high efficiency but suffer from poor color rendering properties; the addition of a second red phosphor improves the color rendering but usually with a sacrifice in efficiency. Furthermore, the sharp peak of the blue LED chip has two serious effects: the first is that if the WLED is a bright light source or the viewer is looking at it directly or even indirectly for some time it can cause retinal injury, and the second is that the blue light affects the human body clock.12 One approach to avoid the problems associated with using blue LEDs is to use near-ultraviolet (NUV)-driven WLEDs that employ NUV-LED chips and blue/green/red-emitting phosphors. The use of a variety of monochromatic phosphors can effectively increase the color rendering index of the system. Moreover, this excitation mode can provide higher excitation energy and ultraviolet light does not affect white light emission. In this scheme, high efficiency phosphors, which can be well matched with commercial NUV LED chips, are key components. At present, most scientists mainly focus on materials that usually take rare earth ions such as Ce3+ or Eu2+ as activators.13–17 However, these phosphors exhibit strong absorption bands in the visible region due to the nature of 4f to 5d transitions. This will unavoidably lead to reabsorption once they are utilized for WLEDs. In recent years, studies on trivalent bismuth ion doped phosphors have received more extensive attentions.18–24 Bi3+ has broad absorption bands in the UV region and no reabsorption in the visible region, indicating that Bi3+ doped phosphors can solve the problems existing in traditional rare earth ions activated phosphors.25 But actually, among the Bi3+ doped phosphors reported so far, most of the peak positions of the excitation spectra are concentrated in the ultraviolet region, especially in the relatively short wavelength region, such as KGaGeO4:Bi3+ (240, 320 nm), CaSnO3:Bi3+ (260, 308 nm), Ca3Al2O6:Bi3+ (285, 305 nm), LiBaPO4:Bi3+ (260 nm), and CaGa2O4:Bi3+ (280, 337 nm),26–30 which cannot match with the NUV chips, thus greatly restricting the application of Bi3+ doped phosphors in the field of WLEDs. Therefore, it is highly desirable to develop a novel Bi3+ doped phosphor with strong NUV absorption.In this work, a novel blue-emitting phosphor CaYGaO4:Bi3+ was prepared, which exhibits an intense blue emission in the NUV excitation range of 300–400 nm. To further explore the potential application of the CaYGaO4:Bi3+ phosphor in WLEDs, the optical properties (photoluminescence and photoluminescence excitation) and the optimal Bi3+ concentration have been investigated. In addition, the luminescence intensity and near ultraviolet absorption of the CaYGaO4:Bi3+ phosphor can be further improved by adding Li2CO3. Based on our phosphor and the commercial phosphors ((Sr,Ba)3SiO5:Eu2+, (Ba,Sr)2SiO4:Eu2+, CaAlSiN3:Eu2+) we fabricated a series of NUV-based WLED devices, which exhibit superior electroluminescence properties. All results indicate that the CaYGaO4:Bi3+ phosphor would be a potential blue emitting phosphor for NUV-based WLEDs.
2. Experimental
2.1 Sample preparation
The CaY1−xGaO4:xBi3+ (x = 0, 0.002, 0.005, 0.007, 0.010, and 0.020) samples were synthesized by the conventional solid state reaction at high temperatures. CaCO3 (99.95%), Y2O3 (99.99%), Ga2O3 (99.99%), and Bi2O3 (99.999%) were used as starting materials. The starting materials were weighed accurately according to the stoichiometric ratio and mixed in an agate mortar, and then the precursors were heated at 1523 K for 6 h in air and were cooled down to room temperature naturally. The faint white products were obtained, and were ground once again for subsequent measurements.2.2 WLED fabrication
WLEDs were fabricated by combining the representative CaY0.995GaO4:0.005Bi3+,0.3%(wt)Li2CO3 phosphors and 370 nm InGaN NUV chips (Shenzhen Looking Long Technology Co., Shenzhen, China). The CaY0.995GaO4:0.005Bi3+,0.3%(wt)Li2CO3 phosphor was weighed out in a total amount of 0.15 g, and were evenly blended with the epoxy resins at a ratio of 1![[thin space (1/6-em)]](https://www.rsc.org/images/entities/char_2009.gif) :
:![[thin space (1/6-em)]](https://www.rsc.org/images/entities/char_2009.gif) 5 (that is, 0.15 g CaY0.995GaO4:0.005Bi3+,0.3%(wt)Li2CO3 and 0.75 g epoxy resins). The acquired mixture was coated on the surface of the 370 nm InGaN NUV chips and dried at 393 K to fabricate WLEDs.
5 (that is, 0.15 g CaY0.995GaO4:0.005Bi3+,0.3%(wt)Li2CO3 and 0.75 g epoxy resins). The acquired mixture was coated on the surface of the 370 nm InGaN NUV chips and dried at 393 K to fabricate WLEDs.
2.3 Characterization
The crystal structure and crystallinity of all samples were confirmed by X-ray diffraction (XRD) using a Bruker D8 advance powder diffractometer with Cu Kα radiation (λ = 1.54059 Å) at room temperature (RT). Static and dynamic PL spectra at room temperature were recorded using a high-resolution PL spectrometer FLS920 (Edinburgh Instruments) in a Peltier air-cooled house in the single photon counting mode. For high temperature PL spectra, the sample was first loaded into a holder with a circular copper substrate, the temperature of which could be controlled by a high temperature setup (Tianjin Orient-KOJI). The unit is removable and it can be inserted into the FLS920 spectrometer for the high temperature PL. The PL scans were performed at a step of 30 K between 300 and 480 K. A 450 W Xenon lamp was used as the excitation light source. Excitation curves were corrected over the lamp intensity with a silicon photodiode, and all emission spectra were corrected over the PMT spectral response. The WLED parameters were measured using a UV-VIS-NIR spectrophotometer (PMS-50 PLUS, Everfine, Hangzhou, China).3. Results and discussion
3.1 Crystal structure and phase purity
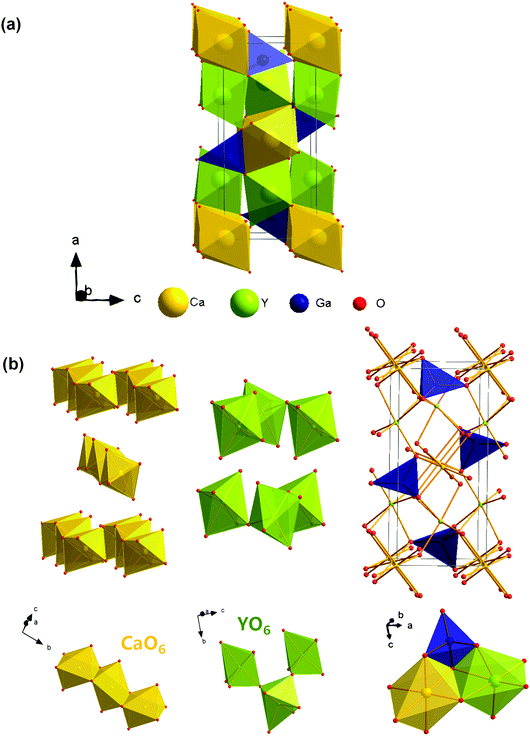
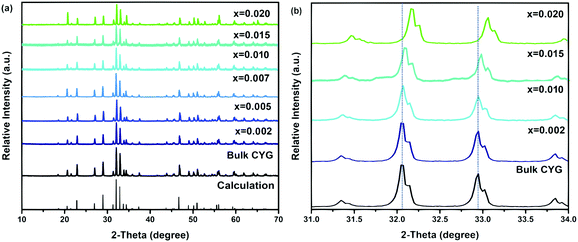
In the last few years gallate phosphors have been the subject of several studies because of their chemical stability and remarkable optical properties.31–35 Recently, Derakhshan et al. reported a new olivine type gallate, CaYGaO4, which crystallizes in a different space group compared to all the previously reported gallates.36 The work by Derakhshan et al. showed that this Eu3+/Tb3+-doped systems show red green luminescence, which would be ideal for solid-state white lighting purposes. Since then, this gallate has been selected as the host, and the Y3+ lattice sites in its structure can be effectively replaced by doped ions.37Fig. 1 shows the unit cell structure of CaYGaO4 and the coordination environments of Ca2+, Y3+ and Ga3+. According to a previous report, CaYGaO4 crystallizes in orthorhombic crystal system with the Pnma space group and the cell parameters are a = 11.3484(1) Å, b = 6.5712(6) Å, c = 5.2818(8) Å and V = 393.86(8) Å3. It is clear that there are three independent cationic positions. The two octahedral coordination environments are occupied by Ca2+ and Y3+, while Ga3+ resides in tetrahedral voids. Calcium ions occupying the 4a Wyckoff position form the CaO6 octahedral units that share their edges along the b crystallographic axis forming one-dimensional chains. Yttrium ions occupying the 4c Wyckoff position form YO6 octahedral units that share their corners and create puckered layers perpendicular to the a crystallographic axis.36 The unique cationic ordering in this system is different from both previously studied classes of silicate and germanate olivines.The phase purity of the CaYGaO4:Bi3+ phosphor was characterized by XRD at room temperature. XRD patterns of all samples are listed in Fig. 2(a) together with simulated XRD pattern of CaYGaO4 (based on the parameters of the crystal structure).36 The obtained XRD patterns were demonstrated to agree well with the calculated XRD of CaYGaO4, suggesting that no impurity phase is caused by small amounts of the Bi3+ dopant. On the basis of the effective ionic radii and charge balance of cations with different coordination numbers, we proposed that both Y3+ and Ca2+ sites in this host may be replaced by Bi3+.37 According to the Bragg equation 2d![[thin space (1/6-em)]](https://www.rsc.org/images/entities/char_2009.gif) sin
sin![[thin space (1/6-em)]](https://www.rsc.org/images/entities/char_2009.gif) θ = nλ (where d is the interplanar spacing, θ is the diffraction angle, n is the integer, and λ is the wavelength of X-ray) the interplanar spacing of CaYGaO4 increases with the introduction of bigger ions. The ionic radius of Bi3+ (1.03 Å for coordinate number (CN) of 6) is bigger than that of Ca2+ (1.00 Å for CN of 6) and Y3+ (0.90 Å for (CN) of 6).38–40 However, the XRD peaks shift towards larger angles when Bi3+ is doped into the CaYGaO4 host, and the shift extent is proportional to the dopant quantity, as depicted in Fig. 2(b). Table 1 shows the crystal lattice parameters and volumes of CaY1−xGaO4:xBi3+ (x = 0–0.020) samples from indexing the experimental powder X-ray diffraction patterns. These results indicate that the doping of Bi3+ causes the lattice to shrink slightly.
θ = nλ (where d is the interplanar spacing, θ is the diffraction angle, n is the integer, and λ is the wavelength of X-ray) the interplanar spacing of CaYGaO4 increases with the introduction of bigger ions. The ionic radius of Bi3+ (1.03 Å for coordinate number (CN) of 6) is bigger than that of Ca2+ (1.00 Å for CN of 6) and Y3+ (0.90 Å for (CN) of 6).38–40 However, the XRD peaks shift towards larger angles when Bi3+ is doped into the CaYGaO4 host, and the shift extent is proportional to the dopant quantity, as depicted in Fig. 2(b). Table 1 shows the crystal lattice parameters and volumes of CaY1−xGaO4:xBi3+ (x = 0–0.020) samples from indexing the experimental powder X-ray diffraction patterns. These results indicate that the doping of Bi3+ causes the lattice to shrink slightly.
| Sample | a (Å) | b (Å) | c (Å) | V (Å3) |
|---|---|---|---|---|
| x = 0.000 | 11.3546 | 6.5768 | 5.2802 | 394.31 |
| x = 0.002 | 11.3575 | 6.5714 | 5.2825 | 394.26 |
| x = 0.010 | 11.3576 | 6.5727 | 5.2797 | 394.13 |
| x = 0.015 | 11.3459 | 6.5736 | 5.2851 | 394.18 |
| x = 0.020 | 11.3529 | 6.5727 | 5.2799 | 393.98 |
3.2 Photoluminescence properties of CaYGaO4:Bi3+ phosphor at room temperature
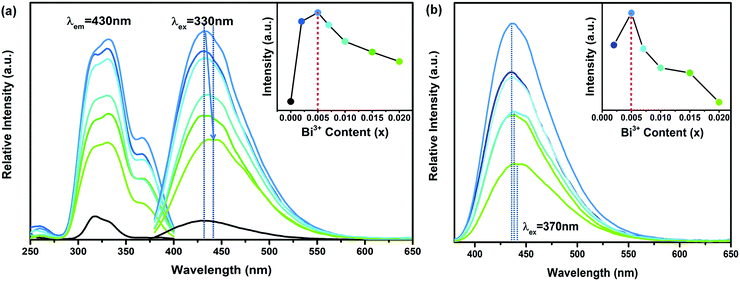
Fig. 3(a) presents the PL spectra (λex = 330 nm) and PLE spectra (λem = 430 nm) of CaY1−xGaO4:xBi3+ (x = 0.000–0.020), the inset shows integrated emission intensities with various Bi3+ concentrations. It can be noticed that the excitation and emission spectra of blank CaYGaO4 (black line) are peaked at 330 nm and 430 nm, respectively.Compared with the excitation spectrum of the blank sample, an obvious excitation peak appears at 370 nm, which is attributed to 1S0 → 3P1 electronic transitions of Bi3+. The emission intensity increases to the maximum at x = 0.005, and then it begins to decrease rapidly with further increase of x, due to the concentration quenching effect.41–44 In addition, with the increases of the Bi3+ content, the emission peaks redshift from 430 nm to 440 nm (λex = 330 nm), which means that there may be energy transfer between the host to Bi3+. On the other hand, the emission wavelengths of Bi3+ are slightly longer than the host emission, and overlap it. Fig. 3(b) shows the PL spectra (λex = 370 nm) of CaY1−xGaO4:xBi3+ as a function of Bi3+ concentration x from 0.002 to 0.020. It is obvious that the emission intensity increases to the maximum at x = 0.005 and the peaks show a slight redshift. The reason for the observed redshift is possibly because Bi3+ replaces the smaller Y3+ lattice at a higher bismuth doping concentration. The small unit cell with a higher crystal field strength leads to emission redshift.27
Phosphorescence decay data for CaY1−xGaO4:xBi3+ (x = 0.002–0.020) are presented in Fig. 4(a). The excitation wavelength and the monitored emission wavelength are 370 and 435 nm, corresponding to the absorption and emission peak of Bi3+, respectively.
All decay curves could be fitted by the double exponential decay equation:45
 | (1) |
 | (2) |
| Sample | τ 1 (ns) | A 1 | τ 2 (ns) | A 2 | γ 2 | τ ave (ns) |
|---|---|---|---|---|---|---|
| x = 0.002 | 136 | 335.81 | 407 | 1940.48 | 0.9988 | 392 |
| x = 0.005 | 75 | 673.46 | 382 | 1836.30 | 0.9988 | 362 |
| x = 0.007 | 79 | 779.99 | 388 | 1699.27 | 0.9985 | 361 |
| x = 0.010 | 71 | 968.64 | 373 | 1604.03 | 0.9986 | 341 |
| x = 0.015 | 58 | 1338.18 | 357 | 1529.14 | 0.9981 | 320 |
| x = 0.020 | 34 | 2612.48 | 326 | 1434.90 | 0.9976 | 279 |
The PL and PLE spectra at various wavelengths for CaY0.995GaO4:0.005Bi3+ at room temperature were recorded. As shown in Fig. 5, these excitation bands are unchanged obviously. However the emission bands redshift when the excitation wavelength increases from 300 to 370 nm, which is due to the emission overlap that makes the emission change from the host to bismuth luminescence centre.50
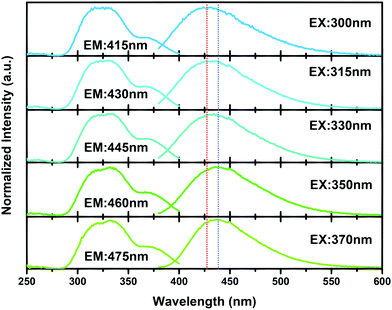 | ||
| Fig. 5 PL and PLE spectra of CaY0.995GaO4:0.005Bi3+ at various excitation and emission wavelengths measured at room temperature. | ||
3.3 The emission improvement of the CaYGaO4:Bi3+ phosphor by Li+ ion
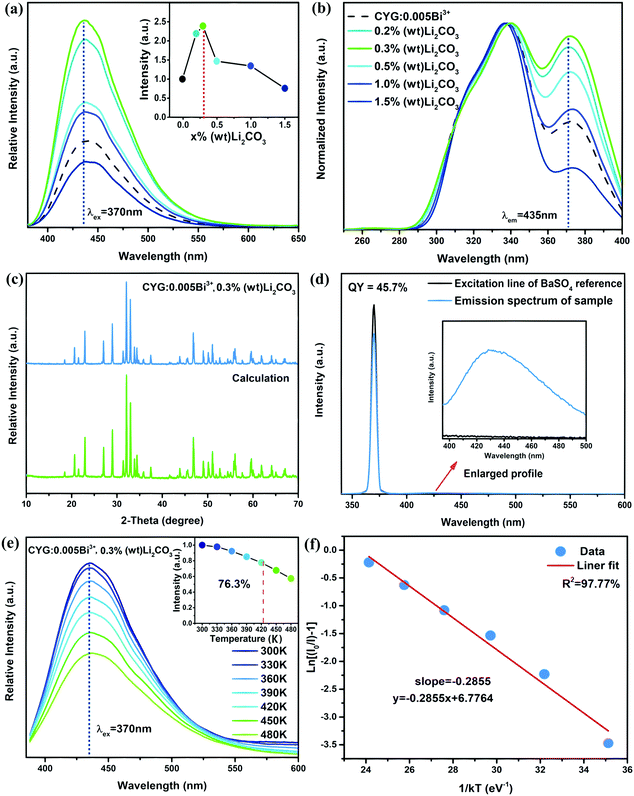
Codoping with Li+ is a prevalent strategy to improve the optical efficiency of luminescent materials, and this strategy has been successfully used in several systems such as: SrAl2O4:Ce3+, CeO2:Eu3+ and Lu2MoO6:Eu3+ phosphors.51–53 Therefore, we used Li2CO3 as flux materials to try to improve the emission intensity of CaY0.995GaO4:0.005Bi3+. Fig. 6(a) presents the emission spectra of CaY0.995GaO4:0.005Bi3+ and CaY0.995GaO4:0.005Bi3+,x%(wt)Li2CO3 (x = 0.2–1.5). It is observed that the emission intensity of CaY0.995GaO4:0.005Bi3+ increases ∼1.47 times upon adding increasing concentrations of Li2CO3 to 0.3%(wt). In addition, as illustrated in Fig. 6(b), the excitation peak at 370 nm is enhanced, indicating that the addition of Li2CO3 could make Bi3+ more easy to be incorporated into the CaYGaO4 lattice. It can be seen from Fig. 6(c) that no impurity phase is observed upon the addition of small amounts of Li2CO3. The major role of Li+ ions is to serve as flux materials, resulting in higher crystallinity and larger crystallites for improved luminescence. With the crystallite enlargement, more and more activator ions locate in the interior of the crystals, rather than near the surface where energy can rapidly transfer to surface defects and then be consumed by high vibrational energies.54–56 Another fundamental reason is that when the Bi3+ substitutes the Ca2+ in the host material, Li+ ions can provide charge compensation to reduce the number of cation vacancies and eventually promote more Bi3+ ions to go into the host lattice.57,583.4 Luminescence quantum efficiency and thermal quenching properties of the CaYGaO4:Bi3+,Li+ phosphor
The quantum efficiency (QE) and thermal stability of phosphors are two key critical factors for evaluating their applicability for WLEDs. The QE of CaY0.995GaO4:0.005Bi3+,0.3%(wt)Li2CO3 is measured using an integrating sphere coupled spectrofluorometer and calculated by the following equation:59,60 | (3) |
For WLED applications, the increasing working time leads to more heat generation at the p–n junction, resulting in the high temperature of the phosphor up to 423 K, which has considerable influence on the light output and CRI.61 Thus, the excellent thermal stability of the luminescence intensity is an important parameter for phosphor application in WLEDs. Fig. 6(e) illustrates emission spectra of CaY0.995GaO4:0.005Bi3+,0.3%(wt)Li2CO3 excited by 370 nm in temperature ranging from 300–480 K. It is obvious that the increased temperature from 300–480 K leads to the decrease of the emission intensity while the emission band remains unchanged. As temperature increases from 300–423 K, the PL intensity decreases from 100% to ∼76.3%. Generally speaking, with increasing temperature, electron–phonon interaction is intensified. The excited electron could obtain the phonon energy to overcome the energy barrier, which leads to thermal quenching.62 On the other hand, the emission band broadening is obvious with increasing temperature, resulting from the excited electrons spreading to higher vibration levels and the radiative transitions from these different levels.61 To better understand the thermal quenching, the activation energy (ΔE) has been calculated by the Arrhenius formula:63,64
 | (4) |
3.5 Application of a blue-emitting CaYGaO4:Bi3+,Li+ phosphor in LED devices
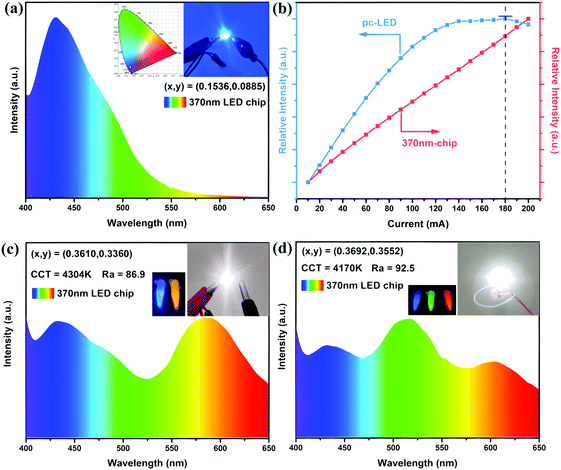
As a proof of concept, we fabricated a series of LED devices by combining the present and commercial phosphors with NUV LED chips (with emission peaked at 370 nm, 20 mA, 3 V), as shown in Fig. 7. The emission of Bi3+ ions could be excited by 370 nm UV light according to previous discussions. The EL spectrum of the CaY0.995GaO4:0.005Bi3+,0.3%(wt)Li2CO3 phosphor with CIE color coordinates (0.1536, 0.0885) is illustrated in Fig. 7(a). To study the impact of driving current on the EL of the CaY0.995GaO4:0.005Bi3+,0.3%(wt)Li2CO3 coated LED, we measured the relative emission intensity as a function of direct current, which changed from 10 to 200 mA, as illustrated in Fig. 7(b). It can be seen that the emission intensity initially increases with increasing current, reaching a maximum at 180 mA, which is dominated by the increase of excitation light intensity (Fig. 7(b) red curve). When the current increases further, the emission intensity decreases, that is, thermal quenching dominates (the temperature of LED chip increases with increasing drive current).61The WLED coupled only with the commercial orange phosphor ((Sr,Ba)3SiO5:Eu2+) was fabricated (the mass ratio of CaY0.995GaO4:0.005Bi3+,0.3%(wt)Li2CO3![[thin space (1/6-em)]](https://www.rsc.org/images/entities/char_2009.gif) :
:![[thin space (1/6-em)]](https://www.rsc.org/images/entities/char_2009.gif) (Sr,Ba)3SiO5:Eu2+ = 4
(Sr,Ba)3SiO5:Eu2+ = 4![[thin space (1/6-em)]](https://www.rsc.org/images/entities/char_2009.gif) :
:![[thin space (1/6-em)]](https://www.rsc.org/images/entities/char_2009.gif) 1, that is, 0.1 g CaY0.995GaO4:0.005Bi3+,0.3%(wt)Li2CO3 and 0.025 g (Sr,Ba)3SiO5:Eu2+). The EL spectrum and the photograph of the WLED are obtained and demonstrated in Fig. 7(c). The WLED manifests white light with a CCT of 4304 K and CIE color coordinates of (x, y) = (0.3610, 0.3360), CRI = 86.9. Besides, a white LED lamp combining commercial (Ba,Sr)2SiO4:Eu2+ (green) and CaAlSiN3:Eu2+ (red) phosphors was fabricated (the mass ratio of CaY0.995GaO4:0.005Bi3+,0.3%(wt)Li2CO3
1, that is, 0.1 g CaY0.995GaO4:0.005Bi3+,0.3%(wt)Li2CO3 and 0.025 g (Sr,Ba)3SiO5:Eu2+). The EL spectrum and the photograph of the WLED are obtained and demonstrated in Fig. 7(c). The WLED manifests white light with a CCT of 4304 K and CIE color coordinates of (x, y) = (0.3610, 0.3360), CRI = 86.9. Besides, a white LED lamp combining commercial (Ba,Sr)2SiO4:Eu2+ (green) and CaAlSiN3:Eu2+ (red) phosphors was fabricated (the mass ratio of CaY0.995GaO4:0.005Bi3+,0.3%(wt)Li2CO3![[thin space (1/6-em)]](https://www.rsc.org/images/entities/char_2009.gif) :
:![[thin space (1/6-em)]](https://www.rsc.org/images/entities/char_2009.gif) (Ba,Sr)2SiO4:Eu2+
(Ba,Sr)2SiO4:Eu2+![[thin space (1/6-em)]](https://www.rsc.org/images/entities/char_2009.gif) :
:![[thin space (1/6-em)]](https://www.rsc.org/images/entities/char_2009.gif) CaAlSiN3:Eu2+ = 3
CaAlSiN3:Eu2+ = 3![[thin space (1/6-em)]](https://www.rsc.org/images/entities/char_2009.gif) :
:![[thin space (1/6-em)]](https://www.rsc.org/images/entities/char_2009.gif) 1
1![[thin space (1/6-em)]](https://www.rsc.org/images/entities/char_2009.gif) :
:![[thin space (1/6-em)]](https://www.rsc.org/images/entities/char_2009.gif) 2, that is, 0.075 g CaY0.995GaO4:0.005Bi3+,0.3%(wt)Li2CO3, 0.025 g (Ba,Sr)2SiO4:Eu2+ and 0.05 g CaAlSiN3:Eu2+). As shown in Fig. 7(d), white light has a CCT of 4170 K and CIE color coordinates of (x, y) = (0.3692, 0.3552), CRI = 92.5, which is higher than the NUV-pumped WLED coupled with blue-emitting phosphor Gd2ZnTiO6:Bi3+ (CRI = 89.4).65
2, that is, 0.075 g CaY0.995GaO4:0.005Bi3+,0.3%(wt)Li2CO3, 0.025 g (Ba,Sr)2SiO4:Eu2+ and 0.05 g CaAlSiN3:Eu2+). As shown in Fig. 7(d), white light has a CCT of 4170 K and CIE color coordinates of (x, y) = (0.3692, 0.3552), CRI = 92.5, which is higher than the NUV-pumped WLED coupled with blue-emitting phosphor Gd2ZnTiO6:Bi3+ (CRI = 89.4).65
Small colour fluctuations under varied excitation powers is crucial for the long-term service of WLEDs. To study the chromatic stability of WLEDs, we measured the variations of CIE color coordinates, CCT, CRI, luminous flux (LF) and luminous efficiency (LE) under direct driving currents in a range of 20–120 mA, and are illustrated in Fig. 8(a), (b) and Tables 3, 4 respectively. We found that the CIE color coordinates of WLEDs change slightly under different drive currents, indicative of very small colour fluctuation. The slight variation of the chromaticity coordinates are observed, merely 0.0058 for CIE-x, 0.0075 for CIE-y in Table 3 and 0.0034 for CIE-x, 0.0046 for CIE-y in Table 4. These results demonstrate that the blue-emitting phosphor CaY0.995GaO4:0.005Bi3+,0.3%(wt)Li2CO3 matches well with the NUV LED chips and commercial phosphors, implying its potential application in practical WLED devices.
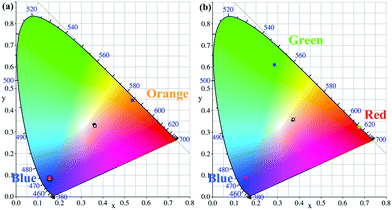 | ||
| Fig. 8 (a) and (b) CIE chromaticity coordinate diagrams of Fig. 7(c) and (d) under direct current in the range of 20–120 mA. | ||
| Current (mA) | Color coordinates | CTT (K) | CRI | LF (lm) | LE (lm W−1) |
|---|---|---|---|---|---|
| 20 | (0.3610, 0.3360) | 4304 | 86.9 | 0.95 | 14.32 |
| 40 | (0.3580, 0.3350) | 4412 | 86.8 | 2.06 | 14.71 |
| 60 | (0.3572, 0.3323) | 4420 | 86.6 | 3.07 | 14.02 |
| 80 | (0.3596, 0.3310) | 4317 | 85.8 | 3.93 | 12.93 |
| 100 | (0.3608, 0.3293) | 4255 | 85.2 | 4.74 | 11.28 |
| 120 | (0.3630, 0.3285) | 4161 | 84.3 | 5.34 | 10.29 |
| Current (mA) | Color coordinates | CTT (K) | CRI | LF (lm) | LE (lm W−1) |
|---|---|---|---|---|---|
| 20 | (0.3692, 0.3552) | 4170 | 92.5 | 0.98 | 15.25 |
| 40 | (0.3682, 0.3546) | 4197 | 92.6 | 2.07 | 15.78 |
| 60 | (0.3685, 0.3551) | 4193 | 93.0 | 3.10 | 15.53 |
| 80 | (0.3692, 0.3562) | 4176 | 93.3 | 4.02 | 15.00 |
| 100 | (0.3707, 0.3580) | 4143 | 93.6 | 4.77 | 14.16 |
| 120 | (0.3716, 0.3592) | 4122 | 93.8 | 5.53 | 13.57 |
4. Conclusions
A novel blue-emitting CaYGaO4:Bi3+ phosphor was synthesized by the conventional high temperature solid state reaction route, and its luminescence properties were studied. The results show that the obtained CaYGaO4:Bi3+ phosphors have a broad emission band ranging from 375 nm to 575 nm, which peaked at 435 nm. The CIE coordinates of CaYGaO4:Bi3+ is (0.1536, 0.0885) with color purity of 85.2%. The PL spectra of CaYGaO4:Bi3+ phosphors exhibit an intense blue emission under NUV excitation range from 300 to 400 nm. Moreover, the emission intensity of the CaYGaO4:Bi3+ phosphor increased ∼1.47 times by adding Li2CO3 as a fluxing agent. The quantum efficiency of the prepared CaYGaO4:Bi3+,Li+ phosphor reaches 45.7% under 370 nm excitation, and the emission intensity remains 76.3% of that at room temperature at 423 K and ΔE was estimated to be 0.2855 eV. By combining our discovered phosphor with the commercial orange phosphor ((Sr,Ba)3SiO5:Eu2+), we have fabricated a NUV-based WLED with a CCT of 4304 K and CIE color coordinates of (x, y) = (0.3610, 0.3360), CRI = 86.9. Besides, a NUV-based WLED employing blue (CaYGaO4:Bi3+,Li+)/green ((Ba,Sr)2SiO4:Eu2+)/red (CaAlSiN3:Eu2+) phosphors was achieved, which has a CCT of 4170 K and CIE color coordinates of (x, y) = (0.3692, 0.3552), CRI = 92.5. These WLEDs also show excellent chromaticity coordinate stability with the drive current varying from 20 to 120 mA. All results indicate that CaYGaO4:Bi3+ would be a promising blue phosphor for NUV-based WLEDs.Conflicts of interest
There are no conflicts to declare.Acknowledgements
We acknowledge financial support from the Program for Jiangmen Innovative Research Team (No. (2017)385), the National Natural Science Foundation of China (Grant No. 51672085), the Program for Innovative Research Team in University of Ministry of Education of China (Grant No. IRT_17R38), The Joint Fund of Ministry of Education of China, Major Basic Research Cultivation Project of Natural Science Foundation of Guangdong Province (Grant No. 2018B03038009), and the Local Innovative Research Team Project of ‘‘Pearl River Talent Plan’’ (Grant No. 2017BT01X137).Notes and references
- P. Dai, X. Zhang, L. Bian, S. Lu, Y. Liu and X. Wang, J. Mater. Chem. C, 2013, 1, 4570–4576 RSC.
- P. P. Han, A. Sewaiwar, S. V. Tiwari and Y.-H. Chung, J. Opt. Soc. Korea, 2015, 19, 74–79 CrossRef.
- P. Xiong and M. Peng, J. Mater. Chem. C, 2019, 7, 6301–6307 RSC.
- W. Lu, X. Zhang, Y. Wang, Z. Hao, Y. Liu, Y. Luo, X. Wang and J. Zhang, J. Alloys Compd., 2012, 513, 430–435 CrossRef.
- M. Peng, X. Yin, P. A. Tanner, M. Brik and P. Li, Chem. Mater., 2015, 27, 2938–2945 CrossRef CAS.
- X. Yang, H. Song, L. Yang and X. Xu, J. Am. Ceram. Soc., 2011, 94, 164–171 CrossRef CAS.
- P. Xiong and M. Peng, Opt. Mater.: X, 2019, 2, 100022 CAS.
- L. Wang, R.-J. Xie, T. Suehiro, T. Takeda and N. Hirosaki, Chem. Rev., 2018, 118, 1951–2009 CrossRef CAS.
- A. A. Setlur, Electrochem. Soc. Interface, 2009, 18, 32–36 CAS.
- H. Zhu, C. C. Lin, W. Luo, S. Shu, Z. Liu, Y. Liu, J. Kong, E. Ma, Y. Cao and R. S. Liu, Nat. Commun., 2014, 5, 4312 CrossRef CAS.
- H. Ju, W. Deng, B. Wang, J. Liu, X. Tao and S. Xu, J. Alloys Compd., 2012, 516, 153–156 CrossRef CAS.
- Y. Liu, J. Silver, R.-J. Xie, J. Zhang, H. Xu, H. Shao, J. Jiang and H. Jiang, J. Mater. Chem. C, 2017, 5, 12365–12377 RSC.
- B. Lei, B. Li, H. Zhang and W. Li, Opt. Mater., 2007, 29, 1491–1494 CrossRef CAS.
- G. Li, Z. Wang, Z. Quan, C. Li and J. Lin, Cryst. Growth Des., 2007, 7, 1797–1802 CrossRef CAS.
- T.-C. Liu, B.-M. Cheng, S.-F. Hu and R.-S. Liu, Chem. Mater., 2011, 23, 3698–3705 CrossRef CAS.
- R. K. Tamrakar, D. P. Bisen, I. P. Sahu and N. Brahme, J. Radiat. Res. Appl. Sci., 2014, 7, 417–429 CrossRef.
- M. Yu, J. Lin, Z. Wang, J. Fu, S. Wang, A. Zhang and Y. Han, Chem. Mater., 2002, 14, 2224–2231 CrossRef CAS.
- P. Xiong, Y. Li and M. Peng, iScience, 2020, 23(10), 101578 CrossRef.
- H. Li, R. Pang, Y. Luo, H. Wu, S. Zhang, L. Jiang, D. Li, C. Li and H. Zhang, ACS Appl. Electron. Mater., 2019, 1, 229–237 CrossRef CAS.
- Z. Zhou, P. Xiong, H. Liu and M. Peng, Inorg. Chem., 2020, 59, 12920–12927 CrossRef CAS.
- Y. Fu, X. Wang and M. Peng, J. Mater. Chem. C, 2020, 8, 6079–6085 RSC.
- P. Xiong, C. Zheng, M. Peng, Z. Zhou, F. Xu, K. Qin, Y. Hong and Z. Ma, J. Am. Ceram. Soc., 2020, 124, 063101 Search PubMed.
- J. Xue, H. M. Noh, B. C. Choi, S. H. Park, J. H. Kim, J. H. Jeong and P. Du, Chem. Eng. J., 2020, 382, 122861 CrossRef CAS.
- C. Zheng, P. Xiong, M. Peng and H. Liu, J. Mater. Chem. C, 2020, 8(39), 13668–13675 RSC.
- F. Kang, H. Zhang, L. Wondraczek, X. Yang, Y. Zhang, D. Y. Lei and M. Peng, Chem. Mater., 2016, 28, 2692–2703 CrossRef CAS.
- W. Sun, R. Pang, H. Li, D. Li, L. Jiang, S. Zhang, J. Fu and C. Li, J. Mater. Chem. C, 2017, 5, 1346–1355 RSC.
- R. Cao, J. Zhang, W. Wang, Q. Hu, W. Li, W. Ruan and H. Ao, Luminescence, 2017, 32, 908–912 CrossRef CAS.
- H. Ju, W. Deng, B. Wang, J. Liu, X. Tao and S. Xu, J. Alloys Compd., 2012, 516, 153–156 CrossRef CAS.
- R. Cao, G. Quan, Z. Shi, Q. Gou, T. Chen, Z. Hu and Z. Luo, J. Mater. Sci.: Mater. Electron., 2018, 29, 5287–5292 CrossRef CAS.
- S. Wang, W. Chen, D. Zhou, J. Qiu, X. Xu and X. Yu, J. Am. Ceram. Soc., 2017, 100, 3514–3521 CrossRef CAS.
- X. Fu, S. Zheng, J. Shi, Y. Li and H. Zhang, J. Lumin., 2017, 184, 199–204 CrossRef CAS.
- Y. Li, H. Yi, J. Xu and X. Kuang, J. Alloys Compd., 2018, 740, 143–147 CrossRef CAS.
- X. Wang, P. Boutinaud, L. Li, J. Cao, P. Xiong, X. Li, H. Luo and M. Peng, J. Mater. Chem. C, 2018, 6, 10367–10375 RSC.
- S. Wang, W. Chen, D. Zhou, J. Qiu, X. Xu and X. Yu, J. Am. Ceram. Soc., 2017, 100, 3514–3521 CrossRef CAS.
- P. Xiong, M. Peng, K. Qin, F. Xu and X. Xu, Adv. Opt. Mater., 2019, 7, 1901107 CrossRef CAS.
- R. Clark, S. J. Zhu, S.-T. Zheng, X. Bu and S. Derakhshan, J. Alloys Compd., 2014, 616, 340–344 CrossRef CAS.
- S. M. Araiza, K. Slowinska and S. Derakhshan, J. Lumin., 2019, 216, 116747 CrossRef CAS.
- A. Dobrowolska and E. Zych, J. Lumin., 2017, 192, 397–403 CrossRef CAS.
- S. Gomes, A. Kaur, J.-M. Grenèche, J.-M. Nedelec and G. Renaudin, Acta Biomater., 2017, 50, 78–88 CrossRef CAS.
- Z. Qiu, T. Luo, J. Zhang, W. Zhou, L. Yu and S. Lian, J. Lumin., 2015, 158, 130–135 CrossRef CAS.
- P. Xiong and M. Peng, J. Mater. Chem. C, 2019, 7, 8303–8309 RSC.
- J. Zhong, Y. Peng, D. Chen, M. Liu, X. Li, Y. Zhu and Z. Ji, J. Mater. Chem. C, 2018, 6, 13305–13315 RSC.
- H. Liu, X. Liu, X. Wang, M. Peng, P. Xiong, Y. Chen, Y. Wang, B. Lei and Q. Zeng, J. Am. Ceram. Soc., 2020, 103, 5758–5768 CrossRef CAS.
- P. Xiong, M. Peng, J. Cao and X. Li, J. Am. Ceram. Soc., 2019, 102, 5899–5909 CrossRef CAS.
- J. Fu, S. Zhang, T. Ma, Y. Jia, R. Pang, L. Jiang, D. Li, H. Li, W. Sun and C. Li, RSC Adv., 2015, 5, 93951–93956 RSC.
- X. Ding, G. Zhu, W. Geng, Q. Wang and Y. Wang, Inorg. Chem., 2015, 55, 154–162 CrossRef.
- J. Cao, J. Peng, L. Wang, H. Luo, X. Wang, P. Xiong, Y. Wang and M. Peng, J. Mater. Chem. C, 2019, 7, 2076–2084 RSC.
- X. Zhang, J. Wang, L. Huang, F. Pan, Y. Chen, B. Lei, M. Peng and M. Wu, ACS Appl. Mater. Interfaces, 2015, 7, 10044–10054 CrossRef CAS.
- F. Kang, Y. Zhang and M. Peng, Inorg. Chem., 2015, 54, 1462–1473 CrossRef CAS.
- P. Dang, S. Liang, G. Li, Y. Wei, Z. Cheng, H. Lian, M. Shang, A. A. Al Kheraif and J. Lin, Inorg. Chem., 2018, 57, 9251–9259 CrossRef CAS.
- L. A. Diaz-Torres, J. Oliva, D. Chavez and C. R. Garcia, Ceram. Int., 2016, 42, 16235–16241 CrossRef CAS.
- W. Huang, Y. Tan, D. Li, H. Du, X. Hu, G. Li, Y. Kuang, M. Li and D. Guo, J. Lumin., 2019, 206, 432–439 CrossRef CAS.
- L. Li, J. Shen, Y. Pan, X. Zhou, H. Huang, W. Chang, Q. He and X. Wei, Mater. Res. Bull., 2016, 78, 26–30 CrossRef CAS.
- E. L. Cates, M. Cho and J. Kim, Environ. Sci. Technol., 2011, 45, 3680–3686 CrossRef CAS.
- Z. Sun, Y. Zhou and M. Li, J. Mater. Res., 2008, 23, 732–736 CrossRef CAS.
- M. Peng, X. Yin, P. A. Tanner, C. Liang, P. Li, Q. Zhang and J. Qiu, J. Am. Ceram. Soc., 2013, 96, 2870–2876 CrossRef CAS.
- S. Ho, H. Jang, S. Yang, K. Wook and Y. Ji, Adv. Mater., 2008, 20(14), 2696–2702 CrossRef.
- X. Wang, Z. Xue, Y. Shi and X. Jing, Dalton Trans., 2013, 42(14), 5167–5173 RSC.
- X. Ding, G. Zhu, W. Geng, Q. Wang and Y. Wang, Inorg. Chem., 2016, 55, 154–162 CrossRef CAS.
- S. Liang, M. Shang, H. Lian, K. Li, Y. Zhang and J. Lin, J. Mater. Chem. C, 2017, 5, 2927–2935 RSC.
- X. Wang, J. Wang, X. Li, H. Luo and M. Peng, J. Mater. Chem. C, 2019, 7, 11227–11233 RSC.
- S.-P. Lee, T.-S. Chan and T.-M. Chen, ACS Appl. Mater. Interfaces, 2014, 7, 40–44 CrossRef.
- J. Wang, M. Zhang, Q. Zhang, W. Ding and Q. Su, Appl. Phys. B: Lasers Opt., 2007, 87, 249–254 CrossRef CAS.
- H. Zeng, T. Zhou, L. Wang and R.-J. Xie, Chem. Mater., 2019, 31, 5245–5253 CrossRef CAS.
- C. Ji, Z. Huang, J. Wen, J. Zhang, X. Tian, H. He, L. Zhang, T.-H. Huang, W. Xie and Y. Peng, J. Alloys Compd., 2019, 788, 1127–1136 CrossRef CAS.
| This journal is © The Royal Society of Chemistry 2021 |

