 Open Access Article
An NADH-selective and sensitive fluorescence probe to evaluate living cell hypoxic stress†
Mingzhe
Li‡
a,
Chang
Liu‡
b,
Wenjuan
Zhang
b,
Longfei
Xu
c,
Miaomiao
Yang
a,
Zhaoli
Chen
a,
Xinxing
Wang
 a,
Lingling
Pu
a,
Weili
Liu
a,
Xianshun
Zeng
*b and
Tianhui
Wang
a,
Lingling
Pu
a,
Weili
Liu
a,
Xianshun
Zeng
*b and
Tianhui
Wang
 *a
*a
aTianjin Institute of Environmental and Operational Medicine, Tianjin 300050, China. E-mail: wydny668@163.com
bKey Laboratory of Display Materials and Photoelectric Devices, Ministry of Education, School of Materials Science & Engineering, Tianjin University of Technology, Tianjin, 300384, China. E-mail: xshzeng@tjut.edu.cn
cTianjin Key Laboratory of Exercise Physiology & Sports Medicine, Tianjin University of Sport, Tianjin 300381, China
First published on 5th November 2021
Abstract
Cellular disease and senescence are often accompanied by an imbalance in the local oxygen supply. Under hypoxia, mitochondrial NADH and FADH2 cannot be oxidized by the mitochondrial electron transport chain, which leads to the accumulation of reducing equivalents and subsequent reduction stress. Detecting changes in intracellular NADH levels is expected to allow an assessment of stress. We synthesized a red fluorescent probe, DPMQL1, with high selectivity and sensitivity for detecting NADH in living cells. The probe DPMQL1 has strong anti-interference abilities toward various potential biological interferences, such as metal ions, anions, redox species, and other biomolecules. In addition, its detection limit can reach the nanomolar level, meaning it can display small changes in NADH levels in living cells, so as to realize the evaluation of cell-based hypoxic stress.
Introduction
The cellular redox state is the central regulator of energy production and intermediary metabolism, playing a crucial role in health and disease.1 The nicotinamide adenine dinucleotide (NAD) derivatives NADH and NADPH (general term: NAD(P)H) play an important role in cellular metabolism and energy systems as electron carriers.2 NADH is generated by the tricarboxylic acid (TCA) cycle, with three NADH molecules produced per TCA cycle. In recent years, studies have shown that NADH also plays an important role in gene expression,3 immune function,4 cellular senescence5 and oxidative stress injury,6etc. Therefore, it is important to evaluate the concentration of NADH for an understanding of overall cellular energy metabolism.We pay special attention to the indicative role of NADH changes in cellular redox stress (oxidative stress and reductive stress). Although the mechanism of hypoxia producing stress in living cells is still controversial, a large number of studies have found that hypoxia can induce redox stress in living cells. Studies have confirmed that an important part of cell damage caused by chemical hypoxia-induced reductive stress seems to be the formation of ROS.7 Park et al. found that hypoxic perfusion of rat and rabbit hearts can cause significant increases in lipid peroxidation products, protein carbonyls and glutathione disulfide, which appear within 10 minutes of exposure, and continue to rise after 90 minutes of hypoxia.8 In addition, there are similar findings in various cell preparations using ROS-sensitive fluorescent probes.9 Accumulating evidence shows that hypoxic stress increases the levels of cellular NADH in most mammalian cells,7,10 and excessive NAD(P)H is considered to be a sign of reducing stress.11,12 In addition, there is also evidence that the increase of ROS accumulation in mitochondria is positively correlated with an increase of the NADH/NAD+ ratio.7,13 In hypoxia, mitochondrial NADH and FADH2 cannot be oxidized by the mitochondrial electron transport chain (ETC), which leads to the accumulation of reducing equivalents and subsequent reduction stress.7,13,14 Reduction stress causes the single electron reduction of oxygen to form O2˙−, which leads to an increase in the production of reactive oxygen species under hypoxia.7,13,14 Oldham et al. found that, compared with normoxic cells (21% O2), primary human lung fibroblasts cultured under hypoxia (0.2% O2) had increased NADH levels and produced significantly higher levels of mitochondrial ROS.13 In bovine coronary artery smooth muscle cells, hypoxia increased the levels of mitochondrial ROS and NAD(P)H, and at the same time increased the NADH/NAD+ ratio.15 Therefore, it is expected to realize the evaluation of cell stress by detecting the change of NADH level. However, NAD(P)H is a highly reducible dynamic molecule with a high reactivity and instability, and it is difficult to detect in cells and animal models. Therefore, it is necessary to establish an ultra-sensitive, rapid, and selective method for measuring NAD(P)H in vivo to study reducing stress.12
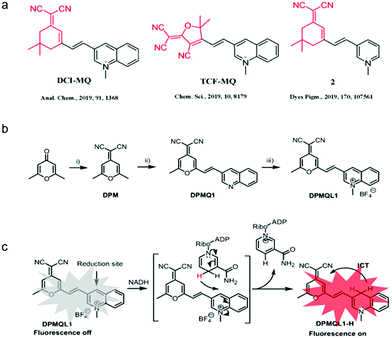
Due to the vital importance of NAD(P)H, several analytic methods are currently available for the determination of NADH, including the enzyme-based method,16 chromatography,17 capillary electrophoresis,18 and the electrochemical method,19 and even for the indirect determination of various analytes, like glucose, ethanol and lactic acid, owing to its oxido-reductive properties.20 Furthermore, the intrinsic fluorescence of NADH has been used in the quantification and imaging of biological samples;20 however, its short excitation/emission wavelength can be easily interfered with by other biomolecules, such as proteins. Thus, colorimetric and fluorescent chemical indicators via trapping the change of optical output induced by the target analyte are widely used. To date, a number of indicators, including gold nanoparticles,21 quantum dot (QD) conjugates,22 and genetically encoded fluorescent sensors,23 have been applied for the determination of NADH. However, to the best of our knowledge, only several small molecular fluorescence probes for NADH have been reported by several research groups, such as the teams of Pan, Wang, Komatsu, etc., based on the reaction of 1-methyl-quinoline that responds to the increased NADH by enhancement of the fluorescence intensity;12,24,25 Podder et al. reported a naphthimide-based dual-channel fluorescent probe (NQN) for locating NADH levels in living cells through multicolor images.26,27 Moreover, among these molecular probes, those containing dicyanoisophorone/TCF hemicyanine probes (Scheme 1a) exhibited some unique superiorities as the NIR fluorescent chromophore. Thus, the development of a small molecule fluorescent probe for the detection and imaging of NADH in living cells is an interesting topic in the field of chemical biology and it is also worth trying to realize the assessment of hypoxic stress by detecting NADH in living cells.
Results and discussion
Construction of a NADH fluorescent probe with high selectivity and sensitivity
The synthetic routes for the probe DPMQL1 are shown in Scheme 1b. The compound DPM (2,6-(dimethyl-4H-pyran-4-ylidene) malononitrile) was prepared according to the published procedures.28DPMQ1 was synthesized by the condensation reaction of DPM and quinolone-3-carboxaldehyde in the presence of a catalytic amount of piperidine in CH3CN. Finally, the probe DPMQL1 was obtained by the N-methylation reaction of DPMQ1 and CH3I in dry acetonitrile. The chemical structures of DPMQ1 and DPMQL1 were confirmed by 1H, 13C NMR, and HRMS spectroscopy (ESI,† Fig. S1–S7).Initially, the electron absorption and fluorescence emission spectra of DPMQL1 and those in the presence of NADH were carried out. Due to the electron-deficient property of the fluorophore, the free probe DPMQL1 only showed a very weak π–π transition absorption band at ca. 525 nm (ε = 5600 M−1 cm−1) and a weak fluorescence emission band with the maxima at ca. 600 nm, respectively (Fig. S8, ESI†). With the addition of NADH (10 equiv.) to the solution of DPMQL1, the maxima absorption band at 528 nm (ε = 24![[thin space (1/6-em)]](https://www.rsc.org/images/entities/char_2009.gif) 100 M−1 cm−1) increased significantly. At the same time, a visual color change from light pink to bright pink was observed upon the addition of NADH (Fig. S9, ESI†), allowing for the naked-eye detection of NADH. In the presence of NADH, DPMQL1 displayed a gradually enhanced red emission as the incubation time was prolonged at an excitation of 510 nm (Fig. S10 and S11, ESI†). The relative fluorescence intensity reached a plateau after 60 min. The probe DPMQL1 showed a prominent enhanced emission band centered at 624 nm (Fig. S8b, ESI†). The peak-to-peak Stokes shift is over 100 nm. The large Stokes shift is favorable for bioapplications. The results of the prominent fluorescence change upon interaction with NADH suggested that DPMQL1 could function as a fluorescence turn-on chemosensor for the detection of NADH.
100 M−1 cm−1) increased significantly. At the same time, a visual color change from light pink to bright pink was observed upon the addition of NADH (Fig. S9, ESI†), allowing for the naked-eye detection of NADH. In the presence of NADH, DPMQL1 displayed a gradually enhanced red emission as the incubation time was prolonged at an excitation of 510 nm (Fig. S10 and S11, ESI†). The relative fluorescence intensity reached a plateau after 60 min. The probe DPMQL1 showed a prominent enhanced emission band centered at 624 nm (Fig. S8b, ESI†). The peak-to-peak Stokes shift is over 100 nm. The large Stokes shift is favorable for bioapplications. The results of the prominent fluorescence change upon interaction with NADH suggested that DPMQL1 could function as a fluorescence turn-on chemosensor for the detection of NADH.
Subsequently, the sensitivity of the probe DPMQL1 was studied by fluorescence spectra. As shown in Fig. 1, DPMQL1 emitted a weak fluorescence emission band at 624 nm. The fluorescence intensity at 624 nm gradually increased with increasing concentrations of NADH (0–55 μM) (Fig. S12, ESI†). The fluorescence turn-on constant K derived from the titrations was found to be 1.52 ± 0.74 μM (R2 = 0.995) (Fig. S13, ESI†). The detection limit (LOD) of DPMQL1 (3σ/K) was estimated to be 0.36 nM (Fig. S14, ESI†). This is particularly beneficial for applications in cell-based assays as intracellular NADH concentrations typically lie in the millimole range.29 The results indicated that DPMQL1 could serve as a highly sensitive red fluorescence probe for the detection of NADH. The proposed optical responses of the probe DPMQL1 towards NADH are shown in Scheme 1c (Table S1 and Fig. S15, ESI†).
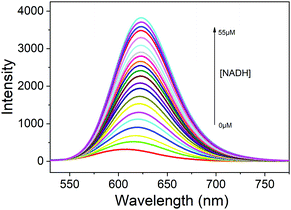 | ||
Fig. 1 Fluorescence spectra of DPMQL1 (5 μM) with different concentrations of NADH (0–55 μM) in PBS–EtOH (PBS, 10 mM, pH = 7.4, 1![[thin space (1/6-em)]](https://www.rsc.org/images/entities/char_2009.gif) : :![[thin space (1/6-em)]](https://www.rsc.org/images/entities/char_2009.gif) 1, v/v). λex: 510 nm, slit width: 5 nm. 1, v/v). λex: 510 nm, slit width: 5 nm. | ||
The feature of selectivity over potentially competing species is very important for the application of a probe. Therefore, we chose commonly found metal ions in the living cell, certain reactive nitrogen species, ROS, thiols, and various amino acids as references to investigate the NADH selectivity of the probe DPMQL1 (Fig. S9, ESI†). The addition of possible disturbing relevant species, including Zn2+, Ca2+, Cu2+, Fe2+, Fe3+, K+, Mg2+, Na+, H2O2, HOCl, NADH, NAD(P)H, NO, NO2−, O2˙−, ONOO−, TBHP, Arg, Cys, Glu, GSH, Hcy, His, Leu, Lys, Met, Phe, Pro, Ser, Thr, Try, Tyr, Val, H2S, did not induce any major change in the fluorescence intensity at 624 nm. However, as shown in Fig. 2, the presence of GSH, Cys, and Hcy can cause a slight increase in the fluorescence signal at 624 nm, which may be due to the strong reduction of thiol groups. Notably, SO32− had a considerably higher fluorescence intensity change than that of other thiols, because 1-methyl-quinoline can reaction with SO32− as the recognition unit.30 But it is still negligible compared with that of NADH because of its low in vivo concentration.31,32 In contrast, DPMQL1 showed an obvious increase in fluorescence at 624 nm with the addition of NADH. The results of the fluorescence data confirmed that DPMQL1 had a high selectivity with a specific response to NADH, not markedly influenced by biologically relevant species.
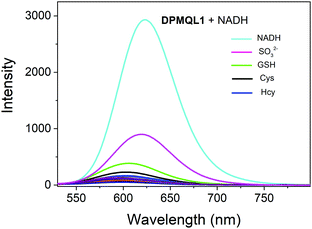 | ||
Fig. 2 Fluorescence response of DPMQL1 (5 μM) to various biological species (50 μM) in PBS–EtOH (PBS, 10 mM, pH = 7.4, 1![[thin space (1/6-em)]](https://www.rsc.org/images/entities/char_2009.gif) : :![[thin space (1/6-em)]](https://www.rsc.org/images/entities/char_2009.gif) 1, v/v). λex: 510 nm, slit width: 5 nm. 1, v/v). λex: 510 nm, slit width: 5 nm. | ||
To further establish the workability of DPMQL1 in competitive medium, anti-interference studies were also carried out by adding 50 μM of other related species to the solution of DPMQL1. After the addition of 50 μM NADH, other analyte species added showed negligible interference with the detection of NADH (Fig. S16, ESI†), which clearly authenticated that the probe DPMQL1 can selectively determine NADH in complex samples. The pH experimental results showed that the probe displayed a distinct increase in the fluorescence signal at 624 nm in the pH range of 4–9 in the presence of NADH (Fig. 3). The results indicated that DPMQL1 could be applied for the detection of NADH changes in complex biological environments.
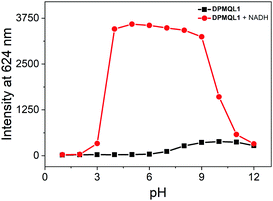 | ||
Fig. 3 The pH dependence of DPMQL1 (5 μM) at 624 nm in the absence and presence of NADH (50 μM) in PBS–EtOH (PBS, 10 mM, 1![[thin space (1/6-em)]](https://www.rsc.org/images/entities/char_2009.gif) : :![[thin space (1/6-em)]](https://www.rsc.org/images/entities/char_2009.gif) 1, v/v) solution. λex: 510 nm, slit width: 5 nm. 1, v/v) solution. λex: 510 nm, slit width: 5 nm. | ||
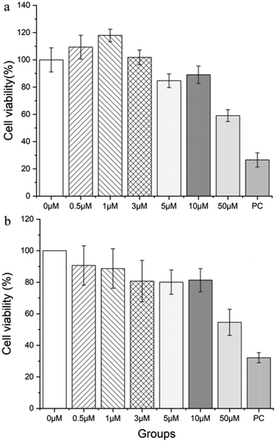
To evaluate the applicability of DPMQL1 for the analysis of intracellular NADH, we further explored the detection ability of DPMQL1 in living cells by fluorescence imaging. At first, the cellular toxicity of DPMQL1 was evaluated by MTT and CCK-8 assays. Two kinds of cells (HeLa and PC12 cells) were incubated with DPMQL1 (0–50 μM) for 24 h. As shown in Fig. 4, more than 80% of the HeLa cells still survived when 10 μM DPMQL1 was incubated for 24 h. When the concentration of the probe reached 50 μM, the cell viability dropped to about 60%, but it was still better than that of the positive control. The results showed that the probe DPMQL1 could be used for living cell imaging with concentrations lower than 10 μM.
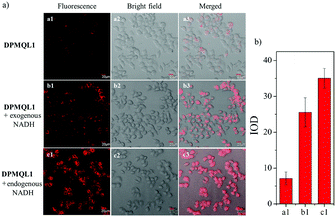
Then, we investigated the fluorescence imaging ability of DPMQL1 to detect NADH in living cells. As shown in Fig. 5a1, HeLa cells incubated with DPMQL1 (0.2 μM) for 30 min at 37 °C showed a weak fluorescence signal in the red fluorescence channel (582–682 nm). However, after the administration of NADH (2 μM) and then incubation for another 30 min, the fluorescence intensity in the red channel increased obviously (Fig. 5b1). Furthermore, after the HeLa cells were incubated with glucose (20 mM) to stimulate the increased levels of endogenous NADH for 30 min, the fluorescence intensity in the red channel increased markedly (Fig. 5c1). As can be seen from Fig. 5b, compared with the untreated HeLa cells, there are over 4-fold fluorescence enhancements of those being treated with exogenous NADH or the glucose stimulated one. These results indicated that DPMQL1 was confirmed to be competent for imaging NADH in living cells in a fluorescence turn-on manner.
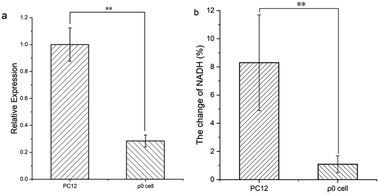
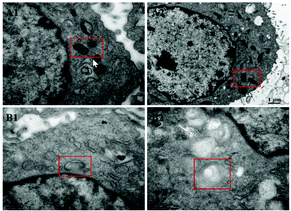
To verify the ability of DPMQL1 to detect changes in NADH levels in the mitochondrial respiratory chain, we constructed a cell with mitochondrial gene deletion33 (ρ0 PC12 cell, Fig. 6a and 7) and further explored the difference in fluorescence imaging monitoring capabilities of DPMQL1 in PC12 wild-type cells and ρ0 cells. As shown in Fig. 6b, wild-type PC12 cells and ρ0 cells were incubated with glucose (20 mM) for 30 minutes, and then the endogenous NADH level increased, but the endogenous NADH level of the ρ0 cells changed less than that of the PC12 cells. It can be seen that the fluorescence imaging effect of DPMQL1 is related to the function of mitochondria, and DPMQL1 can detect the level of NADH on the mitochondrial respiratory chain.
Application of the probe: evaluating the levels of hypoxic stress at the cellular level
We used DPMQL1 to detect the changes in cellular NADH levels after hypoxic stress, and then preliminarily evaluated the degree of cell stress. Three types of cells (PC12, H9C2, Scc-25) were incubated in a hypoxic incubator (37 °C, 5.0% CO2, 1.0% O2) for 8 hours, 12 hours, and 24 hours, respectively, and then incubated with DPMQL1 (0.2 μM) at 37 °C for 30 minutes. As shown in Fig. 8a, compared with the untreated PC12 cells, the cellular NADH levels increased significantly with a prolonged period of hypoxia. As can be seen from Fig. 8b and c, short-term hypoxia intervention has no obvious effect on the NADH levels in the H9C2 and Scc-25 cells, but after prolonging the hypoxia period, the cellular NADH levels increase significantly. These results indicate that DPMQL1 can evaluate hypoxic stress by detecting changes of cellular NADH levels.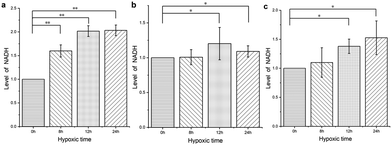 | ||
| Fig. 8 DPMQL1 is used to detect changes in the NADH levels in three kinds of cells after hypoxic stress: (a). PC12 cells; (b). H9C2 cells; and (c). Scc-25 cells. *: p < 0.05, **: p < 0.01. | ||
Conclusions
In summary, a red emissive fluorescent probe DPMQL1 comprising two electron-withdrawing groups, namely a malononitrile moiety and a chinolinium moiety, for the detection of NADH was prepared. The probe displayed weak fluorescence before the reaction with NADH. Based on changes in the internal charge transfer (ICT) process triggered specifically by NADH, the probe showed a strong fluorescence turn-on response. Compared with most NADH fluorescent probes of the same type, DPMQL1 has higher sensitivity (LOD = 0.36 nM) and it can accurately detect small changes in NADH levels caused by reduction stress. DPMQL1 has high selectivity and effects from most interferent (including NADPH) that may exist in organisms are eliminated. Moreover, the probe is membrane-permeable and can detect fluctuations in NADH levels in the mitochondria of living cells. Due to hypoxia, mitochondrial NADH and other reduced equivalents cannot be oxidized by ETC, which ultimately leads to an increase in the production of reactive oxygen species. Therefore, we speculate that the level of NADH in mitochondria can reflect the degree of cellular hypoxic stress. We used the probe DPMQL1 to evaluate the hypoxic stress in three kinds of cells, and the results showed that with an extension of the hypoxia time, the intracellular NADH level showed an upward trend, that is, cell hypoxic stress can be detected via detecting the intracellular NADH level. We will continue to explore the application of such probes in order to better realize the evaluation of the pathophysiological states of organisms.Author contributions
Mingzhe Li: Data curation, methodology, validation and roles/writing – original draft; Chang Liu: data curation, methodology and roles/writing – original draft; Wenjuan Zhang: data curation, validation and methodology; Longfei Xu: formal analysis and software; Miaomiao Yang: formal analysis and software; Zhaoli Chen: investigation, methodology and supervision; Xinxing Wang: visualization and writing – review & editing; Lingling Pu: conceptualization, data curation and formal analysis; Weili Liu: supervision and writing – review & editing; Xianshun Zeng: funding acquisition, project administration, resources and supervision; Tianhui Wang: funding acquisition, project administration, resources, supervision and writing – review & editing.Conflicts of interest
The authors declare that they have no known competing financial interests or personal relationships that could have appeared to influence the work reported in this paper.Acknowledgements
We gratefully acknowledge the Natural Science Foundation of China (NSFC 81373108, 21907075, 21272172) and the Natural Science Foundation of Tianjin (19JCZDJC32400, 18JCQNJC75900).Notes and references
- C. Cantó, K. J. Menzies and J. Auwerx, Cell Metab., 2015, 22, 31–53 CrossRef PubMed.
- J. H. Joo, D. Youn, S. Y. Park, D.-S. Shin and M. H. Lee, Dyes Pigm., 2019, 170, 107561 CrossRef CAS.
- F. Malavasi, S. Deaglio, A. Funaro, E. Ferrero, A. L. Horenstein, E. Ortolan, T. Vaisitti and S. Aydin, Physiol. Rev., 2008, 88, 841–886 CrossRef CAS PubMed.
- L. Alberghina and D. Gaglio, Cell Death Dis., 2014, 5, e1561 CrossRef CAS PubMed.
- H. Teng, M. Lv, L. Liu, X. Zhang, Y. Zhao, Z. Wu and H. Xu, Sensors, 2017, 17(4), 788 CrossRef PubMed.
- S. Li, C. Y. Lo, M. H. Pan, C. S. Lai and C. T. Ho, Food Funct., 2013, 4, 10–18 RSC.
- T. L. Clanton, J. Appl. Physiol., 1985, 2007(102), 2379–2388 Search PubMed.
- Y. Park and J. P. Kehrer, Free Radical Res. Commun., 1991, 14, 179–185 CrossRef CAS PubMed.
- T. Vanden Hoek, L. B. Becker, Z. H. Shao, C. Q. Li and P. T. Schumacker, Circ. Res., 2000, 86, 541–548 CrossRef CAS PubMed.
- W. Xiao, R. S. Wang, D. E. Handy and J. Loscalzo, Antioxid. Redox Signaling, 2018, 28, 251–272 CrossRef CAS PubMed.
- A. C. Brewer, S. B. Mustafi, T. V. Murray, N. S. Rajasekaran and I. J. Benjamin, Antioxid. Redox Signaling, 2013, 18, 1114–1127 CrossRef CAS PubMed.
- X. Pan, Y. Zhao, T. Cheng, A. Zheng, A. Ge, L. Zang, K. Xu and B. Tang, Chem. Sci., 2019, 10, 8179–8186 RSC.
- W. M. Oldham, C. B. Clish, Y. Yang and J. Loscalzo, Cell Metab., 2015, 22, 291–303 CrossRef CAS PubMed.
- M. Nakane, Intensive Care Med., 2020, 8, 95 Search PubMed.
- Q. Gao and M. S. Wolin, Am. J. Physiol., 2008, 295, H978–H989 CAS.
- H. Gao, J. Li, D. Sivakumar, T. S. Kim, S. K. S. Patel, V. C. Kalia, I. W. Kim, Y. W. Zhang and J. K. Lee, Int. J. Biol. Macromol., 2019, 123, 629–636 CrossRef CAS PubMed.
- W. Xie, A. Xu and E. S. Yeung, Anal. Chem., 2009, 81, 1280–1284 CrossRef CAS.
- J. Liang, W. Wei, H. Yao, K. Shi and H. Liu, Phys. Chem. Chem. Phys., 2019, 21, 24572–24583 RSC.
- M. Thiruppathi, P. Y. Lin, Y. T. Chou, H. Y. Ho, L. C. Wu and J. A. Ho, Talanta, 2019, 200, 450–457 CrossRef CAS PubMed.
- A. Podder, S. Koo, J. Lee, S. Mun, S. Khatun, H. G. Kang, S. Bhuniya and J. S. Kim, Chem. Commun., 2019, 55, 537–540 RSC.
- Z. Wang, Q. Chen, Y. Zhong, X. Yu, Y. Wu and F. Fu, Anal. Chem., 2020, 92, 1534–1540 CrossRef CAS PubMed.
- D. S. Bilan and V. V. Belousov, Free Radical Biol. Med., 2016, 100, 32–42 CrossRef CAS PubMed.
- Y. Zhao, K. Wei, F. Kong, X. Gao, K. Xu and B. Tang, Anal. Chem., 2019, 91, 1368–1374 CrossRef CAS.
- L. Wang, J. Zhang, B. Kim, J. Peng, S. N. Berry, Y. Ni, D. Su, J. Lee, L. Yuan and Y. T. Chang, J. Am. Chem. Soc., 2016, 138, 10394–10397 CrossRef CAS PubMed.
- H. Komatsu, Y. Shindo, K. Oka, J. P. Hill and K. Ariga, Angew. Chem., Int. Ed., 2014, 53, 3993–3995 CrossRef CAS PubMed.
- A. Podder, V. P. Murali, S. Deepika, A. Dhamija, S. Biswas, K. K. Maiti and S. Bhuniya, Anal. Chem., 2020, 92, 12356–12362 CrossRef CAS PubMed.
- A. Podder, N. Thirumalaivasan, Y. K. Chao, P. Kukutla, S.-P. Wu and S. Bhuniya, Sens. Actuators, B, 2020, 324, 128637 CrossRef CAS.
- S. Cai, Y. Lu, S. He, F. Wei, L. Zhao and X. Zeng, Chem. Commun., 2013, 49, 822–824 RSC.
- N. Karton-Lifshin, L. Albertazzi, M. Bendikov, P. S. Baran and D. Shabat, J. Am. Chem. Soc., 2012, 134, 20412–20420 CrossRef CAS PubMed.
- Z. Meng, R. Li and X. Zhang, Inhalation Toxicol., 2005, 17, 309–313 CrossRef CAS PubMed.
- D. Li, X. Tian, Z. Li, J. Zhang and X. Yang, J. Agric. Food Chem., 2019, 67, 3062–3067 CrossRef CAS PubMed.
- H. Li, Anal. Chim. Acta, 2015, 897, 102–108 CrossRef CAS PubMed.
- D. J. Scarlett, P. Herst, A. Tan, C. Prata and M. Berridge, BioFactors, 2004, 20, 199–206 CrossRef PubMed.
Footnotes |
| † Electronic supplementary information (ESI) available. See DOI: 10.1039/d1tb01927a |
| ‡ The authors contributed equally to the work. |
| This journal is © The Royal Society of Chemistry 2021 |

