Riboflavin-based carbon dots with high singlet oxygen generation for photodynamic therapy†
Received
7th June 2021
, Accepted 9th July 2021
First published on 15th July 2021
Abstract
Photodynamic therapy, as an effective treatment for superficial tumors, has attracted more and more attention. The development of safe, biocompatible and in vivo photosensitive materials is helpful to promote photodynamic therapy. Here we report green fluorescent carbon quantum dots prepared from a natural vitamin, riboflavin (VB2), as a photosensitizer. The VB2-based carbon dots have excellent water solubility and biocompatibility, and their singlet oxygen generation ability is much stronger than that of riboflavin itself. Through endocytosis, the carbon dots can easily enter the cells and show bright green fluorescence. In vivo experiments show that after photodynamic therapy the carbon dots can significantly inhibit the growth of tumors, and will not have toxic and side effects on other organs.
1. Introduction
Photodynamic therapy (PDT) is a non-invasive and promising highly-selective treatment for cancers, in which production of singlet oxygen (1O2) or other reactive oxygen species (ROS) is stimulated by photosensitizers enriched in the tumor site through light irradiation to destroy biological macromolecules, thereby achieving the selective killing of cancer cells.1–3 Compared with traditional therapies, PDT has the advantages of less trauma, lower drug toxicity, better selectivity, a wide application range, no drug resistance, and fewer side effects.4,5 In clinics, PDT has been used to treat oral cancer, esophageal cancer, bladder cancer, and rectal cancer.6–8 As we all know, the key to PDT is photosensitizers.9–11 And the commonly used photosensitizers include porphyrin compounds,12 phenothiazine compounds,13 fluoroboron compounds,14 cyanine compounds,15 and heavy metal complexes.16,17 However, the poor water solubility of traditional photosensitizers, such as organic dyes, limits their efficient application in vivo.18 As an emerging nanomaterial, carbon dots (CDs) have the advantages of good water solubility, good biocompatibility, and adjustable optical properties.19–24 Previous studies have shown that some functional CDs have been developed as photosensitizers for PDT of cancers.25–27 Han et al. reported graphene quantum dots prepared using polythiophene with a singlet oxygen generation yield of >1.3.28 As we know, the biocompatibility of polythiophene is not good, so in this work, we chose a natural material, riboflavin, as a carbon source to prepare carbon quantum dots. Riboflavin, also known as VB2, is one of the essential vitamins for the human body.29,30 It is safe and non-toxic, and has been used in the study of PDT for bacterial infections.31 However, the ultra-low water solubility (up to 0.08 mg mL−1) of VB2 limits its application as a photosensitizer in vivo.32 Fortunately, when VB2 was prepared into CDs, the optical properties of VB2 were partially retained, and the water solubility and fluorescence quantum yield were greatly improved, so that the prepared CDs exhibited good biosafety and biocompatibility. The VB2-based CDs can easily enter into the cells through endocytosis,33 where O2 can be stimulated into 1O2 under irradiation, so as to realize an anti-tumor effect (Scheme 1). Both in vivo and in vitro experiments showed the good singlet oxygen generation ability of the VB2-based CDs, revealing the clinical application potential of PDT.
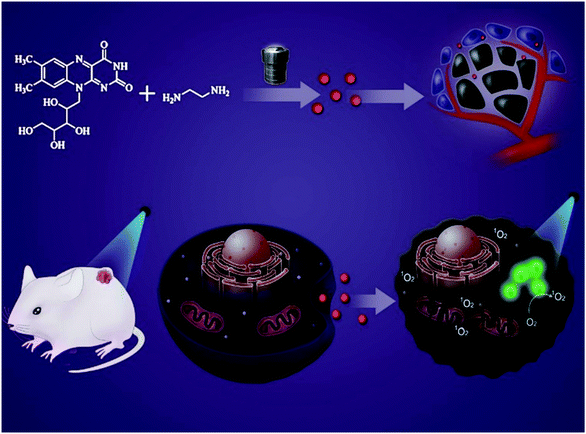 |
| | Scheme 1 Illustration for the preparation of CDs and their use in PDT of cancer cells. | |
2. Experimental
2.1 Materials and instruments
All chemicals used for CD synthesis were purchased from Sigma Aldrich without further purification. Transmission electron microscopy (TEM) images and high-resolution TEM (HRTEM) images were taken on a JEOL JEM-2100 microscope. Fourier transform infrared spectroscopy (FT-IR) spectra were collected with an EQUINOX 55 instrument. Absorption and fluorescence spectra were recorded on a UV-vis spectrophotometer (Hitachi, U-3900H) and a fluorescence spectrophotometer (Hitachi, F-7000), respectively. X-Ray photoelectron spectra (XPS) were recorded using an AXIS Ultra DLD spectrometer.
2.2 Synthesis
CDs were prepared by a one-step hydrothermal method. 300 mg riboflavin and 1 mL ethylenediamine were dissolved in 20 mL ultrapure water, and the solution was transferred to a Teflon-lined autoclave for heating for 6 hours at 180 °C. After the reaction, the solid impurities were removed by centrifugation, and the product was filtered using a 0.22 μm membrane filter and then transferred to a dialysis bag (Mw = 1000) for 12 hours. The liquid in the dialysis bag was lyophilized for standby.
2.3 Cell cytotoxicity assessment
Briefly, 4T1 cells were seeded into 96-well plates (6 × 10³ cells per well) at 37 °C under 5% CO2 in RPMI 1640 medium and treated with CDs at different concentrations (50–400 μg mL−1) for 24 h. The cells were then washed three times with phosphate-buffered saline (PBS), and 10 μL of CCK-8 in PBS solution was slowly injected into each well. After 2 h, the optical density was measured, and the cell viability of the control group was calculated based on CCK-8 data.
2.4 Cellular imaging
The 4T1 cells were inoculated on the cell dishes at a density of 2 × 10⁴ cells per well in RPMI-1640 medium supplemented with 10% (v/v) heat-inactivated fetal bovine serum with 5% CO2 at 37 °C. Then, CD solution (100 μg mL−1) was added to the cells and incubated for 20 h. After washing the cells three times, the fluorescence of the samples was observed using a confocal laser fluorescence microscope.
2.5 Antitumor effects in 4T1-bearing mice
4T1-bearing mice were randomly assigned to 4 groups (n = 5), after the tumor reached about 100 mm3. The mice in each group were peritumorally injected with different materials (PBS or CDs) every two days (dose per injection: 10 μg CDs per mice). 12 h after injection, mice in some groups were exposed to UV irradiation (365 nm, 60 mW cm−2) for 10 minutes. The body weight of the mice and the tumor volume were recorded daily during the treatment. The tumor volume was calculated according to the formula: volume (mm3) = (length)(width)2/2.
2.6 H&E and TUNEL assays
After 14 days of treatment, the mice were sacrificed and the tumor and the major organs (heart, liver, spleen, lungs, and kidneys) were harvested. Tissues were sectioned, stained with H&E and observed with an optical microscope. Tumor sections were also stained with TUNEL and observed by confocal laser scanning microscopy (CLSM).
3. Results and discussion
3.1 Synthesis and characterization of CDs
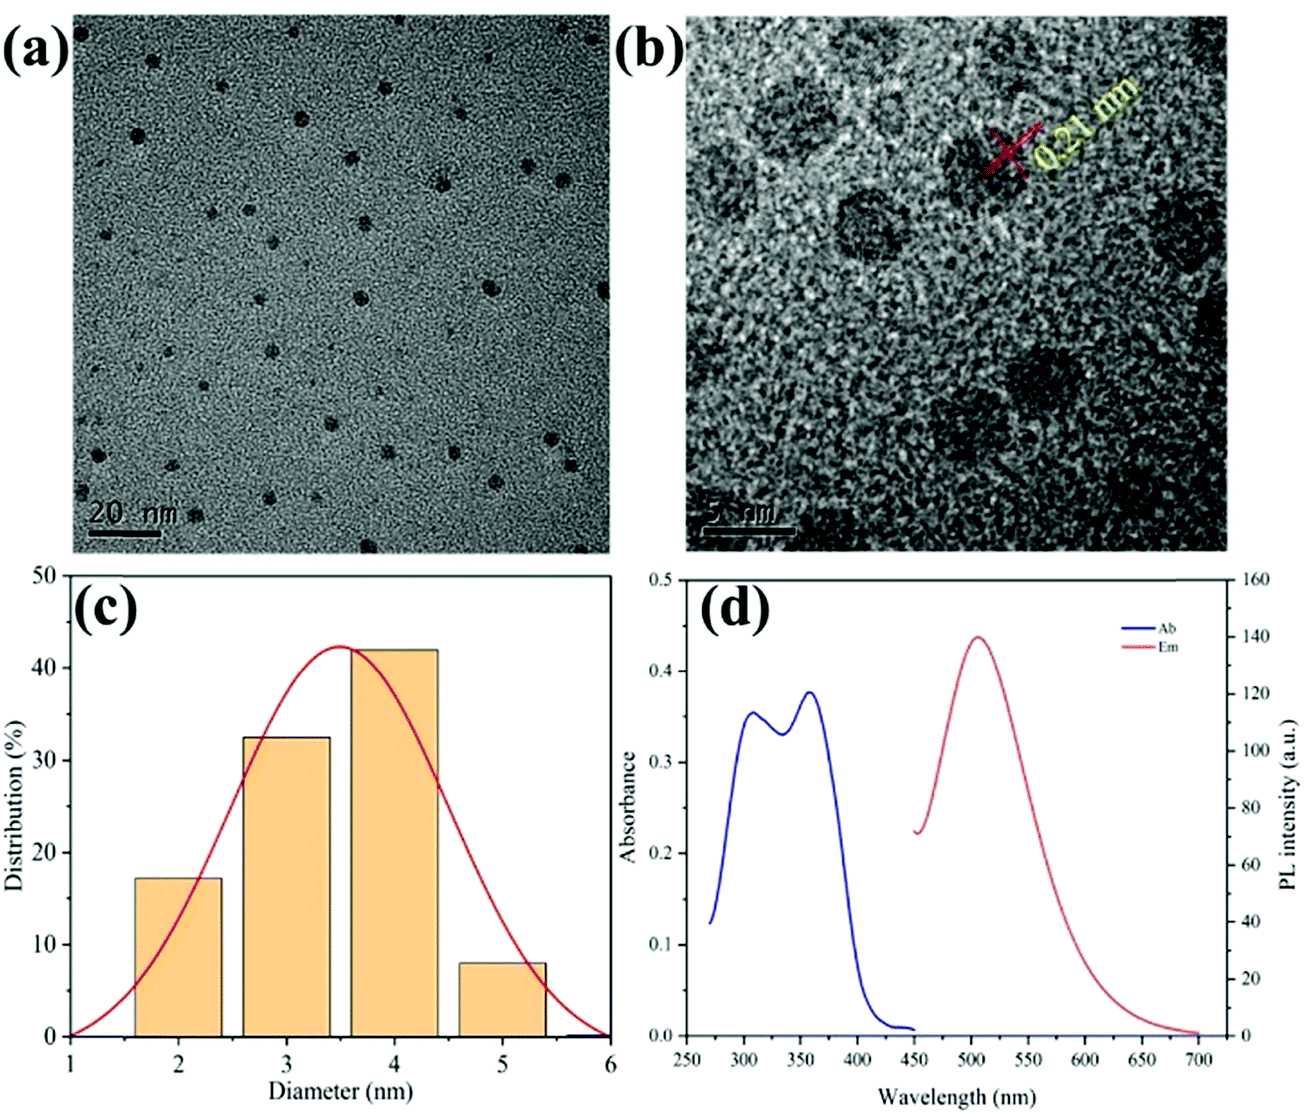
CDs were prepared using a conventional one-step hydrothermal method, using riboflavin as a carbon source and ethylenediamine as a cross-linking agent. By comparing the state of the solution before and after the reaction (Fig. S1, ESI†), it can be seen that the solubility of CDs in water (above 10 mg mL−1) is much higher than that of riboflavin, which makes them applicable to cell experiments or in vivo experiments. Fig. 1 shows the structural properties of the as-prepared CDs. The transmission electron microscopy (TEM) image in Fig. 1a shows that the CDs are uniform spherical nanoparticles with good dispersion, and the size of a single particle is about 3–4 nm. The high resolution TEM image in Fig. 1b shows that the maximum size of a single nanoparticle is less than 4 nm, and its surface has lattice fringes of 0.21 nm, which are consistent with the lattice spacings of the (100) planes of graphite. Dynamic light scattering (DLS) shows that the particle size distribution of most CDs is in the range of 2–5 nm (Fig. 1c), which is consistent with the TEM results. Fig. 1d shows the absorption and emission spectra. The absorption range of the CDs is from 280 nm to 400 nm, with two main peaks at 310 nm and 365 nm, respectively. Under 365 nm irradiation, the fluorescence emission peak is about 502 nm, which is the reason why the CD solution appears bright green under ultraviolet light. A Fourier transform infrared spectroscopy (FT-IR) spectrum of CDs is shown in Fig. S2 (ESI†). The peaks between 3300 cm−1 and 3650 cm−1 are attributed to ν(–NH2) and ν(–OH); the two peaks at 3067 cm−1 and 2945 cm−1 originate from ν(![[double bond, length as m-dash]](https://www.rsc.org/images/entities/char_e001.gif) C–H) and ν(–C–H), respectively; the peak at 1655 cm−1 is caused by the stretching vibration of the (–CO) bond; and ν(–CC–) causes a peak at 1532 cm−1. The entire FT-IR spectrum confirms that the CDs have amino groups, hydroxyl groups, and unsaturated bonds (such as carbonyl and olefin bonds), indicating that the prepared CDs are rich in hydrophilic groups and retain the partial structure of the raw material – riboflavin. The X-ray photoelectron spectroscopy (XPS) further confirms the presence of hydroxyl, carbonyl and amino groups in the CDs (Fig. S3, ESI†). For O 1s, the two main peaks are located at 531.9 eV and 530.7 eV, respectively, corresponding to carbonyl O and quinone O. For N 1s, the peaks at 440.4 eV and 399.5 eV are derived from graphitic N and amino N. And the C 1s spectrum can be divided into three peaks, located at 287.4 eV (–CO), 285.7 eV (–C–O–), and 284.3 eV (–C–C–, –CC–). Overall, it can be seen that the CDs have a graphene structure (doped with N atoms) with a highly oxidized surface.
C–H) and ν(–C–H), respectively; the peak at 1655 cm−1 is caused by the stretching vibration of the (–CO) bond; and ν(–CC–) causes a peak at 1532 cm−1. The entire FT-IR spectrum confirms that the CDs have amino groups, hydroxyl groups, and unsaturated bonds (such as carbonyl and olefin bonds), indicating that the prepared CDs are rich in hydrophilic groups and retain the partial structure of the raw material – riboflavin. The X-ray photoelectron spectroscopy (XPS) further confirms the presence of hydroxyl, carbonyl and amino groups in the CDs (Fig. S3, ESI†). For O 1s, the two main peaks are located at 531.9 eV and 530.7 eV, respectively, corresponding to carbonyl O and quinone O. For N 1s, the peaks at 440.4 eV and 399.5 eV are derived from graphitic N and amino N. And the C 1s spectrum can be divided into three peaks, located at 287.4 eV (–CO), 285.7 eV (–C–O–), and 284.3 eV (–C–C–, –CC–). Overall, it can be seen that the CDs have a graphene structure (doped with N atoms) with a highly oxidized surface.
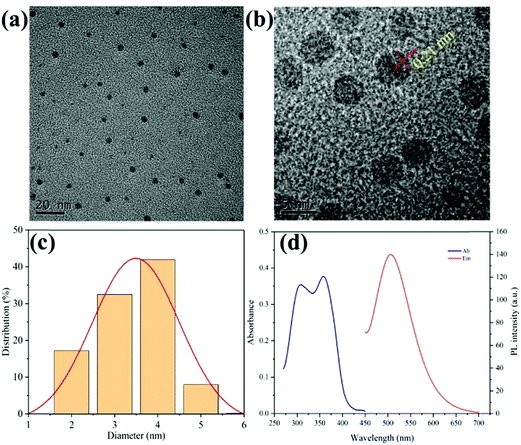 |
| | Fig. 1 Structural properties of CDs. (a) TEM image of CDs, the scale bar is 20 nm; (b) HR-TEM image of CDs, the scale bar is 5 nm; (c) size distribution of CDs; and (d) UV-vis absorption (red line) and PL emission (blue line) spectra of CDs. | |
At the same time, the stability of CDs was also tested. Firstly, because the CDs are prepared at 180 °C, the temperature below 100 °C does not affect the fluorescence intensity (Fig. S4a, ESI†). Secondly, the CDs have good pH stability. When the pH is 8 or 9, the CDs have the strongest fluorescence emission. And when the pH is higher or lower, the fluorescence attenuation does not exceed 20% (Fig. S4b, ESI†). Thirdly, the long-term stability of the CDs is also very good. After 2 weeks of storage, the fluorescence of the CDs almost does not decrease (Fig. S4c, ESI†), and the singlet oxygen generation ability of the CDs remains above 80% of the initial value (Fig. S4d, ESI†).
3.2 Generation of singlet oxygen by CDs
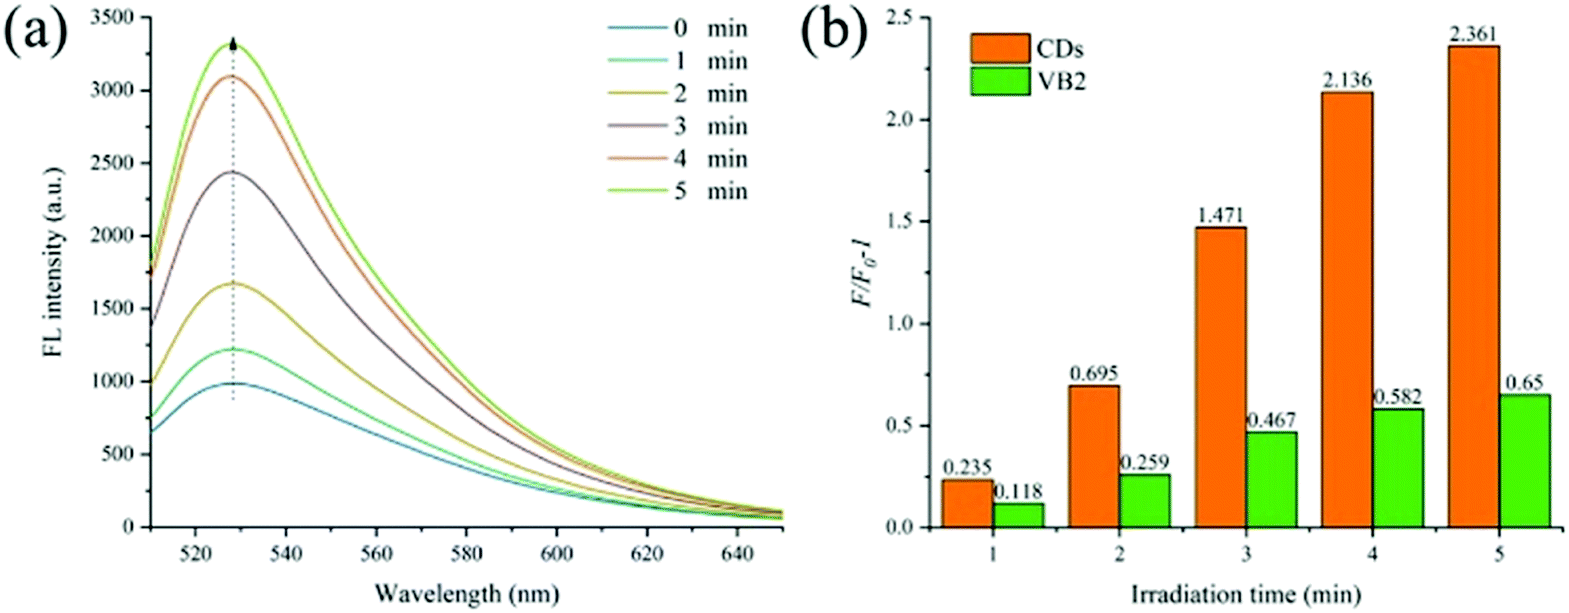
In order to explore the photosensitivity of CDs, singlet oxygen sensor green (SOSG) was used to detect the generation of singlet oxygen by CDs (the fluorescence intensity of SOSG at 528 nm is directly related to the concentration of singlet oxygen). First, 10 μL of SOSG (500 μM) was added to several samples of CD solution (0.01 mg mL−1, 1 mL). Then the samples were irradiated with UV light (365 nm, 60 mW cm−2) for different times and the change in fluorescence emission at 528 nm (excitation at 500 nm) of SOSG was recorded. As shown in Fig. 2a, after being irradiated for 1 minute, the fluorescence of the sample at 528 nm is apparent; and as the illumination time increases (from 1 to 5 min), the fluorescence intensity also gradually increases. Moreover, we compared the singlet oxygen generation capacities of CDs and VB2 using a SOSG kit. As shown in Fig. 2b, it is clear that under the same conditions, the efficiency of CDs to generate singlet oxygen is significantly higher than that of VB2. Only after 1 minute of irradiation, the singlet oxygen production by CDs is more than twice that by VB2. And after 5 minutes, the amount of 1O2 produced by CDs is 3.63 times that produced by VB2. Using VB2 as the standard photosensitizer (1O2 quantum yield ΦVB2 = 0.51),34,35 the 1O2 quantum yield of CDs is calculated as 0.716 (see Fig. S5 in the ESI† for calculation details.).28 The good water solubility of CDs supports the generation of singlet oxygen at a higher concentration level (above 0.5 mg mL−1), which makes CDs become a better photosensitizer.
 |
| | Fig. 2 (a) Fluorescence increase of SOSG with CDs for different irradiation times. (b) Comparison of the singlet oxygen generation capacities of CDs and VB2. F0 and F are the fluorescence intensities of SOSG with CDs or VB2 before and after irradiation, respectively. | |
3.3 Cytotoxicity measurements and cellular uptake
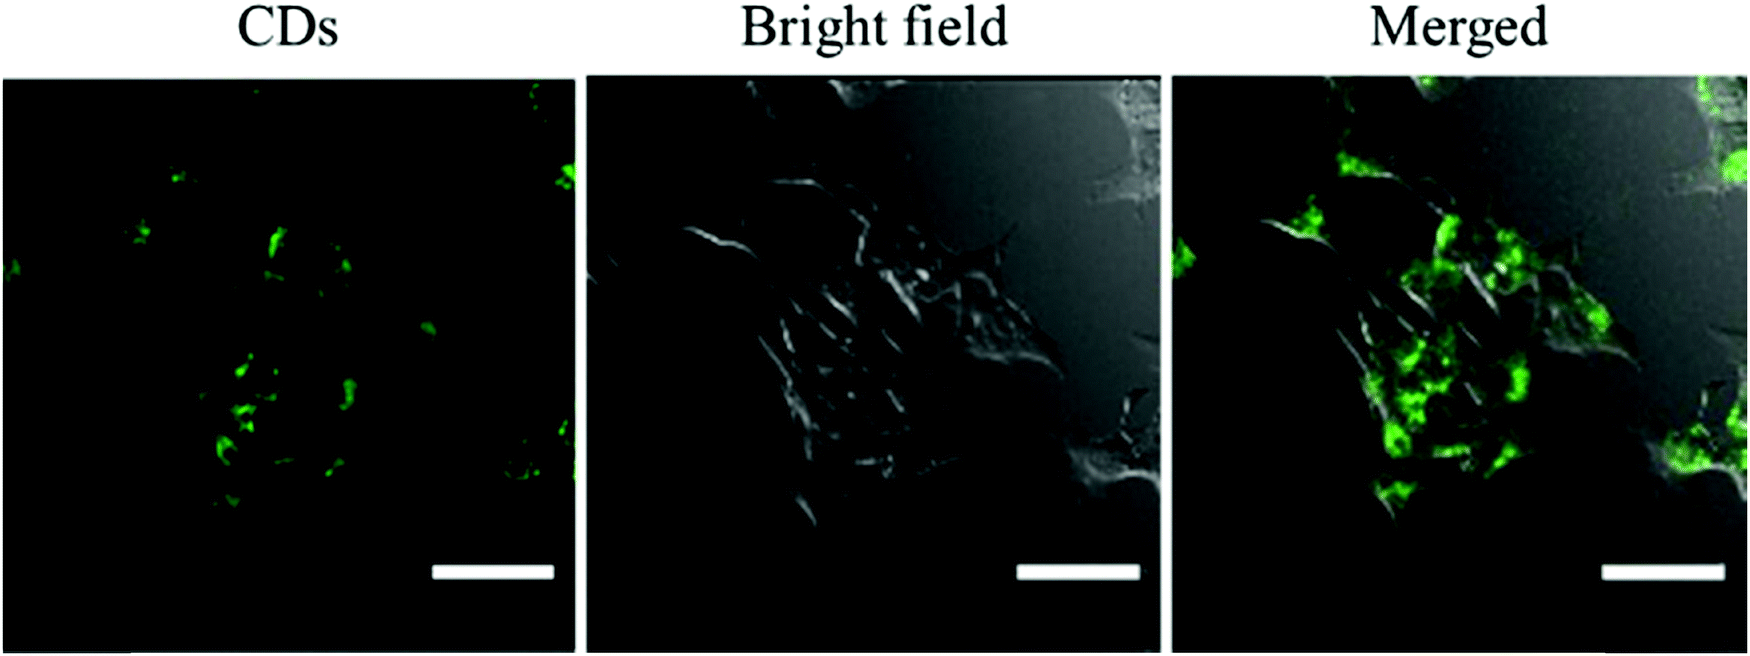
Then, the cytotoxicity of the CDs was tested using a Cell Counting Kit-8 (CCK-8) before being used in cell experiments. To examine the ability of CDs to enter cells, confocal laser scanning microscopy was employed for cell imaging. As shown in Fig. 3, the as-prepared CDs can easily enter the cells and exhibit bright green fluorescence, which indicates their good biocompatibility. And the cytotoxicity of CDs at different concentrations (from 50 to 400 μg mL−1) was also tested. As shown in Fig. S6 (ESI†), at a concentration of 50 μg mL−1, a cell viability close to 100% can be observed; even at a concentration of 400 μg mL−1, the cell viability is higher than 95%. Thus, the toxicity of CDs to cells is almost negligible, because the concentration of CDs in normal cell experiments is not higher than 100 μg mL−1. In other words, only under light can the photosensitizing effect of CDs kill cancer cells through PDT.
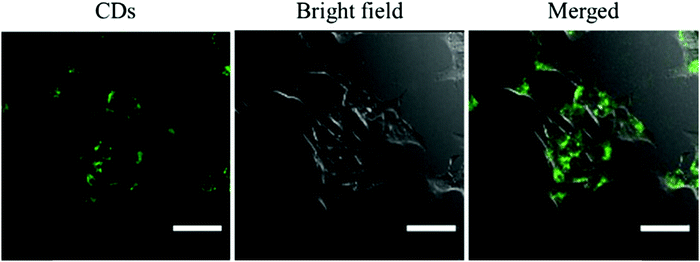 |
| | Fig. 3 CLSM images of 4T1 cells incubated with CDs (scale bar: 50 μm). | |
3.4 PDT of cells
Next, the PDT of 4T1 cells with CDs was performed. 4T1 cells were incubated with CDs (100 μg mL−1) for 12 hours, and then placed under laser irradiation (365 nm, 60 mW cm−2) for different times (from 1 min to 20 min). Then, quantitative CCK-8 cell viability assays were used to characterize cell viability by measuring the optical density (OD) at 450 nm. As shown in Fig. S7 (ESI†), after 1 minute of irradiation, the cell viability with CDs was determined to be 93.5%; after 5 minutes of irradiation, the value decreased to 65%; while after 20 minutes of irradiation, the cell viability decreased sharply to 31%. As a control, the cell viability of the samples without CDs decreased by only 13% after being irradiated for 20 minutes. This result confirms that the prepared CDs have high photodynamic activity and can effectively kill cancer cells under proper irradiation. In addition, the good water solubility of the CDs supports the PDT at a higher concentration, which brings greater prospects for clinical application.
3.5 Antitumor study in vivo
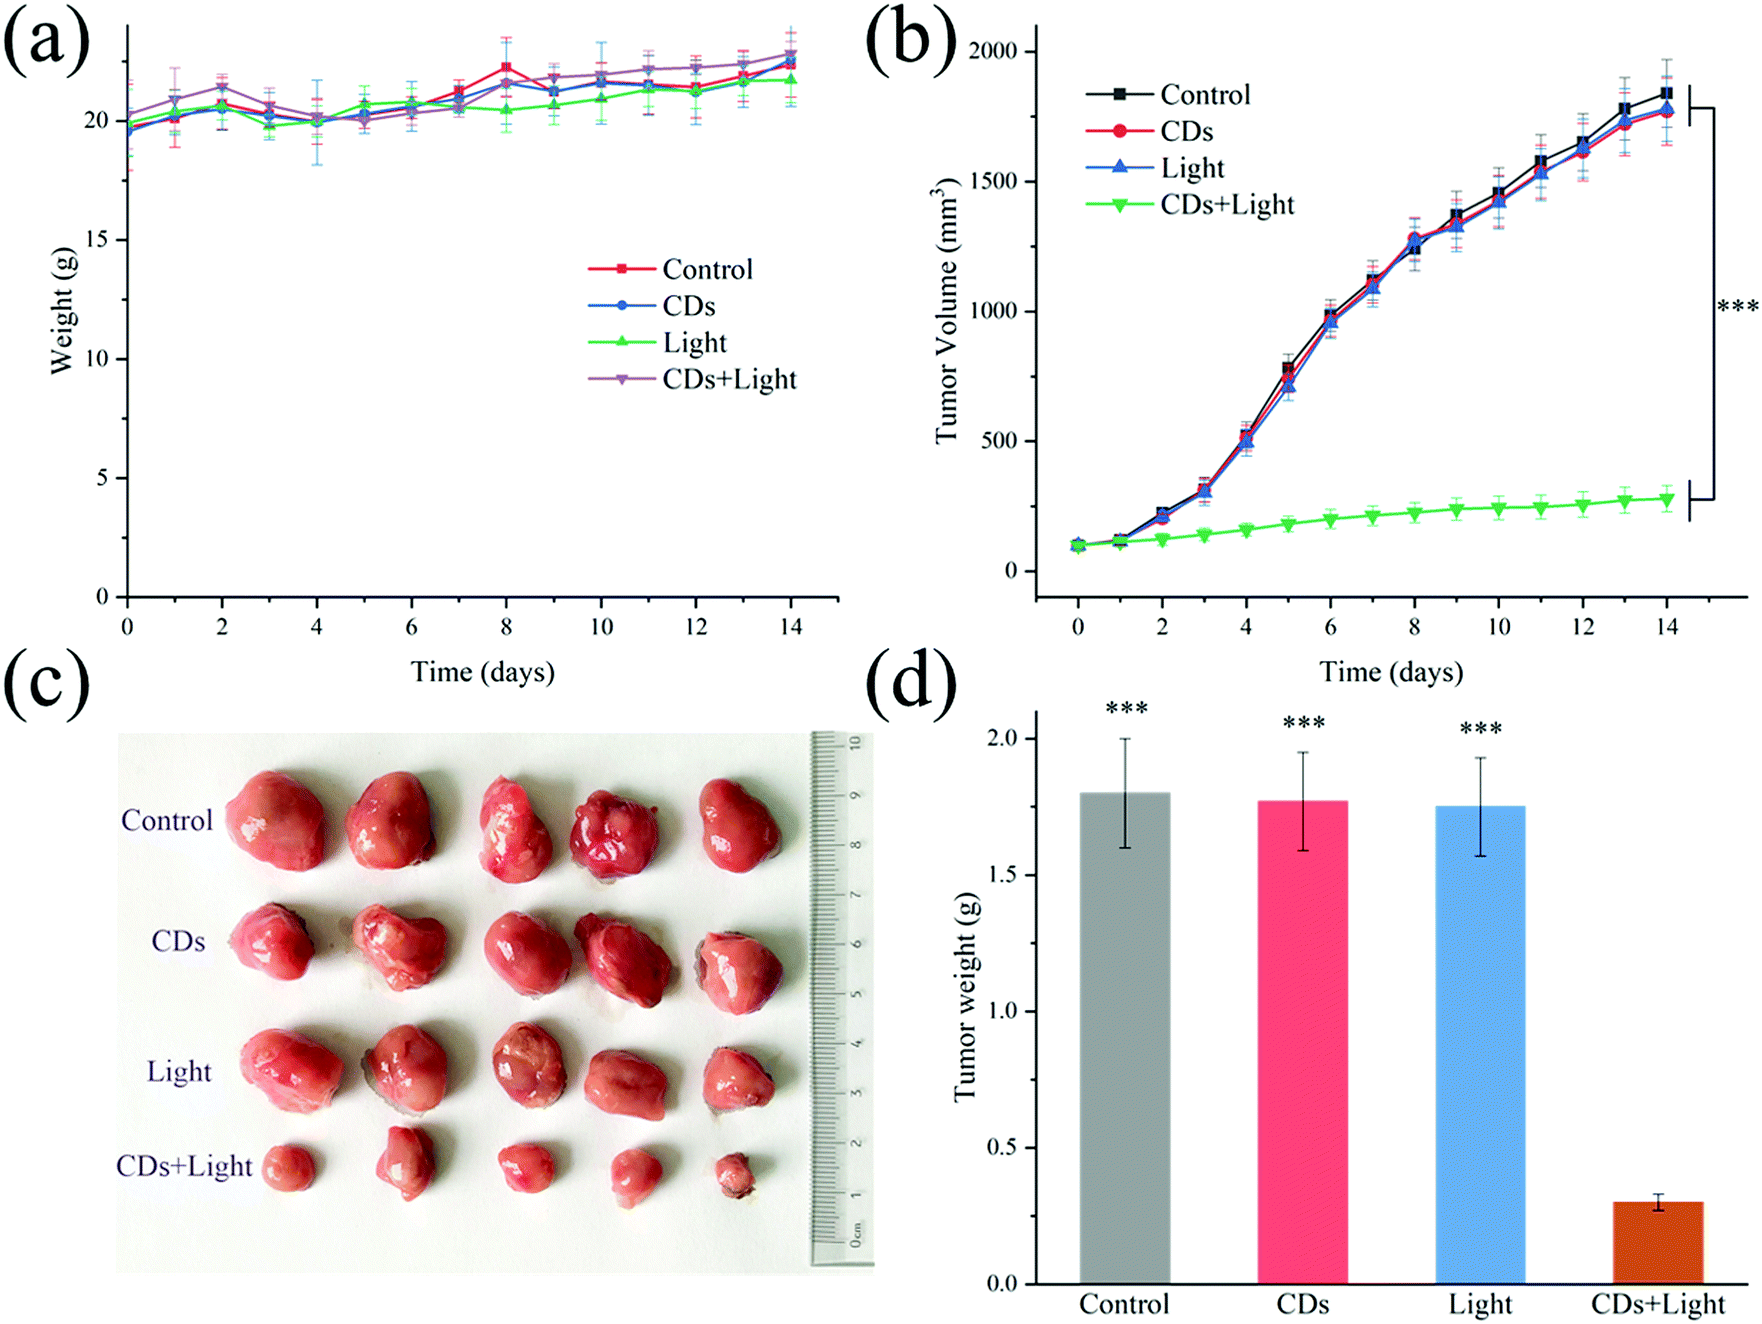
After confirming the photodynamic effect on the 4T1 cells, anti-tumor research at the animal level was further carried out. Different treatments were performed on 4 groups of mice (n = 5) for two weeks. During the treatment, the body weight of the mice and the volume of the tumor were recorded every day. As shown in Fig. 4a, there was no significant difference in body weight among the four groups after treatment. It can be clearly seen from Fig. 4b that the tumor volume of the PDT treated mice (CDs + light) did not increase significantly over time, while the tumor volumes of the other treatment groups (only CDs or only light) showed rapid growth as those of the control group. The results excluded the inhibitory effect of low-dose UV light (60 mW) on tumor growth. At the same time, it was confirmed that CDs had no toxicity without irradiation, which was consistent with the above cell experiment. After two weeks of treatment, all mice were sacrificed, and the practical morphology and tumor weight are shown in Fig. 4c and d. In the PDT group, the tumor remained almost unchanged during the treatment, and did not increase significantly, indicating that PDT using UV light can effectively inhibit tumor growth, but cannot reduce the tumor volume. This is probably because the penetration depth of ultraviolet light is not as deep as that of long wavelength near-infrared light, weakening the effect of photodynamic therapy.36 This method is only suitable for the treatment of superficial skin tumors or inflammatory wounds, so next we will try to use VB2 to develop long wavelength emitting CDs to achieve better PDT.37
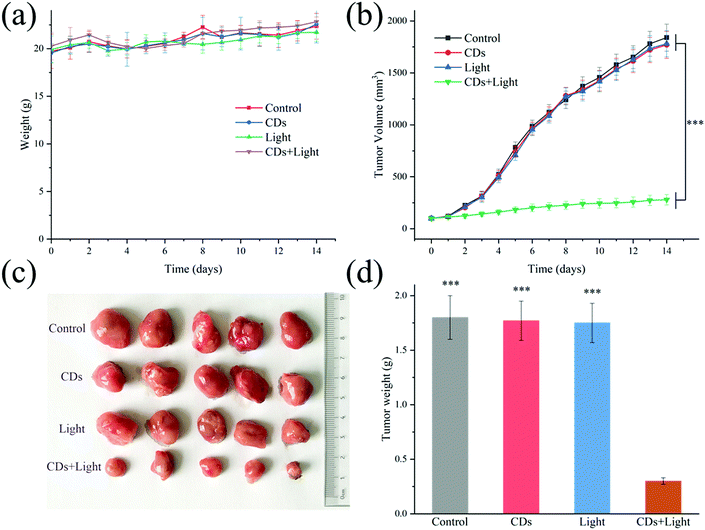 |
| | Fig. 4 (a) The body weight of the 4T1-bearing mice; (b) the tumor volumes of 4T1-bearing mice after different treatments; (c) photograph of excised tumors after two weeks of treatment; and (d) the tumor weights of the excised tumors on day 14; ***p < 0.001 was determined by one-way ANOVA. | |
To further evaluate the anti-tumor effect, histopathological analysis of the tumors after different treatments was carried out. As can be seen in Fig. 5a, there was no obvious tumor tissue damage in the CDs group or in the light group, just like in the control group. However, in the CDs + light group, both H&E and TUNEL staining images revealed the dissociation of cell nuclei and the formation of apoptotic bodies, confirming the effect of PDT on tumors. Moreover, H&E staining of the major organs (such as heart, liver, spleen, lungs and kidneys) was employed to study the toxicity of CDs in vivo (Fig. 5b). There was no obvious morphological change in any group after different treatments, indicating the biological safety of the VB2-based CDs. The in vivo results were consistent with the above in vitro experiments, indicating the further clinical application of the CDs.
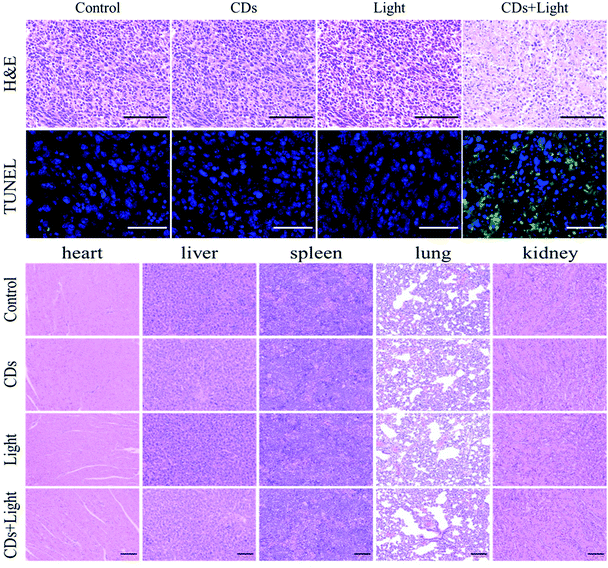 |
| | Fig. 5 (a) H&E staining and TUNEL staining of tumor tissue slices collected from mice after two weeks of PDT treatment (scale bar: 100 μm for H&E; 50 μm for TUNEL); and (b) H&E staining of the major organs from the mice after two weeks of PDT treatment (scale bar: 100 μm). | |
4. Conclusion
In summary, we prepared green fluorescent CDs based on riboflavin. The CDs have good water solubility because their surface is rich in hydroxyl groups and amino groups. Compared with riboflavin, the CDs have a stronger ability to generate singlet oxygen. In addition, cell experiments showed that the CDs themselves are almost non-toxic and have good biocompatibility. In vivo experiments verified the inhibitory effect of photodynamic therapy on tumors, indicating the clinical application potential of the VB2-based CDs. In addition, UV excitation limits the photodynamic treatment of deep-seated tumors. Further, it is necessary to use riboflavin to develop long wavelength, non-toxic, biocompatible CDs as new photosensitizers.
Ethical statement
We state that all experiments were performed in compliance with the relevant laws and institutional guidelines, and the Experimental Animal Ethics Committee of Suzhou Institute of Biomedical Engineering Technology approved the experiments.
Conflicts of interest
There are no conflicts to declare.
Acknowledgements
This research was funded by the National Key R&D Program of China (No. 2020YFC2004500), the National Natural Science Foundation of China (No. 21803075), the Primary Research & Development Plan of Jiangsu Province (No. BE2019683), the Science Foundation of the Chinese Academy of Sciences (No. 2020SYHZ0041), the Youth Innovation Promotion Association of the Chinese Academy of Sciences (No. 2017374), and the Science and Technology Department of Jinan City (No. 2018GXRC016).
Notes and references
- D. E. J. G. J. Dolmans, D. Fukumura and R. K. Jain, Nat. Rev. Cancer, 2003, 3, 380–387 CrossRef CAS PubMed.
- Y. Yao, R. Zhao, Y. Shi, Y. Cai, J. Chen, S. Sun, W. Zhang and R. Tang, Chem. Commun., 2018, 54, 8068–8071 RSC.
- J. Chen, T. Fan, Z. Xie, Q. Zeng, P. Xue, T. Zheng, Y. Chen, X. Luo and H. Zhang, Biomaterials, 2020, 237, 119827 CrossRef CAS PubMed.
- Y. Shen, A. J. Shuhendler, D. Ye, J.-J. Xu and H.-Y. Chen, Chem. Soc. Rev., 2016, 45, 6725–6741 RSC.
- H. Abrahamse and M. R. Hamblin, Biochem. J., 2016, 473, 347–364 CrossRef CAS PubMed.
- M. R. Hamblin, Photochem. Photobiol., 2020, 96, 506–516 CrossRef CAS PubMed.
- B. Mansoori, A. Mohammadi, M. Amin Doustvandi, F. Mohammadnejad, F. Kamari, M. F. Gjerstorff, B. Baradaran and M. R. Hamblin, Photodiagn. Photodyn. Ther., 2019, 26, 395–404 CrossRef CAS PubMed.
- R. L. Yanovsky, D. W. Bartenstein, G. S. Rogers, S. J. Isakoff and S. T. Chen, Photodermatol., Photoimmunol. Photomed., 2019, 35, 295–303 CrossRef PubMed.
- M. Lan, S. Zhao, W. Liu, C.-S. Lee, W. Zhang and P. Wang, Adv. Healthcare Mater., 2019, 8, 1900132 CrossRef PubMed.
- H. Kataoka, H. Nishie, N. Hayashi, M. Tanaka, A. Nomoto, S. Yano and T. Joh, Ann. Transl. Med., 2017, 5, 4 CrossRef PubMed.
- J. C. S. Simões, S. Sarpaki, P. Papadimitroulas, B. Therrien and G. Loudos, J. Med. Chem., 2020, 63, 14119–14150 CrossRef PubMed.
- Q. Zhang, J. He, W. Yu, Y. Li, Z. Liu, B. Zhou and Y. Liu, RSC Med. Chem., 2020, 11, 427–437 RSC.
- J. Vara, M. S. Gualdesi, V. Aiassa and C. S. Ortiz, Photochem. Photobiol. Sci., 2019, 18, 1576–1586 CrossRef CAS PubMed.
- J. Zhao, K. Xu, W. Yang, Z. Wang and F. Zhong, Chem. Soc. Rev., 2015, 44, 8904–8939 RSC.
- B. M. Barth, E. I. Altinoğlu, S. S. Shanmugavelandy, J. M. Kaiser, D. Crespo-Gonzalez, N. A. DiVittore, C. McGovern, T. M. Goff, N. R. Keasey, J. H. Adair, T. P. Loughran, D. F. Claxton and M. Kester, ACS Nano, 2011, 5, 5325–5337 CrossRef CAS PubMed.
- L. K. McKenzie, I. V. Sazanovich, E. Baggaley, M. Bonneau, V. Guerchais, J. A. G. Williams, J. A. Weinstein and H. E. Bryant, Chem. – Eur. J., 2017, 23, 234–238 CrossRef CAS PubMed.
- L. Malina, K. B. Tomankova, J. Malohlava, J. Jiravova, B. Manisova, J. Zapletalova and H. Kolarova, Toxicol. In Vitro, 2016, 34, 246–256 CrossRef CAS PubMed.
- L. Zhang, X. Li, T. Liu, L. Kang, X. Huang and Y. Zhao, Chem. Commun., 2020, 56, 5544–5547 RSC.
- P. Zuo, X. Lu, Z. Sun, Y. Guo and H. He, Microchim. Acta, 2016, 183, 519–542 CrossRef CAS.
- Y. Du and S. Guo, Nanoscale, 2016, 8, 2532–2543 RSC.
- R. Wang, K.-Q. Lu, Z.-R. Tang and Y.-J. Xu, J. Mater. Chem. A, 2017, 5, 3717–3734 RSC.
- D. Qu, D. Yang, Y. Sun, X. Wang and Z. Sun, J. Phys. Chem. Lett., 2019, 10, 3849–3857 CrossRef CAS PubMed.
- D. Qu and Z. Sun, Mater. Chem. Front., 2020, 4, 400–420 RSC.
- S. V. Carneiro, V. H. R. de Queiroz, A. A. C. Cruz, L. M. U. D. Fechine, J. C. Denardin, R. M. Freire, R. F. do Nascimento and P. B. A. Fechine, Sens. Actuators, B, 2019, 301, 127149 CrossRef CAS.
- X.-L. Guo, Z.-Y. Ding, S.-M. Deng, C.-C. Wen, X.-C. Shen, B.-P. Jiang and H. Liang, Carbon, 2018, 134, 519–530 CrossRef CAS.
- Q. Jia, X. Zheng, J. Ge, W. Liu, H. Ren, S. Chen, Y. Wen, H. Zhang, J. Wu and P. Wang, J. Colloid Interface Sci., 2018, 526, 302–311 CrossRef CAS PubMed.
- D.-W. Zheng, B. Li, C.-X. Li, J.-X. Fan, Q. Lei, C. Li, Z. Xu and X.-Z. Zhang, ACS Nano, 2016, 10, 8715–8722 CrossRef CAS PubMed.
- J. Ge, M. Lan, B. Zhou, W. Liu, L. Guo, H. Wang, Q. Jia, G. Niu, X. Huang, H. Zhou, X. Meng, P. Wang, C.-S. Lee, W. Zhang and X. Han, Nat. Commun., 2014, 5, 4596 CrossRef CAS PubMed.
- H. J. Powers, Am. J. Clin. Nutr., 2003, 77, 1352–1360 CrossRef CAS PubMed.
- V. Massey, Biochem. Soc. Trans., 2000, 28, 283–296 CrossRef CAS PubMed.
- F. Halili, A. Arboleda, H. Durkee, M. Taneja, D. Miller, K. A. Alawa, M. C. Aguilar, G. Amescua, H. W. Flynn and J.-M. Parel, Am. J. Ophthalmol., 2016, 166, 194–202 CrossRef CAS PubMed.
- P. W. J. Morrison, C. J. Connon and V. V. Khutoryanskiy, Mol. Pharmaceutics, 2013, 10, 756–762 CrossRef CAS PubMed.
- C. H. Li, R. S. Li, C. M. Li, C. Z. Huang and S. J. Zhen, Chem. Commun., 2019, 55, 6437–6440 RSC.
- M. Insińska-Rak and M. Sikorski, Chem. – Eur. J., 2014, 20, 15280–15291 CrossRef PubMed.
- E. Sikorska, I. Khmelinskii, A. Komasa, J. Koput, L. F. V. Ferreira, J. R. Herance, J. L. Bourdelande, S. L. Williams, D. R. Worrall, M. Insińska-Rak and M. Sikorski, Chem. Phys., 2005, 314, 239–247 CrossRef CAS.
- S.-S. Wan, J.-Y. Zeng, H. Cheng and X.-Z. Zhang, Biomaterials, 2018, 185, 51–62 CrossRef CAS PubMed.
- W. Pang, P. Jiang, S. Ding, Z. Bao, N. Wang, H. Wang, J. Qu, D. Wang, B. Gu and X. Wei, Adv. Healthcare Mater., 2020, 9, 2000607 CrossRef CAS PubMed.
Footnote |
| † Electronic supplementary information (ESI) available: Characterization of carbon dots. See DOI: 10.1039/d1tb01291f |
|
| This journal is © The Royal Society of Chemistry 2021 |
Click here to see how this site uses Cookies. View our privacy policy here. 
 *c,
Chenyu
Jiang
*c,
Chenyu
Jiang