
 Open Access Article
 This Open Access Article is licensed under a Creative Commons Attribution-Non Commercial 3.0 Unported Licence
In situ surface-enhanced Raman spectroelectrochemistry reveals the molecular conformation of electrolyte additives in Li-ion batteries†
Chenbo
Zhu
a,
Chenghao
Fan
ab,
Emiliano
Cortés
 *b and
Wei
Xie
*a
*b and
Wei
Xie
*a
aKey Lab of Advanced Energy Materials Chemistry (Ministry of Education), Renewable Energy Conversion and Storage Center, College of Chemistry, Nankai University, Weijin Rd. 94, Tianjin, 300071, China. E-mail: wei.xie@nankai.edu.cn
bChair in Hybrid Nanosystems, Nanoinstitute Munich, Faculty of Physics, Ludwig-Maximilians-Universität München, 80539, München, Germany. E-mail: Emiliano.Cortes@lmu.de
First published on 2nd August 2021
Abstract
We report the mechanism of rhodamine B (RhB) acting as an electrolyte additive in Li/graphite cells. We show that the cycle performance and rate capability of graphite are enhanced in carbonate-based electrolytes containing 0.2 wt% RhB. By using silica-encapsulated Au nanoparticles, in situ surface-enhanced Raman spectroscopy (SERS) is applied to study the graphite/electrolyte interface. We find that the adsorption orientation of RhB molecules on the surface of graphite can be modulated by the applied potential: vertical adsorption at higher potentials while horizontal adsorption takes place at lower potentials. This behavior effectively suppresses the electrolyte solvent decomposition, as well as electrode corrosion while improving the Li+ diffusion. This work shows that SERS is a powerful tool for interfacial analysis of battery systems and provides new ideas for rational design of electrolyte additives.
Introduction
Lithium-ion batteries are widely used in portable electronic devices, electric vehicles, and grid energy storage systems.1–3 Indeed, Li-ion batteries are considered as one of the most promising energy storage devices for future technology. The anodic material is one of the key components for batteries and increasing efforts have been made in order to improve the anode performance.4 These studies mainly focus on searching new materials with higher capacities including lithium metal anodes, silicon-based anodes and transition metal oxide anodes.5–9 However, due to the lower coulombic efficiency, poor cycle performance and/or safety issues, these new anode materials have been rarely applied in commercial products.At present, graphite is the main anode material used in commercial Li-ion batteries, and it is highly probable that it will remain the main anode material for a period of time in the future.10 However, there are still some drawbacks for graphite anodes, such as relatively poor rate performance and long-term degradation.11,12 A common way to mitigate these problems is by optimizing the solid electrolyte interphase (SEI). The SEI is a passivating film on the anode surface mainly originating from the reductive decomposition of the electrolyte during the first cycle. The properties of this film have a great influence on the overall battery performance.13,14
The easiest way to modify the SEI is by introducing an additive into the electrolyte.15–18 Indeed, in order to better understand and optimize the properties of the SEI and the influence of different types of additives, many in situ techniques have been used to access the electrode/electrolyte interface. These techniques include X-ray photoelectron spectroscopy (XPS), Fourier transform infrared spectroscopy (FT-IR), Raman spectroscopy, nuclear magnetic resonance (NMR), X-ray diffraction (XRD), neutron diffraction, optical microscopy, scanning electron microscopy (SEM), transmission electron microscopy (TEM) and atomic force microscopy (AFM), among others.19–21 In particular, Raman spectroscopy is a powerful tool for in situ characterization of the electrode surface as it can provide information about both composition and structure.22–27 However, it turns out to be experimentally challenging to obtain clear spectra from molecular species (or additives) at the electrode surface or the SEI due to the intrinsically weak Raman cross-sections of molecules.
Surface enhanced Raman spectroscopy (SERS), in which the plasmon excitation of nanostructured materials or surfaces enhances the Raman signal by many orders of magnitude, combines the advantages of high sensitivity and surface selectivity and high chemical specificity.28,29 By using SERS, it is possible to monitor the interfacial process in great detail, including molecular behavior, reaching even single molecule sensitivity.30,31 Few groups have used in situ SERS to identity the composition and structure of substances on the electrode surface in lithium-ion batteries. However, the behavior of molecular species at these electroactive interfaces has been poorly investigated by SERS.32–39
Herein, we introduce rhodamine B into the ester-based electrolyte for Li/graphite cells and in situ monitor the molecular behavior of RhB at the graphite/electrolyte interface by SERS. Cycle and rate performances were improved with the addition of 0.2 wt% RhB. In situ SERS spectra show the differently-oriented adsorption of RhB during cell cycling. Tracking this molecular dynamic behavior of the additive can shed light on the role of additives in the SEI and also serve as a guideline towards finding outperforming additives for Li-ion cells.
Experimental
Electrochemical characterization
The graphite electrode was fabricated by mixing the graphite powder (Alfa Aesar), Super P conductive carbon and polyvinylidene fluoride (PVDF) (weight ratio 90![[thin space (1/6-em)]](https://www.rsc.org/images/entities/char_2009.gif) :5:5) to form a slurry using a moderate amount of N-metnyl-2-pyrrolidone (NMP). The slurry was cast on Cu foil (diameter = 1 cm) which was then transferred to a vacuum oven and dried for 12 hours.
:5:5) to form a slurry using a moderate amount of N-metnyl-2-pyrrolidone (NMP). The slurry was cast on Cu foil (diameter = 1 cm) which was then transferred to a vacuum oven and dried for 12 hours.
The base electrolyte was 1 M LiPF6 dissolved in a mixture of solvents such as ethylene carbonate (EC)/diethyl carbonate (DEC) (1:1, wt%). The control electrolyte was prepared by adding different masses of rhodamine B (Macklin) into the base electrolyte.
2032-type coin cells were assembled by using graphite as the working electrode and Li foil as the counter electrode in an Ar-filled glove box (O2, H2O <1 ppm) and tested on a LAND battery-test instrument (CT2001A). Cyclic voltammetry (CV) measurements were conducted on an electrochemical workstation (CHI660, Chenhua, Shanghai) with a three-electrode system at a sweep rate of 0.2 mV s−1. Electrochemical impedance spectroscopy (EIS) was performed over a frequency range of 100 Hz to 0.01 Hz with an amplitude of 5 mV.
Au@SiO2 nanoparticle synthesis
Au@SiO2 NPs were synthesized as previously reported.28 First, 80 nm Au NPs were prepared by a seed-growth method.40 To synthesize the ultrathin silica shell, 10 μl of 3-mercaptopropyltrimethoxysilane (MPTMS) ethanolic solution (10%) was added to 1 ml of the as-prepared 80 nm Au NPs, followed by incubation at 50 °C for 1 hour. Then the Au NPs were washed and resuspended in 1 ml of water, in which 7.5 μl of sodium silicate aqueous solution (0.054%) was added. The mixture was incubated at 90 °C for 1 hour. The prepared Au@SiO2 NPs were washed and resuspended in ethanol. After that, the Au@SiO2 NPs were dried and re-dispersed in diethyl carbonate (DEC).Ex situ characterization of the electrode surface
Graphite electrodes were extracted from the coin cells, washed with diethyl carbonate (DEC) in a glove box and dried under vacuum. The microstructure of the graphite electrode was measured by field-emission scanning electron microscopy (SEM JEOL JMS-7500) and high-resolution transmission electron microscopy (HRTEM Talos F200X G2). The chemical components of the graphite electrode surface were identified by employing micro-confocal Raman spectroscopy (Horiba Jobin Yvon, LabRAM HR Evolution), Fourier transform infrared spectroscopy (Bruker Tensor II Sample Compartment RT-DLaTGS) and X-ray photoelectron spectroscopy (XPS Thermo ESCALAB 250XI).In situ SERS measurements
For in situ SERS measurements, Au@SiO2 NPs were dropped onto the graphite electrode surface and dried in a vacuum oven. A small hole was made through the top cap of the coin cell, the lithium foil and the separator to allow the laser to reach the electrode surface. After the coin cell was assembled, a quartz window was attached to the top cap for sealing. CV was performed at 0.2 mV s−1 from open circuit potential (OCP) to 0 V and back to 1.5 V. Raman measurements were carried out using a micro-confocal Raman spectroscopy setup equipped with an excitation wavelength of 633 nm, a 50× objective, a monochromator (600 grooves per mm grating), and an EM-CCD detector (Synapse EM).Density functional theory (DFT) calculations
DFT calculations were performed using the Vienna Ab initio Simulation Package (VASP), using the Perdew–Burke–Ernzerhof (PBE) exchange correlation functional and projector augmented-wave (PAW) pseudo-potential. An energy cutoff of 450 eV with a smearing of 0.1 eV by using a first-order Methfessel–Paxton scheme was applied for the plane-wave basis set. Energies were converged to 10−5 eV, and the optimization of structures was conducted until the residual force was less than 0.01 eV Å−1. The Γ-centered K point grid was chosen to be 1 × 1 × 1 for all surfaces in this work. A close-packed 8 × 8 supercell was used for graphite (100) and (001) surfaces. Spin polarization was considered in all the calculations. And a vacuum space of 23 Å was adopted to describe the slab models. The van der Waals (vdW) interaction was included through the Grimme's semi-empirical DFT-D3 scheme of dispersion correction.Results and discussion
To investigate the impact of rhodamine B (Fig. 1a) on cell performance, Li/graphite half-cells were assembled and evaluated by galvanostatic charge–discharge cycling in a carbonate-based electrolyte. Fig. 1b shows the cycle performance and coulombic efficiency of Li/graphite cells with and without 0.2 wt% RhB in a voltage range of 1.5–0.005 V at a current rate of 0.2C. It can be observed that the addition of RhB enhances the cycle capacity of graphite. The discharge capacities of the cell with RhB are 360.4 mA h g−1 after 100 cycles and 352.7 mA h g−1 after 200 cycles, respectively. Moreover, only discharge capacities of 345.8 mA h g−1 and 327.2 mA h g−1 were obtained for the Li/graphite cells without RhB after 100 cycles and 200 cycles, respectively. Besides the cycle performance, the coulombic efficiency of the cells is also improved with RhB (Fig. 1c). The coulombic efficiency of the cells for the first cycle is enhanced from 91.1% to 97.5% when introducing RhB into the electrolyte, which suggests that the addition of RhB can suppress the electrolyte decomposition and reduce the consumption of lithium ions for SEI film formation. Moreover, the coulombic efficiency of the first five cycles for cells with no RhB is less than 99%. However, for cells with RhB, the coulombic efficiency is over 99% in the second cycle. These results indicate that RhB can restrain the decomposition of electrolyte even after SEI film formation, thus providing better protection for the widely used commercial graphite electrodes.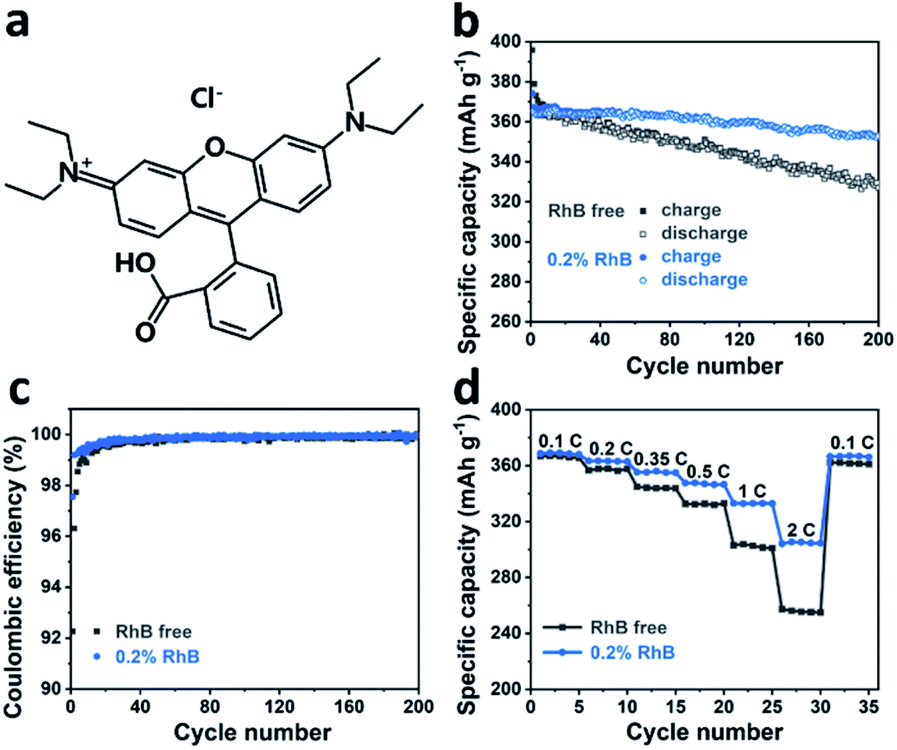 | ||
| Fig. 1 (a) The molecular structure of rhodamine B. (b) Cycle performance and (c) coulombic efficiency of Li/graphite cells with (blue) and without (grey) 0.2 wt% RhB, cycled at 0.2C between 1.5 V and 0.005 V. (d) Rate performance of Li/graphite cells with (blue) and without (grey) 0.2 wt% RhB cycled from 0.1C–2C. | ||
In order to study the effect of RhB on the electrochemical kinetics of the cells, rate performance measurements were carried out. In Fig. 1d, we show that the specific discharge capacities of graphite without RhB at different current densities (0.1C, 0.2C, 0.35C, 0.5C, 1C, and 2C) are about 366.4, 357.3, 344.1, 332.5, 302.4 and 255.8 mA h g−1, respectively. The discharge capacity at 2C is 69.8% of the value at 0.1C. The reverse capacity at 0.1C is about 361.7 mA h g−1, corresponding to a 98.7% capacity retention. For the Li/graphite cells with 0.2 wt% RhB, the specific discharge capacities are about 368.7, 363.2, 355.3, 347.1, 332.9, 304.8 mA h g−1, respectively. The discharge capacity at 2C is 82.7% of the value at 0.1C and the reverse capacity is 366.6 mA h g−1, corresponding to a 99.4% capacity retention. These results indicate that the addition of RhB in the electrolyte significantly improves the specific capacities at different current densities, especially at large current densities. As known, the thickness of the SEI film has a great influence on the lithium-ion diffusion and on the electronic conductivity. Indeed, a thinner SEI film can help shorten the lithium-ion diffusion channel, thus improving the electronic conductivity, which would lead to a better rate performance. Following this idea, our results so far suggest that the thickness of the SEI film on the graphite surface is smaller when RhB was added as an additive. This further proves (indirectly) that the addition of RhB can suppress the decomposition of the electrolyte (as the SEI film originates from the reductive decomposition of the electrolyte).
We performed electrochemical cyclic voltammetry (CV) measurements in the presence of the RhB additive. As shown in Fig. 2a, the CV curves exhibit a pair of redox peaks in the potential range of 0–0.4 V, corresponding to the intercalation/deintercalation of the lithium ions. In the first anodic process, it can be observed that the intensity of the peak current is about 1.0 mA with the introduction of the RhB additive. On the other hand, for the electrolyte without RhB, the intensity of the peak current is about 0.7 mA. In addition, the potential of the oxidation peak for the electrolyte with RhB is lower than that for the bare electrolyte (i.e. without RhB), indicating a smaller overpotential in RhB containing electrolyte. The higher intensity of the peak current and the smaller overpotential imply an improvement in the electrochemical kinetics by the addition of RhB.
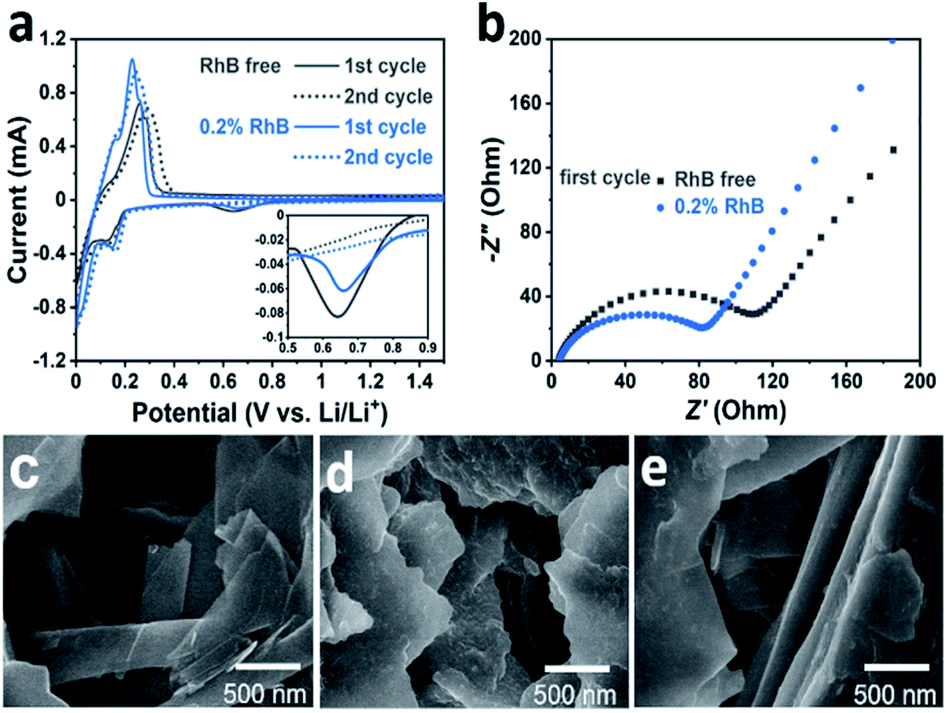 | ||
| Fig. 2 (a) Cyclic voltammetry curves of Li/graphite cells with (blue) and without (grey) 0.2 wt% RhB at the sweep rate of 0.2 mV s−1. (b) Nyquist plots of electrochemical impedance spectroscopy of Li/graphite cells with (blue) and without (grey) 0.2 wt% RhB after the first cycle. SEM images of graphite electrodes: (c) fresh and after 100 cycles (d) with no additive and (e) with 0.2 wt% RhB. | ||
Moreover, a closer inspection in the voltage region from 0.5 to 0.8 V (Fig. 2a inset) shows a small cathodic peak that appears in the first cycle but it disappears in the second one. This corresponds to the reduction of the electrolyte and the formation of the SEI film during the first cycle. The area of this peak is much smaller when RhB is added as an additive than that without RhB, indicating that less electrolyte is decomposed, further proving that adding RhB as an additive can suppress the decomposition of the electrolyte.
To further explore the impact of RhB on the battery performance, electrochemical impedance spectroscopy (EIS) tests were also performed. Fig. 2b shows the Nyquist plots of the Li/graphite cells after the first cycle. It can be seen that the cells with the RhB additive exhibit a smaller resistance (80 Ω) than those without RhB (115 Ω), corresponding to a better electrochemical kinetics, which is consistent with the results of the above electrochemical tests.
SEM analyses were conducted for imaging the Li/graphite cells after 100 cycles. For comparison, the morphology of the fresh graphite electrode was first characterized (Fig. 2c). Before cycling, the basal plane of graphite is smooth and flat, and the graphite edges are sharp and straight. Compared to the fresh graphite, the cycled electrode shows a very different morphology. For the case without the additive, there are some deposits heterogeneously dispersed on the basal plane of graphite (Fig. 2d). The surface becomes rough and the edges become dull and undulating. This indicates that the SEI film is unevenly formed on the graphite surface and the thickness of the SEI film is relatively thick which would lead to a higher resistance towards lithium-ion diffusion. A thicker SEI film also implies that more electrolyte decomposes to form this layer. In comparison, the graphite electrode cycled 100 times in 0.2% RhB (Fig. 2e) shows a relatively smoother basal plane and straighter edges, which means that less electrolyte decomposes and that a thinner and more homogeneous SEI layer has been formed. This flat and thin SEI layer can reduce the resistance and improve the lithium-ion migration. This result is consistent with that of the HRTEM characterization of graphite (Fig. S1 and S2†) and the aforementioned EIS and CV analyses.
Now we will look at the composition of the SEI layer on the graphite electrode and the effect of adding RhB as the additive. Ex situ spectroscopy techniques were used for exploring the surface composition of the graphite anode before and after cycling. X-ray photoelectron spectroscopy (XPS) detection of the graphite electrode was carried out after 10 cycles. The addition of RhB does not change the XPS peak position and relative intensity (Fig. S3 and S4†). And the addition of RhB was detected by IR and Raman spectroscopy. In particular, IR spectroscopy (Fig. S5a†) shows the RhB signal on the graphite surface in the cells with the additive. Ex situ Raman spectroscopy was also applied to analyze the surface of the electrode. Due to the strong fluorescence of RhB molecules, no useful signal could be collected by using normal Raman spectroscopy for RhB containing cells (Fig. S5b†). In order to mitigate this effect, we used Au@SiO2 as SERS-active nanoparticles, which can quench the fluorescence and enhance the Raman signal of RhB molecules.41 The TEM image of the Au@SiO2 NPs (Fig. S6†) shows that they are ∼80 nm in diameter and that the thickness of the SiO2 shell is ∼3 nm. Before cell cycling, Au@SiO2 nanoparticles were uniformly dispersed on the graphite surface (Fig. S7†). Compared with the standard Raman spectra of RhB, an identical spectrum could be obtained from the graphite surface with RhB as an additive (Fig. S5b†). In conclusion, the results of XPS, IR and Raman indicate that RhB is present on the graphite surface, but it neither decomposes to form new species during cycling nor becomes a part of the SEI. In contrast, RhB is just adsorbed on the surface. In what follows, we will try to uncover the adsorption mechanism and dynamics of RhB by using SERS with cycling in Li/graphite cells.
First, it is worth noting that the full width at half maximum (FWHM) of the RhB bands after cycling is a bit narrower than that before cycling, which suggests that the presence of electric field during cell cycling may affect the adsorption state of RhB. In order to check this hypothesis, we moved to a gold working electrode, on which more stable SERS signals can be collected. Fig. 3a shows the SERS spectra of RhB on a gold electrode before and after cycling. The FWHM of four characteristic peaks at around 621, 1278, 1357, and 1646 cm−1 is shown in Fig. 3b. A Gaussian fitting was performed for each peak before comparison.42,43 As shown in Fig. 3c–f, it can be observed that before cycling, RhB has broader Raman bands than that after cycling. The average FWHM of the peaks at around 621, 1278, 1357, and 1646 cm−1 is 9.5, 22.4, 13.8 and 16.1 cm−1 respectively, before cycling and 8.0, 18.5, 11.5 and 15.4 cm−1 after cycling. Based on spectroscopy theory, the FWHM of a Raman band can be used to measure the regularity or order of the adsorbed molecules. A smaller FWHM means a better consistency or better order.44,45 Based on this, we can conclude that the RhB molecules are more uniformly adsorbed on the electrode surface after cell cycling, promoting the uniform formation of the SEI film. We can further speculate that rhodamine B being a cationic species in solution, its positive charge will guide the uniform coating and adsorption when the electric field is present during cycling.
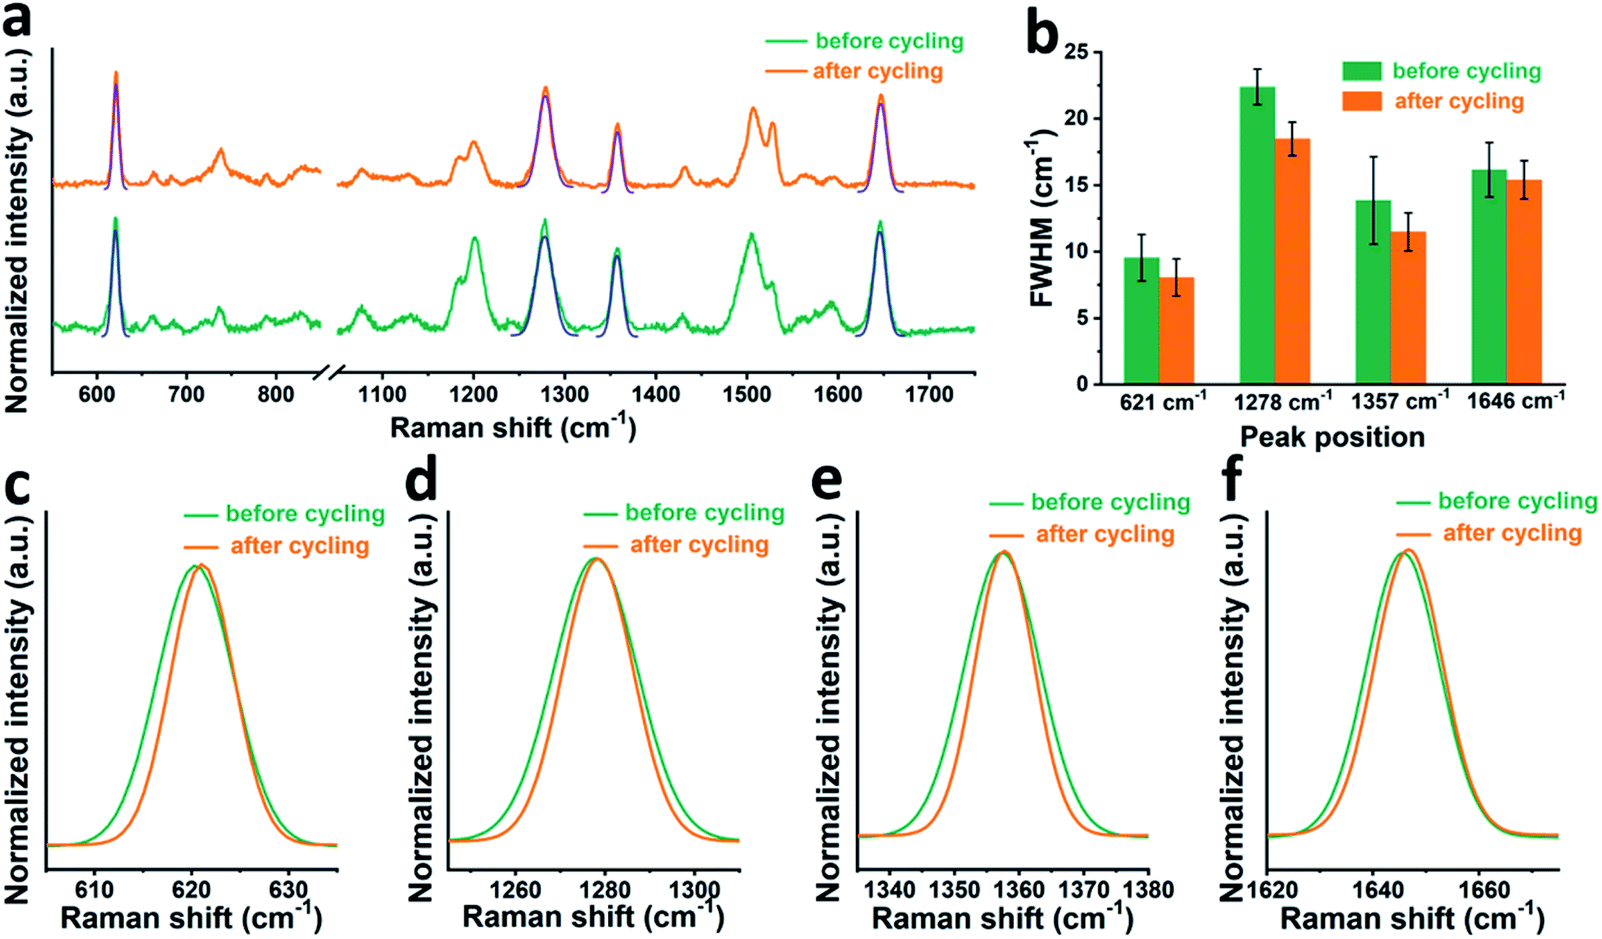 | ||
| Fig. 3 (a) Ex situ SERS of RhB on a gold working electrode. (b) Comparison of the FWHM of Raman bands of RhB before and after cycling. Finally, we show in detail the following RhB Raman peaks with or without cycling: (c) 621 cm−1, (d) 1278 cm−1, (e) 1357 cm−1 and (f) 1646 cm−1. | ||
To further investigate the impact of the adsorption dynamics of RhB, in situ SERS was carried out in the graphite cell. Fig. 4a and b show the in situ SERS spectra of the graphite surface with 0.2 wt% RhB additive during the charging and discharging process. The evolution of the RhB Raman bands was monitored while cell voltages were linearly scanned between 0 and 1.5 V. As shown in Fig. 4a, while decreasing the voltage, the peaks at 787, 1444, 1468, and 1588 cm−1 are enhanced, while the peaks at 1126, 1506, and 1570 cm−1 are weakened. Comparing the Raman spectra of RhB at 1.5 V and 0 V, the intensity of these 7 bands significantly changed between both potentials, indicating a change in the adsorption behavior of RhB on the graphite surface.30 During discharging, these bands recover their original intensity as the voltage is reversed to 1.5 V. These results indicate that the changes in the adsorption behavior of RhB are reversible.
 | ||
| Fig. 4 In situ SERS spectra of RhB during (a) charging and (b) discharging. Arrows indicate the voltage direction. The variation trend of the intensity of Raman peaks corresponding to the (c) ethylamino groups and (d) xanthene ring in RhB molecules while scanning the voltage. A sketch of the RhB molecules (e) vertically and (f) horizontally adsorbed on the graphite surface. Red and blue areas are ethylamino groups and xanthene ring, respectively. | ||
The intensity variation of the Raman bands is revealed in Fig. 4c, d and S8.† As shown in Fig. 4c, the intensity of the mode centered at 1444 cm−1 decreases gently from 1.5 to 1.2 V. As the voltage continues to decrease, the peak intensity decreases rapidly until 0.3 V. Once the voltage is brought below 0.3 V, the peak intensity tends to remain constant. The reverse behavior can be observed when the voltage changes from 0 to 1.5 V, i.e. the peak intensity mainly varies from 0.3 to 1.2 V as well. In Fig. 4d, we show that the peak centered at 1506 cm−1 has the same voltage variation range (0.3–1.2 V) as the one analyzed in Fig. 4c (1444 cm−1).
To rationalize the voltage-dependent adsorption behavior of RhB on graphite, we assigned the Raman peaks. As shown in Table S1,† the peaks at 787, 1444, 1468 and 1588 cm−1 are attributed to the out-of-plane vibration mode, while peaks at 1126, 1506, and 1570 cm−1 are attributed to the in-plane vibration mode. Based on the above results, it can be found that at higher voltages, the Raman peaks of the in-plane vibration mode are stronger than the Raman peaks of the out-of-plane vibration mode. On the other hand, at lower voltages, the Raman peaks of the out-of-plane vibration mode are stronger than the Raman peaks of the in-plane vibration mode. Due to surface selection rules, we know that the adsorbate vibrations normal to the surface normally generate very large signals while those parallel or tangential to the surface give no signals or signals of very weak intensity.46,47 As shown in the scheme of Fig. 4e, when the RhB molecules are vertically adsorbed on the graphite surface, the xanthene ring plane (blue area) is normal to the surface and its corresponding in-plane vibration peak (∼1506 cm−1) would be stronger. Meanwhile, the ethylamino group (red area) is parallel to the surface and its corresponding band (∼1444 cm−1) would be weaker. The spectra collected at higher voltages are consistent with the molecules being vertically adsorbed. However, when the RhB molecules are horizontally adsorbed on the graphite surface (Fig. 4f), the xanthene ring plane (blue area) is parallel to the surface and its corresponding in-plane vibration peak (∼1506 cm−1) would be weaker. Meanwhile, the ethylamino group (red area) would be normal to the surface and its corresponding band (∼1444 cm−1) would be stronger. The spectra collected at lower voltages are consistent with the results of the horizontal adsorption of RhB on the graphite surface. Based on the above results, we can conclude that the RhB molecules are vertically adsorbed on the graphite surface at higher applied voltages, while they are horizontally adsorbed on the graphite surface at lower applied voltages. This analysis allows us to speculate that the enhancement of the Li/graphite cell performance is related to the additive adsorption orientation. We will analyze this in the next section.
In order to confirm our hypothesis, we performed control experiments using both sulforhodamine B (S-RhB) and rhodamine 6G (Rh6G), which have similar molecular structures to RhB (Fig. S9a and S10a†). The cycle performance and coulombic efficiency of the Li/graphite cells with S-RhB and Rh6G additives were initially tested (Fig. S9 and S10†). Compared to the Li/graphite cells without electrolyte additives, the cycle performance and coulombic efficiency of the Li/graphite cells with S-RhB or Rh6G additives were not obviously enhanced, and different from the already discussed case of RhB. After that, in situ SERS was performed for the Li/graphite cells with S-RhB and Rh6G as additives (Fig. 5). As shown in Fig. 5a and b, the Raman spectra of S-RhB have no obvious change with the applied potential. The intensity of the peaks centered at 787, 1436, 1469, and 1592 cm−1 is relatively weak while the intensity of peaks centered at 1128, 1506, and 1565 cm−1 is relatively strong, independent of the applied potential (Fig. 5d, f and S11†). This result indicates that the adsorption orientation of S-RhB on the graphite surface is independent of the applied potential. According to the peak assignment for the S-RhB molecules (Table S1†), we can infer that S-RhB molecules are vertically adsorbed on the graphite surface during the entire cell cycling (following the same type of reasoning as for RhB).
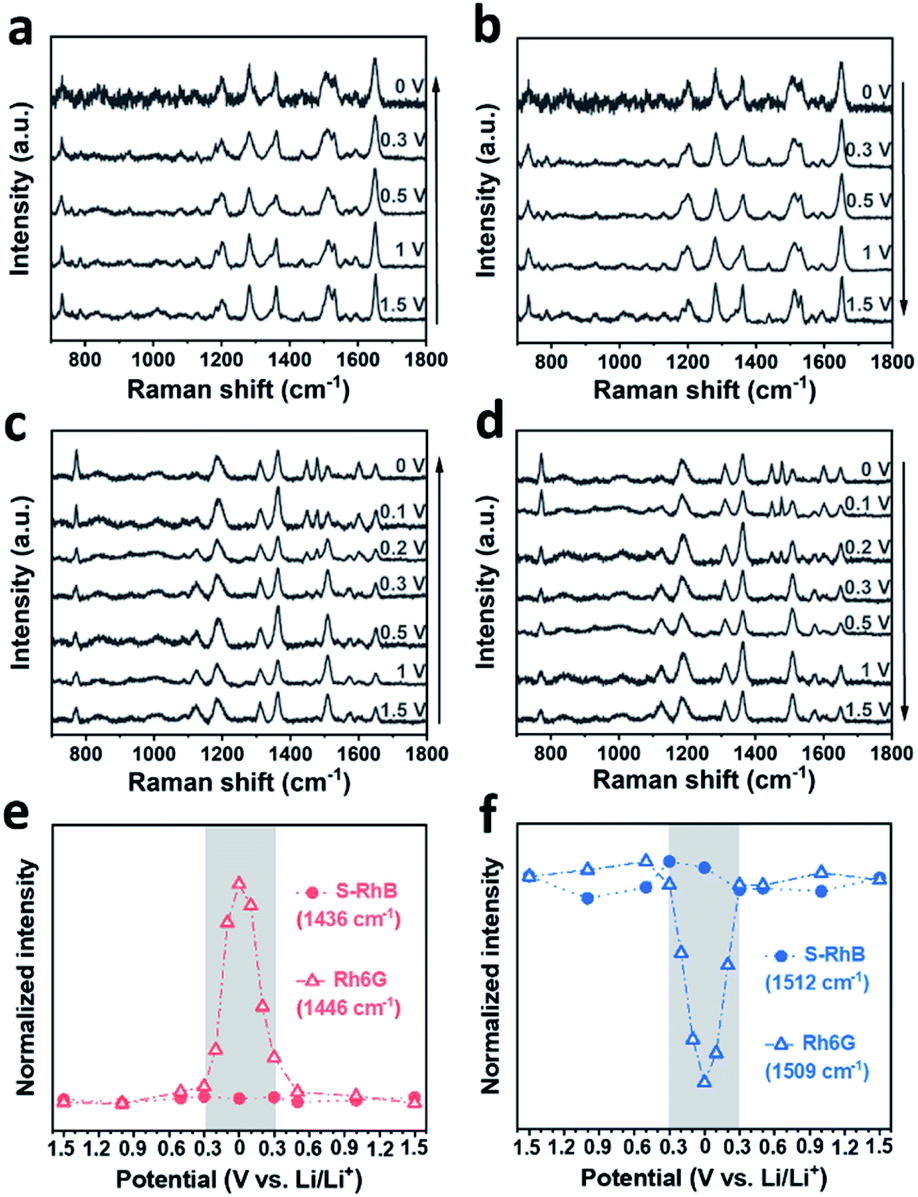 | ||
| Fig. 5 In situ SERS spectra of S-RhB during (a) charging and (b) discharging and of Rh6G during (c) charging and (d) discharging. Arrows indicate the voltage direction. The variation trend of the intensity of Raman peaks corresponding to the (e) ethylamino groups and (f) xanthene ring in S-RhB and Rh6G molecules with the change of voltage. | ||
Now we will perform the same analysis as before but for Rh6G molecules. In Fig. 5c, it can be observed that when the voltage is scanned in the range of 1.5–0.3 V, the Raman spectra of Rh6G do not present any obvious change. As the voltage is further reduced, the intensity of the peaks centered at 774, 1446, 1478, and 1598 cm−1 starts to increase while the intensity of peaks centered at 1125, 1509, and 1575 cm−1 starts to increase. In Fig. 5d, the reverse transformation of these 7 peaks is observed. The intensity variation trend of the Raman bands for Rh6G is summarized in Fig. 5e, f and S11.† In Fig. 5e, it can be observed clearly that the intensity of the Rh6G peak centered at 1446 cm−1 rapidly changes in the voltage range of 0.3–0 V. Meanwhile, the intensity of the Rh6G peak centered at 1509 cm−1 rapidly decreases and later increases during charging and discharging (Fig. 5f).
The peak assignment of Rh6G is revealed in Table S1.† A similar analysis to the one performed with RhB and S-RhB was conducted for Rh6G. We can conclude that Rh6G has a similar adsorption behavior to the one of rhodamine B and that the adsorption orientation of Rh6G could change from vertical to horizontal with the applied voltage. However, the voltage region for the adsorption orientation transformation of molecules is different for RhB and Rh6G: 1.2–0.3 V for RhB and 0.3–0 V for Rh6G. It is well known that the intercalation of lithium ions into graphite layers mainly occurs at voltages lower than 0.2 V.48,49 In other words, during the intercalation of lithium ions, RhB molecules are horizontally adsorbed on the surface while Rh6G molecules are still vertically adsorbed. Because lithium ions are solvated with solvent molecules in the electrolyte, the intercalation of lithium ions will lead to the insertion of solvent molecules into graphite, which damages the cell performance.12,50 As such, the adsorption orientation of the additive can have a great impact on the cell performance and stability and could open new pathways for additive design and mechanistic studies.
On the basis of the above experimental analyses, the proposed mechanism of RhB to enhance the graphite performance is described in Fig. 6. In the bare electrolyte, more electrolyte-solvent would decompose on the electrolyte surface to form a thicker SEI film. In addition, solvent molecules will also intercalate into graphite layers together with lithium ions, resulting in the collapse of the graphite structure. When we add the electrolyte additive of vertical adsorption, it would be similar to the case without electrolyte additives because the vertically adsorbed molecules have weak steric hindrance and are not able to effectively suppress the decomposition and intercalation of electrolyte solvents. But when additive molecules are horizontally adsorbed on the graphite surface above the lithium intercalation voltage, they would have greater steric hindrance, which can effectively prevent the solvent molecules from approaching the graphite electrode and embedding into graphite layers. This behavior would suppress the decomposition and intercalation of electrolyte solvents, thereby reducing the thickness of the SEI film and improving the stability of the graphite electrode. Accordingly, lithium-ion batteries exhibit excellent coulombic efficiencies, cycling capabilities and rate performances in RhB-containing electrolyte.
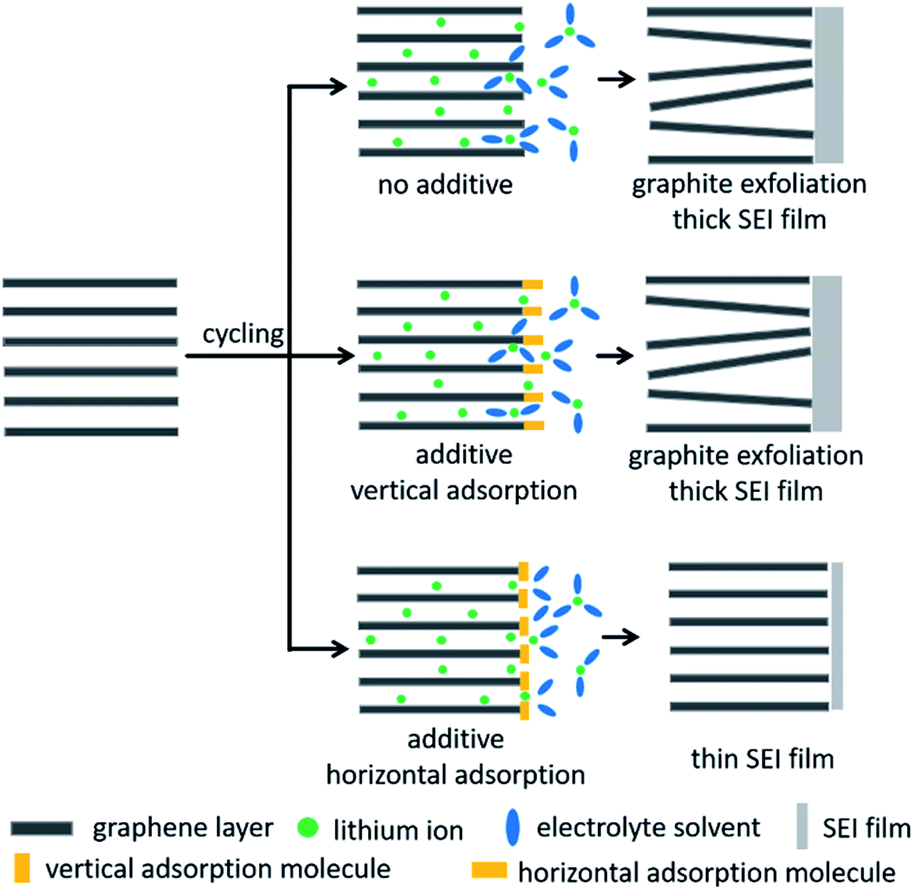 | ||
| Fig. 6 Schematic of the mechanism to enhance the performance of graphite in 0.2 wt% RhB-containing electrolyte. | ||
Finally, in order to optimize the concentration of RhB, the cycle performance of Li/graphite cells containing 0.1 wt%, 0.2 wt%, and 0.5 wt% RhB was evaluated (Fig. S12†). The discharge capacities of Li/graphite cells with 0.1 wt%, 0.2 wt% and 0.5 wt% RhB at 0.2C and after 200 cycles were 340.9, 352.5, and 348.6 mA h g−1, respectively, corresponding to capacity retentions of 93.0%, 96.5% and 95.3%. This result shows that the electrolyte with 0.2 wt% RhB displays the best cycle performance.
Conclusions
In summary, rhodamine B is used as an additive in the ester-based electrolyte to improve the performance of Li/graphite cells. In situ SERS was employed to monitor the evolution of RhB molecules with the applied potential at the graphite/electrolyte interface. Specifically, in situ measurements reveal that RhB molecules can change from vertical to horizontal adsorption on the graphite surface at higher voltages than the Li+-solvent co-intercalation. This behavior would restrain the decomposition of electrolytes and corrosion of graphite while improving the overall performance of the cell. This study provides a new strategy for electrolyte additive design and demonstrates that SERS is applicable to detect the interfacial behavior of molecules in battery systems.Author contributions
Chenbo Zhu performed the main experiments. Chenhao Fan performed the DFT calculations. Chenbo Zhu, Emiliano Cortés and Wei Xie wrote the paper. Emiliano Cortés and Wei Xie supervised the research project.Conflicts of interest
There are no conflicts to declare.Acknowledgements
This work was supported by the National Natural Science Foundation of China (grants 21861132016, 22022406 and 21775074), the Natural Science Foundation of Tianjin (grants 20JCJQJC00110 and 20JCYBJC00590), the 111 project (grant B12015), and the National Key R&D Program (grants 2017YFA0206702 and 2016YFB0901502). C. F. and E. C. acknowledge funding and support from the Deutsche Forschungsgemeinschaft (DFG, German Research Foundation) under Germany's Excellence Strategy – EXC 2089/1 – 390776260, the Bavarian program Solar Energies Go Hybrid (SolTech), the Center for NanoScience (CeNS) and the European Commission through the ERC Starting Grant CATALIGHT (802989).Notes and references
- S. Chu and A. Majumdar, Nature, 2012, 488, 292 CrossRef PubMed.
- S. Chu, Y. Cui and N. Liu, Nat. Mater., 2016, 16, 16 CrossRef PubMed.
- M. Li, J. Lu, Z. Chen and K. Amine, Adv. Mater., 2018, 30, 1800561 CrossRef PubMed.
- P. Roy and S. K. Srivastava, J. Mater. Chem. A, 2015, 3, 2454 RSC.
- B. Zhu, X. Wang, P. Yao, J. Li and J. Zhu, Chem. Sci., 2019, 10, 7132 RSC.
- R. Wang, W. Cui, F. Chu and F. Wu, J. Energy Chem., 2020, 48, 145 CrossRef.
- Q. Wang, C. Yang, J. Yang, K. Wu, C. Hu, J. Lu, W. Liu, X. Sun, J. Qiu and H. Zhou, Adv. Mater., 2019, 31, 1903248 CrossRef CAS PubMed.
- J. Zheng, M. S. Kim, Z. Tu, S. Choudhury, T. Tang and L. A. Archer, Chem. Soc. Rev., 2020, 49, 2701 RSC.
- Y. Zhao, X. Li, B. Yan, D. Xiong, D. Li, S. Lawes and X. Sun, Adv. Energy Mater., 2016, 6, 1502175 CrossRef.
- H. Zhang, Y. Yang, D. Ren, L. Wang and X. He, Energy Storage Mater., 2021, 36, 147 CrossRef.
- L. S. Kanevskii and V. S. Dubasova, Russ. J. Electrochem., 2005, 41, 3 Search PubMed.
- J. Vetter, P. Novák, M. R. Wagner, C. Veit, K.-C. Möller, J. O. Besenhard, M. Winter, M. Wohlfahrt-Mehrens, C. Vogler and A. Hammouche, J. Power Sources, 2005, 147, 269 CrossRef CAS.
- W. Liu, P. Liu and D. Mitlin, Adv. Energy Mater., 2020, 10, 2002297 CrossRef CAS.
- S. Li, X. S. Wang, Q. D. Li, Q. Liu, P. R. Shi, J. Yu, W. Lv, F. Kang, Y. B. He and Q. H. Yang, J. Mater. Chem. A, 2021, 9, 7667 RSC.
- R. Wang, X. Li, Z. Wang and H. Zhang, Nano Energy, 2017, 34, 131 CrossRef CAS.
- J. Shi, N. Ehteshami, J. Ma, H. Zhang, H. Liu, X. Zhang, J. Li and E. Paillard, J. Power Sources, 2019, 429, 67 CrossRef CAS.
- H. Zhao, X. Yu, J. Li, B. Li, H. Shao, L. Li and Y. Deng, J. Mater. Chem. A, 2019, 7, 8700 RSC.
- Y. X. Yao, C. Yan and Q. Zhang, Chem. Commun., 2020, 56, 14570 RSC.
- A. M. Tripathi, W. N. Su and B. J. Hwang, Chem. Soc. Rev., 2018, 47, 736–851 RSC.
- M. Nie, D. Chalasani, D. P. Abraham, Y. Chen, A. Bose and B. L. Lucht, J. Phys. Chem. C, 2013, 117, 1257 CrossRef CAS.
- L. Seidl, S. Martens, J. Ma, U. Stimming and O. Schneider, Nanoscale, 2016, 8, 14004 RSC.
- R. baddour-Hadjean and J. Pereira-Ramos, Chem. Rev., 2010, 110, 1278 CrossRef CAS PubMed.
- V. Stancovski and S. Badilescu, J. Appl. Electrochem., 2014, 44, 23 CrossRef CAS.
- J. Zou, C. Sole, N. E. Drewett, M. Velický and L. J. Hardwick, J. Phys. Chem. Lett., 2016, 7, 4291 CrossRef CAS PubMed.
- M. A. Cabañero, M. Hagen and E. Quiroga-González, Electrochim. Acta, 2021, 374, 137487 CrossRef.
- X. Q. Cheng, H. J. Li, Z. X. Zhao, Y. Z. Wang and X. M. Wang, New Carbon Mater., 2021, 36, 93 CrossRef.
- C. Sole, N. E. Drewett and L. J. Hardwick, Faraday Discuss., 2014, 172, 223 RSC.
- W. Xie, B. Walkenford and S. Schlücker, J. Am. Chem. Soc., 2013, 135, 1657 CrossRef CAS PubMed.
- S. E. J. Bell, G. Charron, E. Cortés, J. Kneipp, M. L. de la Chapelle, J. Langer, M. Procházka, V. Tran and S. Schlücker, Angew. Chem., Int. Ed., 2020, 59, 5454 CrossRef CAS PubMed.
- E. Cortés, P. G. Etchegion, E. C. Le Ru, A. Fainstein, M. E. Vela and R. Salvarezza, J. Am. Chem. Soc., 2013, 135, 2809 CrossRef PubMed.
- E. Cortés, P. G. Etchegion, E. C. Le Ru, A. Fainstein, M. E. Vela and R. Salvarezza, J. Am. Chem. Soc., 2010, 132, 18034 CrossRef PubMed.
- S. Hy, F. Felix, J. Rick, W. N. Su and B. J. Hwang, J. Am. Chem. Soc., 2014, 136, 999 CrossRef CAS PubMed.
- S. Hy, F. Felix, Y. H. Chen, J. Y. Liu, J. Rick and B. J. Hwang, J. Power Sources, 2014, 256, 324 CrossRef CAS.
- Y. Miroshnikov, J. F. Yang, V. Shokhen, M. Alesker, G. Gershinsky, A. Kraytsberg, Y. Ein-Eli and D. Zitoun, ACS Appl. Energy Mater., 2018, 1, 1096 CrossRef CAS.
- D. Chen, M. A. Mahmoud, J. Wang, G. H. Waller, B. Zhao, C. Qu, M. A. El-Sayed and M. Liu, Nano Lett., 2019, 19, 2037 CrossRef CAS PubMed.
- L. Cabo-Fernandez, D. Bresser, F. Braga, S. Passerini and L. J. Hardwick, Batteries Supercaps, 2019, 2, 168 CrossRef CAS.
- Y. Ha, B. J. T. D. Villers, Z. Li, Y. Xu, P. Stradins, A. Zakutayev, A. Burrell and S. Han, J. Phys. Chem. Lett., 2020, 11, 286 CrossRef CAS PubMed.
- A. Gajan, C. Lecourt, B. E. T. Bautista, L. Fillaud, J. Demeaux and I. T. Lucas, ACS Energy Lett., 2021, 6, 1757 CrossRef CAS.
- M. J. Piernas-Muñoz, A. Tornheim, S. Trask, Z. Zhang and I. Bloom, Chem. Commun., 2021, 57, 2253 RSC.
- N. G. Bastús, J. Comenge and V. Puntes, Langmuir, 2011, 27, 11098 CrossRef PubMed.
- J. F. Li, Y. F. Huang, Y. Ding, Z. L. Yang, S. B. Li, X. S. Zhou, F. R. Fan, W. Zhang, Z. Y. Zhou, D. Y. Wu, B. Ren, Z. L. Wang and Z. Q. Tian, Nature, 2010, 464, 392 CrossRef CAS PubMed.
- F. C. Tai, S. C. Lee, J. Chen, C. Wei and S. H. Chang, J. Raman Spectrosc., 2009, 40, 1055 CrossRef CAS.
- X. Y. Yuan and R. A. Mayanovic, Appl. Spectrosc., 2017, 71, 2325 CrossRef CAS PubMed.
- S. Piscanec, M. Cantoro, A. C. Ferrari, J. A. Zapien, Y. Lifshitz, S. T. Lee, S. Hofmann and J. Robertson, Phys. Rev. B, 2003, 68, 241312 CrossRef.
- S. Selvasekarapandian, R. Baskaran, O. Kamishima, J. Kawamura and T. Hattori, Spectrochim. Acta, Part A, 2006, 65, 1234 CrossRef CAS PubMed.
- J. E. Pemberton, M. A. Bryant, R. L. Sobocinski and S. L. Joa, J. Phys. Chem., 1992, 96, 3776 CrossRef CAS.
- M. Dendisová-Vyškovská, A. Kokaislová, M. Oncák and P. Matějka, J. Mol. Struct., 2013, 1038, 19 CrossRef.
- T. Abe, Y. Mizutani and M. Asano, J. Electrochem. Soc., 1995, 142, 20 CrossRef.
- V. A. Sethuraman, L. J. Hardwick, V. Srinivasan and R. Kostecki, J. Power Sources, 2010, 195, 3655 CrossRef CAS.
- D. Li, D. L. Danilov, L. Gao, Y. Yang and P. H. L. Notten, J. Electrochem. Soc., 2016, 163, A3016 CrossRef CAS.
Footnote |
| † Electronic supplementary information (ESI) available. See DOI: 10.1039/d1ta04218a |
| This journal is © The Royal Society of Chemistry 2021 |