
 Open Access Article
 This Open Access Article is licensed under a
 Creative Commons Attribution 3.0 Unported Licence
Why is the O3 to O1 phase transition hindered in LiNiO2 on full delithiation?†
Naohiro
Ikeda
a,
Itsuki
Konuma
a,
Hongahally Basappa
Rajendra
b,
Taira
Aida
c and
Naoaki
Yabuuchi
 *abd
*abd
aDepartment of Chemistry and Life Science, Yokohama National University, 79-5 Tokiwadai, Hodogaya-ku, Yokohama, Kanagawa 240-8501, Japan
bAdvanced Chemical Energy Research Center, Yokohama National University, 79-5 Tokiwadai, Hodogaya-ku, Yokohama, Kanagawa 240-8501, Japan
cSumitomo Metal Mining Co. Ltd, Battery Research Laboratories, 17-3, Isoura-cho, Nihama, Ehime 792-0002, Japan
dElements Strategy Initiative for Catalysts and Batteries, Kyoto University, f1-30 Goryo-Ohara, Nishikyo-ku, Kyoto 615-8245, Japan. E-mail: yabuuchi-naoaki-pw@ynu.ac.jp
First published on 25th June 2021
Abstract
Ni-enriched layered materials are utilized as positive electrode materials of high-energy Li-ion batteries. Because electrode reversibility is gradually lost for stoichiometric LiNiO2 after continuous cycles, Ni ions are partially substituted by other metal ions (Co, Mn, Al etc.). However, the origin of deterioration in stoichiometric LiNiO2 is still not fully understand yet. Moreover, the loss of capacities is observed only in the high voltage region (>4.1 V), which is obviously different from the failure mode observed in other electrode materials. Here, we report for the first time the origin of deterioration, which is revealed by an in situ X-ray diffraction study. For fully charged NiO2, Ni ions migrate from original octahedral sites in NiO2 slabs to face-sharing tetrahedral sites in Li layers, by which the O3 to O1 phase transition is suppresed. Note that Ni migration is a reversible process, and the Ni ions migrate back to the original octahedral sites on discharge. However, after continuous cycles, the reversibility of Ni migration is gradually lost, and Ni ions are partially left at the tetrahedral sites in Li layers. Electrode kinetics are also deteriorated because of the Ni occupation in Li layers, and the accumulation of Ni ions at tetrahedral sites results in the loss of reversible capacities in the high voltage region. This finding opens a new way to design high-capacity Ni-enriched electrode materials, leading to the development of high-energy Li-ion batteries.
Li-containing layered oxides are used for energy storage applications since the historic inception of LiCoO2 in 1980.1 LiCoO2 is isostructural with α-NaFeO2 whose structure consists of a cubic close packed (ccp) array of oxide ions, and Co and Li ions are filled at vacant octahedral sites in the ccp array of anionic species.2 Neighboring CoO6 or LiO6 octahedra share three edges, forming CoO2 and LiO2 slabs. These CoO2 and LiO2 slabs are alternately stacked, forming the α-NaFeO2-type layered structure. The α-NaFeO2-type layered structure is also classified as an O3-type layered structure according to Delmas' notation.3 Herein, “O” indicates that Li ions are located at octahedral Li sites in LiCoO2, and “3” denotes that three CoO2 slabs are found in the unit cell. When LiCoO2 is charged in a Li cell, trivalent Co ions are oxidized to tetravalent Co ions. Simultaneously, Li ions are extracted from the host structure for charge compensation. LixCoO2 shows an operating voltage of approximately 4 V vs. metallic Li and delivers a reversible capacity of ∼180 mA h g−1 with cationic redox of Co ions. LiCoO2, combined with a graphite negative electrode, is still widely used as a power source for mobile electronics applications.
Charging to high voltage (4.8 V) and removal of all Li ions from LiCoO2 result in gliding of CoO2 slabs, forming CoO2 with an O1-type layered structure, in which octahedral sites of Li layers share faces with the CoO6 octahedra. Large repulsive electrostatic interaction between Co and Li ions is anticipated for the O1 phase. The O1 phase transition is, therefore, allowed only for a fully delithiated phase, or a small number of Li ions is probably found at neighboring tetrahedral sites, which share edges with the CoO6 octahedra. This observation was first evidenced in 1996 by Amatucci et al. using an in situ X-ray diffraction (XRD) study.4 O1-type CoO2 is isostructural with CdI2 with space group P![[3 with combining macron]](https://www.rsc.org/images/entities/char_0033_0304.gif) m1. The formation of O1 CoO2 has also been reported in other publications.5,6 In contrast to LiCoO2, O1-type NiO2 cannot be easily obtained even though LiNiO2 is isostructural with LiCoO2. The formation of O1 NiO2 was reported after long time exposure at 4.45 V.7 The partial formation of the O1 NiO2 phase was also reported in LiNiO2 after acid treatment.8 The synthesis of stoichiometric LiNiO2 is difficult, and often results in the formation of non-stoichiometric Li1−xNixNiO2. Ni2+ ions are located at Li sites in Li1−xNixNiO2, and these and extra Ni ions disturb the phase transition from the O3 to O1 phase.8 Thermal instability of NiO2 is another practical issue as an electrode material.9,10
m1. The formation of O1 CoO2 has also been reported in other publications.5,6 In contrast to LiCoO2, O1-type NiO2 cannot be easily obtained even though LiNiO2 is isostructural with LiCoO2. The formation of O1 NiO2 was reported after long time exposure at 4.45 V.7 The partial formation of the O1 NiO2 phase was also reported in LiNiO2 after acid treatment.8 The synthesis of stoichiometric LiNiO2 is difficult, and often results in the formation of non-stoichiometric Li1−xNixNiO2. Ni2+ ions are located at Li sites in Li1−xNixNiO2, and these and extra Ni ions disturb the phase transition from the O3 to O1 phase.8 Thermal instability of NiO2 is another practical issue as an electrode material.9,10
Recently, Sun et al. developed the synthesis method of nearly stoichiometric LiNiO2 at 650 °C in an oxygen atmosphere, and nearly stoichiometric LiNiO2 delivers a reversible capacity of 240 mA h g−1, which corresponds to 90% of the theoretical capacity of LiNiO2, at a rate of 18 mA g−1.11 Nevertheless, the formation of O1 NiO2 was not evidenced after the extraction of nearly all Li ions, and instead, an increase in the peak intensity at the 101 diffraction line was noted.11 In this article, the phase transition process of nearly stoichiometric LiNiO2 is carefully examined by in situ XRD and high-resolution ex situ synchrotron XRD studies. Our analysis reveals that Ni ions migrate to adjacent tetrahedral sites in Li layers on charging, which is a reversible process for the initial few cycles. Nevertheless, the reversible capacity in the high voltage region is gradually lost because Ni ions are in part left at tetrahedral sites in the Li layers after continuous cycles. This fact results in the loss of the reversible capacity only in the high voltage region (>4.1 V), but not in the low voltage region (<4.1 V). The finding, including the suppression of O1 phase formation in NiO2, is clearly a new criterion to explain the deterioration of LiyNiO2, which potentially provides alternative approaches to design high capacity Ni-based electrode materials.
Nearly stoichiometric LiNiO2 was synthesized by the methodology developed by Sun et al. LiOH·H2O (Wako Chemical Co.) was crushed into fine powder by using a mortar and pestle. Thus obtained LiOH·H2O powder was mixed with Ni(OH)2 (Wako Chemical Co.) by using a mortar and pestle, and then a mixture of LiOH·H2O and Ni(OH)2 was pressed into a pellet. 3 mol% excess LiOH was utilized to compensate for the vaporization of LiOH on heating. The pellet was heated at 650 °C in an oxygen atmosphere for 12 h. The sample after calcination was stored in an Ar-filled glove box because LiNiO2 reacts with moisture in air.12 The XRD pattern and morphological character of LiNiO2 discussed in this study are shown in ESI Fig. S1a,† and the sample delivers an initial reversible capacity of 220 mA h g−1 at 10 mA g−1 as shown in ESI Fig. S1b.† Selected galvanostatic charge/discharge curves are shown in Fig. 1a. Coulombic efficiency is also plotted in ESI Fig. S1c.† Although the reversible capacity deteriorated from 220 to 160 mA h g−1 after 30 continuous cycles, the reversible capacity is lost only in the high voltage region (>4.1 V). No capacity reduction is evidenced in the voltage region below 4.1 V, which is clearly displayed in the differential dQ/dE curves shown in Fig. 1b. The peak at 4.2 V is gradually lost after 30 continuous cycles while symmetric oxidation/reduction profiles are retained in other peaks below 4.1 V. Observed discharge capacities in different voltage regions are also plotted in Fig. 1c. Similar deterioration of the electrode reversibility in the high-voltage region is also reported in a recent publication.13 The loss of reversible capacity only in the high voltage region suggests that the loss of reversible capacities originates from intrinsic phase transition behavior of the high voltage region as discussed in a later section. This observation also indicates that the below three failure mechanisms are eliminated and/or negligible; (1) the loss of electrical contact and isolation of particles in the composite electrode, associated with pulverization of LiNiO2, (2) dissolution of active materials in electrolyte, (3) the damage to the crystal structure, for instance oxygen loss from the crystal lattice. These failure processes inevitably result in the loss of reversible capacity in the entire voltage region, which cannot explain the degradation process of LiNiO2 as observed in Fig. 1. Note that the impedance is gradually increased upon electrochemical cycling (ESI Fig. S1d†). Similar degradation of reversible capacities and the growth of impedance were also reported with 4.3 V cut-off for LiyNiO2 (ref. 11) (4.5 V cut-off was used in this study). Because electrolyte decomposition would be ignored with 4.3 V cut-off, it is anticipated that electrolyte decomposition and surface film formation are also less responsible for the degradation process.
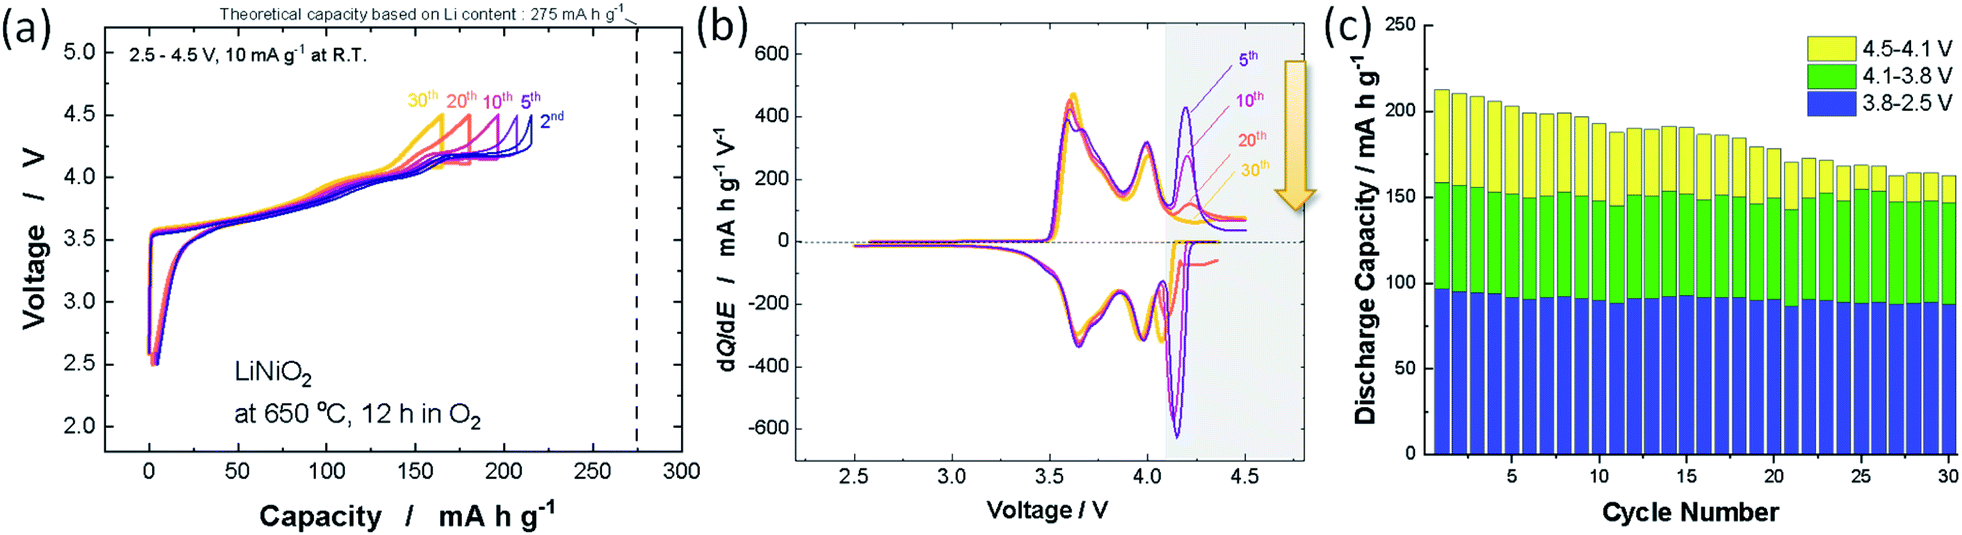 | ||
| Fig. 1 (a) Galvanostatic charge/discharge curves of LiNiO2 at a rate of 10 mA g−1, (b) differential dQ/dE plots obtained from (a), and (c) variations in discharge capacities with different voltage ranges. | ||
To assess the loss of electrode reversibility in LiyNiO2 in the high voltage region, in situ XRD data were collected, and the data were compared with those of LiyCoO2. The XRD pattern and electrochemical data of LiCoO2 used in this study are shown in ESI Fig. S2.†In situ XRD patterns were obtained using an electrochemical cell equipped with a Be window and XRD diffractometer (Bruker, D8 Advance). The slurry was pasted on thin Al foil (5 μm) and used as a composite electrode for in situ measurements. The cell was charged at a rate of 5 mA g−1 and the XRD data were collected in an initial charge process. Fig. 2 compares the in situ XRD patterns of LiyNiO2 and LiyCoO2 with charge curves at a slow rate of 5 mA g−1. Phase transition processes observed in LiyCoO2 are consistent with the literature,5 and the original rhombohedral phase with a cubic close-packed lattice changes into the O1 phase with a hexagonal close-packed lattice via the intermediate phases, monoclinic Li0.5CoO2 and rhombohedral Li0.25CoO2 with the O3/O1 intergrown layered structure (often denoted as the H1-3 phase5). The O3 to O1 phase transition is accompanied by a larger change in interlayer distances (a gap of 0.54 Å for Li0.5CoO2 and CoO2). Gliding of CoO2 layers is also required for the O3 to O1 phase transition. Moreover, to form the O1 phase, charging to high voltage (>4.5 V) is needed, which destabilizes the surface of oxides.14,15 Therefore, deterioration of capacity retention is observed for LiCoO2 when nearly all Li ions are extracted from the host structure (ESI Fig. 2b). In contrast, a clearly different trend is noted for LiNiO2. The formation of the O1 phase is not evidenced and rhombohedral symmetry is retained after charging to 4.5 V. The 003 diffraction line for the fully charged sample is found at 19.6°, which is located at a lower diffraction angle when compared with the 001 diffraction line for O1 CoO2 at 20.6°. In addition, a relatively small gap for interlayer distances (0.33 Å) is observed for Li0.3NiO2 and NiO2 which have the longest and shortest interlayer distances, respectively. Note that the peak intensity of 101 and 110 diffraction lines is clearly increased for NiO2 after charging to 4.5 V. The highest intensity for the 101 diffraction line is observed after charging to 4.5 V. Ex situ synchrotron XRD patterns of before and after charging to 4.5 V are shown in Fig. 3a. Synchrotron XRD data were collected at the beamline BL16B2 in SPring-8 synchrotron facility in Japan.16 The measurement was conducted using an automatic powder diffraction system for Debye–Scherrer geometry using a capillary sample. The wavelength of X-rays was calibrated to be 0.500 Å with the CeO2 reference. A similar XRD pattern to our observation has also been reported in a publication by Sun et al.11 The increase in the peak intensity of the 101 diffraction line has also been reported for LixNi0.5Mn0.5O2,17,18 and such a change originates from Ni(Li) ion occupation at tetrahedral sites (6c sites). In Na insertion layered materials, Fe migration from metal oxide slabs to face-shared tetrahedral sites in Na layers has also been reported.19 Therefore, the XRD patterns of NiO2 are simulated with different cation distributions (Fig. 3b). In the simulation, Ni ion migration from the original octahedral sites to face-shared tetrahedral sites in the Li layers is assumed. The intensity of the 101 and 110 lines is intensified with an increase in the enrichment of Ni ions at tetrahedral sites and less occupation at original octahedral sites. The simulated patterns in Fig. 3b clearly show that a non-negligible amount of Ni ions is occupied at tetrahedral sites in Li layers of NiO2. When 15% of Ni ions migrate to the tetrahedral 6c sites, the intensity of the 101 diffraction line becomes higher than both 003 and 104 diffraction lines. However, peak broadening is also observed for 10l diffraction lines in the experimentally observed diffraction pattern of NiO2. This observation is indicative of the presence of stacking faults, and O1 domains are partially formed in O3 NiO2.7 The peak broadening associated with stacking faults results in the difficulty to estimate the detailed cation distribution in NiO2, but Ni ion migration to the tetrahedral sites is clearly non-negligible as shown in Fig. 3. To further examine possibility of the O1 phase transition for NiO2, voltage holding is applied for 100 h at 4.5 V. However, a similar phase without voltage holding is observed as shown in ESI Fig. S4.† In addition, two new peaks at 4.07 and 8.13° appear as shown in the enlarged pattern of Fig. 3a. These two peaks are successfully assigned to 002 and 004 diffraction lines, which would originate from the presence of additional through-plane Ni ion ordering at the tetrahedral sites. The structural model of cation ordering at tetrahedral sites has not been solved yet. From these results, it is concluded that the O1 phase transition is hindered by the Ni ions at tetrahedral sites in Li layers, and thus the O3 phase is retained in NiO2.
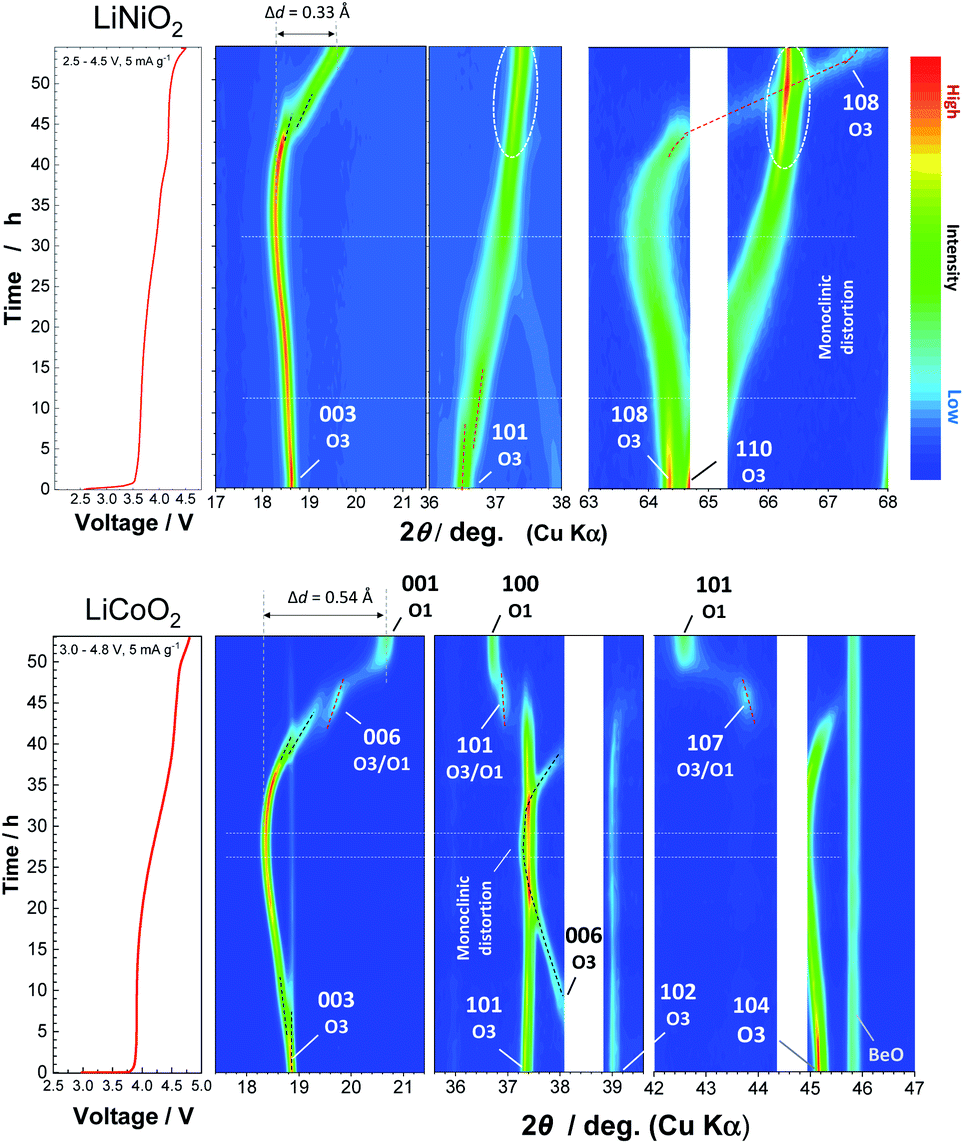 | ||
| Fig. 2 Contour plots for selected ranges obtained from the in situ XRD patterns of LiNiO2 and LiCoO2 at a rate of 5 mA g−1, and corresponding initial charge curves in electrochemical cells are also shown. The original in situ XRD data are shown in ESI Fig. S3.† | ||
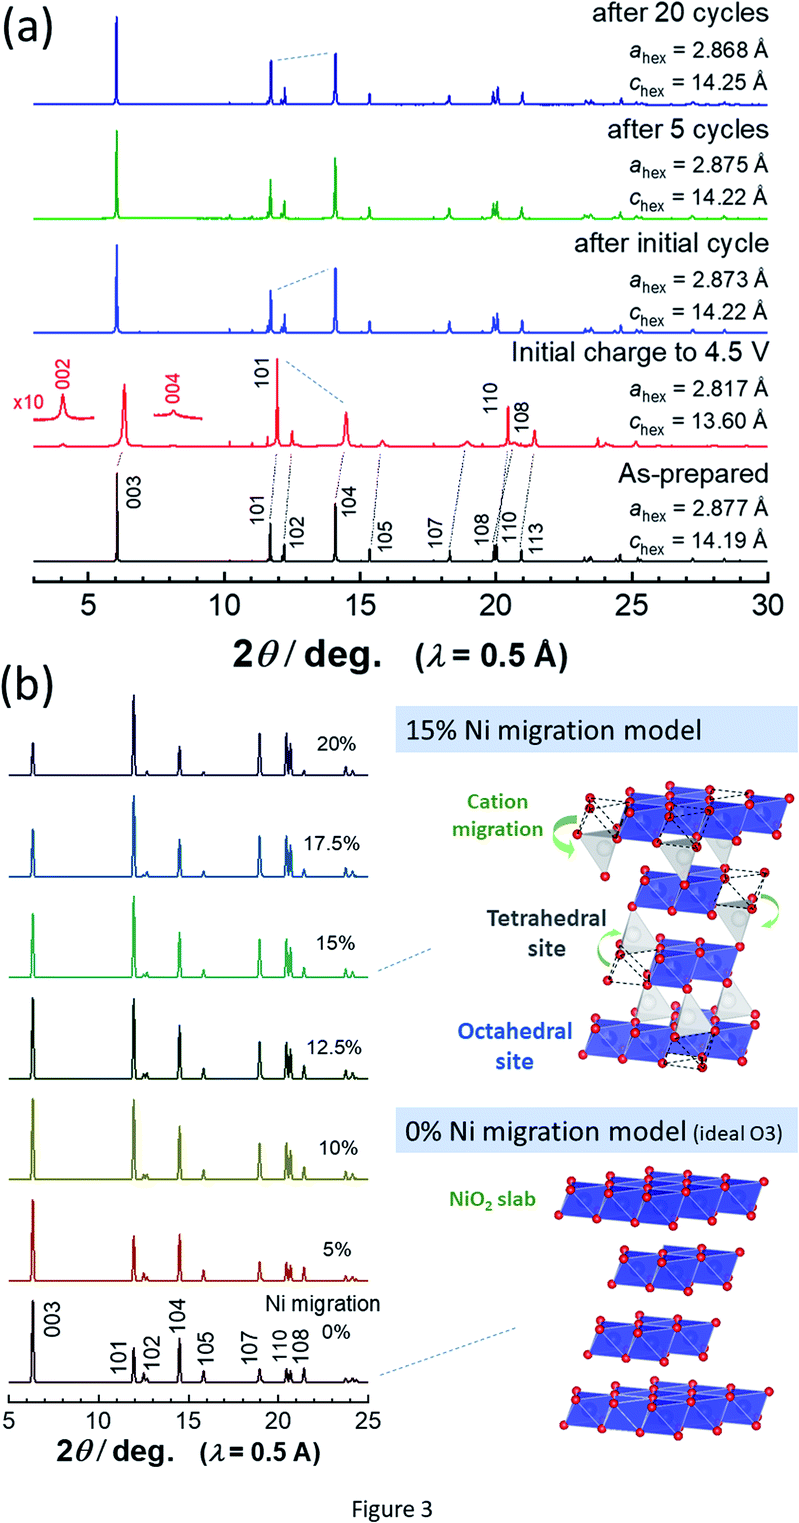 | ||
| Fig. 3 (a) Synchrotron XRD patterns of LiNiO2 before and after electrochemical cycles, and (b) simulated XRD patterns with different occupancy of Ni ions at tetrahedral 6c sites. Schematic illustrations of structural models of NiO2 are shown, which were drawn using the program VESTA.20 | ||
Note that such Ni ion migration is a reversible process. After reduction to 2.5 V in a Li cell, Ni ions migrate back to the original octahedral sites. However, changes in the peak intensity for 101 and 104 diffraction lines upon electrochemical cycling are noted in LiNiO2 after 20 cycles as shown in Fig. 3a. This finding suggests that the reversibility of Ni ion migration is gradually lost upon cycling, and Ni ions are in part left at tetrahedral sites in Li layers. The results of Rietveld analysis of synchrotron XRD patterns of the as-prepared LiNiO2 and the samples after the initial cycle and 20 cycles are shown in ESI Fig. S5† and 4. Rietveld refinement was carried out using RIETAN-FP software.21 A good fitting result is obtained for as-prepared LiNiO2 without the consideration of Ni ion occupation in the Li layer. After the initial cycle, a similar result is obtained without Ni ions at 6c tetrahedral sites, indicating that Ni ion migration is a reversible process. However, the intensity of the 101 diffraction line is obviously increased after 20 cycles, and an insufficient fitting result is obtained when Ni ion occupation at the tetrahedral 6c sites is not considered (Fig. 4a). The fitting result is significantly improved with the assumption of Ni ion occupation at tetrahedral sites (7%) in the Li layers as shown in Fig. 4b. In the analysis, the chemical composition is hypothesized as Li0.82NiO2, which is the same as that of the sample after the initial cycle because similar voltage profiles are obtained for <4.1 V region for both the initial and 20th cycles. Li ions are assumed to be kinetically trapped in the structure, leading to the gradual loss of reversible capacity in the high voltage region, associated with the enrichment of Ni ions at the tetrahedral sites. Indeed, the gradual increase in impedance upon electrochemical cycling in the fully charged state has been found as shown in ESI Fig. S1d.† The gradual loss of Ni migration reversibility is expected to originate from the kinetic limitation. Li migration is also impeded by Ni ions in the Li layer, leading to the sluggish electrode kinetics. Note that such unfavorable Ni ion migration to tetrahedral sites is effectively suppressed by substitution of Ni ions by other metal ions, leading to the improvement of electrode reversibility in the high-voltage region, which will be reported in detail elsewhere. Although stoichiometric layered materials, like LiNiO2 derivatives, show excellent capacity retention as electrode materials,22,23 now the experimentally available reversible capacity is approaching its theoretical limit. To further increase reversible capacities, Li-enrichment in the host structure is necessary.24–27 A comparative study of degradation mechanisms for the stoichiometric and Li-enriched electrode materials leads to better understanding to design durable and high-energy positive electrode materials in the future.
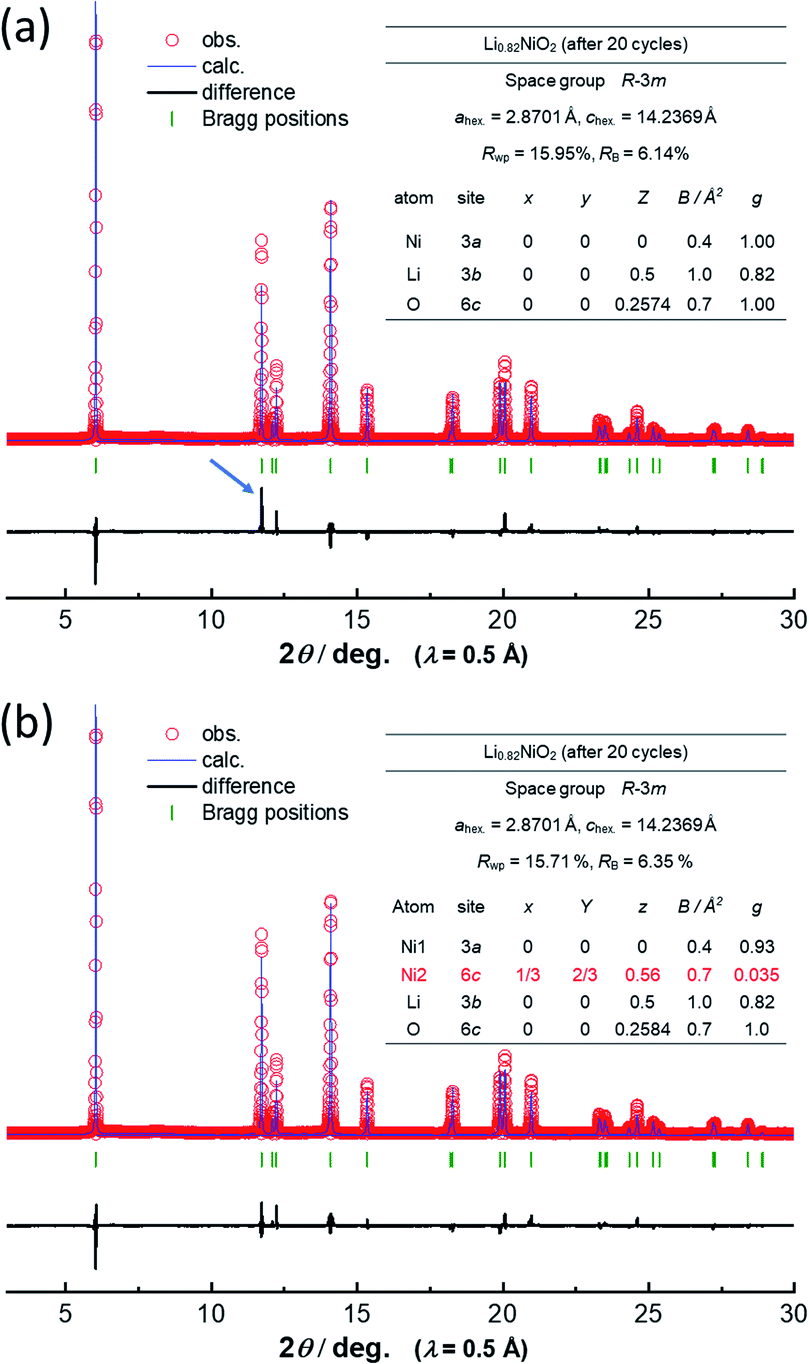 | ||
| Fig. 4 Comparison of fitting results of Rietveld analysis of the synchrotron XRD pattern of LixNiO2 after the 20-cycle test (a) without and (b) with the presence of Ni ions at 6c tetrahedral sites. A clear deviation between simulated and observed patterns for the 101 diffraction line is noted in (a) as marked by the blue arrow. | ||
Author contributions
Naohiro Ikeda: investigation, formal analysis, writing – original draft. Itsuki Konuma: formal analysis. Hongahally Basappa Rajendra: investigation. Taira Aida: investigation. Naoaki Yabuuchi: conceptualization, validation, writing – review & editing, funding acquisitionConflicts of interest
There are no conflicts to declare.Acknowledgements
NY acknowledges the partial support from JSPS, Grant-in-Aid for Scientific Research (Grant Numbers 15H05701, 19H05816, and 21H04698), and MEXT program “Elements Strategy Initiative to Form Core Research Center (JPMXP0112101003)”, and MEXT: Ministry of Education Culture, Sports, Science and Technology, Japan. The synchrotron radiation experiments were performed at the BL19B2 of SPring-8 with the approval of the Japan Synchrotron Radiation Research Institute (JASRI) (Proposal 2020A1830).Notes and references
- K. Mizushima, P. C. Jones, P. J. Wiseman and J. B. Goodenough, Mater. Res. Bull., 1980, 15, 783–789 CrossRef CAS.
- G. C. Mather, C. Dussarrat, J. Etourneau and A. R. West, J. Mater. Chem., 2000, 10, 2219–2230 RSC.
- C. Delmas, C. Fouassier and P. Hagenmuller, Physica B+C, 1980, 99, 81–85 CrossRef CAS.
- G. G. Amatucci, J. M. Tarascon and L. C. Klein, J. Electrochem. Soc., 1996, 143, 1114–1123 CrossRef CAS.
- Z. Chen, Z. Lu and J. R. Dahn, J. Electrochem. Soc., 2002, 149, A1604 CrossRef CAS.
- T. Motohashi, Y. Katsumata, T. Ono, R. Kanno, M. Karppinen and H. Yamauchi, Chem. Mater., 2007, 19, 5063–5066 CrossRef CAS.
- L. Croguennec, C. Pouillerie, A. N. Mansour and C. Delmas, J. Mater. Chem., 2001, 11, 131–141 RSC.
- H. Arai, M. Tsuda, K. Saito, M. Hayashi, K. Takei and Y. Sakurai, J. Solid State Chem., 2002, 163, 340–349 CrossRef CAS.
- H. Arai, M. Tsuda, K. Saito, M. Hayashi and Y. Sakurai, J. Electrochem. Soc., 2002, 149, A401 CrossRef CAS.
- M. Guilmard, L. Croguennec, D. Denux and C. Delmas, Chem. Mater., 2003, 15, 4476–4483 CrossRef CAS.
- C. S. Yoon, D.-W. Jun, S.-T. Myung and Y.-K. Sun, ACS Energy Lett., 2017, 2, 1150–1155 CrossRef CAS.
- H. S. Liu, Z. R. Zhang, Z. L. Gong and Y. Yang, Electrochem. Solid-State Lett., 2004, 7, A190 CrossRef CAS.
- C. Lee, Y. Yokoyama, Y. Kondo, Y. Miyahara, T. Abe and K. Miyazaki, ACS Appl. Mater. Interfaces, 2020, 12, 56076–56085 CrossRef CAS PubMed.
- Z. Chen and J. R. Dahn, Electrochem. Solid-State Lett., 2004, 7, A11 CrossRef CAS.
- N. Yabuuchi, Y. Kinoshita, K. Misaki, T. Matsuyama and S. Komaba, J. Electrochem. Soc., 2015, 162, A538–A544 CrossRef CAS.
- K. Osaka, Y. Yokozawa, Y. Torizuka, Y. Yamada, M. Manota, N. Harada, Y. Chou, H. Sasaki, A. Bergamaschi and M. Sato, AIP Conf. Proc., 2019, 2054, 050008 CrossRef.
- H. Kobayashi, Y. Arachi, H. Kageyama and K. Tatsumi, J. Mater. Chem., 2004, 14, 40–42 RSC.
- N. Yabuuchi, S. Kumar, H. H. Li, Y.-T. Kim and Y. Shao-Horn, J. Electrochem. Soc., 2007, 154, A566 CrossRef CAS.
- X. Li, Y. Wang, D. Wu, L. Liu, S.-H. Bo and G. Ceder, Chem. Mater., 2016, 28, 6575–6583 CrossRef CAS.
- K. Momma and F. Izumi, J. Appl. Crystallogr., 2011, 44, 1272–1276 CrossRef CAS.
- F. Izumi and K. Momma, Solid State Phenom., 2007, 130, 15–20 CAS.
- H.-H. Ryu, G.-T. Park, C. S. Yoon and Y.-K. Sun, J. Mater. Chem. A, 2019, 7, 18580–18588 RSC.
- U.-H. Kim, G.-T. Park, P. Conlin, N. Ashburn, K. Cho, Y.-S. Yu, D. A. Shapiro, F. Maglia, S.-J. Kim, P. Lamp, C. S. Yoon and Y.-K. Sun, Energy Environ. Sci., 2021, 14, 1573–1583 RSC.
- I. Källquist, A. J. Naylor, C. Baur, J. Chable, J. Kullgren, M. Fichtner, K. Edström, D. Brandell and M. Hahlin, Chem. Mater., 2019, 31(16), 6084–6096 CrossRef.
- Y. Kobayashi, M. Sawamura, S. Kondo, M. Harada, Y. Noda, M. Nakayama, S. Kobayakawa, W. Zhao, A. Nakao, A. Yasui, H. B. Rajendra, K. Yamanaka, T. Ohta and N. Yabuuchi, Mater. Today, 2020, 37, 43–55 CrossRef CAS.
- R. A. House, G. J. Rees, M. A. Pérez-Osorio, J.-J. Marie, E. Boivin, A. W. Robertson, A. Nag, M. Garcia-Fernandez, K.-J. Zhou and P. G. Bruce, Nat. Energy, 2020, 5, 777–785 CrossRef CAS.
- M. Sawamura, S. Kobayakawa, J. Kikkawa, N. Sharma, D. Goonetilleke, A. Rawal, N. Shimada, K. Yamamoto, R. Yamamoto, Y. Zhou, Y. Uchimoto, K. Nakanishi, K. Mitsuhara, K. Ohara, J. Park, H. R. Byon, H. Koga, M. Okoshi, T. Ohta and N. Yabuuchi, ACS Cent. Sci., 2020, 6, 2326–2338 CrossRef CAS PubMed.
Footnote |
| † Electronic supplementary information (ESI) available. See DOI: 10.1039/d1ta03066cf |
| This journal is © The Royal Society of Chemistry 2021 |