 Open Access Article
Creative Commons Attribution 3.0 Unported Licence
Stoichiometrically driven disorder and local diffusion in NMC cathodes†
Thomas E.
Ashton
 *a,
Peter J.
Baker
 b,
Carlos
Sotelo-Vazquez
 a,
Charles J. M.
Footer
a,
Kenji. M.
Kojima
cd,
Takeshi
Matsukawa
a,
Charles J. M.
Footer
a,
Kenji. M.
Kojima
cd,
Takeshi
Matsukawa
 e,
Takashi
Kamiyama
f and
Jawwad A.
Darr
a
aUniversity College London, Department of Chemistry, Bloomsbury, London, UK. E-mail: t.ashton@ucl.ac.uk
bRutherford Appleton Laboratory, ISIS, Didcot, Oxfordshire, UK
cTRIUMF, Centre for Molecular and Materials Science, Vancouver, BC, Canada
dUniversity of British Columbia, Stewart Blusson Quantum Matter Institute, Vancouver, BC, Canada
eIbaraki University, Frontier Research Center for Applied Atomic Sciences, Mito, Ibaraki, Japan
fHigh Energy Accelerator Research Organisation (KEK), Tsukuba, Ibaraki, Japan
First published on 12th April 2021
Abstract
Major structural differences in lithium nickel manganese cobalt oxides (NMC) prepared under identical conditions have been uncovered using neutron powder diffraction. Sample NMC-622 was obtained as a single R![[3 with combining macron]](https://www.rsc.org/images/entities/char_0033_0304.gif) m crystal structure with little defects, whereas NMC-811 showed significant Li deficiency and NMC-433 formed three distinct phases; ordered R
m crystal structure with little defects, whereas NMC-811 showed significant Li deficiency and NMC-433 formed three distinct phases; ordered R![[3 with combining macron]](https://www.rsc.org/images/entities/char_0033_0304.gif) m, disordered R
m, disordered R![[3 with combining macron]](https://www.rsc.org/images/entities/char_0033_0304.gif) m and a C2/m phase. Local diffusion behaviour was also studied by muon spin relaxation (μSR). It was observed that single phase R
m and a C2/m phase. Local diffusion behaviour was also studied by muon spin relaxation (μSR). It was observed that single phase R![[3 with combining macron]](https://www.rsc.org/images/entities/char_0033_0304.gif) m NMC-622 showed a higher lithium diffusion coefficient (4.4 × 10⁻¹¹ cm2 s−1) compared to lithium deficient NMC-811 (2.9 × 10⁻¹¹ cm2 s−1), or the highly disordered NMC-433 (3.4 × 10⁻¹¹ cm2 s−1). Furthermore, activation energies for the Li diffusion process were estimated to be 58 meV, 61 meV and 28 meV for NMC-811, NMC-622 and NMC-433, respectively.
m NMC-622 showed a higher lithium diffusion coefficient (4.4 × 10⁻¹¹ cm2 s−1) compared to lithium deficient NMC-811 (2.9 × 10⁻¹¹ cm2 s−1), or the highly disordered NMC-433 (3.4 × 10⁻¹¹ cm2 s−1). Furthermore, activation energies for the Li diffusion process were estimated to be 58 meV, 61 meV and 28 meV for NMC-811, NMC-622 and NMC-433, respectively.
Introduction
In response to the ever growing environmental and societal demands for decarbonised electrification, much effort has been afforded to the development of lithium-ion batteries (LIBs). Despite LIBs offering a reliable and efficient method of storing energy for portable electronics, transport and grid-based energy, the underpinning materials chemistry employed in such devices continue to be of paramount importance. Lithiated nickel manganese cobalt oxide (NMC) cathodes currently remain one of the most promising cathode materials families for commercial LIBs.1,2 The attraction of NMC cathodes lies in their demonstrated stability over several thousand cycles and the promise of high energy densities.3 Furthermore, the electrochemical attributes of these cathodes can be tuned by altering the metal ratios of Ni, Mn, and Co. Recent attention has been focused on high-nickel NMC cathodes (>80% of the metals being Ni) due to their increased capacity (∼200 mA h g−1) versus lower Ni concentration NMCs.4 This increase in Ni also allows higher maximum voltages to be accessed (approaching 5 V versus Li/Li+) during electrochemical cycling, increasing energy density.5 However, increasing the Ni concentration may also lead to increased structural instability, both during synthesis and electrochemical cycling.6 Thus, significant challenges still remain.The electrochemically attractive crystal phase of NMC adopts a layered R![[3 with combining macron]](https://www.rsc.org/images/entities/char_0033_0304.gif) m structure, typical of LiCoO2. Alternating slabs of Li atoms on the 3a sites are sandwiched between layers of MO6 octahedra (M = Ni, Mn or Co), where M are located on the 3b sites (Fig. 1).7 Isolation of a defect-free R
m structure, typical of LiCoO2. Alternating slabs of Li atoms on the 3a sites are sandwiched between layers of MO6 octahedra (M = Ni, Mn or Co), where M are located on the 3b sites (Fig. 1).7 Isolation of a defect-free R![[3 with combining macron]](https://www.rsc.org/images/entities/char_0033_0304.gif) m phase has proven to be a sensitive process due to thermodynamic limitations on structural evolution during heating.8–10 Typically, syntheses are carried out in a two-step reaction. The first reaction consolidates the constituent transition metals (Ni, Mn and Co) into a single precursor, usually by coprecipitation at temperatures <350 °C.11,12 The second step requires a solid-state reaction between a lithium source (such as LiOH or Li2CO3) and the aforementioned precursors, typically in a furnace at >800 °C for 5 to 48 h.11 Due to these high temperatures and long times, a fine interplay between lithium incorporation into the metal oxide and evaporative lithium loss arises.13 Thus, an excess of the Li source is commonly used, but consequently risks the formation of additional ‘lithium-rich’ phases.14 In combination, these reports also suggest that lithium incorporation becomes increasingly more difficult with greater Ni concentration, requiring longer times or higher synthesis temperatures.
m phase has proven to be a sensitive process due to thermodynamic limitations on structural evolution during heating.8–10 Typically, syntheses are carried out in a two-step reaction. The first reaction consolidates the constituent transition metals (Ni, Mn and Co) into a single precursor, usually by coprecipitation at temperatures <350 °C.11,12 The second step requires a solid-state reaction between a lithium source (such as LiOH or Li2CO3) and the aforementioned precursors, typically in a furnace at >800 °C for 5 to 48 h.11 Due to these high temperatures and long times, a fine interplay between lithium incorporation into the metal oxide and evaporative lithium loss arises.13 Thus, an excess of the Li source is commonly used, but consequently risks the formation of additional ‘lithium-rich’ phases.14 In combination, these reports also suggest that lithium incorporation becomes increasingly more difficult with greater Ni concentration, requiring longer times or higher synthesis temperatures.
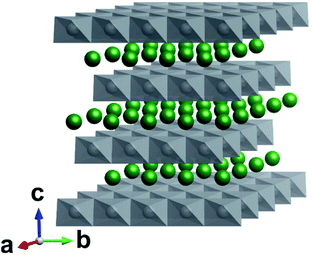 | ||
Fig. 1 Crystal structure of R![[3 with combining macron]](https://www.rsc.org/images/entities/char_0033_0304.gif) m LiMO2 (M = Ni, Mn, Co). Li atoms are shown in green and MO6 polyhedra in grey. In the perfect structure, Li diffusion occurs in the ab plane. m LiMO2 (M = Ni, Mn, Co). Li atoms are shown in green and MO6 polyhedra in grey. In the perfect structure, Li diffusion occurs in the ab plane. | ||
Suppression of lithium–nickel cation mixing (Li3a+/Ni3b2+) has also been highlighted as a major synthetic challenge.15 Reportedly, this exchange can lead to further structural instability and lower intrinsic Li mobility (at elevated concentrations). Li3a+/Ni3b2+ mixing is purportedly more probable in high-nickel NMC due to the larger availability of Ni, and thus a smaller amount of R![[3 with combining macron]](https://www.rsc.org/images/entities/char_0033_0304.gif) m templating Co3+, and R
m templating Co3+, and R![[3 with combining macron]](https://www.rsc.org/images/entities/char_0033_0304.gif) m stabilising Mn4+. Li3a+/Ni3b2+ mixing in NMC has commonly been assessed using the peak intensity ratios of the I(003) and I(104) by X-ray diffraction, however this analysis is limited and presumes the only contribution to these intensities is Li3a+/Ni3b2+. Other contributions may include bifurcation of element rich and poor phases, Li deficiency, or the presence of impurity phases whose peaks overlap such as Li rich C2/m. Suggestions have also been made that the exchange of Li+ and Ni2+ are not necessarily equivalent.16 Furthermore, the diminished X-ray attenuation of Li versus other elements (due to its lower relative mass) reduces the accuracy of such measurements.17 Therefore, advanced techniques such as Neutron Powder Diffraction (NPD) are key for gaining a more thorough understanding of structural chemistry.
m stabilising Mn4+. Li3a+/Ni3b2+ mixing in NMC has commonly been assessed using the peak intensity ratios of the I(003) and I(104) by X-ray diffraction, however this analysis is limited and presumes the only contribution to these intensities is Li3a+/Ni3b2+. Other contributions may include bifurcation of element rich and poor phases, Li deficiency, or the presence of impurity phases whose peaks overlap such as Li rich C2/m. Suggestions have also been made that the exchange of Li+ and Ni2+ are not necessarily equivalent.16 Furthermore, the diminished X-ray attenuation of Li versus other elements (due to its lower relative mass) reduces the accuracy of such measurements.17 Therefore, advanced techniques such as Neutron Powder Diffraction (NPD) are key for gaining a more thorough understanding of structural chemistry.
Typically, Li ions migrate through the 2D Li plane and are reversibly removed and inserted from the crystals' surface. As the diffusion of lithium ultimately dictates the operation of intercalation cathodes such as NMC, these systems have been widely studied by a range of methods including cyclic voltammetry (CV) electrochemical impedance spectroscopy (EIS), galvanostatic intermittent titration technique (GITT) and solid-state lithium nuclear magnetic resonance (Li-NMR).18–21 Among these, muon spin relaxation (μSR) remains a unique and powerful tool to probe the diffusive properties of lithium ions (among others) on a local scale.22 In contrast to bulk electrochemical methods, μSR is not limited by grain boundaries or electrode preparation. Thus, μSR can establish diffusion coefficients (D) and activation energies (Ea) specific to the crystal structures present, irrespective of the particle- or meso-structure. μSR has previously been employed on isostructural materials such as the parent LiCoO2 and sister LinNixCoyAlzO2 materials, and have been in good agreement with computational predictions of DLi and Ea values.23–26
Although many studies have been performed to characterise electrochemical performance, there is still a lack of understanding of the effect of increasing nickel concentration on the structure and its relationship with local lithium diffusion in NMC cathodes. Herein, we present the need for improved structural scrutiny and an evaluation of increasing Ni content on local structure by NPD and local diffusion by μSR.
Results and discussion
Structural and elemental characterisation
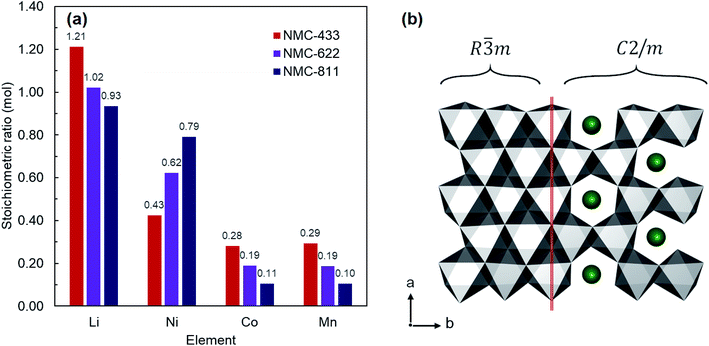
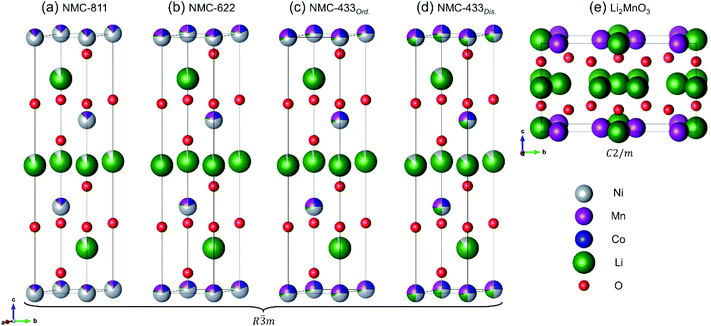
NMC-433, NMC-622 and NMC-811 were all collected as fine black powders after solid state lithiation and analysed by inductively coupled plasma mass spectrometry (ICP-MS) to elucidate the bulk elemental composition (Fig. 2a). It was found that the observed metals compositions were consistent with the nominal ratios; Li1.21Ni0.43Mn0.28Co0.29O2 (NMC-433), Li1.02Ni0.62Co0.19Mn0.19O2 (NMC-622) and LiNi0.93Mn0.11Co0.10O2 (NMC-811). Interestingly, the concentration of Li in each sample increased with decreasing Ni content, and a super-stoichiometric quantity of lithium was identified in NMC-433. Ordering of Li into a hexagonal arrangement to give concentrations exceeding unity has previously been reported as a ‘lithium-rich’ phase, adopting a monoclinic C2/m unit cell similar to Li2MnO3.27–29 It is therefore suggested that it is the inclusion of increasing amounts of Mn, rather than decreasing Ni, would promote the higher concentration of Li observed in the samples as this phase is often observed in Mn rich NMC.30,31 A representation of the MO6 slab for both R![[3 with combining macron]](https://www.rsc.org/images/entities/char_0033_0304.gif) m and C2/m is shown in Fig. 2b where MO6 polyhedra are shown in grey and Li+ in green. It can be seen that the only significant difference between the two structures is the replacement of 20% of the M sites are occupied by Li+ to produce a ‘honeycomb’ structure.
m and C2/m is shown in Fig. 2b where MO6 polyhedra are shown in grey and Li+ in green. It can be seen that the only significant difference between the two structures is the replacement of 20% of the M sites are occupied by Li+ to produce a ‘honeycomb’ structure.
Scanning electron microscopy (SEM) was used to further investigate particle size and morphology of the NMC samples. SEM of NMC-433, NMC-622 and NMC-811 (Fig. 3a–c, respectively) showed similar granular morphologies with typical diameters ≈2 μm. It is interesting to note that NMC-433 was significantly smaller than the other two materials. This may be due to the increased levels of Mn and/or Co providing resistance to particle sintering (as the same solid state lithiation conditions were used).
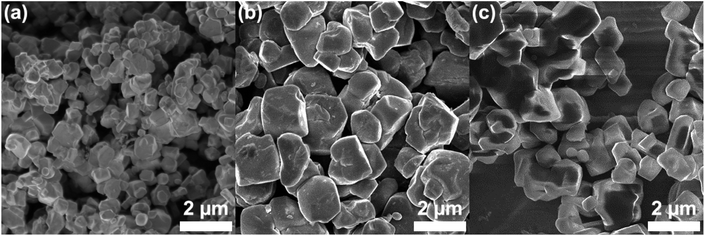 | ||
| Fig. 3 Scanning electron micrographs of the three NMC samples prepared by a continuous hydrothermal approach followed by solid state lithiation (a) NMC-433, (b) NMC-622 and (c) NMC-811. | ||
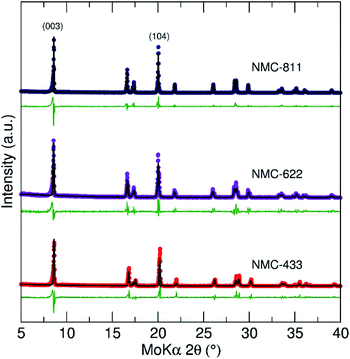
To corroborate the presence of a C2/m phase, powder X-ray diffraction (PXRD) and subsequent Rietveld refinement was employed to evaluate the structure of the NMC samples (Fig. 4). All samples showed well defined, sharp peaks indicating a high degree of crystallinity and a rhombohedral R![[3 with combining macron]](https://www.rsc.org/images/entities/char_0033_0304.gif) m space group typical of LiCoO2 layered compounds (no contribution from a C2/m phase was identified). However, previous reports have suggested that an increase in cobalt content (relative to the other metals present) can decrease the size of the C2/m domains, causing them to be essentially amorphous to PXRD.32
m space group typical of LiCoO2 layered compounds (no contribution from a C2/m phase was identified). However, previous reports have suggested that an increase in cobalt content (relative to the other metals present) can decrease the size of the C2/m domains, causing them to be essentially amorphous to PXRD.32
The peak intensity ratio of the I(003)/I(104) reflections has previously been used to evaluate Li3a+/Ni3b2+ mixing within layered R![[3 with combining macron]](https://www.rsc.org/images/entities/char_0033_0304.gif) m metal oxides, where a value <1.2 suggests Ni2+ is purportedly present at the Li+ 3b crystallographic site and vice versa.33,34 For the three materials, the values of I(003)/I(104) suggested little or no cation mixing had occurred (NMC-433 = 1.2, NMC-622 = 1.3 and NMC-811 = 1.2). To establish the contribution from cation mixing of Li+ and Ni2+ on the 3a and 3b sites, a (Li1−δNiδ)3b(LiγNix−γMnyCoz)3aO2 model was first applied during refinement. However, the model could not converge with real values of δ and γ, agreeing with the values of I(003)/I(104) that no detectable cation mixing had occurred. While this is promising, Li occupancies are unlikely to be truly reliable due to the limited ability of low Z elements (such as Li) to diffract X-rays.
m metal oxides, where a value <1.2 suggests Ni2+ is purportedly present at the Li+ 3b crystallographic site and vice versa.33,34 For the three materials, the values of I(003)/I(104) suggested little or no cation mixing had occurred (NMC-433 = 1.2, NMC-622 = 1.3 and NMC-811 = 1.2). To establish the contribution from cation mixing of Li+ and Ni2+ on the 3a and 3b sites, a (Li1−δNiδ)3b(LiγNix−γMnyCoz)3aO2 model was first applied during refinement. However, the model could not converge with real values of δ and γ, agreeing with the values of I(003)/I(104) that no detectable cation mixing had occurred. While this is promising, Li occupancies are unlikely to be truly reliable due to the limited ability of low Z elements (such as Li) to diffract X-rays.
Neutron powder diffraction (NPD)
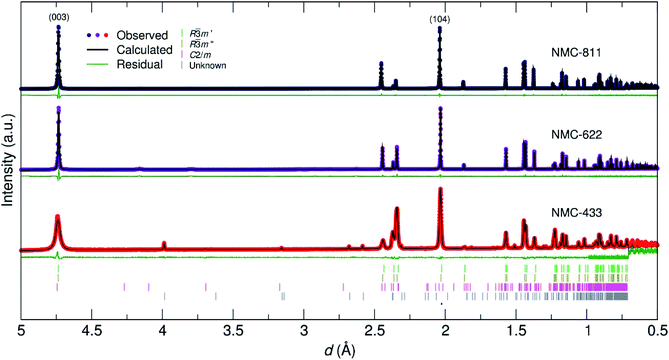
To elucidate the crystal structure of the NMC materials further, neutron powder diffraction (NPD) was employed. Fig. 5 shows the data collected for the three samples with respect to their d-spacing, and Rietveld refinement thereof. A full account of the fitting parameters can be found in the ESI.† While NMC-811 and NMC-622 were adequately fit with a single R![[3 with combining macron]](https://www.rsc.org/images/entities/char_0033_0304.gif) m phase (similar to the PXRD refinements), a small inclusion of Li2O (0.5 mol%) and LiOH (4.9 mol%) was identified in NMC-622 and an unknown impurity (0.3 mol%) in NMC-433 denoted by an asterisk. These observations led to a more correct stoichiometry being defined for NMC-622 (Li0.96Ni0.62Co0.19Mn0.19O2). Similar to the PXRD refinements, a (Li1−δNiδ)3b(LiγNix−γMnyCoz)3aO2 model was employed with the determined values given in Table 1.
m phase (similar to the PXRD refinements), a small inclusion of Li2O (0.5 mol%) and LiOH (4.9 mol%) was identified in NMC-622 and an unknown impurity (0.3 mol%) in NMC-433 denoted by an asterisk. These observations led to a more correct stoichiometry being defined for NMC-622 (Li0.96Ni0.62Co0.19Mn0.19O2). Similar to the PXRD refinements, a (Li1−δNiδ)3b(LiγNix−γMnyCoz)3aO2 model was employed with the determined values given in Table 1.
![[3 with combining macron]](https://www.rsc.org/images/entities/char_0033_0304.gif) m structure
m structure
| Atom | Site | NMC-811 | NMC-622 | NMC-433 (ordered) | NMC-433 (disordered) |
|---|---|---|---|---|---|
| Li1 | 3b | 0.8982(2) | 0.9643(2) | 0.9579(9) | 0.876(2) |
| Ni2 | 3b | 0.0317(2) | 0.0356(2) | 0.0420(9) | 0.123(2) |
| Co1 | 3a | 0.11 | 0.19 | 0.25339 | 0.25339 |
| Ni1 | 3a | 0.7659(1) | 0.5877(1) | 0.433(1) | 0.255(3) |
| Li2 | 3a | 0.0240(1) | 0.0322(1) | 0.050(1) | 0.229(2) |
| Mn1 | 3a | 0.1 | 0.19 | 0.26244 | 0.26244 |
| O1 | 6c | 1 | 1 | 1 | 1 |
| Livac. | 3b | 0.0701 | — | — | — |
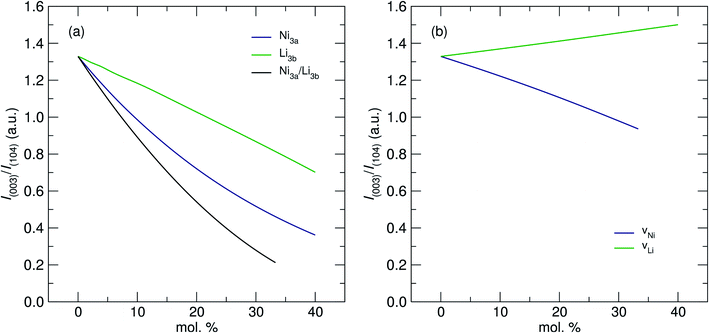
The values in Table 1 show that increasing [Ni] from 0.6 to 0.8 did not lead to a significant change in the absolute presence of Ni2+3b (NMC-811 = 3.1%, NMC-622 = 3.6%). However, these values do become significant when comparing them to the relative total Ni content of the material; 3.97% of the Ni in NMC-811 is located on the 3a site in contrast to 9.42% of the Ni in NMC-622. Uniquely, although NMC-811 exhibits a low concentration of Ni3b2+ mixing, it is not accompanied by an equivalent exchange of Li3a+ due to a significant concentration (≈7%) of vacancies on the 3b site. This is an important observation that is only made possible through the use of NPD, as Li vacancies have a relatively small impact on the I(003)/I(104) peak intensity ratio due to their low Z. A representation of this effect can be seen in Fig. 6, where values of I(003)/I(104) from simulated PXRD patterns are given versus the concentration of mixing (Fig. 6a) and vacancy defects (Fig. 6b). In both cases, the location of Li makes the smallest contribution to the magnitude of I(003)/I(104) with the smallest contribution attributed to Li vacancies. Thus, Li vacancies may be more easily concealed in PXRD than any other defect and supporting techniques, such as NPD or elemental analysis, are crucial.
In comparison, the structural refinement of NMC-433 was unable to converge with a single R![[3 with combining macron]](https://www.rsc.org/images/entities/char_0033_0304.gif) m phase. NMC-433 was best fit by a combination of three phases: (i) a conventional, ordered R
m phase. NMC-433 was best fit by a combination of three phases: (i) a conventional, ordered R![[3 with combining macron]](https://www.rsc.org/images/entities/char_0033_0304.gif) m NMC (58.8 mol%); (ii) a disordered R
m NMC (58.8 mol%); (ii) a disordered R![[3 with combining macron]](https://www.rsc.org/images/entities/char_0033_0304.gif) m NMC phase (33.4 mol%) and; (iii) a C2/m Li2MnO3 phase (7.8 mol%). As shown in Fig. 2, the C2/m phase can be thought of as a highly disordered R
m NMC phase (33.4 mol%) and; (iii) a C2/m Li2MnO3 phase (7.8 mol%). As shown in Fig. 2, the C2/m phase can be thought of as a highly disordered R![[3 with combining macron]](https://www.rsc.org/images/entities/char_0033_0304.gif) m with 20 mol% of Li on the metal 3b site. Thus, the C2/m phase is “lithium rich” compared to the R
m with 20 mol% of Li on the metal 3b site. Thus, the C2/m phase is “lithium rich” compared to the R![[3 with combining macron]](https://www.rsc.org/images/entities/char_0033_0304.gif) m phase, which agrees well with the overabundance of Li in NMC-433 observed from ICP-MS analysis. Interestingly, the C2/m containing NMC-433 exhibited broader peaks, suggesting a lower degree of crystallinity compared to the other two samples. This observation potentially supports the lack of PXRD evidence for a C2/m phase by agreeing with prevailing suggestions that small domains of C2/m disrupt the R
m phase, which agrees well with the overabundance of Li in NMC-433 observed from ICP-MS analysis. Interestingly, the C2/m containing NMC-433 exhibited broader peaks, suggesting a lower degree of crystallinity compared to the other two samples. This observation potentially supports the lack of PXRD evidence for a C2/m phase by agreeing with prevailing suggestions that small domains of C2/m disrupt the R![[3 with combining macron]](https://www.rsc.org/images/entities/char_0033_0304.gif) m crystals when Co is present in elevated concentrations in NMC materials.
m crystals when Co is present in elevated concentrations in NMC materials.
A representation of the crystal structures for each of the major phases in NMC-811, NMC-622 and NMC-433 can be seen in Fig. 7 (derived from the respective NPD crystallographic refinements). From this figure three primary observations can be made: (i) although Li3a+/Ni3b2+ mixing is present in low concentrations at the highest [Ni] content (NMC-811), Li+ vacancies are significantly prevalent; (ii) reducing [Ni] to 0.6 (as in NMC-622) eradicates the Li+ vacancies while a low concentration of Li3a+/Ni3b2+ mixing is maintained; (iii) further reducing [Ni] to 0.4 (NMC-433) leads to an overabundance of Li, and the formation of multiple crystalline phases.
Regarding the final point; it is likely that the formation of multiple phases is due to the elevated presence of Mn, rather than the lack of Ni. Although Li3a+/Ni3b2+ cation mixing is possible due to the magnetic structure of Ni (leading to a disordered R![[3 with combining macron]](https://www.rsc.org/images/entities/char_0033_0304.gif) m), this is found to be more prominent at increasing [Ni].35 Previous reports on similar oxides containing only Mn and Co have also shown phase separation of C2/m and R
m), this is found to be more prominent at increasing [Ni].35 Previous reports on similar oxides containing only Mn and Co have also shown phase separation of C2/m and R![[3 with combining macron]](https://www.rsc.org/images/entities/char_0033_0304.gif) m in the absence of Ni.36 The increase in [Co] can also be ruled out for instigating phase separation or cation mixing as Co3+ is known to nucleate and stabilise the R
m in the absence of Ni.36 The increase in [Co] can also be ruled out for instigating phase separation or cation mixing as Co3+ is known to nucleate and stabilise the R![[3 with combining macron]](https://www.rsc.org/images/entities/char_0033_0304.gif) m phase, and alleviate the magnetic frustration responsible for Ni2+ formation.37,38 Increased cation mixing has also been directly observed from combinatorial experiments when Ni is replaced for Mn.39 Thus, it is likely that increasing Mn may both aggravate cation mixing, and encourage the formation of the C2/m phase, if sufficient Li is available during heat treatment.
m phase, and alleviate the magnetic frustration responsible for Ni2+ formation.37,38 Increased cation mixing has also been directly observed from combinatorial experiments when Ni is replaced for Mn.39 Thus, it is likely that increasing Mn may both aggravate cation mixing, and encourage the formation of the C2/m phase, if sufficient Li is available during heat treatment.
Local lithium diffusion (μSR)
Since the structures of the NMC materials differed significantly, it is important to establish the effect of these changes on lithium diffusion. Previously, R![[3 with combining macron]](https://www.rsc.org/images/entities/char_0033_0304.gif) m structures have been predicted to exhibit two intraplanar diffusion pathways through the LiO6 slab; the Oxygen Dumbbell Hop (ODH) and the Tetrahedral Site Hop (TSH).40 Previous investigations on isostructural materials have found the TSH mechanism to occur on a similar timescale (≈10−10 cm2 s−1), but provides a lower activation energy (Ea) diffusion pathway (ETSHa ≈ EODHa/4).26 However, the TSH mechanism is only available where [Li] < 1 (due to the requirement for a Li divacancy). In comparison, the C2/m structure has previously been reported to exhibit additional interplanar diffusion pathways between the Li and MO6 slabs, which may be expected to provide enhanced Li ion conductivity. However, density functional theory (DFT) studies suggest that the average Ea of Li diffusion lies between 510 and 840 meV in C2/m LiMn2O3, similar to values estimated by DFT for the ODH mechanism (∼800 meV).41
m structures have been predicted to exhibit two intraplanar diffusion pathways through the LiO6 slab; the Oxygen Dumbbell Hop (ODH) and the Tetrahedral Site Hop (TSH).40 Previous investigations on isostructural materials have found the TSH mechanism to occur on a similar timescale (≈10−10 cm2 s−1), but provides a lower activation energy (Ea) diffusion pathway (ETSHa ≈ EODHa/4).26 However, the TSH mechanism is only available where [Li] < 1 (due to the requirement for a Li divacancy). In comparison, the C2/m structure has previously been reported to exhibit additional interplanar diffusion pathways between the Li and MO6 slabs, which may be expected to provide enhanced Li ion conductivity. However, density functional theory (DFT) studies suggest that the average Ea of Li diffusion lies between 510 and 840 meV in C2/m LiMn2O3, similar to values estimated by DFT for the ODH mechanism (∼800 meV).41
To understand the impact of nickel concentration and crystal structure on the local lithium diffusion mechanics, muon spin relaxation (μSR) experiments were performed on all three samples of NMC. Briefly, the powders were loaded into a titanium sample holder and exposed to a spin-polarized beam of muons in a vacuum using the EMU instrument at the STFC ISIS Neutron and Muon Facility, Harwell, UK. Muon decay asymmetry data were recorded at 300 K using a transverse magnetic field of 20 G to normalise the initial decay asymmetry arising from the sample geometry. Data were then recorded between 160 K and 450 K, applying three longitudinal fields of 0, 5 and 10 G at each temperature to decouple the muon spin relaxation from any nuclear magnetic contributions from Ni, Mn or Co (Fig. 8a). The data from the three fields at each temperature were fit simultaneously to a modified Kubo–Toyabe relaxation model to describe the dynamic diffusion processes multiplied by a Gaussian relaxation function to account for temperature independent fluctuations in Li+ diffusion, with a constant background component (eqn (1)).
A0PLF(t) = AF![[thin space (1/6-em)]](https://www.rsc.org/images/entities/char_2009.gif) exp(−λFt) + AKT exp(−λFt) + AKT![[thin space (1/6-em)]](https://www.rsc.org/images/entities/char_2009.gif) exp(−λKTt) × GDGKT(Δ,ν,t,HLF) + ABG exp(−λKTt) × GDGKT(Δ,ν,t,HLF) + ABG | (1) |
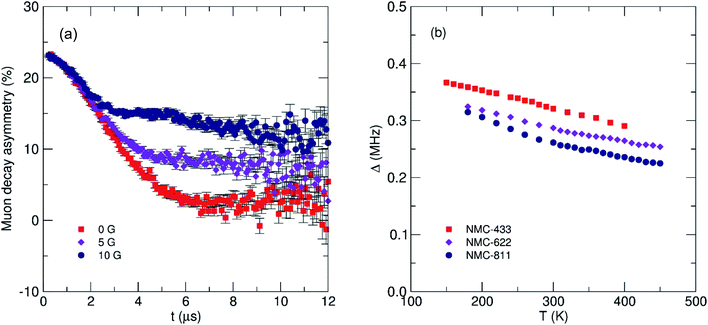 | ||
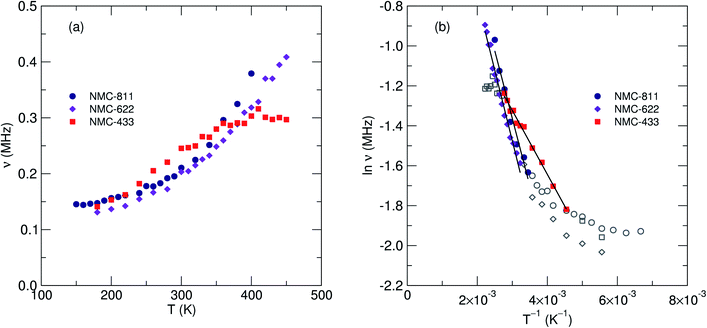
| Fig. 8 (a) Fluctuation rate of muon decay (ν) and (b) field distribution width (Δ) observed from μSR for three NMC compositions with increasing nickel content. The error for each Δ value is <0.5%. | ||
Two key parameters were extracted from the fits; (i) the field distribution width (Δ) which is a measure of the magnetic field distribution that the muon experiences at the implantation site and, (ii) the fluctuation rate (ν) which is a measure of the rate of muon decay perturbation from Li+ diffusion, where ν ∝ DLi. Fig. 8b shows the extracted values for Δ for the three NMC samples. It is observed that as temperature increases there is a corresponding decrease in the field distribution width due to Li+ diffusion becoming more rapid and leading to a motional narrowing effect similar to that seen in previous investigations.26,42 As [Ni] increases (and thus, [Mn] and [Co] decreases) there is a consistent decrease in Δ due to the significantly smaller nuclear moment present in Ni, when compared to Mn or Co.
Fig. 9a shows the extracted values of ν versus temperature where a steady increase was observed, indicating the thermal activation of Li diffusion. The data was used to estimate the average DLi of each sample employing eqn (2); Ni is the number of accessible Li+ sites in the ith path, Zν,i is the vacancy fraction of the destination sites, si is the hopping distance between Li+ sites and ν is the fluctuation rate at each temperature.43 Structural values were extracted from the NPD refinements, and the calculation for NMC-433 included a weighted average of the three observed phases.
 | (2) |
Values of DLi at 300 K for the two samples exhibiting only the R![[3 with combining macron]](https://www.rsc.org/images/entities/char_0033_0304.gif) m structure were determined to be 2.90 × 10⁻¹¹ cm2 s−1 for NMC-811 and 4.36 × 10⁻¹¹ cm2 s−1 for NMC-622. Statistical significance was confirmed by calculated errors of ±1.75 × 10⁻²⁸ (NMC-811), ±2.65 × 10⁻²⁸ (NMC-622) and ±1.92 × 10⁻²⁰ (NMC-433). Using the Arrhenius relationship over the thermally activated region of each sample (Fig. 9b), Ea of muon hopping were found to be 58 meV for NMC-811, 61 meV for NMC-622 and 28 meV for NMC-433. Compared to NMC-622, it is possible that the marginally slower but more facile diffusion of NMC-811 (indicated by both lower DLi and Ea) may be attributed to the Li vacancies. Lower [Li3b] causes less electrostatic repulsion between Li aiding diffusion (lowering Ea), but provides less diffusion events for the muon decay to sample (lowering ν). The lowering of Ea with decreasing [Li3b] has been previously predicted in the parent LiCoO2 by computational means, and observed in isostructural materials by μSR (Table 2). However, this does not preclude the possibility of the observed differences being solely or partly due to changes in transition metal stoichiometry, and the values of Ea for NMC-811 and NMC-622 lie within experimental error.
m structure were determined to be 2.90 × 10⁻¹¹ cm2 s−1 for NMC-811 and 4.36 × 10⁻¹¹ cm2 s−1 for NMC-622. Statistical significance was confirmed by calculated errors of ±1.75 × 10⁻²⁸ (NMC-811), ±2.65 × 10⁻²⁸ (NMC-622) and ±1.92 × 10⁻²⁰ (NMC-433). Using the Arrhenius relationship over the thermally activated region of each sample (Fig. 9b), Ea of muon hopping were found to be 58 meV for NMC-811, 61 meV for NMC-622 and 28 meV for NMC-433. Compared to NMC-622, it is possible that the marginally slower but more facile diffusion of NMC-811 (indicated by both lower DLi and Ea) may be attributed to the Li vacancies. Lower [Li3b] causes less electrostatic repulsion between Li aiding diffusion (lowering Ea), but provides less diffusion events for the muon decay to sample (lowering ν). The lowering of Ea with decreasing [Li3b] has been previously predicted in the parent LiCoO2 by computational means, and observed in isostructural materials by μSR (Table 2). However, this does not preclude the possibility of the observed differences being solely or partly due to changes in transition metal stoichiometry, and the values of Ea for NMC-811 and NMC-622 lie within experimental error.
| Sample | D Li (cm2 s−1) | E a (meV) |
|---|---|---|
| NMC-811 | 2.9 × 10⁻¹¹ | 58.3 ± 4.5 |
| NMC-622 | 4.4 × 10⁻¹¹ | 60.9 ± 2.2 |
| NMC-433 | 3.4 × 10⁻¹¹ | 27.6 ± 0.8 |
| LiMn2O3 (ref. 51) | 4.7 × 10⁻¹¹ | 156 |
| Li0.73CoO2 (ref. 24) | 7.0 × 10⁻¹⁰ | — |
| Li0.53CoO2 (ref. 24) | 2.5 × 10⁻¹⁰ | — |
| LiNi⅓Mn⅓Co⅓O2 (ref. 52) | 3.5 × 10⁻¹² | ≈100 |
| Li0.87Ni0.77Co0.14Al0.09O2 (ref. 26) | 3.0 × 10⁻¹¹ | 90 ± 13 |
| Li0.71Ni0.77Co0.14Al0.09O2 (ref. 26) | 1.0 × 10⁻¹¹ | 65 ± 6 |
In comparison, while the estimated DLi for NMC-433 was found to be 3.35 × 10⁻¹¹ cm2 s−1 the estimated value of Ea was 28 meV, significantly lower than that for NMC-811 or NMC-622. Although the structure of NMC-433 is too complex to be certain of the origin of the decrease in Ea, it is unlikely to be due to the presence of Li2MnO3 as it was present <10 mol% of the total sample and has previously shown a larger Eaversus R![[3 with combining macron]](https://www.rsc.org/images/entities/char_0033_0304.gif) m structured materials (Table 2). Thus, it is likely that this marked decrease in Ea is either due to (i) the elevated concentration of Mn and/or Co or (ii) a contribution from the heavily disordered R
m structured materials (Table 2). Thus, it is likely that this marked decrease in Ea is either due to (i) the elevated concentration of Mn and/or Co or (ii) a contribution from the heavily disordered R![[3 with combining macron]](https://www.rsc.org/images/entities/char_0033_0304.gif) m phase.
m phase.
Conclusions
Intimate studies of the three NMC samples (made using identical heat treatments) have provided direct evidence for stoichiometry driven phase formation. Neutron powder diffraction studies on ‘Ni rich’ NMC-811 has shown that while a single R![[3 with combining macron]](https://www.rsc.org/images/entities/char_0033_0304.gif) m phase can be obtained; Li incorporation is more challenging (under similar synthetic conditions) compared to the lower Ni content NMC-622. However, lowering the Ni content further in NMC-433 leads to a dramatic structural disruption and the evolution of three phases; an ordered R
m phase can be obtained; Li incorporation is more challenging (under similar synthetic conditions) compared to the lower Ni content NMC-622. However, lowering the Ni content further in NMC-433 leads to a dramatic structural disruption and the evolution of three phases; an ordered R![[3 with combining macron]](https://www.rsc.org/images/entities/char_0033_0304.gif) m phase, a disordered R
m phase, a disordered R![[3 with combining macron]](https://www.rsc.org/images/entities/char_0033_0304.gif) m phase with a high degree of Li3a+/Ni3b2+ mixing, and a Li rich C2/m phase. In this case, the authors suggest that this is more likely due to the presence of elevated [Mn], rather than diminished [Ni] and the available excess of Li during solid-state lithiation. Differences in the local diffusion mechanics were also identified, with well-ordered NMC-622 showing the highest diffusion coefficient of the three materials. Interestingly, mixed phase NMC-433 showed a significantly lower activation energy than NMC-811 or NMC-622 despite the large amount of structural disorder.
m phase with a high degree of Li3a+/Ni3b2+ mixing, and a Li rich C2/m phase. In this case, the authors suggest that this is more likely due to the presence of elevated [Mn], rather than diminished [Ni] and the available excess of Li during solid-state lithiation. Differences in the local diffusion mechanics were also identified, with well-ordered NMC-622 showing the highest diffusion coefficient of the three materials. Interestingly, mixed phase NMC-433 showed a significantly lower activation energy than NMC-811 or NMC-622 despite the large amount of structural disorder.
In closing, it is of paramount importance to interpret results given from PXRD responsibly. Although no significant cation mixing was detected with PXRD, this is not proof of its absence; a vastly different story was told by using NPD data that showed not only cation mixing, but multiple crystalline phases. It is also important that I(003)/I(104) is not accurate in solely determining the Li3a+/Ni3b2+ mixing in NMC materials, as vacancies and closely related crystal structures may also have a large impact on the results.
Experimental
Synthesis of lithium nickel manganese cobalt oxide (NMC)
To prepare the nanoparticulate NMC precursors a continuous hydrothermal flow synthesis (CHFS) process was used, which has been described elsewhere.26,44 To summarise the process, three diaphragm pumps (Primeroyal K, Milton Roy, Pont-Saint-Pierre, France) were used to supply feeds of deionized water (Psw), an aqueous solution of the metal salts (PM), and a 1 M KOH solution (Pbase) at flow rates of 80, 40 and 40 mL min−1, respectively. All chemicals were obtained from Sigma-Aldrich, Dorset, UK.The NMC compositions were prepared by mixing the appropriate amount of metal nitrate salts [Ni(NO3)2·6H2O, Mn(NO3)·xH2O and Co(NO3)3·6H2O], summarised in Table S1.† The DI water feed from pump Psw was heated in flow to 450 °C using a 7 kW custom-built in-line electrical heater. Precursor feeds from pumps PM and Pbase were separately mixed in a T-piece in flow (at room temperature) prior to mixing in flow with the combined superheated water feed in the patented (WO2011148121A1) confined jet mixer (CJM).45 In all cases, the total concentration of metals, PM was fixed at 0.5 M and the concentration of base, Pbase was fixed at 1 M. Upon mixing of the feeds in the CHFS process, nanoparticles were formed, which were then cooled to ∼40 °C using a 1.5 m counter-current pipe-in-pipe heat exchanger, before being passed through a back-pressure regulator (BPR) valve at the CHFS outlet. The aqueous nanoparticle slurry exiting the BPR was collected and cleaned by repeated centrifugation and washing with deionized water until the conductivity of the supernatant was consistently below 50 μS, as measured by a conductivity probe (Hanna Instruments, model HI98311, Leighton Buzzard, UK). The concentrated slurry was then freeze-dried (Virtis Genesis 35XL) by gradually heating a sample from −60 to 25 °C (over 24 h) in vacuo (<100 mTorr), which yielded free-flowing dark brown/black powders in all cases.
The NMC precursor powders were then mixed with a 30% molar excess of LiOH in a Thinky™ mixer for 30 min at 1500 rpm and heat treated in a box furnace at 800 °C for 5 hours in air (ramp rate 5 °C min−1). The resulting black powders were characterised and tested with no further modification.
Structural characterisation (PXRD and NPD)
Powder X-ray diffraction (XRD) patterns were collected using a STOE Stadi P diffractometer in transmission geometry (Mo-Kα1 radiation, λ = 0.70932 Å), equipped with a germanium (111) monochromator and a DECTRIS Mythen 1k silicon strip detector (DECTRIS, Baden, Switzerland). An Yttria (Y2O3) standard was used to estimate instrumental peak broadening. Datasets were collected over the 2θ range of 2 to 40° with a step size of 0.5° and a count time of 5 s per step.Time-of-flight (TOF) neutron powder diffraction (NPD) was carried out on the iMATERIA diffractometer at J-PARC.46 The each as-synthesized powder sample (∼2.5 g) was placed into vanadium cell, which was installed to iMATERIA. In this study, a wide d-spacing (0.11 < d < 5.29 Å) and a high resolution (Δd/d = 0.16%) were used for the TOF NPD measurements. The sample environment of iMATERIA was evacuated to prevent incoherent scattering of water vapor (H atoms). All experiments were measured for 4 h at room temperature. The beam power of the J-PARC for NPD measurements was 500 kW. The data was analysed by Rietveld refinement using the Z-Rietveld software package (ver. 1.0.2).47,48 In the case of both NMC-811 and NMC-622, the Rietveld refinements were demonstrated between d = 0.35 and 4.95 Å, whereas that of NMC-433 was done the region between d = 0.70 and 5.08 Å.
Scanning electron microscopy (SEM)
Scanning electron microscopy (SEM) was performed using a JEOL JSM-6700F microscope. To minimise charging samples were deposited on copper foil tape, mounted on aluminium stubs, after dispersion in methanol (99.9%, Sigma Aldrich, Dorset, UK) and ultrasonication in a XUBA3 Ultrasonic Bath (Grant Instruments, Cambridge, UK) for 5 minutes. Image analysis was carried out using ImageJ software.Elemental analysis (ICP-MS)
Inductively coupled plasma mass spectrometry (ICP-MS) was carried out by fully dissolving each sample in concentrated hydrochloric acid overnight by microwave digestion (CEM Discover SP). These solutions were then diluted with dilute hydrochloric acid prior to analysis by ICP-MS (Agilent 7500ce). Calibration curves were constructed with elemental standards and used to calculate the concentrations of Ni, Mn, Co and Li for each sample.Local diffusion analyses (μSR)
Muon spin relaxation experiments were performed at STFC ISIS Neutron and Muon Source, Harwell, UK. Approximately 3.0 g of powdered samples of NMC-811, NMC-622 or NMC-433 were packed into recessed titanium sample holders, covered with a titanium window and secured with a titanium bezel. The titanium holder provided a simple background signal from muons that are not implanted into the sample and any signal is easily subtracted from the data. The sample holder was placed into the muon spectrometer (EMU) and evacuated to <1 × 10⁻⁶ mbar. The instrument was cooled to a temperature of 150 K and instrument asymmetry was measured using a transverse magnetic field of 20 G. Measurements were taken every 10 K up to 450 K, with longitudinal at fields of 0, 5 and 10 G. Data collected at each temperature for the three applied magnetic fields were fit simultaneously using the WiMDA software.49Conflicts of interest
There are no conflicts to declare.Acknowledgements
Muon experiments at the ISIS Neutron and Muon Source were supported by a beamtime allocation RB1810750 from the Science and Technology Facilities Council.50 Neutron experiments at the J-PARC Materials & Life Science Division were supported by a beamtime allocation 2018B0196. JAD and TEA would like to thank the EPSRC grant EP/R023662/1, Joint University Industry Consortium for Energy (Materials) and Devices Hub (JUICED), for support.References
- Y. Xia, J. Zheng, C. Wang and M. Gu, Nano Energy, 2018, 49, 434–452 CrossRef CAS.
- M. D. Radin, S. Hy, M. Sina, C. Fang, H. Liu, J. Vinckeviciute, M. Zhang, M. S. Whittingham, Y. S. Meng and A. Van der Ven, Adv. Energy Mater., 2017, 7, 1–33 CrossRef.
- K. Jalkanen, J. Karppinen, L. Skogström, T. Laurila, M. Nisula and K. Vuorilehto, Appl. Energy, 2015, 154, 160–172 CrossRef CAS.
- C. Delmas, M. Ménétrier, L. Croguennec, I. Saadoune, A. Rougier, C. Pouillerie, G. Prado, M. Grüne and L. Fournès, Electrochim. Acta, 1999, 45, 243–253 CrossRef CAS.
- D. Andre, S.-J. Kim, P. Lamp, S. F. Lux, F. Maglia, O. Paschos and B. Stiaszny, J. Mater. Chem. A, 2015, 3, 6709–6732 RSC.
- S. Zhang, J. Ma, Z. Hu, G. Cui and L. Chen, Chem. Mater., 2019, 31, 6033–6065 CrossRef CAS.
- Y. Shao-Horn, L. Croguennec, C. Delmas, E. C. Nelson and M. A. O'Keefe, Nat. Mater., 2003, 2, 464–467 CrossRef PubMed.
- R. Weber, H. Li, W. Chen, C.-Y. Kim, K. Plucknett and J. R. Dahn, J. Electrochem. Soc., 2020, 167, 100501 CrossRef CAS.
- S.-M. Bak, E. Hu, Y. Zhou, X. Yu, S. D. Senanayake, S.-J. Cho, K.-B. Kim, K. Y. Chung, X.-Q. Yang and K.-W. Nam, ACS Appl. Mater. Interfaces, 2014, 6, 22594–22601 CrossRef CAS PubMed.
- H. Ronduda, M. Zybert, A. Szczęsna-Chrzan, T. Trzeciak, A. Ostrowski, D. Szymański, W. Wieczorek, W. Raróg-Pilecka and M. Marcinek, Nanomaterials, 2020, 10, 2018 CrossRef CAS PubMed.
- H. Dong and G. M. Koenig, CrystEngComm, 2020, 22, 1514–1530 RSC.
- D. Ren, Y. Shen, Y. Yang, L. Shen, B. D. A. Levin, Y. Yu, D. A. Muller and H. D. Abruña, ACS Appl. Mater. Interfaces, 2017, 9, 35811–35819 CrossRef CAS PubMed.
- Y. Duan, L. Yang, M.-J. Zhang, Z. Chen, J. Bai, K. Amine, F. Pan and F. Wang, J. Mater. Chem. A, 2019, 7, 513–519 RSC.
- V. Pimenta, M. Sathiya, D. Batuk, A. M. Abakumov, D. Giaume, S. Cassaignon, D. Larcher and J.-M. Tarascon, Chem. Mater., 2017, 29, 9923–9936 CrossRef CAS.
- J. Zheng, Y. Ye, T. Liu, Y. Xiao, C. Wang, F. Wang and F. Pan, Acc. Chem. Res., 2019, 52(8), 2201–2209 CrossRef CAS PubMed.
- R. Wang, G. Qian, T. Liu, M. Li, J. Liu, B. Zhang, W. Zhu, S. Li, W. Zhao, W. Yang, X. Ma, Z. Fu, Y. Liu, J. Yang, L. Jin, Y. Xiao and F. Pan, Nano Energy, 2019, 62, 709–717 CrossRef CAS.
- J. H. Hubbell and S. M. Seltzer, NIST: X-Ray Mass Attenuation Coefficients Search PubMed.
- K. Märker, C. Xu and C. P. Grey, J. Am. Chem. Soc., 2020, 142, 17447–17456 CrossRef PubMed.
- V. Charbonneau, A. Lasia and G. Brisard, J. Electroanal. Chem., 2020, 875, 113944 CrossRef CAS.
- C.-H. Chen, F. Brosa Planella, K. O'Regan, D. Gastol, W. D. Widanage and E. Kendrick, J. Electrochem. Soc., 2020, 167, 080534 CrossRef CAS.
- O. Capron, R. Gopalakrishnan, J. Jaguemont, P. Van Den Bossche, N. Omar and J. Van Mierlo, Materials, 2018, 11(2), 176 CrossRef PubMed.
- M. Månsson and J. Sugiyama, Phys. Scr., 2013, 88, 068509 CrossRef.
- K. Mukai, J. Sugiyama, Y. Ikedo, H. Nozaki, K. Shimomura, K. Nishiyama, K. Ariyoshi and T. Ohzuku, J. Power Sources, 2007, 174, 711–715 CrossRef CAS.
- J. Sugiyama, K. Mukai, Y. Ikedo, H. Nozaki, M. Månsson and I. Watanabe, Phys. Rev. Lett., 2009, 103, 147601 CrossRef PubMed.
- J. Sugiyama, Y. Ikedo, K. Mukai, H. Nozaki, M. Månsson, O. Ofer, M. Harada, K. Kamazawa, Y. Miyake, J. H. Brewer, E. J. Ansaldo, K. H. Chow, I. Watanabe and T. Ohzuku, Phys. Rev. B: Condens. Matter Mater. Phys., 2010, 82, 224412 CrossRef.
- T. E. Ashton, P. J. Baker, D. Bauer, A. R. Groves, C. Sotelo-Vazquez, T. Kamiyama, T. Matsukawa, K. M. Kojima and J. A. Darr, J. Mater. Chem. A, 2020, 8, 11545–11552 RSC.
- P. Rozier and J. M. Tarascon, J. Electrochem. Soc., 2015, 162, A2490–A2499 CrossRef CAS.
- S. Kim, M. Aykol, V. I. Hegde, Z. Lu, S. Kirklin, J. R. Croy, M. M. Thackeray and C. Wolverton, Energy Environ. Sci., 2017, 10, 2201–2211 RSC.
- M. M. Thackeray, S.-H. Kang, C. S. Johnson, J. T. Vaughey, R. Benedek and S. A. Hackney, J. Mater. Chem., 2007, 17, 3112 RSC.
- A. K. Shukla, Q. M. Ramasse, C. Ophus, H. Duncan, F. Hage and G. Chen, Nat. Commun., 2015, 6, 8711 CrossRef CAS PubMed.
- A. K. Shukla, Q. M. Ramasse, C. Ophus, D. M. Kepaptsoglou, F. S. Hage, C. Gammer, C. Bowling, P. A. H. Gallegos and S. Venkatachalam, Energy Environ. Sci., 2018, 11, 830–840 RSC.
- M. M. Thackeray, S.-H. Kang, C. S. Johnson, J. T. Vaughey and S. A. Hackney, Electrochem. Commun., 2006, 8, 1531–1538 CrossRef CAS.
- A. Rougier, P. Gravereau and C. Delmas, J. Electrochem. Soc., 1996, 143, 1168 CrossRef CAS.
- X. Zhang, W. J. Jiang, A. Mauger, L. Qi, F. Gendron and C. M. Julien, J. Power Sources, 2010, 195, 1292–1301 CrossRef CAS.
- J. Zheng, G. Teng, C. Xin, Z. Zhuo, J. Liu, Q. Li, Z. Hu, M. Xu, S. Yan, W. Yang and F. Pan, J. Phys. Chem. Lett., 2017, 8, 5537–5542 CrossRef CAS PubMed.
- E. McCalla, C. M. Lowartz, C. R. Brown and J. R. Dahn, Chem. Mater., 2013, 25, 912–918 CrossRef CAS.
- A. Ueda and T. Ohzuku, J. Electrochem. Soc., 1994, 141, 2010–2014 CrossRef CAS.
- B. Xiao, T. Rojo and X. Li, ChemSusChem, 2019, 12, 133–144 CrossRef CAS PubMed.
- L. Yin, Z. Li, G. S. Mattei, J. Zheng, W. Zhao, F. Omenya, C. Fang, W. Li, J. Li, Q. Xie, E. M. Erickson, J.-G. Zhang, M. S. Whittingham, Y. S. Meng, A. Manthiram and P. G. Khalifah, Chem. Mater., 2020, 32, 1002–1010 CrossRef CAS.
- A. Van der Ven, Electrochem. Solid-State Lett., 1999, 3, 301 CrossRef.
- R. Xiao, H. Li and L. Chen, Chem. Mater., 2012, 24, 4242–4251 CrossRef CAS.
- T. E. Ashton, J. V. Laveda, D. A. MacLaren, P. J. Baker, A. Porch, M. O. Jones and S. A. Corr, J. Mater. Chem. A, 2014, 2, 6238–6245 RSC.
- R. Borg and G. Dienes, An introduction to solid state diffusion, Elsevier, Burlington, MA, 1st edn, 2012 Search PubMed.
- J. A. Darr, J. Zhang, N. M. Makwana and X. Weng, Chem. Rev., 2017, 117, 11125–11238 CrossRef CAS PubMed.
- J. Darr, C. J. Tighe and R. Gruar, WO2011148121A1, p. 2011.
- T. Ishigaki, A. Hoshikawa, M. Yonemura, T. Morishima, T. Kamiyama, R. Oishi, K. Aizawa, T. Sakuma, Y. Tomota, M. Arai, M. Hayashi, K. Ebata, Y. Takano, K. Komatsuzaki, H. Asano, Y. Takano and T. Kasao, Nucl. Instrum. Methods Phys. Res., Sect. A, 2009, 600, 189–191 CrossRef CAS.
- R. Oishi, M. Yonemura, Y. Nishimaki, S. Torii, A. Hoshikawa, T. Ishigaki, T. Morishima, K. Mori and T. Kamiyama, Nuclear Instruments and Methods in Physics Research Section A: Accelerators, Spectrometers, Detectors and Associated Equipment, 2009, 600, 94–96 CrossRef CAS.
- R. Oishi-Tomiyasu, M. Yonemura, T. Morishima, A. Hoshikawa, S. Torii, T. Ishigaki and T. Kamiyama, J. Appl. Crystallogr., 2012, 45, 299–308 CrossRef CAS.
- F. L. Pratt, Phys. B, 2000, 289–290, 710–714 CrossRef.
- T. E. Ashton, J. A. Darr and P. J. Baker, STFC ISIS Neutron Muon Source DOI:10.5286/ISIS.E.RB1810750.
- J. Sugiyama, H. Nozaki, K. Mukai, M. Harada, M. Månsson and A. Hillier, Solid State Ionics, 2014, 262, 901–903 CrossRef CAS.
- M. Månsson, H. Nozaki, J. M. Wikberg, K. Prša, Y. Sassa, M. Dahbi, K. Kamazawa, K. Sedlak, I. Watanabe and J. Sugiyama, J. Phys.: Conf. Ser., 2014, 551, 012037 CrossRef.
Footnote |
| † Electronic supplementary information (ESI) available. See DOI: 10.1039/d1ta01639c |
| This journal is © The Royal Society of Chemistry 2021 |

