 Open Access Article
Creative Commons Attribution 3.0 Unported Licence
Guest size limitation in metal–organic framework crystal–glass composites†
Christopher W.
Ashling
 a,
Lauren K.
Macreadie
 b,
Thomas J. F.
Southern
 a,
Yiming
Zhang
b,
Lauren N.
McHugh
 a,
Rachel C.
Evans
 a,
Stefan
Kaskel
c,
Shane G.
Telfer
 *b and
Thomas D.
Bennett
 *a
*a
aDepartment of Materials Science and Metallurgy, University of Cambridge, Cambridge, CB3 0FS, UK. E-mail: tdb35@cam.ac.uk
bMacDiarmid Institute for Advanced Materials and Nanotechnology, Institute of Fundamental Sciences, Massey University, Palmerston North, New Zealand
cTechnische Universität Dresden, Bergstrasse 66, 01062 Dresden, Germany
First published on 1st March 2021
Abstract
Metal–organic framework crystal–glass composites (MOF CGCs) have previously been formed by embedding crystalline MIL-53(Al) within a ZIF-62 glass (agZIF-62) matrix. Here we highlight thermal stability considerations in the formation of MOF CGCs, and subsequently report the synthesis of two novel MOF CGCs, by incorporating MIL-118 and UL-MOF-1 within agZIF-62. These new materials, alongside the prototypical MOF CGC, formed using MIL-53(Al), were studied using scanning electron microscopy, powder X-ray diffraction, and gas sorption techniques. The gas uptake in composites formed from MIL-118C and UL-MOF-1 is largely dominated by the agZIF-62 matrix, suggesting that to improve the porosity of the MOF CGC, the matrix porosity must be improved, or a percolation threshold must be overcome.
Introduction
Metal–organic frameworks (MOFs) are hybrid materials containing inorganic nodes, or clusters, linked together by organic units in continuous networks.1 These hybrid materials can be constructed using numerous combinations of metal ions—typically d-block elements—and polydentate ligands. Consequently, over 99![[thin space (1/6-em)]](https://www.rsc.org/images/entities/char_2009.gif) 000 unique MOFs have been reported in the literature, many of which possess exceptionally high surface areas.2 The hypothetical potential of such surface areas in MOFs has been predicted to reach ∼14
000 unique MOFs have been reported in the literature, many of which possess exceptionally high surface areas.2 The hypothetical potential of such surface areas in MOFs has been predicted to reach ∼14![[thin space (1/6-em)]](https://www.rsc.org/images/entities/char_2009.gif) 600 m2 g−1,3,4 though currently, the largest reported Brunauer–Emmett–Teller (BET) surface area is 7839 m2 g−1. Accordingly, they are of interest for several applications, such as sensing, gas storage, and water harvesting.1,5–7
600 m2 g−1,3,4 though currently, the largest reported Brunauer–Emmett–Teller (BET) surface area is 7839 m2 g−1. Accordingly, they are of interest for several applications, such as sensing, gas storage, and water harvesting.1,5–7
A wide range of stimuli-responsive behaviour is observed by MOFs as a result of their chemical and physical diversity.8 Some frameworks, such as UiO-66, are commonly referred to as ‘rigid’ and display little, or no, structural change upon application of (non-extreme) external stimuli.9 Others, however, undergo reversible structural transformations under relatively mild pressure or temperature changes; these are referred to as flexible MOFs.10 Perhaps the most commonly illustrated example of flexibility in MOFs is the phenomenon of “breathing”. An example of this occurs in the MOF Al2(bdc)3 (bdc – benzene-1,4-dicarboxylate, C8H4O42−)—referred to as MIL-53 from hereon—which undergoes a solid–solid phase transition from a narrow-pore phase at room temperature to a metastable large-pore phase upon desolvation at high temperature.11 The breathing effect in MIL-53 dynamically changes the pore volume and, by extension, alters the guest uptake capacity. Understanding such transitions is important for designing materials for molecular separations, catalysis, and gas storage since the interaction strength between host and guest is dependent upon pore size.
Reversible breathing behaviour represents just a small portion of the structural rearrangements exhibited by MOFs; further examples include recrystallisation, interpenetrated lattice movements and irreversible collapse upon solvent/guest removal.12 The most extensive of the observed rearrangements occur in a subset of MOFs known as zeolitic imidazolate frameworks (ZIFs), which contain an imidazolate-derived linker (Im, C3H3N2−), and adopt network topologies similar to those of inorganic zeolites. Heating under ambient pressure results in several ZIF structures undergoing melting to highly viscous liquid phases.13 These liquids then solidify upon cooling to form glasses in which tetrahedral Zn2+ ions are linked by imidazolate ligands in a continuous random network, analogous to that of amorphous silica.
The glass formed from ZIF-62, Zn(Im)1.75(bIm)0.25 (bIm, benzimidazolate, C7H5N2−)14 (melting temperature, Tm = 437 °C),15 has been identified as a suitable host matrix to secure crystalline MIL-53 particles within a bulk MOF structure. Specifically, a physical mixture of ZIF-62 and MIL-53 was heated to 450 °C for 15 min to melt the ZIF-62 and allow sufficient liquid flow around the crystalline component before cooling to room temperature; the resultant material is referred to as a MOF crystal–glass composite (MOF CGC). Interestingly, within this MOF CGC, the large-pore phase of MIL-53 was stabilised at room temperature, inducing a significant increase in the amount of CO2 adsorbed when compared to the uptake by a combination of the parent materials.16 The loading capacity of MIL-53 within the ZIF-62 glass (agZIF-62) matrix was also investigated, showing that 60–70 wt% MIL-53 could be encapsulated in the composite whilst retaining the MIL-53-lp state. As a result, a composite was fabricated with a CO2 capacity considerably greater than the phase-pure MIL-53 parent material.17
To date, the MOF CGC formed from MIL-53 and agZIF-62 is the first of only three known examples of this class of materials.16–18 The extension of this approach to other crystalline MOFs is dependent upon their structural integrity at the temperatures required for the fabrication of the MOF CGC (e.g. 437 °C).15 This is further complicated by the lack of thermal stability data using standardised atmospheric conditions and heating rates, and furthermore by the lack of data on stability when held isothermally at elevated temperatures.19
In turn, the lack of additional MOF CGC chemistries limits any further conclusions on the gas sorption and separation behaviour of these materials, which is confined to N2 and CO2 adsorption on MIL-53 based samples only. Such considerations motivated us to provide further examples of MOF CGCs from different crystalline chemistries and architectures and evaluate their gas adsorption behaviour.
Results and discussion
Several MOF candidates for the crystalline filler were selected according to their reported thermogravimetric analyses (TGA) indicating the required stability to 450 °C (Table 1) and were synthesised using the published procedures (see Experimental, Fig. S1–10†). Each of the eight frameworks selected was analysed using TGA conducted at a standard heating rate of 10 °C min−1 under inert nitrogen (N2), to confirm thermal stability (Fig. S11†). The onset of thermal decomposition, Td, below 450 °C was only observed for samples of DUT-6 and DUT-8. However, the Tds of these two materials were greater than the reported values due to the faster heating rate used in our evaluation compared to those employed in the literature. As mass loss had already begun to occur at 450 °C, and given the need for isothermal heat treatment at this temperature for CGC fabrication, this precluded further study of these specific materials (Fig. S12†).| MOF | Composition | Decomposition temperature, Td (°C) | Heating rate (°C min−1) | Ref. |
|---|---|---|---|---|
| a Experiment performed under an inert atmosphere. b 2,6-ndc = naphthalene-2,6-dicarboxylate, bdc = benzene-1,4-dicarboxylate, bpdc = biphenyl-4,4′-dicarboxylate, btb = benzene-1,3,5-tribenzoate, def = N,N-diethylformamide, dabco = 1,4-diazabicyclo[2.2.2]octane. | ||||
| CUmof-9 | Yb2(2,6-ndc)3(H2O)·(H2O)2 | 550a | 5 | 20 |
| DUT-6 | Zn4O(2,6-ndc)(btb)4/3(def)16(H2O)9/2 | ∼400 | 5 | 21 |
| DUT-8 | Ni2(2,6-ndc)2(dabco) | ∼400 | 5 | 22 |
| MIL-68 | V(OH)(bdc) | ∼500 | 10 | 23 |
| MIL-118 | Al2(OH)2(C10O8H2) | ∼450 | 1 | 24 |
| MIL-120 | Al4(OH)8(C10O8H2) | ∼480 | 1 | 25 |
| MIL-126(Sc) | Sc3O(H2O)2(bpdc)3X (X = OH or Cl) | ∼500 | 10 | 26 |
| UL-MOF-1 | Li2(2,6-ndc) | 610a | 10 | 27 |
To provide a more accurate evaluation of thermal stability, the remaining MOFs were heated to 450 °C for 1 min, under N2, and allowed to cool to room temperature in situ. Ambient temperature powder X-ray diffraction (PXRD) data were then recorded (Fig. S1–S10†). This relatively simple experiment highlighted the importance of performing thermal analysis of MOFs using an appropriate set of conditions, chosen according to the individual processing or application requirements. For example, Bragg peaks intensities in the PXRD pattern for MIL-68 (Fig. S2†) were reduced to near negligible levels, alongside a significant reduction in intensities, or changes in the patterns, for MIL-120 and MIL-126(Sc) (Fig. S3 and S4†). This is consistent with the thermal analysis performed by Volkringer et al., confirming that the first step in decomposition for MIL-120 is due to ligand degradation.25 An unreported recrystallisation of CUmof-9 was also observed (Fig. S1†), though the high-temperature phase was not identified. MIL-68, MIL-120, MIL-126, and CUmof-9 were, therefore, not studied further.
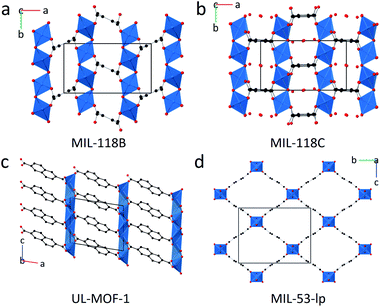
The PXRD patterns of the three remaining samples: MIL-118, UL-MOF-1, and MIL-53-np (Fig. 1a–d), displayed Bragg peaks in good agreement with their room temperature structures after heating to 450 °C (Fig. S5–S10†). UL-MOF-1 has been reported to display exceptional thermal stability (Td = 610 °C); the structure consists of alternating two-dimensional antifluorite type lithium oxide layers connected by 2,6-ndc struts (Fig. 1c).27 No flexible behaviour has been reported for this material. Conversely, MIL-118, Al2(OH)2(C10O8H2) (C10O8H24− – benzene-1,2,4,5-tetracarboxylate), exhibits a water-driven reversible structural transition, analogous to that of MIL-53.24 MIL-118 is typically synthesised with excess ligand in the pores of the framework and is named MIL-118A (C2/c). Upon heating MIL-118A, this excess ligand is removed, resulting in the open-pore framework, MIL-118B (Pbam), which is stable at high temperatures. Upon cooling, the framework adsorbs water to form the room temperature stable phase, MIL-118C (Pnam). The transition causes a shift from the rectangular 1-D tunnels in MIL-118B to lozenge-shaped channels, with water molecules occupying the pores in MIL-118C. Temperature-induced breathing is observed between the MIL-118C and MIL-118B phases (Fig. 1a and b).
MOF CGCs containing 50 wt% crystalline UL-MOF-1 and MIL-118 were synthesised using the method previously published in the literature for a CGC containing MIL-53. Briefly, the synthesis involved mixing the two crystalline components by ball-milling, pelletising the mixture, and heating to 450 °C under argon (for full procedure, see Experimental). These are referred to as (crystal)x(glass)1−x where x = weight fraction of the crystalline material in the composite, consistent with prior nomenclature. The MOF CGC behaviour was compared to a sample of (MIL-53)0.25(agZIF-62)0.75, synthesised according to previous methods.16
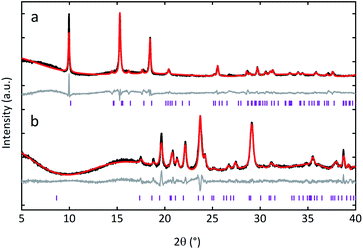
Ambient temperature PXRD data were recorded for the three MOF CGCs. As expected, Bragg peaks present in the crystalline sample of UL-MOF-1 were also present in (UL-MOF-1)0.5(agZIF-62)0.5. PXRD data for (MIL-53)0.25(agZIF-62)0.75 demonstrated the presence of the open-pore MIL-53 phase, per previous results.16,17 Interestingly, the PXRD data for (MIL-118)0.5(agZIF-62)0.5 indicated little change in lattice parameters from the synthesised MIL-118 sample, which remained in the low-temperature MIL-118C (Pnam) phase (Fig. 2 and Table S1†). This shows that, unlike the MIL-53 in (MIL-53)0.25(agZIF-62)0.75, the MIL-118 encapsulated within the glass does not retain the high-temperature MIL-118B (Pbam) phase (Fig. 1a).
In our previous work, we demonstrated that the ingress of water did not drive a transition from MIL-53-lp back to MIL-53-np in a room temperature MOF CGC.16 It was, therefore, suggested that “the stabilisation of MIL-53-lp does not arise because it is excluded from entering the composite CGC material. Instead, we suggest that the polymeric phase is not soft enough to accommodate a large-scale change of the crystal phase structure, while the interfacial contact between the two phases is maintained”.16
Here, it is perhaps the case that either (i) interfacial contact between MIL-118 and the glass is less than that of MIL-53 and the glass, and/or (ii) that the volume changes upon the transition from MIL-118B to MIL-118C can be accommodated by the glass phase.
Scanning electron microscopy (SEM) images of MIL-53-np, MIL-118, and UL-MOF-1 display micrometre-sized crystals (Fig. S13–S15†). Samples of MIL-118 and MIL-53 display reasonable size and shape uniformity in comparison to UL-MOF-1, which comprises a range of morphologies from 10 μm cubic structures to 200 μm sheets (Fig. S15†). This occurs despite (i) X-ray diffraction phase purity which matches the reported crystallographic information, and (ii) a single thermal decomposition event at the reported temperature.
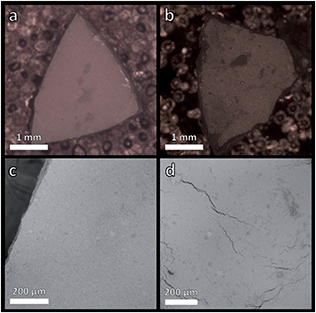
The MOF CGCs formed in each case demonstrated self-supporting, contiguous, bulk morphologies. SEM performed upon deliberately fractured pieces of these materials did not contain distinguishable remnants of the respective parent crystalline phases at the surface of the composite (Fig. 3 and S16–S18†). Their self-supporting nature, coupled with the smooth surface of the MOF CGCs, provides evidence that the liquid ZIF-62 permeated through the pellet. However, a region of coarse material matching the morphology of MIL-118 was observed at a macroscale surface defect in the sample of (MIL-118)0.5(agZIF-62)0.5 (Fig. S17†).
Prior work on MOF CGCs has investigated only the gas uptake behaviour of a series of (MIL-53)x(agZIF-62)1−x CGCs with carbon dioxide (CO2) and nitrogen (N2).16,17 A range of analyte gases was therefore employed here to investigate the factors underpinning gas uptake in MOF CGCs. Gas sorption isotherms were performed predominantly at 273 K, with further experiments performed for some gases at 77 K and 293 K. For full experimental methodology, see Experimental.
A sample of pure agZIF-62 was prepared (see Experimental) and observed to exhibit porosity towards H2 (1.05 mmol g−1 at 77 K, and 0.18 mmol g−1 at 273 K) and CO2 (0.95 mmol g−1 at 273 K) (Fig. 4 and S19†), both significantly lower than crystalline ZIF-62 which adsorbs ∼6.03 mmol g−1 H2 at 77 K and ∼1.79 mmol g−1 CO2 at 273 K.28 These results are in accordance with previous studies which demonstrate porosity in ZIF-glass materials.29
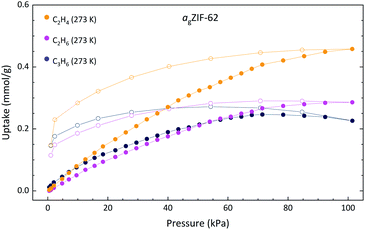 | ||
| Fig. 4 Gas adsorption isotherms of agZIF-62. Solid and open circles of the same colour indicate the adsorption and desorption respectively. | ||
Methane (CH4) adsorption for agZIF-62 was observed in this work at 0.21 mmol g−1 at 273 K (Fig. S19†), in agreement with the reported measurement of 0.18 mmol g−1 and representing a decrease from the reported value of 1.21 mmol g−1 in the crystalline ZIF-62.30 Hysteresis is observed in the agZIF-62 isotherms as a result of the diffusion limitations through the amorphous structure, increasing in magnitude with the kinetic diameter of the adsorbent, also consistent with prior work.31,32 This is especially evident in the propene isotherm, with the uptake amount appearing to diminish in the region 70–100 kPa. This is an artefact of slow diffusion kinetics. The recorded adsorption/desorption points are not at equilibrium and are imperfectly estimated in the higher-pressure region.
Remarkably, in addition to the reported selectivity towards propane (C3H8) and propene (C3H6) by agZIF-62 by Frentzel-Beyme et al.,31 some selectivity towards ethene (C2H4) over ethane (C2H6) is observed here with uptakes of 0.46 and 0.29 mmol g−1, respectively (Fig. 4). Industrially, the separation of small hydrocarbons is currently performed using cryogenic high-pressure distillation processes and accounts for a large portion of global energy expenditure. Membrane-based separation of these materials is reportedly tenfold less energy-intensive, making development in this area both environmentally and economically desirable.33
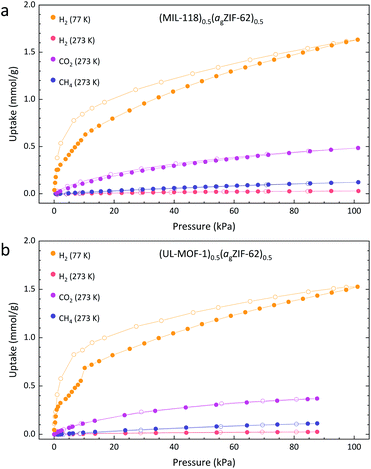
To understand how incorporation within agZIF-62 affects the gas sorption properties of the crystalline MOF, we compare the results for the pure crystalline material to that of the MOF CGC. Samples of MIL-118C and (MIL-118)0.5(agZIF-62)0.5 display identical trends in their adsorption isotherms of H2, CH4, and CO2, indicating no significant change in the chemical environment of MIL-118 upon inclusion in the MOF CGC (Fig. 5a and S20†). Since MIL-118C displays porosity to H2 at 77 K, the negligible uptake of H2 at 273 K is ascribed to temperature effects. However, the generally poor uptake capacity of MIL-118C is consistent with a dense atomic arrangement, in accordance with the published crystallographic information.24
The adsorption of gases at 273 K by the 50 wt% composite material, (MIL-118)0.5(agZIF-62)0.5, is broadly comparable to a linear combination of the parent materials (Table 2). This, however, is not the case for H2 adsorption at 77 K. Here, the recorded composite uptake is greater than either of its parent components and more than double the weighted average of the parent materials; this may suggest the presence of macroporous interfacial regions.
| Sample/gas | Crystalline MOF (mmol g−1) | a gZIF-62 (mmol g−1) | Weighted average (mmol g−1) | Measured MOF CGC (mmol g−1) |
|---|---|---|---|---|
| MIL-118 | ||||
| Methane | 0.016 | 0.212 | 0.114 | 0.122 |
| Carbon dioxide | 0.152 | 0.947 | 0.550 | 0.485 |
| Hydrogen (77 K) | 0.440 | 1.051 | 0.746 | 1.632 |
![[thin space (1/6-em)]](https://www.rsc.org/images/entities/char_2009.gif) |
||||
| UL-MOF-1 | ||||
| Methane | 0.015 | 0.212 | 0.113 | 0.113 |
| Carbon dioxide | 0.051 | 0.947 | 0.499 | 0.370 |
| Hydrogen (77 K) | 0.320 | 1.051 | 0.686 | 1.527 |
Identical experiments were performed on UL-MOF-1 and (UL-MOF-1)0.5(agZIF-62)0.5, and again, the generally poor adsorption to UL-MOF-1 is consistent with a dense structure (Fig. 5b and S20†). The same thermal effects observed in the MIL-118 H2 isotherms at 77 K and 273 K were also observed for UL-MOF-1. The gas uptakes displayed by (UL-MOF-1)0.5(agZIF-62)0.5 are broadly consistent with a linear combination of parent UL-MOF-1 and agZIF-62 materials (Table 2). Interestingly, the 77 K H2 sorption isotherm for (UL-MOF-1)0.5(agZIF-62)0.5 also exhibits a twofold increase in gas uptake over the weighted average of its parent materials.
The prediction of gas uptake through the weighted average of its components calculated here assume that the quantity of gas adsorbed in the MOF CGCs is due to the combined individual contributions from the two composited materials, where their adsorption is identical to the isolated components. It is important to note, however, that the hysteresis observed in the CO2 isotherms for both agZIF-62 and the isolated crystalline MOFs is no longer present in the respective MOF CGCs. This suggests that the MOF CGC reaches equilibrium more rapidly than its isolated components, indicating that there may be new pathways for the gas to diffuse in the MOF CGC.
A CO2 adsorption isotherm was also recorded at 273 K for the pure crystalline sample of MIL-53-np and is consistent with previously reported data (2.25 mmol g−1 (recorded), and 2.13 mmol g−1 (reported) (273 K), Fig. S21†).17 As expected, MIL-53-np displays a significantly higher uptake of C3H6 than C2H4, C2H6, or xenon (Xe), reaching 3.47 mmol g−1 (273 K). The observation of two-step isotherms when using larger hydrocarbons is consistent with pore-opening behaviour where MIL-53-np expands to the MIL-53-lp phase, as comprehensively illustrated in the literature.11
Consistent with our prior work, the MOF CGC exhibits appreciable porosity. However, due to fixation of the MIL-53-lp phase within the (MIL-53)0.25(agZIF-62)0.75 composite, the pore opening behaviour of pure phase MIL-53 is no longer observed, and all recorded isotherms of (MIL-53)0.25(agZIF-62)0.75 display Langmuir-type behaviour, often with hysteresis in the desorption branch. The CO2 sorption of a sample of (MIL-53)0.25(agZIF-62)0.75 displayed similar CO2 uptake behaviour to that recorded previously (1.33 mmol g−1 (recorded), and 1.14 mmol g−1 (reported)).17 The sample of (MIL-53)0.25(agZIF-62)0.75 also displayed poor adsorption of both N2 and CH4 (<0.13 and <0.36 mmol g−1 at 273 K, respectively), since neither component of the CGC strongly adsorbs these gases (Fig. S22†).
Since this sample, unlike (MIL-118)0.5(agZIF-62)0.75 and (UL-MOF-1)0.5(agZIF-62)0.75, demonstrates a permeable crystalline component, further gas sorption experiments using larger gases were performed (Fig. 6). A considerable difference between the uptake of C2H4 and C2H6 is observed in a sample of (MIL-53)0.25(agZIF-62)0.75, which is typical of the agZIF-62 component but is not observed in MIL-53. This result evidences the contribution of the adsorption properties of agZIF-62 to the overall composite characteristics.
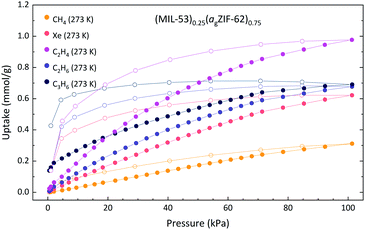 | ||
| Fig. 6 Gas adsorption isotherms of (MIL-53)0.25(agZIF-62)0.75. Solid and open circles of the same colour indicate the adsorption and desorption respectively. | ||
Of the gases employed, the most striking result was that of C3H6, where the composite adsorbs far less than the combination of the parent materials. A weighted average C3H6 adsorption of MIL-53 (3.47 mmol g−1) and agZIF-62 (0.23 mmol g−1) for a 25 wt% MIL-53 mixture would be 1.04 mmol g−1, where an uptake of only 0.69 mmol g−1 is observed for the composite. However, the adsorption isotherm for C3H6 to (MIL-53)0.25(agZIF-62)0.75 shows an increase in uptake on desorption, strongly indicating that the system had not reached equilibrium. This is likely due to poor diffusion of C3H6 through the agZIF-62 matrix as a result of the comparatively large kinetic diameter of the gas. Though the MIL-53 component in the composite would be the dominant contributor to the gas uptake, adsorption to this component is greatly hindered whilst encapsulated within a matrix that is poorly permeable to the analyte gas.
Conclusions
Thermal analysis of a selection of crystalline MOFs revealed that two: UL-MOF-1, and MIL-118, are suitable for inclusion with a MOF glass (agZIF-62) matrix. Despite reported TGA evidence to the contrary, several other crystalline MOFs were observed to undergo partial or complete collapse at the processing temperatures required for composite formation. This highlights the necessity of detailed thermal characterisation and the avoidance of an over-reliance on constant-rate TGA experiments.19It is clear from this research that to expand the scope of MOF CGCs to include frameworks with more diverse properties, new synthetic pathways must be explored. Two of such avenues may lie in (i) the utilisation of coordination polymers or MOFs with lower melting temperatures or (ii) exchanging the crystalline glass-forming MOF for a premade glass MOF. In doing so, the temperatures required for the fabrication of the MOF CGC may be reduced as the glass transition temperature (Tg) occurs at a lower temperature than the melting temperature (Tm) used here.34–37
The adsorption behaviour of the resultant two new MOF CGCs is dominated by contributions from the agZIF-62 matrix, which prevents the diffusion of molecules with a kinetic diameter larger than that of C3H6. The development of more permeable agMOFs may aid in the expansion of MOF CGC applicability. Alternatively, work on overcoming percolation thresholds in MOF CGCs would mean guest diffusion is primarily controlled by the crystalline MOF component. This would allow further control of interactions leading to multifunctional materials with the ability to act as both molecular sieves and separators.
Experimental
Material synthesis
Characterisation
Author contributions
C. W. A. and T. D. B. designed the project with assistance from S. G. T. Materials were synthesised by C. W. A. with assistance from Y. Z. (agZIF-62), and S. K. (DUT-6 and DUT-8). C. W. A. recorded PXRD and TGA data and performed Pawley refinements. T. J. F. S. and C. W. A. prepared samples and recorded SEM images. Gas sorption experiments were performed by L. K. M., S. G. T., C. W. A., and Y. Z. The manuscript was written by all authors.Conflicts of interest
There are no conflicts to declare.Acknowledgements
T. D. B. thanks the Royal Society for both a university research fellowship (UF150021) and a research grant (RSG\R1\180395). T. D. B. and L. N. M. thank the Leverhulme Trust for a Philip Leverhulme Prize (2019). C. W. A. thanks the Royal Society for a PhD studentship (RG160498) and the Commonwealth Scientific and Industrial Research Council for additional support (C2017/3108). T. J. F. S. thanks the EPSRC (EP/1937468) for a PhD studentship. S. K. acknowledges funding by DFG (FOR2433). S. G. T. thanks the Royal Society of New Zealand for the catalyst seeding grant (18-MAU-022-CSG).Notes and references
- H. Furukawa, K. E. Cordova, M. O'Keeffe and O. M. Yaghi, Science, 2013, 341, 120444 CrossRef PubMed.
- P. Z. Moghadam, A. Li, X. W. Liu, R. Bueno-Perez, S. D. Wang, S. B. Wiggin, P. A. Wood and D. Fairen-Jimenez, Chem. Sci., 2020, 11, 8373–8387 RSC.
- I. M. Hönicke, I. Senkovska, V. Bon, I. A. Baburin, N. Bönisch, S. Raschke, J. D. Evans and S. Kaskel, Angew. Chem., Int. Ed., 2018, 57, 13780–13783 CrossRef PubMed.
- O. K. Farha, I. Eryazici, N. C. Jeong, B. G. Hauser, C. E. Wilmer, A. A. Sarjeant, R. Q. Snurr, S. T. Nguyen, A. Ö. Yazaydin and J. T. Hupp, J. Am. Chem. Soc., 2012, 134, 15016–15021 CrossRef CAS PubMed.
- T. Islamoglu, Z. Chen, M. C. Wasson, C. T. Buru, K. O. Kirlikovali, U. Afrin, M. R. Mian and O. K. Farha, Chem. Rev., 2020, 120, 8130–8160 CrossRef CAS PubMed.
- I. M. Hönicke, I. Senkovska, V. Bon, I. A. Baburin, N. Bönisch, S. Raschke, J. D. Evans and S. Kaskel, Angew. Chem., Int. Ed., 2018, 57, 13780–13783 CrossRef PubMed.
- H. Kim, S. Yang, S. R. Rao, S. Narayanan, E. A. Kapustin, H. Furukawa, A. S. Umans, O. M. Yaghi and E. N. Wang, Science, 2017, 356, 430–434 CrossRef CAS PubMed.
- F. X. Coudert, Chem. Mater., 2015, 27, 1905–1916 CrossRef CAS.
- J. Hajek, C. Caratelli, R. Demuynck, L. Vanduyfhuys, M. Waroquier and V. Van Speybroeck, Chem. Sci., 2018, 9, 2723–2732 RSC.
- A. Schneemann, V. Bon, I. Schwedler, I. Senkovska, S. Kaskel and R. A. Fischer, Chem. Soc. Rev., 2014, 43, 6062–6096 RSC.
- T. Loiseau, C. Serre, C. Huguenard, G. Fink, F. Taulelle, M. Henry, T. Bataille and G. Férey, Chem.–Eur. J., 2004, 10, 1373–1382 CrossRef CAS PubMed.
- E. J. Carrington, C. A. McAnally, A. J. Fletcher, S. P. Thompson, M. Warren and L. Brammer, Nat. Chem., 2017, 9, 882–889 CrossRef CAS PubMed.
- T. D. Bennett, J.-C. Tan, Y. Yue, E. Baxter, C. Ducati, N. J. Terrill, H. H.-M. Yeung, Z. Zhou, W. Chen, S. Henke, A. K. Cheetham and G. N. Greaves, Nat. Commun., 2015, 6, 8079 CrossRef CAS PubMed.
- R. Banerjee, A. Phan, B. Wang, C. Knobler, H. Furukawa, M. O'Keefe and O. M. Yaghi, Science, 2008, 319, 939–944 CrossRef CAS PubMed.
- T. D. Bennett, Y. Yue, P. Li, A. Qiao, H. Tao, N. G. Greaves, T. Richards, G. I. Lampronti, S. A. T. Redfern, F. Blanc, O. K. Farha, J. T. Hupp, A. K. Cheetham and D. A. Keen, J. Am. Chem. Soc., 2016, 138, 3484–3492 CrossRef CAS PubMed.
- J. Hou, C. W. Ashling, S. M. Collins, A. Krajnc, C. Zhou, L. Longley, D. N. Johnstone, P. A. Chater, S. Li, M.-V. Coulet, P. L. Llewellyn, F.-X. Coudert, D. A. Keen, P. A. Midgley, G. Mali, V. Chen and T. D. Bennett, Nat. Commun., 2019, 10, 2580 CrossRef PubMed.
- C. W. Ashling, D. N. Johnstone, R. N. Widmer, J. Hou, S. M. Collins, A. F. Sapnik, A. M. Bumstead, P. A. Midgley, P. A. Chater, D. A. Keen and T. D. Bennett, J. Am. Chem. Soc., 2019, 141, 15641–15648 CrossRef CAS PubMed.
- S. Li, S. Yu, S. M. Collins, D. N. Johnstone, C. W. Ashling, A. F. Sapnik, P. A. Chater, D. S. Keeble, L. N. McHugh, P. A. Midgley, D. A. Keen and T. D. Bennett, Chem. Sci., 2020, 11, 9910–9918 RSC.
- C. Healy, K. M. Patil, B. H. Wilson, L. Hermanspahn, N. C. Harvey-Reid, B. I. Howard, C. Kleinjan, J. Kolien, F. Payet, S. G. Telfer, P. E. Kruger and T. D. Bennett, Coord. Chem. Rev., 2020, 419, 213388 CrossRef CAS.
- F. A. A. Paz and J. Klinowski, Chem. Commun., 2003, 1484–1485 Search PubMed.
- N. Klein, I. Senkovska, K. Gedrich, U. Stoeck, A. Henschel, U. Mueller and S. Kaskel, Angew. Chem., Int. Ed., 2009, 48, 9954–9957 CrossRef CAS PubMed.
- N. Klein, C. Herzog, M. Sabo, I. Senkovska, J. Getzschmann, S. Paasch, M. R. Lohe, E. Brunner and S. Kaskel, Phys. Chem. Chem. Phys., 2010, 12, 11778–11784 RSC.
- B. Seoane, V. Sebastián, C. Téllez and J. Coronas, CrystEngComm, 2013, 15, 9483–9490 RSC.
- C. Volkringer, T. Loiseau, N. Guillou, M. Haouas, F. Taulelle, N. Audebrand, I. Margiolaki, D. Popov, M. Burghammer and C. Riekel, Cryst. Growth Des., 2009, 9, 2927–2936 CrossRef CAS.
- C. Volkringer, T. Loiseau, M. Haouas, F. Taulelle, D. Popov, M. Burghammer, C. Riekel, C. Zlotea, F. Cuevas, M. Latroche, D. Phanon, C. Knöfelv, P. L. Llewellyn and G. Férey, Chem. Mater., 2009, 21, 5783–5791 CrossRef CAS.
- R. J. Marshall, C. T. Lennon, A. Tao, H. M. Senn, C. Wilson, D. Fairen-Jimenez and R. S. Forgan, J. Mater. Chem. A, 2018, 6, 1181–1187 RSC.
- D. Banerjee, S. J. Kim and J. B. Parise, Cryst. Growth Des., 2009, 9, 2500–2503 CrossRef CAS.
- R. N. Widmer, G. I. Lampronti, S. Anzellini, R. Gaillac, S. Farsang, C. Zhou, A. M. Belenguer, C. W. Wilson, H. Palmer, A. K. Kleppe, M. T. Wharmby, X. Yu, S. M. Cohen, S. G. Telfer, S. A. T. Redfern, F. X. Coudert, S. G. MacLeod and T. D. Bennett, Nat. Mater., 2019, 18, 370–376 CrossRef CAS PubMed.
- C. Zhou, L. Longley, A. Krajnc, G. J. Smales, A. Qiao, I. Erucar, C. M. Doherty, A. W. Thornton, A. J. Hill, C. W. Ashling, O. T. Qazvini, S. J. Lee, P. A. Chater, N. J. Terrill, A. J. Smith, Y. Yue, G. Mali, D. A. Keen, S. G. Telfer and T. D. Bennett, Nat. Commun., 2018, 9, 1–9 CrossRef PubMed.
- L. Longley, S. M. Collins, S. Li, G. J. Smales, I. Erucar, A. Qiao, J. Hou, C. M. Doherty, A. W. Thornton, A. J. Hill, X. Yu, N. J. Terrill, A. J. Smith, S. M. Cohen, P. A. Midgley, D. A. Keen, S. G. Telfer and T. D. Bennett, Chem. Sci., 2019, 10, 3592–3601 RSC.
- L. Frentzel-Beyme, M. Kloß, P. Kolodzeiski, R. Pallach and S. Henke, J. Am. Chem. Soc., 2019, 141, 12362–12371 CrossRef CAS PubMed.
- L. Frentzel-Beyme, M. Kloß, R. Pallach, S. Salamon, H. Moldenhauer, J. Landers, H. Wende, J. Debus and S. Henke, J. Mater. Chem. A, 2019, 7, 985–990 RSC.
- D. S. Sholl and R. P. Lively, Nature, 2016, 532, 435–437 CrossRef PubMed.
- S. S. Nagarkar, H. Kurasho, N. T. Duong, Y. Nishiyama, S. Kitagawa and S. Horike, Chem. Commun., 2019, 55, 5455–5458 RSC.
- A. M. Bumstead, M. F. Thorne and T. D. Bennett, Faraday Discuss., 2021, 225, 210–225 RSC.
- C. Das, T. Ogawa and S. Horike, Chem. Commun., 2020, 56, 8980–8983 RSC.
- B. K. Shaw, A. R. Hughes, M. Ducamp, D. A. Keen, F.-X. Coudert, F. Blanc and T. D. Bennett, ChemRxiv, 2020 DOI:10.26434/chemrxiv.11956599.v1.
Footnote |
| † Electronic supplementary information (ESI) available: Powder X-ray diffraction, thermogravimetric analysis, scanning electron microscopy, and gas sorption isotherms. See DOI: 10.1039/d0ta11229a |
| This journal is © The Royal Society of Chemistry 2021 |

