
Effect of photon counting shot noise on total internal reflection microscopy†
Fan
Cui
a and
David J.
Pine
ab
aDepartment of Physics, Center for Soft Matter Research, New York University, 726 Broadway, New York, NY 10003, USA. E-mail: cuifan@nyu.edu; pine@nyu.edu
bDepartment of Chemical & Biomolecular Engineering, Tandon School of Engineering, New York University, 6 MetroTech Center, Brooklyn, New York 11201, USA
First published on 27th November 2021
Abstract
Total internal reflection microscopy (TIRM) measures changes in the distance between a colloidal particle and a transparent substrate by measuring the scattering intensity of the particle illuminated by an evanescent wave. From the distribution of the recorded separation distances, the height-dependent effective potential φ(z) between the colloidal particle and the substrate can be measured. In this work, we show that spatial resolution with which TIRM can measure φ(z) is limited by the photon counting statistics of the scattered laser light. We develop a model to evaluate the effect of photon counting statistics on different potential profiles using Brownian dynamics simulations and experiments. Our results show that the effect of photon counting statistics depends on spatial gradients ∂φ/∂z of the potential, with the result that sharp features tend to be significantly blurred. We further establish the critical role of photon counting statistics and the intensity integration time τ in TIRM measurements, which is a trade-off between narrowing the width of the photon counting distribution and capturing the instantaneous position of the probe particle.
1 Introduction
Total internal reflection microscopy1 (TIRM) is a powerful method for measuring the microscopic interactions of colloidal particles in a liquid suspension. Since its development some 30 years ago,2 it has been used to measure various colloidal interactions, including screened electrostatic repulsion,1,3 steric repulsion due to grafted or adsorbed polymers,4–6 van der Waals attraction,4 depletion attraction,7,8 critical Casimir interactions,9 and interactions of DNA-coated colloids.10 Spatial resolutions as small as 1 nm have been reported.2 As such, TIRM has become an invaluable tool for understanding colloidal interactions at a microscopic scale.In spite of TIRM's long and enduring use, the effects of photon counting statistics, often called shot noise, on TIRM measurements of colloidal interaction potentials have not been fully worked out. While shot noise has been considered for the special case of a particle confined by optical tweezers in an evanescent field11,12 and for microrheology measurements in an evanescent field,13 in conventional TIRM measurements, shot noise is generally regarded as insignificant without further detailed consideration.14,15 Indeed, shot noise can often be ignored when measuring potentials with soft features like a double-layer potential at low ionic strength.14,15 However, as we show in this paper, shot noise can be the limiting factor when measuring interactions with short-range potential profiles and particles with fast dynamics. In this work, we systematically study the effects of shot noise on TIRM measurements of interaction potentials and identify the potential profile features that are most prone to corruption by shot noise. We also provide the means to quantitatively determine and minimize how it distorts the measurement of the potential.
Fig. 1 shows a schematic of a typical TIRM experiment and summarizes the basic experimental setup. The TIRM technique is based on two simple ideas. The first idea is that the probability that a particle at equilibrium in a liquid suspension is at a height z above the substrate is given by the Boltzmann distribution
p(z) = Ae−φ(z)/kBT![[thin space (1/6-em)]](https://www.rsc.org/images/entities/char_2009.gif) , , | (1) |
 | (2) |
 | ||
| Fig. 1 TIRM schematic. Laser light enters from the right and is totally internally reflected at the substrate, launching an exponentially-damped evanescent wave towards the particle, which is a distance z above the substrate in a liquid suspension. Light scattered by the particle is collected by a microscope objective lens and directed toward a photon counter. | ||
The second idea starts with the observation that the evanescent intensity Ie of light totally internally reflected from the substrate decays exponentially with height above the substrate, Ie(z) = Ie0exp(−βz), where β−1 is the penetration depth of the evanescent wave, which is typically in the range of 70–200 nm. Because the intensity I of the light scattered by the particle is proportional to the intensity Ie of the evanescent field that is incident on the particle, the scattered intensity also depends exponentially on the height of the particle,1,16
| I(z) = I0e−βz. | (3) |
The probability P(I)dI that the scattered intensity is between I and I + dI is the equal to the probability p(z)dz that the particle is between a height of z and z + dz, and thus are related by
| P(I)|dI| = p(z)|dz|. | (4) |
 | (5) |
In a TIRM experiment, changes in the scattered intensity are monitored, typically for ten minutes or more, by repeatedly counting photons over some short interval of time τ, the integration time, typically on the order of milliseconds. From this chain of measurements, a histogram of scattered intensities N(I) is constructed, where N(I) is the number of observations of intensity between I and I + ΔI. For a sufficiently large number of measurements N(I) ∝ P(I). Fig. 2a shows such a histogram obtained from a TIRM measurement of a negatively charged polystyrene sphere in aqueous suspension above a negatively charged glass substrate.
 | ||
| Fig. 2 TIRM measurement of the interaction potential for a negatively charged polystyrene sphere with diameter of 8 μm in 0.5 mM NaCl aqueous solution above a negatively charged glass substrate. (a) Histogram of scattered intensities obtained from a TIRM experiment with an integration time τ = 10 ms. (b) Solid circles show the experimentally measured interaction potential φ(z), with the potential minimum height aligned at zr = 133 nm. A least-square-fit to the data gives a Debye length of κ−1 = 12.1 nm and G = 0.146 pN. Open circles show the potential profile obtained from a Brownian dynamics simulation using Δt = 0.2 ms as simulation step size with 12.5 million steps and integration time τ = 10 ms. A least squares fit gives κ−1 = 13.5 nm and G = 0.157 pN. Dotted line shows potential φ(z) used as an input for the simulation with κ−1 = 13.7 nm and G = 0.152 pN. | ||
Using eqn (5) for p(z), eqn (2) can be rewritten as
 | (6) |
2 Shot noise
Like most optical measurements, the resolution and accuracy of TIRM are limited by instrumental noise. The types of noise commonly identified are background scattering, laser power fluctuations, statistical noise, and photon detection shot noise.12,14,18–21 In earlier efforts, several methods were developed to reduce background noise,12,18 including subtraction of averaged background intensity and applying low-pass filters of the measured signals. The effect of laser power fluctuations can usually be kept small19 and managed with improved laser design.13 In addition, there is the statistical noise associated with forming the histogram of intensities from a finite number of measurements.19 This is the source of the deviations from the theoretical predictions at large z that are visible in Fig. 2. This source of noise can usually be made negligible by acquiring data for a sufficiently long time period or performing the same measurements for multiple times.2,19The implicit assumption in the analysis of TIRM data using eqn (6) is that there is a one-to-one correspondence between the scattered intensity and the particle position, which is given by eqn (3). However, for any measurement of light intensity, there are intrinsic quantum fluctuations (shot noise) associated with photon counting. In a typical TIRM experiment, the intensity of the scattered light is measured by some quantum mechanical photon counting process, for example, using a photomultiplier or an avalanche photodiode. Indeed, these are the most sensitive and information-rich methods of detecting the scattered intensity. In a typical TIRM experiment, the intensity is measured by counting photons for some integration time interval τ, typically on the order of milliseconds. In this case, the probability of detecting n photons in a time interval τ is given by a Poisson distribution22
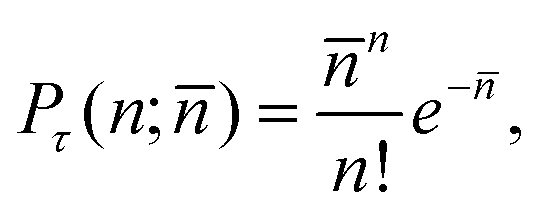 | (7) |
![[n with combining macron]](https://www.rsc.org/images/entities/i_char_006e_0304.gif) is the average number of photons detected in a time τ for a given constant intensity I. The width of the distribution, as measured by the square root of the variance, is
is the average number of photons detected in a time τ for a given constant intensity I. The width of the distribution, as measured by the square root of the variance, is  . The finite width of Pτ(n;) means that there is an intrinsic uncertainty, sometimes called shot noise, in any measurement of the scattered intensity. This means that there will be an intrinsic uncertainty in the particle height and in the determination of the effective potential φ(z). This limits the resolution with which TIRM can measure φ(z). As we will show, for potentials that do not vary too rapidly in space, this does not pose a serious limitation. However, for rapidly-varying potentials, such as those exhibited by particles with a fairly hard-core repulsion or a very short-range attraction, it can pose a significant limitation.
The intensity I that appears in eqn (3)–(6) is the classical intensity, without shot noise. The units of intensity are arbitrary in this context, so without loss of generality we can write nc = Iτ and P(I)dI = P(nc)dnc, where nc is taken to mean the (classical) intensity, measured in counts per integration time, that would be measured if there were no shot noise. Thus, we can rewrite eqn (3) as
| nc(z) =nc0e−βz. | (8) |
However, for a given integration time τ and classical intensity nc = Iτ, the number of photons n actually measured is Poisson distributed around nc according to eqn (7) with = nc. This means that the two distribution functions P(n), which is measured in a standard TIRM experiment, and P(nc), which is what should be used in eqn (5), are different. In the limit of a very large number of measurements, two are related by
 | (9) |
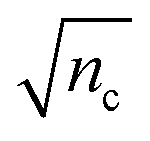 , we see that the measured intensity distribution P(n) is similar to (but distinct from) a discrete convolution of the classical intensity distribution P() with the Poisson distribution Pτ(n;) given by eqn (7). Thus, any abrupt change in P(nc), which occurs when there is an abrupt change in φ(z), will be rounded by Pτ(n;nc) on a scale given by
  . This will lead to a blurring in the potential φ(z) measured by TIRM.
The blurring of P(n) relative to P(nc) limits the resolution with which TIRM can measure a particle's height z. For a particle at height z, the average number of photons counted in a time τ is given by eqn (8). Taking the differential of eqn (8), we obtain
 | (10) |
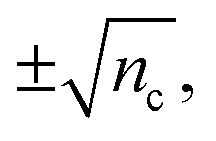 we obtain an expression for the uncertainty in the measured particle height due to photon shot noise
 | (11) |
The fundamental problem with the conventional TIRM analysis is that eqn (4) is not strictly correct. Because of the quantum fluctuations associated with photon counting, there is not a strict one-to-one correspondence between a measurement of the scattered intensity and the particle height z. Thus I(z) in eqn (6) is not a perfect proxy for particle position as assumed in eqn (3). Similarly, the N(I) used in eqn (6) is not a perfect proxy for p(z), as assumed in eqn (4). In what follows, we explore the consequences of this problem through simulation and experiment and develop strategies for minimizing and mitigating the deleterious effects of photon shot noise.
3 Results
3.1 Brownian dynamics simulations
To evaluate the effects of shot noise on the measured potential energy profiles, we first numerically simulate the trajectories of a colloidal particle and then use them to construct the noise-corrupted scattering intensities. We use the Brownian dynamics simulation method first described by Sholl and Prieve.19 A colloid's Brownian motion in a force field along the vertical direction can be described using a Langevin equation: | (12) |
From the Langevin equation, Ermak and McCammon23 developed a method for simulating the diffusive behavior of Brownian particles in a solution, with a displacement equation given by:
 | (13) |
When a particle is close to a surface, as is the case in a typical TIRM measurement, the mobility of the particle is hindered compared to its motion in a free-solution, and depends strongly on the separation distance between the particle and the surface. When the separation distance is small (comparable to or smaller than the particle radius r), the close-wall effect can be taken into account using D(z) = λD0, where D0 is the free diffusion coefficient, and λ is a function of γ = z/r, where z is the distance between the surfaces of the substrate and the sphere. The function λ(γ) was calculated by Brenner and is given in the form of a slowly converging infinite series.24 The function is well-approximated by a simplified form using a regression of the infinite-series results:25
 | (14) |
3.2 Simulation of double-layer repulsion and gravity
We start by simulating a charge-stabilized polystyrene (PS) colloidal particle in dynamic equilibrium close to a glass surface in an ionic solution, which corresponds to the experiment we introduced in Section 2. We assume there are only two dominant interactions: electrostatic repulsion and gravity. We disregard other close-range interactions such as van der Waals forces, which is a valid assumption for systems with low ionic strength and highly-charged surfaces.1 The screened electrostatic interaction is modeled by the DLVO theory using the Derjaguin approximation, which leads to a Yukawa potential.2,26,27 The total potential φ(z) is the sum of the screened electrostatic interaction and gravity:| φ(z) = Be−κz + Gz, | (15) |
Here, λB = e2/4πεkBT is the Bjerrum length, ε is the permittivity of the solvent, and σC and σG are the surface charge densities of the colloid and the glass, respectively.

In TIRM measurements, a reference potential height zr is introduced to eliminate B:
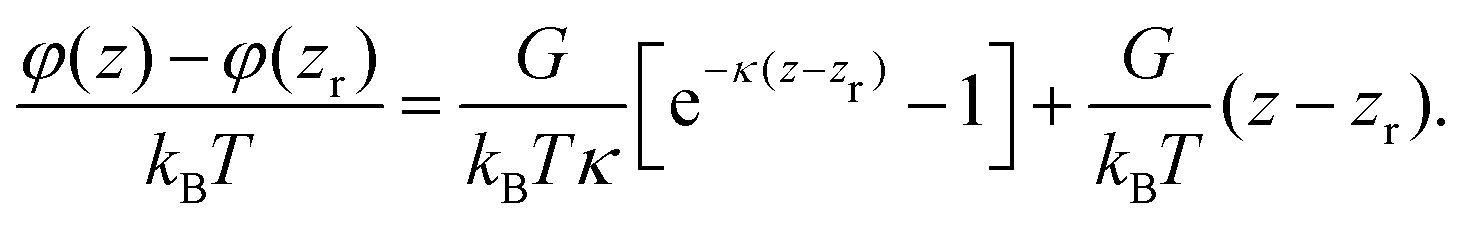 | (16) |
We use eqn (13) to generate the height trajectories zi of an 8 μm PS particle in a 0.5 mM NaCl solution, using a temporal step size of Δt = 0.2 ms (small enough to capture particle movement, see Fig. S2 in ESI†) and a total of 12.5 million steps (corresponding to a physical run time of about 40 minutes). The particle starting position is taken to be the distance where the potential reaches its theoretical minimum, zm = 133 nm. The simulated height trajectories are shown in Fig. S1 (ESI†).
The simulated vertical trajectories are used to generate light scattering intensity data in multiple steps. First, the mean number of classical counts nci, uncorrupted by shot noise, is generated using eqn (3) for each time step in the simulation
| nc = ΔtI0e−βzi, | (17) |
 | (18) |
| nj = Pois(ncj). | (19) |
As shown in Fig. 2(b), the data for φ(z) obtained from the simulated P(n) agrees well with both the experimental measurement and the analytical calculations from eqn (15), confirming that our simulation can quantitatively describe experimental data from TIRM measurements. In fact, for the parameters used here, the potential φ(z) obtained from the simulated P(n) is statistically indistinguishable from that obtained from P(nc). Under such circumstances, shot noise poses no problem for extracting the potential φ(z) using TIRM. As we shall see, however, this is not always the case.
3.3 Effect of shot noise on double-layer repulsion and gravity potentials
To evaluate the effect of shot noise on the potential profile obtained from TIRM measurements, we simulate the scattering intensities using integration times τ of 1 and 0.1 ms. For each value of τ, we construct histograms of the simulated scattering intensities in two ways, one with shot noise, P(n), and the other without, P(nc). The results are shown in Fig. 3(a) and (b) for τ of 1 and 0.1 ms, respectively. | ||
Fig. 3 Scattering intensity histograms from a simulation of an 8.0 μm-diameter PS sphere in 0.5 mM monovalent saline solution with a photon counting time interval τ of (a) 1 ms and (b) 0.1 ms. The solid orange and empty blue bars show histograms P(n) and P(nc) obtained with and without shot noise included, respectively. The solid black curves show the Poisson distributions when the means in panel (a) are = 450 and 880 counts and in panel (b) are = 45 and 88 counts. The widths of the Poisson distributions are indicated by vertical gray lines drawn at 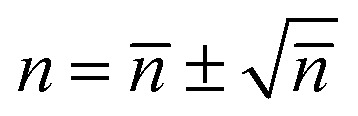 in panels (a) and (b). The potential curves are calculated with τ equal to (c) 1 ms and (d) 0.1 ms. The solid orange and empty blue circles show potential curves obtained with and without shot noise included, respectively. The dotted lines show the potential curve used in the simulation. in panels (a) and (b). The potential curves are calculated with τ equal to (c) 1 ms and (d) 0.1 ms. The solid orange and empty blue circles show potential curves obtained with and without shot noise included, respectively. The dotted lines show the potential curve used in the simulation. | ||
We then calculate the interaction potentials for the two cases, and compare them with analytical predictions from eqn (15), as shown in Fig. 3(c) and (d). When τ = 1 ms, the simulated potential is shown in Fig. 3(c) with and without shot noise are both in good agreement with the ideal analytical profile. The fitted Debye length from simulations with and without shot noise are 15.5 nm and 13.9 nm; while the fitted buoyant weights G are 0.156 pN and 0.157 pN, respectively. Both are reasonably close to the true values of the Debye length (13.7 nm) and the buoyant weight (0.152 pN) we input for the simulation. Indeed, this conclusion could be anticipated from Fig. 3(a), where the two histograms with and without shot noise, P(n) and P(nc), are nearly indistinguishable.
On the other hand, the effect of shot noise becomes significant when a smaller value of τ = 0.1 ms is used. As shown in Fig. 3d, the potential curve with shot noise is visibly broadened. Notably, the distortion of the potential profile in Fig. 3(d) is much more pronounced in the short-range electrostatic repulsion region than in the gravity-dominated region. The broadened shape yields a Debye length of 23.6 nm, significantly longer than the true Debye length of 13.7 nm. The fitted buoyant weight G = 0.157 pN is, however, close to the true value of 0.152 pN.
Two factors play important roles in determining the degree of distortion of the measured intensity histogram P(n) and the potential φ(z) derived from P(n): (1) the number of counts n per integration time τ and (2) the steepness (spatial gradient ∂φ/∂z) of the potential.
In Fig. 3a and b, we plot the intensity axis as the number of counts n per integration time τ in order to highlight the role of n in determining the shot noise. Because the maximum count rate (intensity) is the same in both cases, approximately 106 cts s−1, the number of counts per integration time is a factor of 10 lower for the case where τ = 0.10 ms compared to the case where τ = 1.00 ms. If there were no shot noise associated with photon counting, both data sets would result in statistically the same histogram of intensities. This is what is shown by the histograms of open blue bars in in Fig. 3a and b, which correspond to the probability distribution P(nc) introduced in eqn (9). Indeed, the potentials φ(z) determined from these two histograms both track the expected result, as shown by the blue data points in Fig. 3c and d, which follow the dotted lines indicating the theoretically-defined potential that was used in the Brownian dynamics simulation.
To emphasize the one-to-one correspondence between the average counts nc and z, which are related by eqn (8), we include a second horizontal axis in Fig. 3a and b that gives the values of z associated with nc axis.
Next, we consider the actual case where there is shot noise from photon counting. The histograms obtained in this case are shown as solid orange bars in Fig. 3a and b and correspond to the P(n), which is what is measured experimentally. In this case, the histograms for the two integration times of 1.0 ms and 0.1 ms differ dramatically, particularly for the higher intensities in each plot, which correspond to the smaller values of z where the potential φ(z) is steepest. The differences in the histograms obtained with and without photon counting shot noise can be understood by recalling eqn (9):

From Fig. 3a and b, we see that for a given value of n, P(n) is smeared out over the range spanned by Pτ(n;nc), or about  . Note, however, that what matters when comparing the histograms in Fig. 2a and b is not the width of Pτ(n;nc) but the relative width, which is
 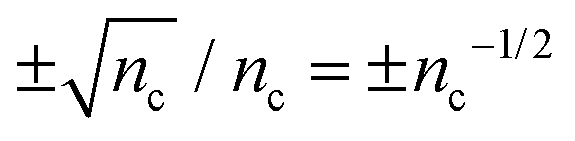 . Thus, as illustrated by Fig. 3a and b, the rounding effect of shot noise on P(n) is greater when the counts per integration time is smaller.
The other feature that plays an important role in the distortion of P(n) by shot noise is the gradient of the potential. A steep potential leads to a steep P(nc), which in turn is more readily rounded by the shot noise distribution Pτ(n;nc). This is evident in Fig. 3b where the width of the noise distribution Pτ(n;nc) is comparable to the width of the change in P(nc) for n ∼ 88.
For each plot, we pick out two values of particle height ![[z with combining macron]](https://www.rsc.org/images/entities/i_char_007a_0304.gif) , 110 nm, and 177 nm, and show using solid black lines the Poisson distribution for the corresponding value of nc from eqn (7). These curves give the distribution of values of n that are measured in a TIRM experiment for a particle at a single height z. For example, in Fig. 3a, for = 177 nm (label A), nc = 450 cts per integration time, for which the Poisson distribution has a width of
, 110 nm, and 177 nm, and show using solid black lines the Poisson distribution for the corresponding value of nc from eqn (7). These curves give the distribution of values of n that are measured in a TIRM experiment for a particle at a single height z. For example, in Fig. 3a, for = 177 nm (label A), nc = 450 cts per integration time, for which the Poisson distribution has a width of 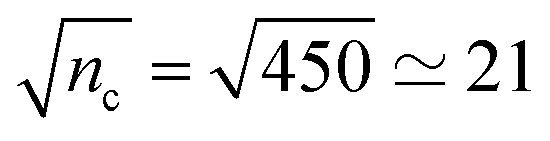 . According to eqn (11), this leads to an uncertainty in z of ±4.7 nm, where β−1 = 100 nm. Similarly, in Fig. 3b, for = 177 nm (label A), nc = 45 cts per integration time, for which the Poisson distribution has a width of
 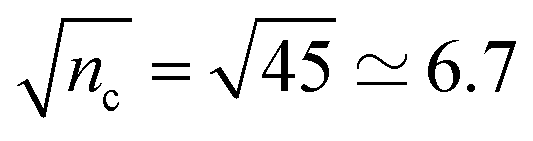 . According to eqn (11), this leads to an uncertainty in z of ±15 nm, where β−1 = 100 nm. The relative uncertainty Δnc/nc = nc−1/2 is much larger when nc is small, which is also reflected in the relative widths of the Poisson distributions in Fig. 3a and b.
Performing the same analysis for = 110 nm (label B), where nc = 880 and 88 cts per integration time, respectively, in Fig. 3a and b, we obtain uncertainties in z of 3.4 nm and 10.7 nm for the two cases.
The uncertainty in position leads to an uncertainty in the potential, which can be roughly estimated by
 | (20) |
 . One can see that the potential gradient ∂φ/∂z, or the force, plays a critical role in determining how strongly photon shot noise can affect the derived potential. For example, in the gravity-dominated region (location A) with τ = 0.1 ms where the potential changes very slowly, the height uncertainty is as large as 15 nm, but the noise-corrupted potential curve still shows good agreement with the theoretical prediction. By contrast, in the sharp electrostatic repulsion region (location B), where the potential changes quickly, the height uncertainty is about 10.7 nm, but the noise-corrupted intensities do not provide a faithful representation of the potential shape, leading to the broadening of the resultant potential profile.
To further demonstrate the effect of potential sharpness on measurement tolerance against photon shot noise, we increase the salt concentration to 140 mM in the simulation, creating a much sharper potential in the double-layer repulsion region with a Debye length of 0.82 nm. Fig. 4 shows the effect of shot noise on the intensity histograms when τ is 1 ms and 0.1 ms in panels (a) and (b), respectively. In this case, the potential is so sharp that neither choice of integration times provides a completely faithful measurement of the interaction potential. Nevertheless, using the shorter integration time of τ = 0.1 ms yields significantly poorer results than using τ = 1 ms, as shown in Fig. 4c and d.
 | ||
Fig. 4 Scattering intensity histograms from a simulation of an 8.0 μm-diameter PS sphere in 140 mM monovalent saline solution with a photon counting time interval τ of (a) 1 ms and (b) 0.1 ms. The solid orange and empty blue bars show histograms P(n) and P(nc) obtained with and without shot noise, respectively. The solid black curves show the Poisson distributions when the means in panel (a) are = 600 and 1080 counts and in panel (b) are = 60 and 108 counts. The widths of the Poisson distributions are indicated by vertical gray lines drawn at  in panels (a) and (b). The potential curves are calculated with τ equal to (c) 1 ms and (d) 0.1 ms. The solid orange and empty blue circles show potential curves obtained with and without shot noise included, respectively. The dotted lines show the potential curve used in the simulation. in panels (a) and (b). The potential curves are calculated with τ equal to (c) 1 ms and (d) 0.1 ms. The solid orange and empty blue circles show potential curves obtained with and without shot noise included, respectively. The dotted lines show the potential curve used in the simulation. | ||
In Fig. 5, we summarize the fitting parameters extracted from our simulated TIRM data for integration time intervals spanning the range from τ = 0.025 ms to 1000 ms for the two monovalent salt concentrations considered above: 0.5 mM, which gives a soft repulsive potential with κ−1 = 13.7 nm, and 140 mM, which gives a hard repulsive potential with κ−1 = 0.82 nm.
 | ||
| Fig. 5 Simulated interaction parameters of an 8 μm-diameter PS sphere in (a and c) 0.5 mM and (b and d) 140 mM monovalent salt. (a and b) Fitted buoyant weight G and (c and d) Debye length κ−1 from potential profiles simulated with different τ. Blue circle are fitted parameters without considering of photon counting uncertainties. Dotted lines are the theoretical values of the expected parameter. (d) Insets in (c) and (d) show the same respective plots in y-log scale. | ||
Fig. 5a and b show that the buoyant weight G is well fit over a broad range of τ. This reflects the fact that the potential does not vary sharply in the large-distance (z ≳ 30 nm) gravity-dominated part of the potential from which the fitted value of G is extracted.
By contrast, Fig. 5c shows that the Debye length κ−1 is well fit only over a relatively narrow range, 1 ms < τ < 25 ms for a soft repulsive potential with κ−1 = 13.7 nm while Fig. 5d shows that κ−1 is not well fit at all for a hard repulsive potential with κ−1 = 0.82 nm, except near τ = 30 ms where different offsetting errors, which we discuss next, accidentally cancel.
The errors in the fitted values of G and κ−1 for the smaller values of τ arise from the photon counting shot noise, which broadens the intensity distribution N(I) and thus broadens the potential. This decreases the fitted values of G and increases the fitted values of κ−1. The errors in the fitted values of G and κ−1 for the larger values of τ arise from particles diffusing too far—particle dynamics, which suppresses the wings of the intensity distribution N(I), making the potential sharper, increasing the fitted value of G, and decreasing the fitted value of κ−1.
As a check on our simulations, potentials extracted from both simulated and real experimental data are compared for the case κ−1 = 13.7 nm in Fig. S5 in the ESI,† for a wide range of integration times τ. We find that the simulated data sets agree very well with real experimental data and are fully consistent with the fitting parameters shown in Fig. 5a and c.
The data sets analyzed in Fig. 5 serve as a cautionary note for interpreting the potentials obtained in TIRM experiments. Thus, one may ask how to determine if the potentials obtained using TIRM are artificially broadened or narrowed. A simple way to check if the photon shot noise is broadening the potentials is to plot the Poisson distributions on the intensity histograms and compare their width to the slope of N(I) as we have done in Fig. 3a, c and 4a, c. While this is helpful in determining whether τ is too small such that shot noise is broadening N(I), it does not aid in determining if τ is too long so that particle dynamics are narrowing N(I). The best results are obtained when these two regimes of shot noise and dynamics-limited data are well separated, as they are in Fig. 5a and c when the potential is relatively soft. In this case, there is a range of values of τ that give nearly identical results; here that occurs for 1 ms < τ < 25 ms.
3.4 Effect of shot noise on measurement of potential wells: Morse potential
In this section, we investigate the effect of shot noise on the measurement of a short-range attractive interaction. Such potentials are common in interacting particle systems and include the depletion interaction,28 attractive electrostatic,29,30 Casimir,9 and the interaction between DNA-coated colloids.10,31 The range of these attractions goes from about a nanometer to hundreds of nanometers.To model a generic attractive interaction, we choose a Morse potential as our model potential, as it is frequently used to describe attractive interactions between colloidal particles:32,33
| φ(z) = ε[e−2(z−z0)/a − 2e−(z−z0)/a]. | (21) |
Consider a colloidal sphere that has close-range attractive interactions with the glass surface. Its potential energy φ(z) can be written a combination of the Morse potential and gravitation:
| φ(z) = ε[e−2(z−z0)/a − 2e−(z−z0)/a] + Gz. | (22) |
For TIRM, we need to choose a reference height zr, which we take to be z0. With this choice,
| φ(z) − φ(z0) = ε[e−2(z−z0)/a − 2e−(z−z0)/a + 1] + G(z − z0), | (23) |
Using the Brownian dynamics simulation method introduced in Section 3.1, we simulate the height trajectories of a 5 μm PS particle with a Morse potential energy profile. Fig. 6 shows the Morse potential simulation results with a = 10 nm and ε = 5kBT. Eqn (22) is plotted as a gray dotted line in Fig. 6.
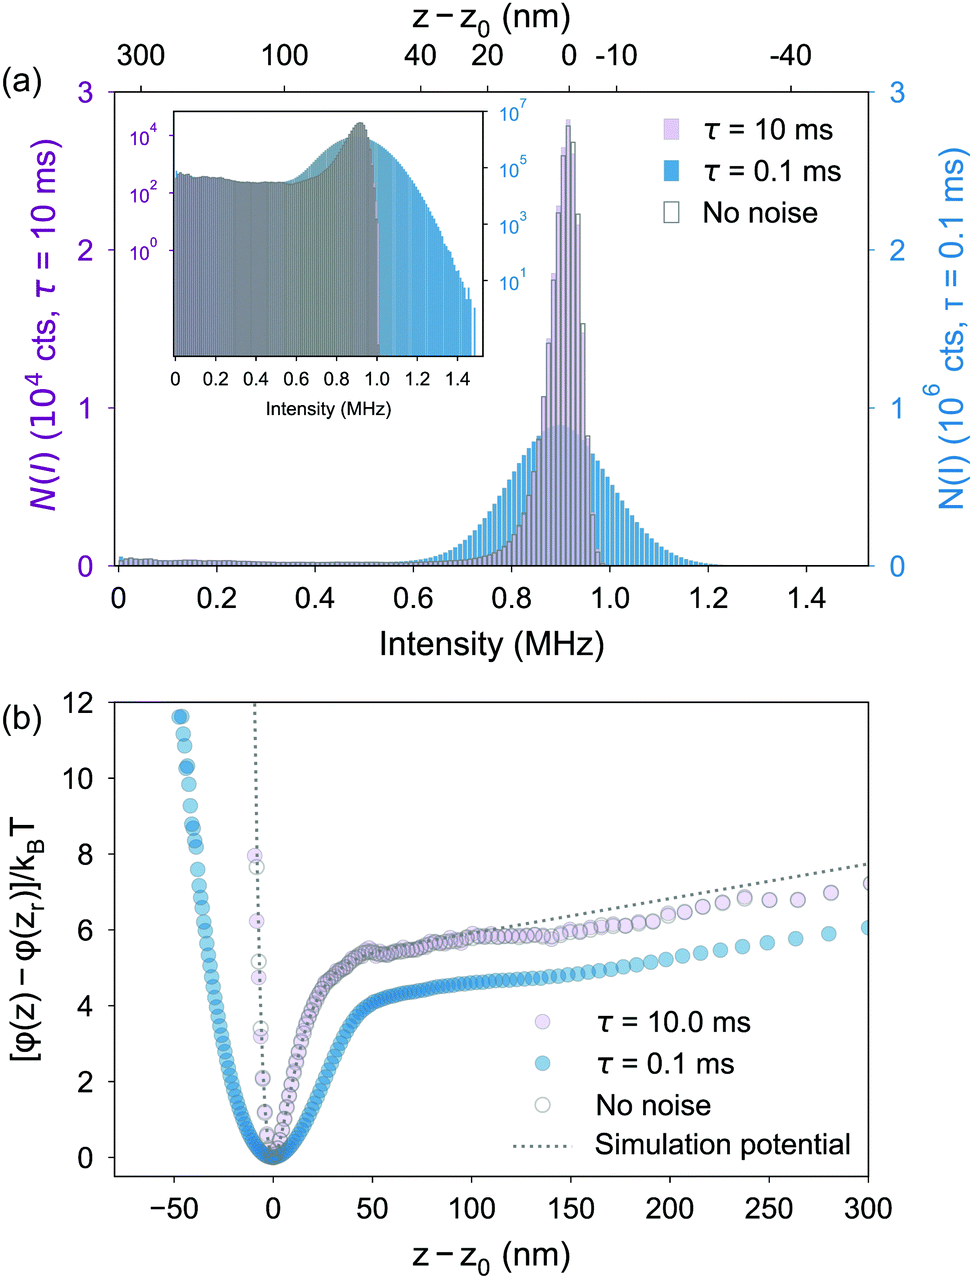 | ||
| Fig. 6 (a) Histogram of simulated scattered intensities of a 5 μm-diameter PS particle with Morse potential profile (ε = 5kBT, a = 10 nm, z0 = a). Step size is 5 μs with 5 × 10⁸ steps. Imax = 1 MHz. Grey bars are intensities from original simulated trajectories without account for shot noise or photon counting interval (effectively τ = Δt). Blue, purple bars correspond to intensities with τ being 0.1 ms and 10 ms respectively. Inset shows the same plot in y-log scale. (b) Potential curves corresponding to the conditions in (a) when τ = 0.1 ms (blue), 10 ms (purple) and 5 μs (grey, no shot noise). Potential minimum is placed at 0kBT and height at 0 nm. | ||
We carry out simulations using different photon-counting integration time intervals τ. Fig. 6 shows results for two values of τ: 0.1 ms and 10 ms.
When τ = 10 ms, the light scattering intensity distribution N(I) is essentially indistinguishable from what one would obtain in the absence of photon counting shot noise, as can be seen in Fig. 6a. In this case, the potential obtained from the usual TIRM analysis corresponds closely to the true potential, as can be seen in Fig. 6b.
When τ is reduced to 0.1 ms, however, the intensity distribution N(I) is blurred considerably, particularly when the particle is in the vicinity of the potential minimum, as shown in Fig. 6a. As a consequence, the potential obtained from the TIRM analysis is broadened considerably. The depth of the potential is also reduced.
To better quantify the effect of τ on potential well measurements, we simulate Morse potentials with varying widths, taking a as 1, 2, 5, 10, 15, and 20 nm. For each value of a, we use different values τ to simulate different TIRM data sets from which we extract a measured potential. We characterize the potential well inferred from a TIRM measurement by two parameters: the well depth and width. To characterize the well depth and width, we first subtract the contribution from gravity, G(z − z0), from the potential (see Fig. S6 in ESI†). We define the characteristic width as the full width at half maximum (FWHM).
Fig. 7a shows the potential width (FWHM) measured from the simulated TIRM data as a function of τ for different values of a. The gray horizontal dotted lines indicate the true FWHM = 1.763a for each value of the width parameter a. For each of the wider Morse potentials with a = 20, 15, and 10 nm, there is a clear plateau over a range of integration times τ near the expected width. One can discern evidence of an incipient plateau for a = 5 nm, but all evidence of a plateau vanishes for the smaller values of a. Nevertheless, even below a = 5 nm, the measured width is different for different values of a for a given choice of τ, indicating that even in this limit TIRM can be expected to follow changes in the width of the potential.
 | ||
| Fig. 7 Simulated 5kBT deep Morse potentials with different a and the corresponding apparent potential width (FWHM) (a) and depth (b) when using different τ. Horizontal colored dotted lines in (a) and gray dashed line in (b) indicate the theoretical width or depth for the Morse potentials. | ||
Fig. 7b shows the simulated potential depth obtained using different values of τ. Here we see that the correct potential depth is obtained only for a somewhat narrower range of τ centered around a few milliseconds, where there is a mild plateau, again for wells wider than about 5 nm. Thus, correct measurements of the well depth and width can be obtained, but only for a somewhat narrow range of τ. The proper range of τ can be identified by the existence of a plateau.
4 Conclusions
In this paper, we establish the critical role of shot noise and intensity integration time τ in TIRM measurements of colloidal interaction potentials. Sharp potential profiles, e.g. steric repulsion,6 depletion,7 strong double-layer repulsion20 and short-range attraction,10,34 are particularly prone to corruption by shot noise. Shot noise should be taken into consideration when interpreting such measured potential profiles. While shot noise cannot be removed by deconvolution, the expected signal-to-noise ratio can be experimentally controlled by selecting the photon counting time interval.The choice of photon counting time interval is a trade-off between minimizing shot noise and preserving temporal resolution. For smaller values of τ, the temporal resolution of the simulated measurement is sufficient to resolve the particle movement. However, small τ increases the shot noise and tends to blur the sharp features of a potential curve. For large τ, shot noise is reduced due to the increased number of photons counted. However, the measured scattering intensity is averaged over large particle displacements, which can distort the potential profiles for excessively large τ. If spatial gradients ∂φ/∂z in the potential are not too large, there can be a regime of intermediate values of τ for which the intensity distribution N(I) is accurately measured without significant distortion. In this case, the potential φ(z) can be faithfully measured by TIRM. Even in cases where the photon counting shot noise cannot be reduced to the point that it does not broaden the sharp features in φ(z), useful information can be extracted about the potential. In particular, changes in φ(z) due to changing sample conditions (temperature, salt concentration, etc.) can be readily discerned.
Conflicts of interest
There are no conflicts to declare.Acknowledgements
This research was primarily supported by Department of Energy (DOE) DE-SC0007991 for the initiation and design of the experiments. Additional funding was supplied by the US Army Research Office under award number W911NF-17-1-0328.Notes and references
- D. C. Prieve, Adv. Colloid Interface Sci., 1999, 82, 93–125 CrossRef CAS.
- D. C. Prieve and N. A. Frej, Langmuir, 1990, 6, 396–403 CrossRef CAS.
- S. G. Bike, Curr. Opin. Colloid Interface Sci., 2000, 5, 144–150 CrossRef CAS.
- M. A. Bevan and D. C. Prieve, Langmuir, 2000, 16, 9274–9281 CrossRef CAS.
- X. Gong, Z. Wang and T. Ngai, Chem. Commun., 2014, 50, 6556–6570 RSC.
- D. Kleshchanok and P. R. Lang, Langmuir, 2007, 23, 4332–4339 CrossRef CAS PubMed.
- T. D. Edwards and M. A. Bevan, Langmuir, 2012, 28, 13816–13823 CrossRef CAS PubMed.
- C. July, D. Kleshchanok and P. Lang, Eur. Phys. J. E, 2012, 35, 1–8 CrossRef PubMed.
- C. Hertlein, L. Helden, A. Gambassi, S. Dietrich and C. Bechinger, Nature, 2008, 451, 172–175 CrossRef CAS PubMed.
- S. Merminod, J. R. Edison, H. Fang, M. F. Hagan and W. B. Rogers, Nanoscale, 2021, 13, 12602–12612 RSC.
- A. R. Clapp, A. G. Ruta and R. B. Dickinson, Rev. Sci. Inst., 1999, 70, 2627–2636 CrossRef CAS.
- A. R. Clapp and R. B. Dickinson, Langmuir, 2001, 17, 2182–2191 CrossRef CAS.
- L. Helseth and T. M. Fischer, J. Colloid Interface Sci., 2004, 275, 322–327 CrossRef CAS PubMed.
- N. A. Frej and D. C. Prieve, J. Chem. Phys., 1993, 98, 7552–7564 CrossRef CAS.
- R. J. Oetama and J. Y. Walz, J. Colloid Interface Sci., 2005, 284, 323–331 CrossRef CAS PubMed.
- H. Chew, D.-S. Wang and M. Kerker, Appl. Opt., 1979, 18, 2679 CrossRef CAS PubMed.
- L. Helden, E. Eremina, N. Riefler, C. Hertlein, C. Bechinger, Y. Eremin and T. Wriedt, Appl. Opt., 2006, 45, 7299–7308 CrossRef PubMed.
- P. C. Odiachi and D. C. Prieve, J. Colloid Interface Sci., 2004, 270, 113–122 CrossRef CAS PubMed.
- D. S. Sholl, M. K. Fenwick, E. Atman and D. C. Prieve, J. Chem. Phys., 2000, 113, 9268–9278 CrossRef CAS.
- M. Nayeri, Z. Abbas and J. Bergenholtz, Colloids Surf., A, 2013, 429, 74–81 CrossRef CAS.
- J. L. Bitter, G. A. Duncan, D. J. Beltran-Villegas, D. H. Fairbrother and M. A. Bevan, Langmuir, 2013, 29, 8835–8844 CrossRef CAS PubMed.
- L. Mandel, Proc. Phys. Soc. London, 1959, 74, 233–243 CrossRef.
- D. L. Ermak and J. A. McCammon, J. Chem. Phys., 1978, 69, 1352–1360 CrossRef CAS.
- H. Brenner, Chem. Eng. Sci., 1961, 16, 242–251 CrossRef CAS.
- M. A. Bevan and D. C. Prieve, J. Chem. Phys., 2000, 113, 1228–1236 CrossRef CAS.
- E. J. W. Verwey, J. T. G. Overbeek and K. Van Nes, Theory of the stability of lyophobic colloids: the interaction of sol particles having an electric double layer, Elsevier Publishing Company, 1948 Search PubMed.
- H.-H. von Grünberg, L. Helden, P. Leiderer and C. Bechinger, J. Chem. Phys., 2001, 114, 10094–10104 CrossRef.
- D. Rudhardt, C. Bechinger and P. Leiderer, Phys. Rev. Lett., 1998, 81, 1330 CrossRef CAS.
- M. E. Leunissen, C. G. Christova, A.-P. Hynninen, C. P. Royall, A. I. Campbell, A. Imhof, M. Dijkstra, R. van Roij and A. van Blaaderen, Nature, 2005, 437, 235–240 CrossRef CAS PubMed.
- T. Hueckel, G. M. Hocky, J. Palacci and S. Sacanna, Nature, 2020, 580, 487–490 CrossRef CAS.
- W. B. Rogers and J. C. Crocker, Proc. Natl. Acad. Sci. U. S. A., 2011, 108, 15687–15692 CrossRef CAS.
- J. P. Doye, D. J. Wales and R. S. Berry, J. Chem. Phys., 1995, 103, 4234–4249 CrossRef CAS.
- N. Bou-Rabee and M. C. Holmes-Cerfon, SIAM Rev., 2020, 62, 164–195 CrossRef.
- S. L. Eichmann, G. Meric, J. C. Swavola and M. A. Bevan, Langmuir, 2013, 29, 2299–2310 CrossRef CAS.
Footnote |
| † Electronic supplementary information (ESI) available. See DOI: 10.1039/d1sm01587g |
| This journal is © The Royal Society of Chemistry 2022 |