
 Open Access Article
 This Open Access Article is licensed under a Creative Commons Attribution-Non Commercial 3.0 Unported Licence
On the role of softness in ionic microgel interactions†
Maxime J.
Bergman‡
 *a,
Sofi
Nöjd
a,
Priti S.
Mohanty§
a,
Niels
Boon
a,
Jasper N.
Immink¶
a,
J. J. Erik
Maris||
a,
Joakim
Stenhammar
a and
Peter
Schurtenberger
*ab
*a,
Sofi
Nöjd
a,
Priti S.
Mohanty§
a,
Niels
Boon
a,
Jasper N.
Immink¶
a,
J. J. Erik
Maris||
a,
Joakim
Stenhammar
a and
Peter
Schurtenberger
*ab
aPhysical Chemistry, Department of Chemistry, Lund University, SE-22100 Lund, Sweden. E-mail: maxime.j.bergman@gmail.com; peter.schurtenberger@fkem1.lu.se
bLund Institute for advanced Neutron and X-ray Science (LINXS), Lund University, Lund, Sweden
First published on 29th October 2021
Abstract
Thermoresponsive microgels are a popular model system to study phase transitions in soft matter, because temperature directly controls their volume fraction. Ionic microgels are additionally pH-responsive and possess a rich phase diagram. Although effective interaction potentials between microgel particles have been proposed, these have never been fully tested, leading to a gap in our understanding of the link between single-particle and collective properties. To help resolve this gap, four sets of ionic microgels with varying crosslinker density were synthesised and characterised using light scattering techniques and confocal microscopy. The resultant structural and dynamical information was used to investigate how particle softness affects the phase behaviour of ionic microgels and to validate the proposed interaction potential. We find that the architecture of the microgel plays a marked role in its phase behaviour. Rather than the ionic charges, it is the dangling ends which drive phase transitions and interactions at low concentration. Comparison to theory underlines the need for a refined theoretical model which takes into consideration these close-contact interactions.
1 Introduction
Thermoresponsive poly-N-isopropylacrylamide (PNIPAM) hydrogels are crosslinked, water-swollen polymer networks which display a pronounced deswelling behaviour as the solvent quality for PNIPAM sharply decreases upon heating beyond a threshold Volume Phase Transition Temperature (VPTT) at 32 °C.1–3 Thermoresponsive microgels are colloidal-sized hydrogels, which possess the same properties but with a faster swelling response. The conventional one-pot synthesis leads to microgels with a densely crosslinked core and a loosely crosslinked corona decorated with dangling ends, due to the high reactivity of the crosslinker.2,4–6Functional groups can be co-polymerised into the microgel. Depending on the nature of the co-monomer, the resultant microgel structure and properties can change markedly.7–9 For example, acrylic acid (AAc) as a co-monomer is distributed homogeneously throughout the particle,8 leading to internal repulsion across the entire polymer network. The repulsion between the included acid groups is counterbalanced by the elasticity of the polymer network.10–13 Since the final size of the ionic microgel results from an equilibrium between these two governing forces, it is highly responsive to changes in temperature,14 pH,15 and salinity.16
Neutral microgels have been shown to have an interaction potential that can be accurately modeled using a soft repulsive Hertzian interaction potential for the liquid regime, which captures the elastic response of the network upon contact.17–19 Because of the additional charged moieties residing within the ionic microgel, its Hertzian interaction needs to be supplemented by a long-ranged electrostatic interaction in the form of a screened Coulomb or Yukawa potential.10,20,21 The long tail from the electrostatic contribution was reported to be dominant at low particle density.22,23 At high concentrations, where particle–particle contact cannot be avoided, the Hertzian soft repulsion sets in.10,20,21,24 An elaborate model has been proposed which combines the described electrostatic–steric interaction potential with a macroion approach to realistically model the penetrable microgel network.10,20,21,25
Nevertheless, the model has yet to be thoroughly tested, and we therefore carry out a systematic study across the entire phase diagram for ionic microgels with different crosslinker density, obtained via confocal microscopy. Light scattering experiments underline how dangling ends unfold and extend under deionised conditions. Their length appears inversely proportional to crosslinker density. We link the appearance of long dangling ends for low crosslinker microgels to their difficulty to crystallize. Theoretical predictions for the pair correlation function g(r) consistently underestimate the first peak height at lowest dilution in all cases, signaling an overlooked close-contact interaction contribution. Our results call for more refined interaction potential models, which explicitly consider dangling end contributions.
2 Experimental section
2.1 Experimental
Structural and dynamical data were obtained using a confocal laser scanning microscope (Leica DMI6000 with a SP5 tandem scanner in the resonant mode, Leica, Germany) at an excitation wavelength of 543 nm and by using a 100× immersion oil objective with numerical aperture 1.4. The microscope is outfitted with a temperature regulated heating box, allowing for precise control of the temperature within a range of 0.2 °C. All data was acquired at 20 °C. Data were collected at least 5 μm into the sample to minimise wall effects. To minimise ionic contamination the microscope slides and cover slips used were cleaned using ethanol and Milli-Q water prior to use, however no ion-exchange resins were added to the glass slide to avoid salt gradients. The samples were measured directly after preparation. For M1.5 and M3, samples were also annealed by leaving them to equilibrate at elevated temperatures and slowly reducing temperatures back to 20 °C. Because dynamics are too fast in the liquid regime to create xyz-stacks, xyt-series (6 × 4000 frames with dimensions 512 × 256 pixels or 28.85 × 12.9 μm) were obtained at a frame rate of 27.5 frames per s. In the arrested state, both xyz-series (5–10 z-stacks of 512 × 512 pixels) and xyt-series (1 × 5000 frames, 512 × 256 pixels) were acquired. The pair correlation function g(r) and mean squared displacement (MSD) were calculated from each video via quantitative image analysis using the standardized procedures first reported by Crocker and Grier.26 For arrested samples, the experimental number density was also determined from particle tracking.
2.2 Theory
| Vtot,HY(r) = VH(r) + Vel(r), | (1) |
 | (2) |
For the electrostatic contribution Vel(r), we will consider the case of overlapping particles (r ≤ σeff) and non-overlapping particles (r > σeff) separately. For overlapping particles, Vel(r) becomes20
 | (3) |
 | (4) |
For non-overlapping distances, a Yukawa potential is recovered:
 | (5) |
| Vtot,HYR(r) = VH(r) + Vel(r) + Vramp(r) | (6) |
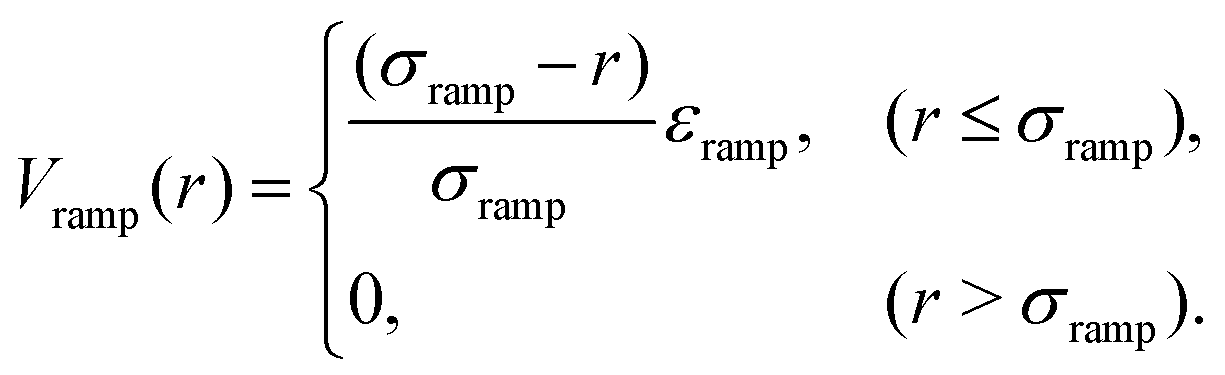 | (7) |
3 Results and discussion
3.1 Crosslinker effect on dangling end length
Our study sets out to investigate the phase diagram of ionic microgels as a function of crosslinker density, and to link the experimental local structure to theoretical predictions. The effective microgel radius Reff is a key parameter needed to establish a connection between observed and predicted properties, as it directly affects the volume fraction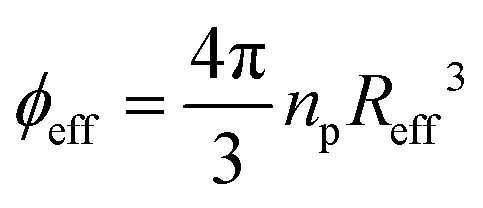 , with np the number density. We therefore start by characterising the morphology of the microgels with dynamic light scattering (DLS) to gain insight in their structural properties. Previous research has shown how solvent conditions affect network swelling: if charges on the microgel network are reduced or screened (i.e. via low pH or high ionic strength), the ionic microgel resembles its neutral counterpart. However, in the presence of deionising resin, the dangling ends of the microgel network will extend into the solvent, which can increase the hydrodynamic radius RH by several hundred nanometers compared to the charge neutral case.6,28,32,33 We obtain the size of the microgels in both conditions, so that we have a direct estimate for the dangling end ‘shell’ of the ionic microgels.
The results for 1.5, 3, 5 and 10 mol% crosslinked ionic microgels are shown in Fig. 1a. For ease of reading, we will refer to these batches as M1.5, M3, M5 and M10 in the rest of this study. A low crosslinker content leads to large and soft microgels with long dangling ends: M1.5 increases 250% in volume when its dangling ends are extended (equivalent to 52% increase in its radius).28 On the other hand, a high crosslinker content leads to stiffer microgels with shorter dangling ends: the particle volume of M10 increases only 150% upon dangling end unfolding (or 36% in radius), and the absolute size is much smaller compared to the flexible microgels.
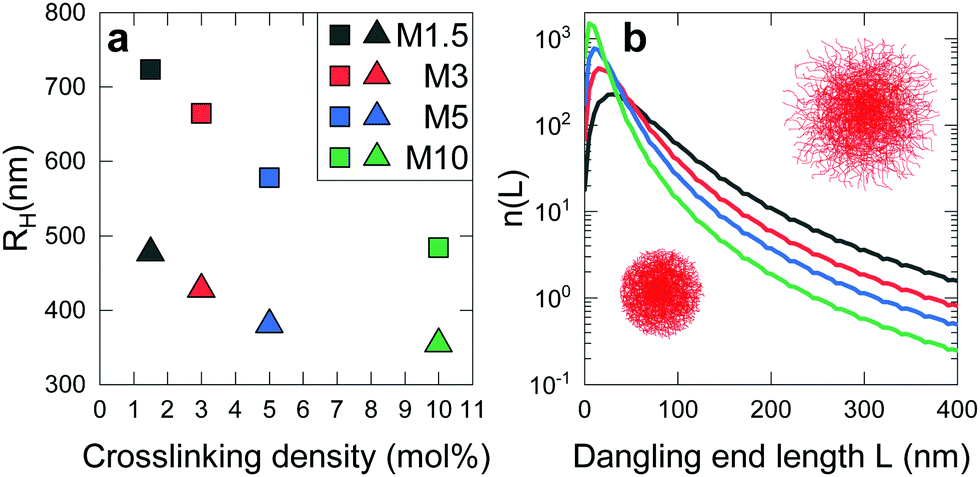 | ||
| Fig. 1 Characterisation of microgel size via DLS. The colour legend indicates crosslinker density and applies to both panels. (a) RH at 20 °C as a function of cross-linker density at pH 3 (triangles) and under de-ionized conditions (squares, referred to as RH in the main text). Symbol size is larger than standard deviation. (b) Calculated number of dangling ends n(L) as function of length L. | ||
To confirm this experimental observation, we model the generation of dangling polymer ends during synthesis following the approach in ref. 6. The premise of this model is that all polymers, which become part of the crosslinked microgel network, grow as loose polymer strands during synthesis. The vast majority of growing chains eventually encounter a crosslinker species which locks them with both ends to the network that consists of other chains. Subsequently, a new polymer strand continues to grow from that crosslinker. However, at the end of the synthesis process, some chains will be attached to the network with only one end: these are the dangling ends. By analysing how monomers and crosslinkers get consumed at different rates during synthesis, and assuming that the growing polymer strands take up a random-coil configuration inside the growing particle, one can then estimate a contour-length distribution of dangling ends. Both the ratio and absolute numbers of monomers and crosslinkers affect the character of the resultant dangling ends. Generally, the addition of more crosslinkers leads to the formation of a more fine-meshed network during synthesis, and therefore more dangling ends. At the same time, however, the formation of long dangling ends becomes much less likely. Fig. 1b shows calculated distributions of contour lengths n(L) on the y-axis, such that  , where N is the total number of dangling ends. The latter figure shows that it, indeed, is expected that M10 possesses the largest number of short dangling ends. At the same time, very loosely crosslinked particles such as M1.5 will have many more long dangling ends. Specifically, the number of long chains seems to scale approximately linearly with the inverse crosslinker concentration. It has been shown by Scheutjens et al.34 that the longer chains will determine the hydrodynamic size of the particle, which will be further amplified by their porcupine-like configurations due to electrostatic interactions. Our calculations therefore, support the observations shown in Fig. 1a, and indicate that the hydrodynamic size at lower crosslinker concentrations is most affected by dangling ends.28
3.2 Effect of crosslinker content on phase transitions
Working towards the comparison between experimental and predicted local structure, we have thus far gained insight on the different morphologies of the ionic microgels. We now shift focus towards results from confocal laser scanning microscopy (CLSM), which reveal the structural and dynamical properties for each investigated state point. Before comparing experimental and theoretical results, in this section we first explore the experimental phase diagram of the ionic microgels, and how the mechanisms underlying phase transitions are connected to the particle morphology.A broad concentration series under deionised conditions was measured for each crosslinker density, resulting in a wide range of structural and dynamical correlations. Fig. 2 displays the obtained pair correlation functions (g(r)s) and mean squared displacements (MSDs) per crosslinker type. Additional information can be found in Table S1 (ESI†).
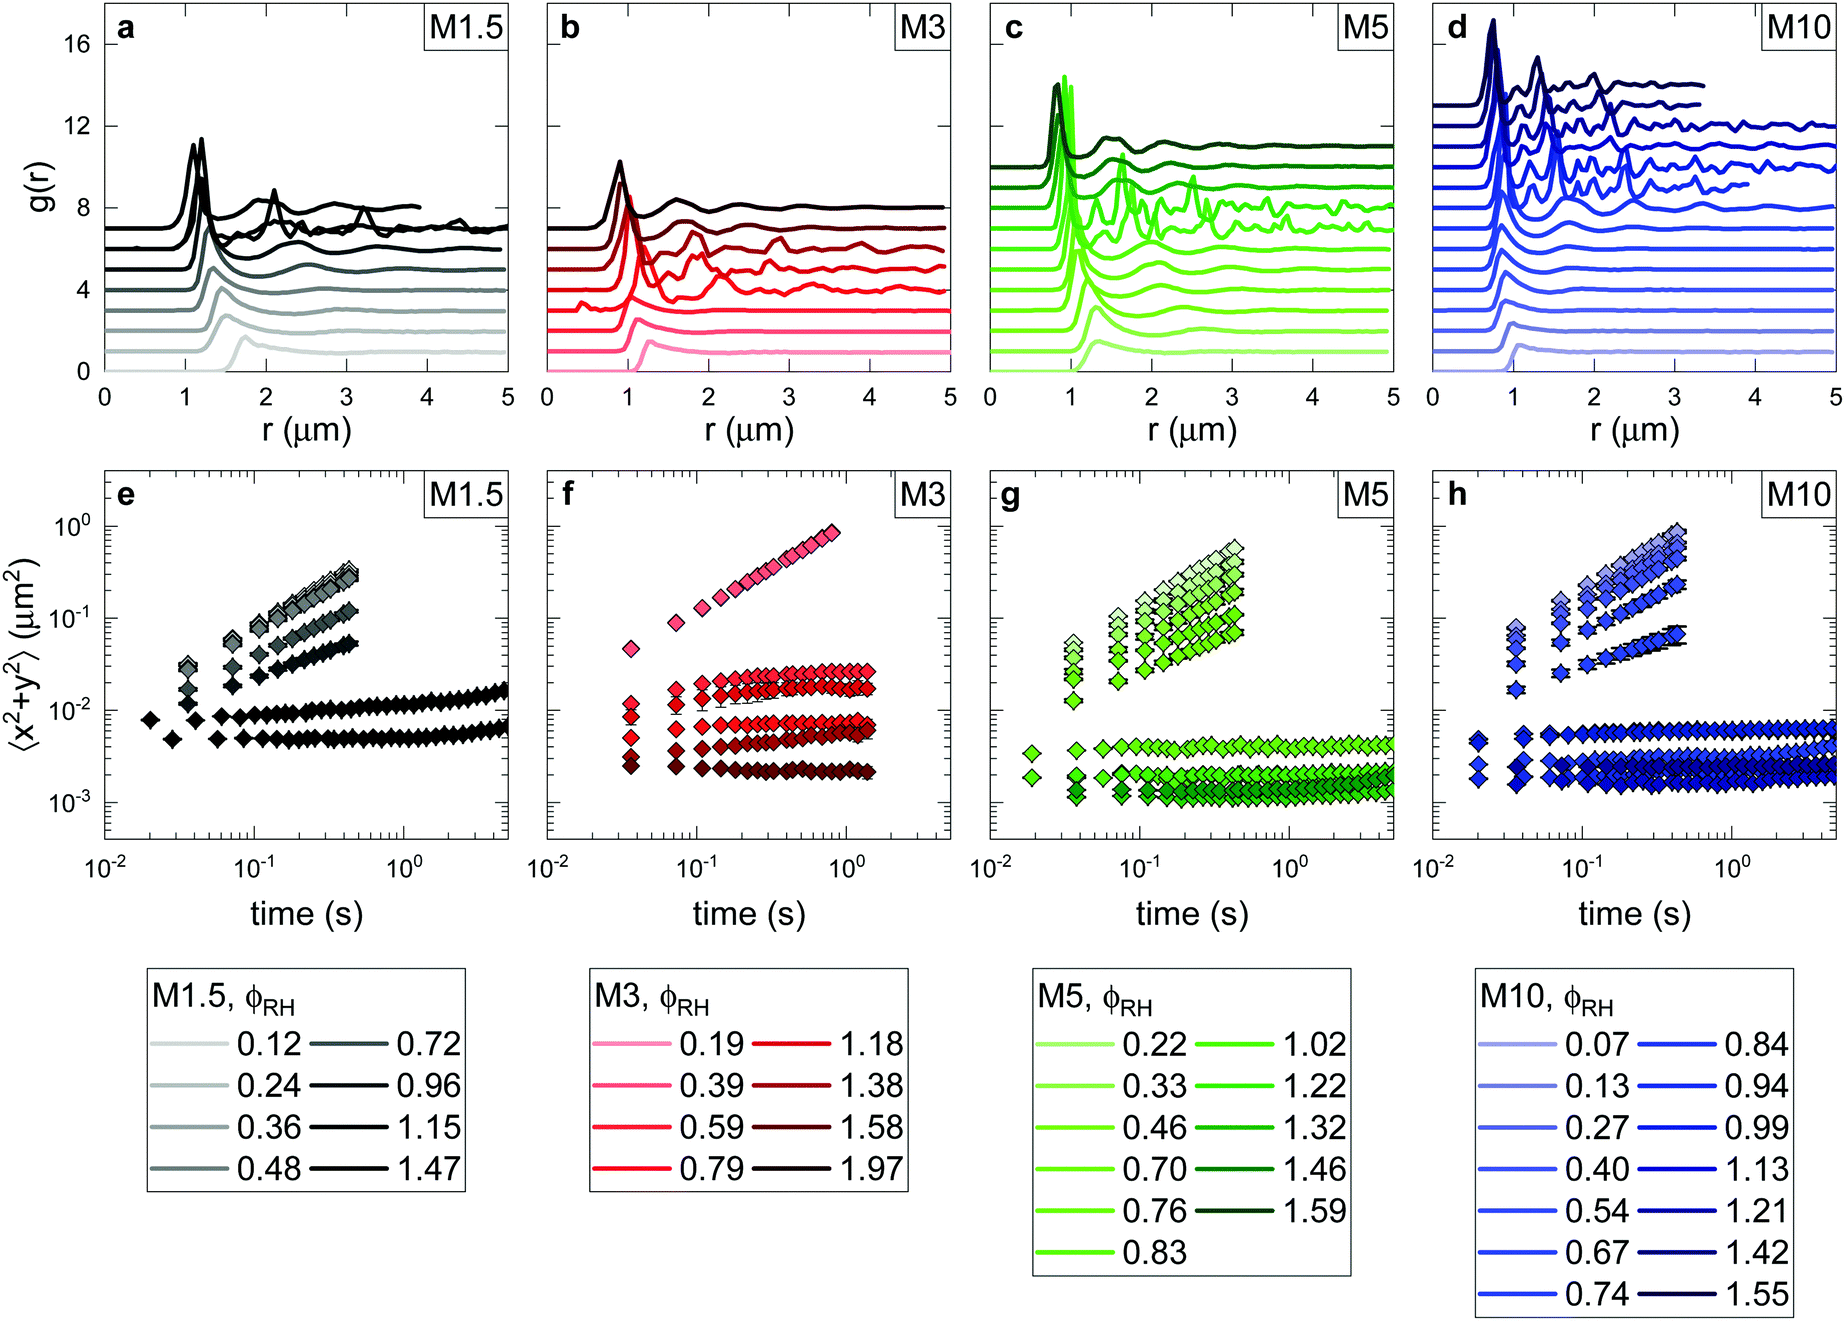 | ||
| Fig. 2 Experimental structural and dynamical information as a function of concentration for ionic microgels with varying crosslinker density. Samples are colour coded from light to dark, going from dilute to dense samples. Additional information on state points (wt%, number density np, volume fraction ϕRH) can be found in Table S1 (ESI†). (a–d) Pair correlation functions g(r)s determined for the entire concentration range measured for M1.5 (a), M3 (b), M5 (c) and M10 (d) crosslinker content. Graphs are offset in y for clarity. (e–h) Mean squared displacements (MSDs) calculated for the same state points. | ||
With increasing particle concentration, increased structural correlations and a peak shift to smaller r can be seen, as a consequence of the increased number density (Fig. 2a–d, each panel corresponding to one crosslinker density). The shapes of the g(r)s reveal that several different phases are traversed; from a liquid at low concentrations, via a crystalline phase characterised by distinct peaks, to an amorphous, glassy phase at the highest concentrations. Although the structural signature of a glass phase is still under debate,17 clear evidence for dynamical arrest can be seen in Fig. 2e–h, as microgels in the crystal and glassy phase display minimal local motion only. Note also that the amorphous glass is only found for the three lower crosslinker densities, for M10 the crystal phase persists up to the highest concentration investigated.
This information allows us to construct an experimental phase diagram. We use the effective volume fraction based on the hydrodynamic radius at dilute and deionised conditions:  with np the experimental number density. To determine np, the number of particles found in arrested samples was counted, and np as function of concentration was then extrapolated to zero (with the assumption that at zero concentration, np = 0). The resultant linear relation was used to calculate np values for liquid samples (Fig. S1, ESI†). The resultant phase diagram is shown in Fig. 3. A closer look at the crystal phase shows that in all cases, the crystal g(r)s (Fig. 4) display the signature of a face-centered cubic crystal (FCC),35 echoing previous results (see also Fig. S2 (ESI†) for a comparison to BCC structure).24,36–40
 | ||
| Fig. 3 Experimental phase diagram as function of crosslinker concentration. Different states (liquid, crystal, glass) are indicated by different symbols (squares, triangles, circles). Overlapping symbols indicate both phases have been observed. | ||
 | ||
| Fig. 4 Typical crystal g(r)s for each crosslinker density. From bottom to top M1.5 at 2.5 wt%, M3 at 3 wt%, M5 at 4.4 wt% and M10 at 6.5 wt% are shown. Dashed lines represent the characteristic peak positions for a FCC crystal. The graphs are offset in y for clarity. The x-axis is normalised by the first peak position as of each g(r). | ||
The liquid-to-solid transition occurs at quite high volume fractions (ϕcrysRH > 0.5), which appears to defy expectations for charged particles with weakly screened and thus long-ranged Coulomb interactions. However, although our particles are weakly screened they do not necessarily possess long-ranged Coulomb interactions due to the presence of strongly extended dangling ends. Our particles have hydrodynamic diameters of around 1000–1500 nm in the fully deionised state at low concentrations, i.e. values that are significantly larger than the Debye length κ−1 ≈ 190 nm. In addition, while these extended dangling ends strongly influence the overall hydrodynamic size, the charge density of this outermost shell of dangling ends is very low, thus reducing the contribution to the electrostatic part of the effective pair potential.33
The role of crosslinker content and dangling ends is apparent also in the liquid-to-solid transition. The most rigid particle (M10) easily crystallises and does not form a glass at the concentrations investigated here. In contrast, the softest microgel (M1.5) has the highest difficulty to crystallise, with crystals being only accessible through temperature annealing (Fig. S3, ESI†). Similar observations were previously made for other types of ionic microgels, where it was also found that the crystal phase disappears for very soft particles with low crosslinker content.40 We believe that this is not only caused by the soft interaction potential,21 but also by the very long dangling ends in the particles with low crosslinker content (Fig. 1b). As previously pointed out for neutral microgels, these dangling ends entangle at high concentrations, thus slowing down diffusive motion and altering the pathway to arrest. Rather than particle caging slowing down dynamics as in traditional hard sphere-like colloids, dangling end entanglements act like temporary bonds and arrest motion, thus promoting the formation of a glass and resisting nucleation and growth of a crystal phase. This kind of polymer-driven arrest has been observed recently for soft and small microgels.41,42 Polymer entanglements moreover explain the long-lived metastable glassy state which occurs when a highly concentrated disordered microgel sample is rapidly diluted.43 This is also supported by the observation that thermal annealing leads to the formation of a crystal phase for these systems, which clearly indicates that the absence of an extended crystal phase is not reflecting the equilibrium phase diagram for these soft particles.
Thus far, we have shown that a direct estimate of the shell thickness of dangling ends can be made via DLS measurements, which reveal that microgels with low degrees of crosslinking have longer dangling ends in a broader distribution than stiff microgels. In addition, the experimental structural and dynamical information obtained from CLSM reveal different pathways towards dynamical arrest based on microgel stiffness. Stiff microgels easily crystallise at high concentrations, while in the case of soft microgels polymer entanglements in overlapping dangling ends promote a disordered arrested phase.
3.3 Comparison to theory
Armed with experimental data on microgel size, number density, phase behaviour and local order, we can now compare the pair correlation function g(r) for all liquid state points to theoretical predictions. In this section we investigate the effect of dangling ends and network charges on the ionic microgel interaction potential. The complexity of the theoretical models is increased as different contributions are considered.We start with a straightforward comparison as a benchmark. CLSM experiments have been performed on M1.5 in 0.1 M KCl – i.e., the charges on the ionic microgel have been screened, and thus their behaviour should follow pure PNIPAM microgels.
For pure, uncharged PNIPAM microgels, recent research has shown that a Hertzian model accurately describes interparticle interactions.19,44 In this model, the microgels are treated as elastic, homogeneous spheres (eqn (2) and Fig. 5a). The Hertzian interaction potential VH depends on εH(T) (the temperature dependent interaction strength) and σeff (the effective diameter of the particles). Indeed, using a soft interaction strength of εH = 200kBT and an effective radius Reff = RH the structural correlations across the entire liquid regime can be quantitatively described for the screened ionic microgels (Fig. 6a).
 | ||
| Fig. 5 Considered theoretical models and their individual contributions. From left to right: Hertzian model (only one contribution), Hertzian + Yukawa model (HY model), Hertzian + Yukawa + ramp model (HYR model). | ||
 | ||
| Fig. 6 Pair correlation functions for screened (circles) and deionised (squares) M1.5 microgels at 20 °C. (a) Dashed line: Hertzian fits to screened data (i.e. 0.1 M KCL) with εH = 200kBT, σeff = 2RH and experimental np. Solid line: Hertzian–Yukawa model fit to deionised data with εH = 200kBT, experimental np and fitted Reff and Zeff (Table S3, ESI†). (b) Solid line: Hertzian–Yukawa model fit to deionised data with εH = 104kBT, experimental np, Reff = RH and fitted Zeff (Table S4, ESI†). (c) Hertzian–Yukawa-ramp model fit to deionised data with εH = 200kBT, experimental np and fitted Reff, Zeff, Rramp and εramp (Table S5, ESI†). Graphs are offset in y for clarity. | ||
Deionising resins will affect microgel interactions in several ways. Not only will the charges on the microgel network contribute to particle–particle interactions, also the dangling ends will unfold and extend into the solvent (Fig. 1a). As a result, the point of contact shifts to longer distances (Fig. 6a). In addition, a more pronounced peak shift with increasing particle concentration as well as higher first peaks can be observed. We stress that this change in interactions can be achieved simply by addition of de-ionising resins to the sample.
Decoupling the effect of the unfolded dangling ends and the charges is not trivial. The first model we consider supplements the elastic Hertzian sphere with a Yukawa interaction potential to represent the additional charges embedded within the microgel network (eqn (1) and Fig. 5b). As a refinement, the microgel is modeled as penetrable macroion, allowing for ion distributions to fluctuate.10,20 This superposition has two consequences: at low dilution, the screened electrostatic part of the potential will dominate. Once microgel particles start to touch, the slight compression of the elastic network (the Hertzian soft repulsion) becomes important.
The superposition of Hertzian and Yukawa interactions leads to several new model parameters: the effective charge Zeff and the inverse Debye screening length κ. Because the microgel is modelled as a macroion, and the average interaction strength throughout the entire microgel network is considered, it is also no longer evident that σeff = 2RH. While some of these parameters can be determined experimentally, most have been fitted within reasonable limits to retrieve a minimal χ2 error. An illustration of the resultant Reff used for the Hertzian–Yukawa (HY) model can be found in Fig. S4 (ESI†), and we note again that the choice of Reff directly affects ϕeff. Detailed fit parameters are explained in Table S2 (ESI†). The explicit definition of the tested model can be found in Materials and Methods.
In Fig. 6a the fits with best-scoring χ2 values are presented for M1.5 under deionised conditions. Fit parameters can be found in Table S3 (ESI†). Results for other crosslinker concentrations are shown in Fig. S5, S7, S9 and Tables S7, S9, S11 (ESI†). In general, predicted correlation functions agree quite well with the experimental g(r)s at moderate to high concentrations where the Hertzian repulsion prevails. The model also captures the large peak shift with increasing concentration. However, there is a consistent under-estimation of peak height particularly at low concentrations where Yukawa interactions are expected to dominate.
In a first step to obtain better agreement, we increase the Hertzian interaction strength, reflecting the parameters noted in ref. 21, which originally presented the HY model. In this case, Reff = RH and εH = 104kBT with Zeff left as free parameter per state point. Fig. 6b shows results for the first four state points of M1.5 (additional fit parameters can be found in Table S4, ESI†). Again we find reasonable agreement for intermediate densities – similar to the results in ref. 21. However, it is clear that at low densities, the chosen interaction potential is too soft. At high densities on the other hand, the resulting potential is now too hard and the predicted peak in g(r) is much too pronounced and does not show the experimentally observed shift to shorter distances typical for soft potentials.
In a second attempt we have therefore increased the effective charge Zeff, thus enhancing the long range Yukawa contribution. As shown in Fig. 7a, simply increasing the electrostatic repulsion does not lead to a better fit at low concentration. While this indeed results in a higher amplitude for the first peak, the resultant predicted g(r)s also gets a much more symmetrical first peak that is typical for soft interactions, whereas the asymmetric peaks found in the experimental g(r)s suggest a much harder interaction.
 | ||
| Fig. 7 Effect of increasing fit parameters for a single state point (M1.5 at 0.25 wt%). (a) Increasing effective charge Zeff in the HY model. (b) Increasing brush repulsion strength εramp in the HYR model. (c) Increasing brush repulsion range Rramp in the HYR model. εramp is in units of kBT. Rramp is defined in units of Reff. Starred values indicate best scoring fits. Constant fit parameters are given in each panel. Potentials are shown in Fig. S11 (ESI†). | ||
We link the apparent shortcomings of the HY model to the behaviour of dangling ends: at low concentrations unfolded dangling ends appear to play a significant role in microgel interactions, which is not taken into account in the HY model. Because dangling ends are sensitive to the counterion concentration,33 they de-swell at high densities and the resulting soft steric repulsion approaches the Hertzian with a magnitude of the prefactor εH as found for the neutral microgels.
We therefore build upon the current model and phenomenologically introduce a third component: a polymer brush interaction to mimic the unfolded dangling ends (eqn (6) and Fig. 5c, see also Materials and Methods and Table S6, ESI†). The new potential is only modified at the onset of interactions, so this effectively translates as a ramp potential, where the strength εramp and range Rramp of interactions come into play. Here we expect Rramp to follow the length of the unfolded dangling ends. For this model (Hertzian–Yukawa-ramp, HYR), all parameters are again fitted to achieve the best-scoring χ2-value (see Table S6 and Fig. S4, ESI†).
All liquid state points from all cross-linker series have been considered (Fig. 6c and Fig. S6, S8, S10 and fit results in Tables S5, S8, S10, S12, ESI†). Indeed, fits including a dangling end contribution lead to better correspondence at low microgel density, although some underestimation of the first peak height remains (Fig. 6c and Fig. S6, S8, S10, ESI†). However, increasing the strength of the ramp interactions does not recover the peak height of the first g(r) peak (Fig. 7b). Similarly, increasing the range of the interactions (i.e. the brush thickness) leads to an overestimation of the first peak position (Fig. 7c). In fact, this data suggests that the effective potential between ionic microgels under these conditions appears to be much harder at low concentrations than predicted by the current theoretical models, presumably due to an additional contribution from the extended dangling ends.
Out of curiosity we therefore attempted an effective hard sphere approach using a simple Hertzian potential with an interaction strength εH = 105kT for the most dilute state points, taking only into consideration the position of the first peak in g(r). This is a clear departure from our previous considerations: within each model discussed thus far, the microgel effective radius is kept constant for the entire concentration range. Different contributions will start to dominate as the microgels draw nearer at increasing concentration, thus affecting the g(r) peak position and height. However, for the hard sphere model we simply estimate the effective radius from the peak position as = 2Reff. We note that by changing Reff per state point, also the volume fraction ϕeff is affected (see Table S13, ESI†).
Fig. 8 compares the hard sphere fit to the other considered models for the most dilute statepoints of all four crosslinker series. The hard sphere fit is surprisingly successful in capturing the peak height and shape of the experimental g(r)s in all four cases. In contrast, Fig. 8 makes it abundantly clear how the other models fail to reproduce the experimental data. Using a hard sphere interaction to describe soft ionic microgels obviously does not reflect their soft, polymeric nature. Regardless, this thought experiment strongly suggests that dangling end interactions are nontrivial and dominate in ionic microgel suspensions at low concentration under deionised conditions.
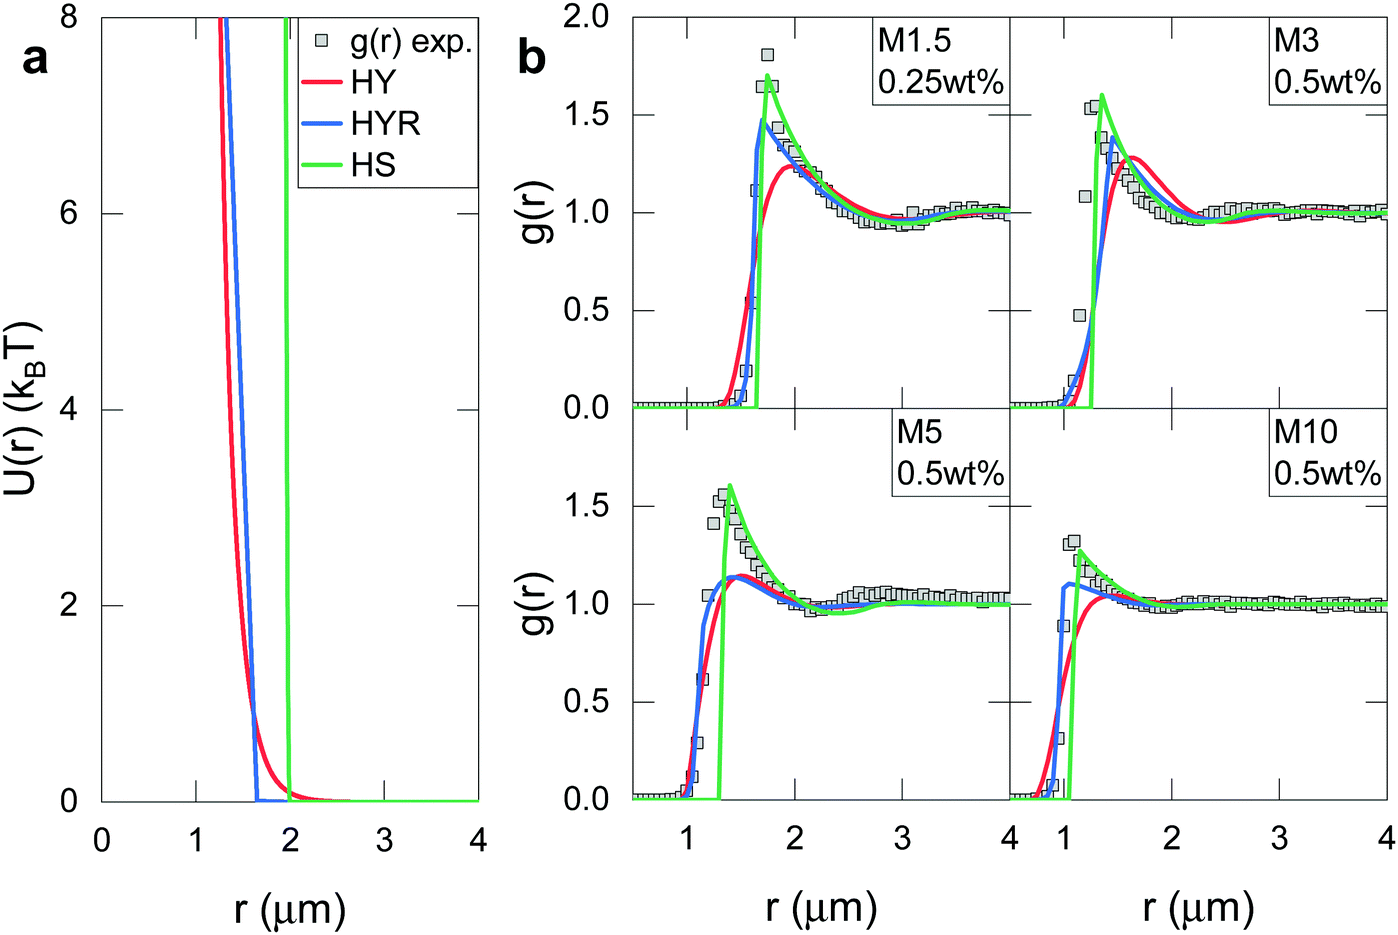 | ||
| Fig. 8 Model fits to the most dilute state points of each crosslinker series. (a) Potentials used for the state point M1.5 at 0.25 wt% with Hertzian–Yukawa model (HY) as red solid line, Hertzian–Yukawa-ramp model (HYR) as blue solid line and effective hard sphere model (HS) as green solid line). (b) Comparison between experimental g(r) (symbols) and considered theoretical models (lines indicate same model as panel a). Model parameters vary for each state point and are summarized in Table S13 (ESI†). | ||
Our study establishes a clear need for further development of ionic microgel interaction potential models, which include a third contribution related to dangling ends. Our results showcase that these contributions are strongest for the softest microgels, because their dangling ends are the longest and might possess more effective charge. Moreover, their contribution becomes less important at higher concentrations, in agreement with previous findings that the degree of swelling of the charged dangling ends is extremely sensitive to the counterion concentration, and thus decreases with increasing microgel concentration.28,33 Any future improved model thus needs to take into consideration exactly how (un)folded dangling ends as well as the crosslinked section of the microgel contribute to its overall size with increasing concentration.
The exact nature of these dangling end contributions and the functional form of the interaction potential remain unclear. Although we work with effective hard sphere repulsions here to reproduce the shape and height of the g(r) peak at low concentrations, we cannot exclude that effective attractions caused by transient polymer entanglements also could contribute to the very pronounced and strongly asymmetric first peak in g(r).
Previous work has shown that under deionised conditions, the ionic microgel networks are not fully charged.28 We hypothesise that subsequent interaction studies with deprotonated ionic microgels might aid in decoupling the effect of charges and dangling ends on the phase behaviour of microgels.
4 Conclusion
This study set out to investigate the effect of crosslinker content on interactions in ionic microgel systems. We found that the crosslinker content directly affects the number and length of dangling ends: stiff microgels possess many short dangling ends whereas soft microgels are endowed with fewer but longer dangling ends. The dangling ends unfold readily in response to solvent conditions.The different nature of the dangling ends between soft and stiff ionic microgels has several consequences. First, soft microgels display markedly slow diffusion and do not crystallise easily, indicating more polymer-like dynamics compared to their stiff counterparts.
Second, unfolded dangling ends strongly alter the interactions between ionic microgels. Under screened conditions, a Hertzian interaction potential readily predicts the experimental g(r)s. Deionised suspensions display different structural signatures compared to their screened counterparts, which can be captured relatively well by the existing theoretical framework at moderate and high volume fractions. However, especially at low concentrations where dangling end interactions dominate, the experimental structural correlations suggest a much harder interaction potential. Attempts to refine the model by adding a polymer brush interaction were moderately successful. In fact, we find that the best correspondence at low dilution can be obtained using a phenomenological hard sphere model, which does not reflect the complex polymeric nature of the microgel. Our results signal a clear need for further development of ionic microgel interaction models, which take into consideration the possible repulsions or entanglements arising from dangling end contacts. An earlier study has underlined that under deionised conditions, the dangling ends of ionic microgels not only respond differently to their sample environment compared to the more densely crosslinked core, but that the ionic microgel networks are not fully charged.28 We therefore hypothesise that subsequent interaction studies with deprotonated ionic microgels might aid in decoupling the effect of charges and dangling ends on the phase behaviour of microgels.
Author contributions
PM and PS designed the study. SN synthesized particles and performed experiments together with MB and PM. MB was responsible for image analysis. Calculations were performed by MB with help from NB, JS, JI and JM. MB wrote manuscript with input from all authors.Conflicts of interest
The authors declare no competing financial interests.Acknowledgements
C. Likos and L. Månsson are thanked for insightful discussions. We acknowledge financial support from the European Research Council (ERC-339678-COMPASS). JS is funded by a grant from the Swedish Research Council (Grant number 2019-03718).References
- M. Heskins and J. E. Guillet, J. Macromol. Sci. Chem., 1968, 2, 1441–1455 CAS.
- R. Pelton and P. Chibante, Colloids Surf., 1986, 20, 247–256 CrossRef CAS.
- A. Halperin, M. Kröger and F. M. Winnik, Angew. Chem., Int. Ed., 2015, 54, 15342–15367 CrossRef CAS PubMed.
- X. Wu, R. Pelton, A. Hamielec, D. Woods and W. McPhee, Colloid Polym. Sci., 1994, 272, 467–477 CrossRef CAS.
- M. Stieger, W. Richtering, J. S. Pedersen and P. Lindner, J. Chem. Phys., 2004, 120, 6197–6206 CrossRef CAS PubMed.
- N. Boon and P. Schurtenberger, Phys. Chem. Chem. Phys., 2017, 19, 23740–23746 RSC.
- T. Hoare and R. Pelton, Langmuir, 2004, 20, 2123–2133 CrossRef CAS PubMed.
- T. Hoare and D. McLean, J. Phys. Chem. B, 2006, 110, 20327–20336 CrossRef CAS PubMed.
- T. Hoare and R. Pelton, Langmuir, 2006, 22, 7342–7350 CrossRef CAS PubMed.
- D. Gottwald, C. N. Likos, G. Kahl and H. Löwen, J. Chem. Phys., 2005, 122, 074903 CrossRef CAS PubMed.
- A. Moncho-Jordá, J. Chem. Phys., 2013, 139, 064906 CrossRef PubMed.
- A. R. Denton and Q. Tang, J. Chem. Phys., 2016, 145, 164901 CrossRef PubMed.
- T. J. Weyer and A. R. Denton, Soft Matter, 2018, 14, 4530–4540 RSC.
- H. Senff and W. Richtering, J. Chem. Phys., 1999, 111, 1705–1711 CrossRef CAS.
- A. Fernández-Nieves, A. Fernández-Barbero, B. Vincent and F. De Las Nieves, Macromolecules, 2000, 33, 2114–2118 CrossRef.
- K. Kratz, T. Hellweg and W. Eimer, Colloids Surf., A, 2000, 170, 137–149 CrossRef CAS.
- D. Paloli, P. S. Mohanty, J. J. Crassous, E. Zaccarelli and P. Schurtenberger, Soft Matter, 2013, 9, 3000–3004 RSC.
- P. S. Mohanty, D. Paloli, J. J. Crassous, E. Zaccarelli and P. Schurtenberger, J. Chem. Phys., 2014, 140, 094901 CrossRef PubMed.
- M. J. Bergman, N. Gnan, M. Obiols-Rabasa, J.-M. Meijer, L. Rovigatti, E. Zaccarelli and P. Schurtenberger, Nat. Commun., 2018, 9, 5039 CrossRef PubMed.
- J. Riest, P. Mohanty, P. Schurtenberger and C. N. Likos, Z. Phys. Chem., 2012, 226, 711–735 CrossRef CAS.
- D. Gottwald, C. Likos, G. Kahl and H. Löwen, Phys. Rev. Lett., 2004, 92, 068301 CrossRef CAS PubMed.
- S. Nöjd, P. S. Mohanty, P. Bagheri, A. Yethiraj and P. Schurtenberger, Soft Matter, 2013, 9, 9199–9207 RSC.
- P. S. Mohanty, A. Yethiraj and P. Schurtenberger, Soft Matter, 2012, 8, 10819–10822 RSC.
- M. Pelaez-Fernandez, A. Souslov, L. Lyon, P. M. Goldbart and A. Fernandez-Nieves, Phys. Rev. Lett., 2015, 114, 098303 CrossRef CAS PubMed.
- A. Denton, Phys. Rev. E: Stat., Nonlinear, Soft Matter Phys., 2003, 67, 011804 CrossRef CAS PubMed.
- J. C. Crocker and D. G. Grier, J. Colloid Interface Sci., 1996, 179, 298–310 CrossRef CAS.
- P. Mohanty, S. Nöjd, M. Bergman, G. Nägele, S. Arrese-Igor, A. Alegria, R. Roa, P. Schurtenberger and J. Dhont, Soft Matter, 2016, 12, 9705–9727 RSC.
- M. J. Bergman, J. S. Pedersen, P. Schurtenberger and N. Boon, Soft Matter, 2020, 16, 2786–2794 RSC.
- P. Pincus, Macromolecules, 1991, 24, 2912–2919 CrossRef CAS.
- F. J. Rogers and D. A. Young, Phys. Rev. A: At., Mol., Opt. Phys., 1984, 30, 999 CrossRef CAS.
- J.-P. Hansen and I. R. McDonald, Theory of simple liquids: with applications to soft matter, Academic Press, 2013 Search PubMed.
- N. Gnan, L. Rovigatti, M. Bergman and E. Zaccarelli, Macromolecules, 2017, 50, 8777–8786 CrossRef CAS PubMed.
- S. Nöjd, P. Holmqvist, N. Boon, M. Obiols-Rabasa, P. S. Mohanty, R. Schweins and P. Schurtenberger, Soft Matter, 2018, 14, 4150–4159 RSC.
- J. Scheutjens, G. Fleer and M. C. Stuart, Colloids Surf., 1986, 21, 285–306 CrossRef CAS.
- M. Parrinello and A. Rahman, Phys. Rev. Lett., 1980, 45, 1196 CrossRef CAS.
- Z. Meng, J. K. Cho, S. Debord, V. Breedveld and L. A. Lyon, J. Phys. Chem. B, 2007, 111, 6992–6997 CrossRef CAS PubMed.
- P. S. Mohanty and W. Richtering, J. Phys. Chem. B, 2008, 112, 14692–14697 CrossRef CAS PubMed.
- J. K. Cho, Z. Meng, L. A. Lyon and V. Breedveld, Soft Matter, 2009, 5, 3599–3602 RSC.
- M. Muluneh and D. A. Weitz, Phys. Rev. E: Stat., Nonlinear, Soft Matter Phys., 2012, 85, 021405 CrossRef PubMed.
- B. Sierra-Martin and A. Fernandez-Nieves, Soft Matter, 2012, 8, 4141–4150 RSC.
- S. Kunz, M. Pawlik, W. Schärtl and S. Seiffert, Colloid Polym. Sci., 2018, 296, 1341–1352 CrossRef CAS.
- T. Kureha, H. Minato, D. Suzuki, K. Urayama and M. Shibayama, Soft Matter, 2019, 15, 5390–5399 RSC.
- P. S. Mohanty, S. Nöjd, K. van Gruijthuijsen, J. J. Crassous, M. Obiols-Rabasa, R. Schweins, A. Stradner and P. Schurtenberger, Sci. Rep., 2017, 7, 1487 CrossRef PubMed.
- L. Rovigatti, N. Gnan, A. Ninarello and E. Zaccarelli, Macromolecules, 2019, 52, 4895–4906 CrossRef CAS.
Footnotes |
| † Electronic supplementary information (ESI) available. See DOI: 10.1039/d1sm01222c |
| ‡ Present address: Department of Physics, University of Fribourg, Chemin du Musee 3, 1700 Fribourg, Switzerland. |
| § Present address: School of Chemical Technology, Kalinga Institute of Industrial Technology (KIIT), Bhubaneswar, India. |
| ¶ Present address: Condensed Matter Physics Laboratory, Heinrich-Heine-University, Düsseldorf, Germany. |
| || Present address: Inorganic Chemistry and Catalysis, Debye Institute, Utrecht University, Utrecht, Netherlands. |
| This journal is © The Royal Society of Chemistry 2021 |