
 Open Access Article
 This Open Access Article is licensed under a Creative Commons Attribution-Non Commercial 3.0 Unported Licence
Shear modulus and yield stress of foams: contribution of interfacial elasticity
Annika R.
Völp
 * and
Norbert
Willenbacher
* and
Norbert
Willenbacher
Institute for Mechanical Process Engineering and Mechanics: Applied Mechanics, Karlsruhe Institute of Technology, Gotthard-Franz-Str. 3, 76131 Karlsruhe, Germany
First published on 11th March 2021
Abstract
The link between interfacial elasticity of foaming solutions and the elasticity and yield stress of their aqueous foams is probed for a variety of surfactant, block-copolymer, protein, food, and particle-stabilized (Pickering) foams. We measured interfacial tension σ and interfacial elastic moduli of foaming solutions in dilation E∞ as well as in shear  at concentrations suitable for foaming and compared them to the shear modulus and yield stress of corresponding foams normalized by bubbles’ Sauter radius R32 and foams’ gas volume fraction. The interfacial shear modulus was only measurable for the foaming solutions including proteins or nanoparticles. For these systems the foam shear modulus scaled reasonably well with
  . The interfacial dilational modulus was accessible for all investigated systems and the foam shear modulus as well as yield stress scaled with a generalized Laplace pressure (σ + 2E∞)/R32. But foams stabilized by nanoparticles or aggregated proteins exhibited even higher shear modulus and yield stress values not captured by the proposed scaling with the generalized Laplace pressure and also show an unexpectedly high dependence of these characteristics on the gas volume fraction. We attribute this to attractive forces between particles and/or structure formation across the lamellae that become increasingly dominant as the lamellae narrow down during foam drainage.
Introduction
Foams and emulsions are complex disperse systems with unique texture and rheology. Though the individual phases are purely viscous, foams and emulsions display viscoelastic behavior when the dispersed phase exceeds the maximum packing fraction and the bubbles or droplets start to deform. Such foams and emulsions exhibit a yield stress, i.e. a critical stress at which neighboring bubbles or droplets rearrange topologically. Princen1,2 concluded from a two-dimensional model of equally-sized hexagonal cells that the elastic modulus G′ and yield stress τy of foams or emulsions exceeding the maximum packing fraction φc scale with the Laplace pressure within the cells, i.e. the ratio of interfacial tension σ and bubble or droplet radius R. For the two-dimensional case an analytical solution for the dependence of these rheological parameters on the dispersed volume fraction φ was derived. Based on experiments with polydisperse emulsions stabilized by a small molecular weight surfactant (ammonium laureth sulfate), Princen and Kiss3 established an empirical dependence of rheological parameters on (φ − φc) using φc = 0.712 close to the critical volume fraction φc = 0.74 of hexagonal close packed monodisperse spheres and suggested to express the bubble or droplet size in terms of the Sauter radius R32. Mason et al.4,5 refined the models suggesting the following semi-empirical equations: | (1) |
 | (2) |
 | (3) |
Based on these studies a contribution of the interfacial elasticity to the elastic modulus and yield stress of foams and emulsions should be taken into account. However, this is not considered in the widely used model equations describing foam elasticity and yield stress (eqn (1) and (2)), which were derived from investigations on emulsions and foams stabilized by low molecular weight surfactants lacking in substantial interfacial elasticity. We are not aware of any systematic investigation on the quantitative contribution of the interfacial elasticity to the foam elasticity or yield stress comprising of different types of foaming agents.
We determined the interfacial tension and interfacial elastic moduli of surfactant, block copolymer, and protein solutions, food systems and nanoparticle dispersions in shear as well as in dilation at amphiphile concentrations suitable for foaming. The elastic shear moduli and yield stresses of foams prepared from the same foaming solutions were measured and normalized to the respective bubble Sauter radii and gas volume fractions according to the suggested scaling in eqn(1) and (2). The critical gas volume fraction was set to φc ≈ 0.635 as suggested earlier.6 We correlated normalized shear modulus and yield stress values to the interfacial elasticity data and propose a quantitative contribution of the latter to the foam rheological characteristics yielding a refinement of eqn (1) and (2).
Experimental
Solution preparation and interface characterization
Food systems, aqueous solutions of surfactants, block copolymers and proteins, and dispersions of nanoparticles were prepared as stated in Table 1. For reasons of readability, we refer to all these systems as foaming solutions in the following.| Foaming agent | Concentrations | Preparation |
|---|---|---|
| Glycolipid sorbitol decenoate | 2 g l−1 | As described in ref. 16 |
| Glycolipid glucose 4-methyl-nonanoate | 1.2 g l−1 | As described in ref. 16 |
| Block copolymer poloxamer 407 (Sigma Aldrich) | 0.05, 0.5 and 5 mM poloxamer in 0.1, 50 and 100 mM NaCl, respectively | Dissolved in demineralized water at 20 °C |
| Block copolymer poloxamer 188 (Sigma Aldrich) | 0.5 mM poloxamer in 50 mM NaCl | Dissolved in demineralized water at 20 °C |
| Guinness stout beer | Degassed; at 20 °C | |
| Whole milk powder (Nestlé) | 10 wt% | As described in ref. 17 |
| Bovine serum albumin (Santa Cruz Biotechnology) | 1 wt% at pH 6.8 in 0, 10, 50, 100 mM NaCl, respectively, and at pH 4.7 (isoelectric point) | Dissolved in demineralized water at 20 °C |
| Lupine protein (Prolupin) | 1 wt% heat treated, at pH 4. pH 6.8, pH 10, and in 0, 10, 50 mM NaCl, respectively | As described in ref. 18 |
| Hexylamine coated silica nanoparticle 20 nm (LUDOX® TMA, Grace) | 2.5 wt% coated with 5, 50, and 70 mM hexylamine in 0, 10, 50 and 100 mM NaCl and 1 mM CaCl2, respectively | As described in ref. 19 |
The gas/liquid interfaces of the foaming solutions were characterized in oscillatory dilation at frequencies between 0.05 Hz and 0.67 Hz using the pendant drop method (PAT1, Sintaface) or in case of the block copolymer solutions, at frequencies between 0.1 and 3 Hz using the rising bubble method (Tracker, Teclis Scientific). The drop surface area varied between 10 to 30 mm2, depending on the maximum drop volume of each foaming solution, respectively. After the equilibrium of the interfacial tension σ was reached, the surface area was dilated in oscillation with a deformation amplitude in the linear viscoelastic regime (max. 10% of the drop surface area) and stepwise increased frequency (see exemplary frequency dependencies of E′ in Fig. 5 under footnotes). Since the increase in E′ with frequency is weak at least for the highest frequencies accessible here, the values obtained at the maximum applicable frequency were treated as the equilibrium values E∞. In shear, the solution surfaces were stressed in oscillation using a rotational rheometer (DHR3, TA Instruments) equipped with a double wall ring geometry12 (70 mm ring diameter) at a frequency of 1 Hz and strains in the linear viscoelastic regime to obtain the interfacial elastic shear modulus  (see exemplary strain dependencies of
  in Fig. 6 under footnotes). Note, typically the interfacial elastic modulus is smaller in shear than in dilation13–15 and for several foaming solutions the elastic interfacial shear moduli were below the measuring limit of the rheometer. Furthermore, it should be noted that the interfacial modulus data were determined at the amphiphile concentrations used for foam preparation and thus should be treated as apparent values not necessarily matching the true interfacial elasticity of an amphiphilic monolayer.
Foam preparation and characterization
Foams were produced in glass filter funnels (16–40 μm pore size VitraPOR®Por.4, Robu) perfused by 60 ml nitrogen per minute as described in ref. 16 and 20, except for the reconstituted whole milk foams, which were produced in a commercial milk whipper (Aeroccino4, Nespresso), as described in.17 Recording of foam age was started once the filter funnel was completely filled with foam and the nitrogen flow was stopped or the whipper stopped the foaming process. The ratios between foam and solution conductivity during free drainage of the foams were measured at the center of the foam column using a rod-shaped electrode with 5 mm measuring gap width connected to a conductivity meter (Inlab731 and SevenCompact S230, Mettler Toledo). The gas volume fraction φ of the foams was calculated from the relative foam conductivity κ as described in ref. 21: | (4) |
Results and discussion
The interfacial tension, σ and the interfacial elastic moduli in shear and dilation E∞ of the foaming solutions are displayed in Table 2.
 (max. 33% error) and dilation E∞ (max. 22% error) in mN m−1
| Foaming agent | σ |
|
E ∞ | |
|---|---|---|---|---|
| Sorbitol decenoate | 26.6 | 3.3 | ||
| Glucose 4-methyl-nonanoate | 29.4 | 5.2 | ||
| Poloxamer 407 | ||||
| 0.05 mM Poloxamer + 100 mM NaCl | 39.5, 41.1 | 11.6, 12.5 | ||
| 0.5 mM Poloxamer + 50 mM NaCl | 39.3 | 10.9 | ||
| 5 mM Poloxamer + 100 mM NaCl | 38.6, 38.2 | 8.6, 11.1 | ||
| Poloxamer 188 | ||||
| 0.5 mM Poloxamer | ||||
| + 50 mM NaCl | 44.2 | 14.7 | ||
| Guinness stout | 44.2 | 18.7 | ||
| Milk powder | 47 | 37.3 | ||
| Bovine serum albumin | ||||
| pH 4.7 | 53.1 | 8.8 | 73.2 | |
| pH 6.8 | 52.3 | 12.1 | 56.6 | |
| +10 mM NaCl | 55.6 | 26.1 | 45.9 | |
| +50 mM NaCl | 55.2 | 64.8 | ||
| +100 mM NaCl | 53.7 | 57.5 | ||
| +50 mM KCL | 52 | 21.1 | ||
| LPI | pH 6.7 20 °C | 43.2 | 31.5 | |
| +10 mM NaCl | 42.9 | 30.7 | ||
| +50 mM NaCl | 42.7 | 32.7 | ||
| 50 °C | 41.9 | 36.4 | ||
| 70 °C | 41.5 | 42.4 | ||
| 90 °C | 41.3 | 39.5 | ||
| 100 °C | 42.6 | 35.5 | ||
| pH 4 | 46.5 | 24.2 | ||
| pH 10 | 42.5 | 25.2 | ||
| TMA | 5 mM hexylamine | 63.5 | 58.6 | |
| 50 mM hexylamine | 42.3 | 328 | 62.5 | |
| +10 mM NaCl | 39.6 | 391 | 78.3 | |
| +50 mM NaCl | 43.8 | 139 | ||
| +100 mM NaCl | 40 | 816 | 115 | |
| +1 mM CaCl2 | 55.6 | 157 | ||
| 70 mM hexylamine | 45.4 | 212 |

Fig. 1 shows the foam shear moduli normalized to the reciprocal bubble's Sauter radius R32−1 and φ(φ − φc) versus the equilibrium interfacial tension σ, the interfacial dilatational modulus E∞ and the interfacial shear modulus  of the foaming solutions, respectively. The critical gas volume fraction φc was set to 0.635 corresponding to randomly packed monodisperse spheres. Preliminary data analysis revealed that it was not feasible to determine φc from the measured bubble size distribution as suggested earlier20 since the experimental uncertainty was too high and would have blurred the correlations between foam rheological quantities and interfacial elasticity of corresponding foaming solutions. The interfacial tension of the foaming agent solutions covers the range from 25 to 70 mN m−1. The interfacial moduli of the same solutions vary in a much broader range from 2 to 200 mN m−1 in dilation and from about 10 to 1000 mN m−1 in shear.
 | ||
Fig. 1 Foam elastic modulus G0 normalized to the reciprocal bubble Sauter radius R32−1 and φ(φ − φc) versus (a) interfacial tension σ, (b) interfacial dilatational elastic modulus E∞ and (c) interfacial shear elastic modulus  of the corresponding foaming solutions. Data for β-lactoglobulin were reused from ref. 9. of the corresponding foaming solutions. Data for β-lactoglobulin were reused from ref. 9. | ||
The normalized shear moduli of the foams show no unique correlation with the equilibrium surface tension (Fig. 1(a)). But clearly, the foam modulus increases monotonically with the dilatational modulus, as can be seen in Fig. 1(b), and according to Fig. 1(c) also with the interfacial shear modulus of the foaming solutions, albeit to a weaker extend. The strong coupling of foam and interfacial modulus is demonstrated covering two orders of magnitude in interfacial modulus values.
Costa et al. suggest that the contribution of interfacial tension and interfacial elasticity superimpose linearly. Thus, we propose the following model:
 | (5) |
 , as it is the case for small molecular weight surfactants. Fig. 2 shows the normalized foam moduli versus
 . With C = 2, eqn (5) fits the data for animal-based proteins and silica particles very well, covering two orders of magnitude in
  and more than one order of magnitude in G0. The high interfacial shear elasticity of particle dispersions is attributed to a strong interfacial network and jamming effects, occurring when the interface is sheared or compressed. However, for a given foaming solution. i.e. constant
  , strong differences between the normalized shear modulus data corresponding to foams with different gas volume fractions indicate additional physical mechanisms contributing to foam elasticity not captured by the interfacial elasticity. Proteins show lower interfacial shear elasticities but also form interfacial networks. This is indicated by the onset of non-linearity of
  at deformations <5% corresponding to network break-up. However, eqn (5) is not applicable to surfactant and block copolymer or lupin protein stabilized foams as these foaming agents do not exhibit measurable interfacial shear elasticities.
 | ||
Fig. 2 Foam elastic modulus G0 normalized by the reciprocal bubble Sauter radius R32−1 and φ(φ − φc) versus the sum of interfacial tension σ and twice the interfacial shear modulus  of the foaming solution. Solid line shows the linear relationship with the pre-factor 1.6. Data for β-lactoglobulin were reused from ref. 9. of the foaming solution. Solid line shows the linear relationship with the pre-factor 1.6. Data for β-lactoglobulin were reused from ref. 9. | ||
Foaming systems that do not show measurable interfacial shear moduli  still exhibit high frequency dilatational elastic moduli E∞. The dependence of normalized foam moduli and yield stresses on σ + 2E∞ are depicted in Fig. 3(a) and (b), respectively. The correlation between the foam elasticity and σ + 2E∞ is quite distinct for a broad variety of foaming agents. The foam yield stress also correlates with σ + 2E∞ but less clearly.
 | ||
| Fig. 3 (a) Foam elastic modulus G0 normalized by the reciprocal bubble Sauter radius R32−1 and φ(φ − φc) and (b) foam yield stress normalized by the reciprocal bubble Sauter radius R32−1 and (φ − φc)2versus the sum of interfacial tension σ and twice the high frequency elastic modulus E∞ of the foaming solution in dilation. Solid lines show the linear relationship with the pre-factor ad = 1 in (a) and kd = 0.25 in (b). Data for β-lactoglobulin were reused from ref. 9. | ||
Solving the differential equation for a sphere
 | (6) |
 | (7) |
The correlations shown in Fig. 3(a) and (b) suggest the following model equations:
 | (8) |
 | (9) |
However, the extremely high elasticities of foams stabilized by silica particles or aggregated proteins deviate from this scaling. Foam elasticity and yield stress in these cases are obviously not captured by the interfacial tension and its change upon interfacial dilation. They may be dominated by strong attractive forces within the stabilizing surface layers presumably resulting in structures spanning across foam lamellae. This is corroborated by the unusually strong dependence of foam modulus and yield stress on φ observed in these cases, exceeding the well-known scaling φ(φ − φc) and (φ − φc)2 observed for many surfactant or protein stabilized foams and emulsions by far. Recently synergetic effects between interfacial elasticity and strong attractive forces among emulsion droplets was reported to lead to high bulk elastic moduli.26 Such strong attractions among gas bubbles may also contribute to the high elastic modulus and yield stress values as well as their strong dependence on gas volume fraction observed here.
This distinct dependency of the foams’ elastic modulus and yield stress on gas volume fraction φ is shown in Fig. 4(a) and (b) for foaming solutions of various ionic strength containing dissolved proteins or particles, respectively. For protein solutions without added salt, the foam elastic modulus increases with φ(φ − φc) and yield stress increases with (φ − φc)2 as predicted from model eqn (7) and (8). When the ionic strength of the β-lactoglobulin solution is increased, the foam elastic modulus and yield stress also obey the common φ-scaling but with increased pre-factors ad and kd. In case of particle stabilized foams, the elastic modulus and yield stress increase with φ(φ − φc) and (φ − φc)2 according to a scaling exponent ≈2. Hence our data indicate a stronger increase of foam elastic modulus and yield stress during drainage of foams stabilized by hydrophobized silica nanoparticles and under conditions allowing for a denser packing of the foaming agents at the interface, as it is the case for proteins at high ionic strength of the solution. Such protein aggregates are frequently considered as ‘nanoparticles’ and form highly stable foams since they are partially hydrophobic and small enough (<70 nm for β-lactoglobulin) to adsorb onto the interface.27,28 In former studies, high foam elasticity was attributed to interlamellar network formation of aggregated proteins.9,20 Accordingly, the stronger increase of the elastic modulus and yield stress with increasing gas volume fraction could be explained by compaction of these networks when the lamellae narrow down.
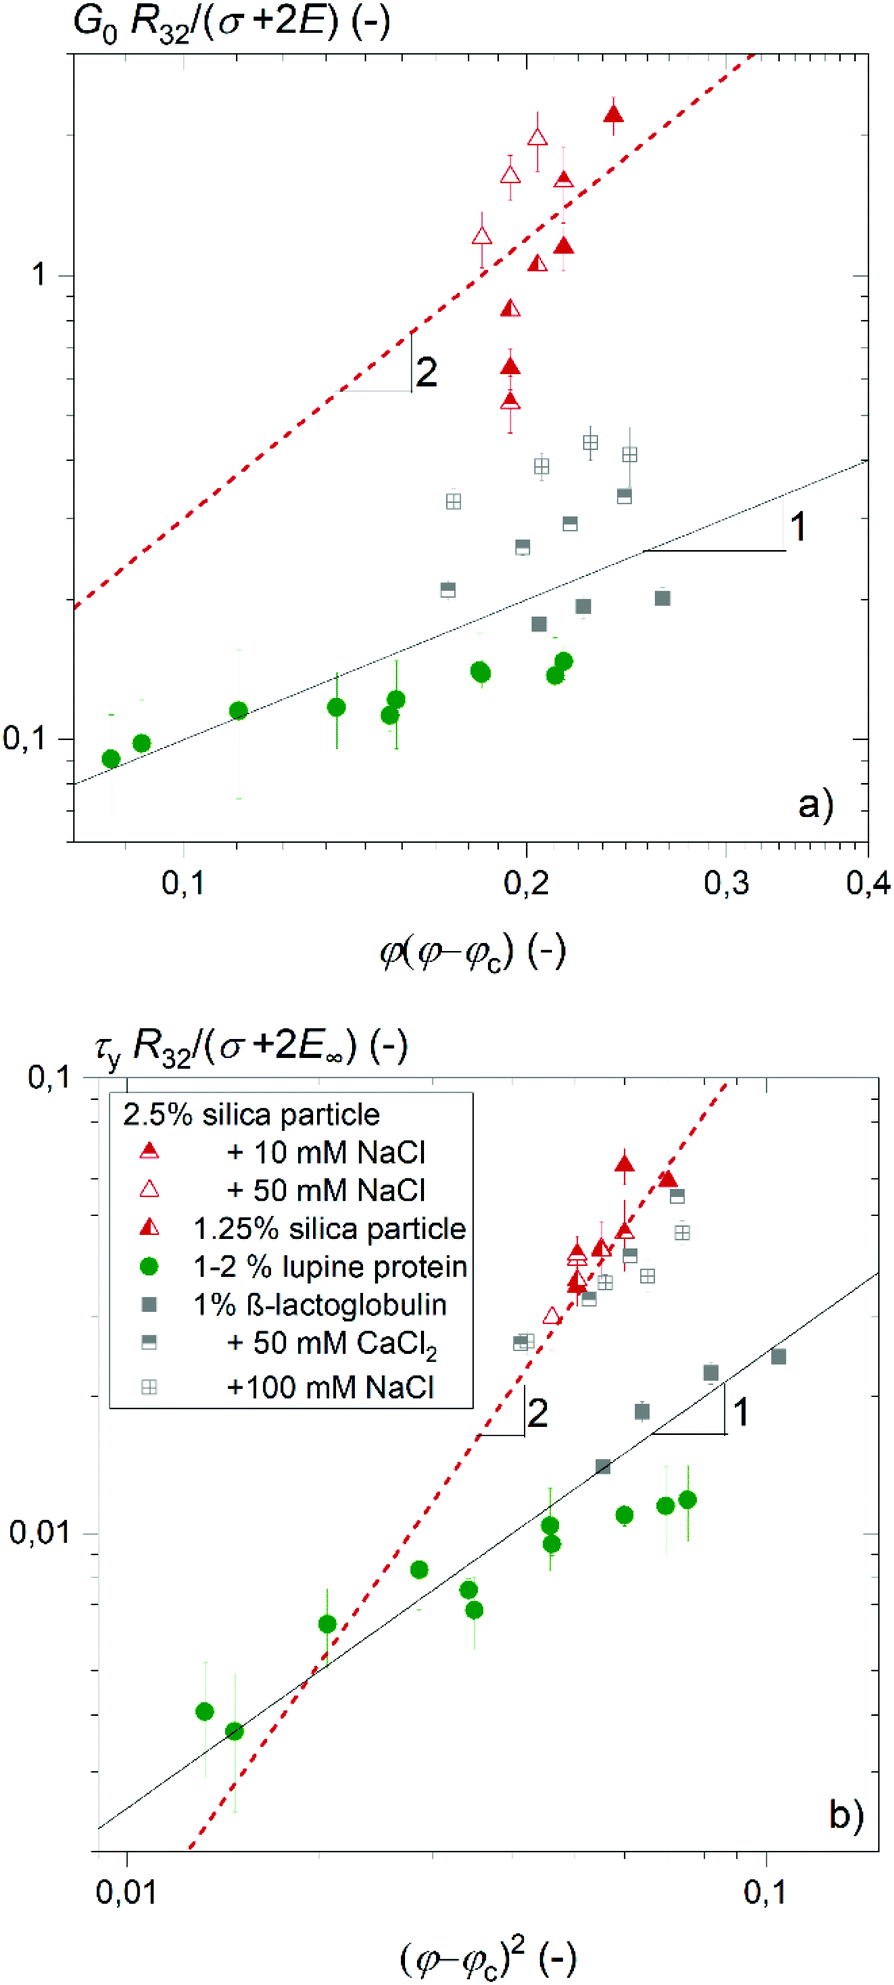 | ||
| Fig. 4 (a) Foam elastic modulus and (b) foam yield stress normalized by (σ + 2E∞)/R32versus φ(φ − φc) and (φ − φc)2, respectively. Solid lines show a linear dependence and dashed lines show a quadratic dependence. Data for β-lactoglobulin were reused from ref. 9. | ||
Conclusions
We investigated close packed aqueous foams stabilized by a broad variety of amphiphiles, including glycolipid surfactants, block copolymers, plant- and animal-based proteins, as well as nanoparticles, in order to elucidate the coupling between foam flow and the interfacial elasticity of the corresponding amphiphile solution.We measured the shear modulus G0 and yield stress τy of foams at various gas volume fractions φ and determined the mean Sauter diameter R32 simultaneously. Interfacial elasticity was characterized in terms of dilatational as well as shear modulus E∞ and  , respectively.
Our data cover more than two orders of magnitude regarding the absolute values of foam shear modulus, yield stress and interfacial elastic moduli.
In line with previous investigations foam modulus and yield stress strongly vary with interfacial elasticity.
Foams stabilized by nanoparticles and certain protein solutions exhibit a pronounced interfacial shear elasticity, but the range of linear response is narrow, indicating strong attractive interactions or jamming of particles in the surface layer. In these cases the foam modulus scales as G0 = as[(σ + 2Gi)/R32](φ(φ − φc)) with as = 1.6 and for vanishing elasticity reduces to the well-known model presented in eqn (1) confirmed for numerous foams and emulsions stabilized by low molecular weight surfactants.
Dilatational elasticity of foaming solutions could be determined for all investigated systems also including the glycolipid surfactants and block-copolymers.
For this comprehensive data set scaling laws G0 = ad[(σ + 2E∞)/R32](φ(φ − φc)) and τy = kd[(σ + 2E∞)/R32](φ − φc)2 are confirmed. The numerical pre-factors ad = 1 and kd = 0.25, however, deviate from those reported in the literature for various foam and emulsion systems based on amphiphiles without measurable dilatational elasticity. The term (σ + 2E∞)/R32 represents a generalized Laplace pressure and characterizes the change of surface tension with deformation.
Substantial deviations from this simple scaling were, however, observed for systems either stabilized by hydrophobic silica nanoparticles or by β-lactoglobulin aggregated at high ionic strength or at the isoelectric point. In these cases, strong attractive interactions among particles or particulate protein molecules are present and even structure formation across the foam lamellae may occur which strongly contribute to the foam modulus and yield stress but do not show up in E∞. This hypothesis is further supported by the previously not reported strong dependence of normalized modulus or yield stress on gas volume fraction found for these systems.
The strong correlation between bulk and interfacial elasticity for close packed foams and the empirical scaling laws found to be valid for a broad range of different foam forming amphiphiles may stimulate further theoretical work providing a deeper understanding of these phenomena which are of significant technical relevance.
Conflicts of interest
There are no conflicts to declare.Appendix
 | ||
| Fig. 5 Frequency dependence of the interfacial elastic modulus measured in oscillatory dilation at deformation amplitudes in the linear viscoelastic regime. | ||
 | ||
Fig. 6 Strain dependence of interfacial storage modulus  and loss modulus and loss modulus  measured in oscillatory shear at a frequency of 1 Hz. measured in oscillatory shear at a frequency of 1 Hz. | ||
Acknowledgements
We thank the groups of W. Drenckhan (Institut de Chimie, Institut Charles Sadron, France) and H. Karbstein (Institute of Process Engineering in Life Sciences I: Food Process Engineering, Karlsruhe Institute of Technology, Germany) for access to their oscillating drop tensiometers and the group of M. Wilhelm (Institute for Chemical Technology and Polymer Chemistry, Karlsruhe Institute of Technology, Germany) for access to their rotational rheometer and the double wall ring geometry. We acknowledge the funding by the DFG project “Rheology and structural properties of protein and particle-stabilized foams – a multi-scale approach” WI 3138/29-1.Notes and references
- H. M. Princen, J. Colloid Interface Sci., 1982, 91, 160–175 CrossRef.
- H. M. Princen, J. Colloid Interface Sci., 1979, 71, 55–66 CrossRef.
- H. M. Princen and A. D. Kiss, J. Colloid Interface Sci., 1986, 112, 427–437 CrossRef CAS.
- T. G. Mason, J. Bibette and D. A. Weitz, Phys. Rev. Lett., 1995, 75, 2051–2054 CrossRef CAS PubMed.
- T. G. Mason, J. Bibette and D. A. Weitz, J. Colloid Interface Sci., 1996, 179, 439–448 CrossRef CAS.
- S. Marze, R. M. Guillermic and A. Saint-Jalmes, Soft Matter, 2009, 5, 1937–1946 RSC.
- T. D. Dimitrova and F. Leal-Calderon, Adv. Colloid Interface Sci., 2004, 108–109, 49–61 CrossRef CAS PubMed.
- J. P. Davis, E. A. Foegeding and F. K. Hansen, Colloids Surf., B, 2004, 34, 13–23 CrossRef CAS PubMed.
- M. Lexis and N. Willenbacher, Soft Matter, 2014, 10, 9626–9636 RSC.
- S. Tsibranska, S. Tcholakova, K. Golemanov, N. Denkov, E. Pelan and S. D. Stoyanov, J. Colloid Interface Sci., 2020, 564, 264–275 CrossRef CAS PubMed.
- S. Costa, R. Höhler and S. Cohen-Addad, Soft Matter, 2013, 9, 1100 RSC.
- S. Vandebril, A. Franck, G. G. Fuller, P. Moldenaers and J. Vermant, Rheol. Acta, 2010, 49, 131–144 CrossRef CAS.
- G. Lin, J. M. Frostad and G. G. Fuller, Phys. Rev. Fluids, 2018, 3, 114001 CrossRef.
- S. Cohen-Addad, R. Höhler and O. Pitois, Annu. Rev. Fluid Mech., 2013, 45, 241–267 CrossRef.
- N. Pagureva, S. Tcholakova, K. Golemanov, N. Denkov, E. Pelan and S. D. Stoyanov, Colloids Surf., A, 2016, 491, 18–28 CrossRef CAS.
- R. Hollenbach, A. R. Völp, L. Höfert, J. Rudat, K. Ochsenreither, N. Willenbacher and C. Syldatk, Molecules, 2020, 25, 3797 CrossRef CAS PubMed.
- A. R. Völp, L. Kagerbauer, J. Engmann, D. Z. Gunes, C. Gehin-Delval and N. Willenbacher, J. Food Eng., 2020, 290, 110150 CrossRef.
- A. R. Völp, J. Seitz and N. Willenbacher, Food Hydrocoll Search PubMed.
- A. Carl, A. Bannuscher and R. Von Klitzing, Langmuir, 2015, 31, 1615–1622 CrossRef CAS PubMed.
- M. Lexis and N. Willenbacher, Colloids Surf., A, 2014, 459, 177–185 CrossRef CAS.
- K. Feitosa, S. Marze, A. Saint-Jalmes and D. J. J. Durian, J. Phys.: Condens. Matter, 2005, 17, 6301 CrossRef CAS.
- A. R. Völp, F. Fessler, J. Reiner and N. Willenbacher, Chem. Eng. Technol., 2020, 43, 1897–1902 CrossRef.
- R. H. Ewoldt, M. T. Johnston and L. M. Caretta, Experimental Challenges of Shear Rheology: How to Avoid Bad Data, Springer, New York, 2015 Search PubMed.
- N. Willenbacher and M. Lexis, Foam Films and Foams: Fundamentals and Applications, CRC Press, Boca Raton, 2018 Search PubMed.
- W. Kloek, T. Van Vliet and M. Meinders, J. Colloid Interface Sci., 2001, 237, 158–166 CrossRef CAS PubMed.
- S. Tsibranska, S. Tcholakova, K. Golemanov, N. Denkov, L. Arnaudov, E. Pelan and S. D. Stoyanov, Food Chemistry, 2020, 316, 126365 CrossRef CAS PubMed.
- B. S. Murray and R. Ettelaie, Curr. Opin. Colloid Interface Sci., 2004, 9, 314–320 CrossRef CAS.
- A. L. Fameau and A. Salonen, C. R. Phys., 2014, 15, 748–760 CrossRef CAS.
| This journal is © The Royal Society of Chemistry 2021 |