 Open Access Article
Creative Commons Attribution 3.0 Unported Licence
Dynamics and mechanism of liquid film collapse in a foam†
Naoya
Yanagisawa
 *,
Marie
Tani
 and
Rei
Kurita
 *
*
Department of Physics, Tokyo Metropolitan University, 1-1 Minamioosawa, Hachiouji-Shi, Tokyo 192-0397, Japan. E-mail: yanagisawa-naoya@ed.tmu.ac.jp; kurita@tmu.ac.jp
First published on 17th February 2021
Abstract
Foams have unique properties that distinguish them from ordinary liquids and gases, and are ubiquitously observed in nature, both in biological systems and industrial products. Foams are known to eventually collapse over time; given their wide-range industrial application, understanding how bubbles in a foam collapse is an important aspect for product longevity and tailoring physical properties. Previously, it was shown that droplets are emitted during the collective bubble collapse, however the mechanism of the droplet emission in a foam is not yet clearly understood. It is directly related to the stability of the foam, thus we quantitatively investigate collapse dynamics in liquid films in a foam, and identify some unique features. When one film breaks, we see that the oscillation of the vertical Plateau border to which it is connected induces anomalous liquid transport from the edge of the border to the center. Once a crack appears near the border and a collapse front is formed, we find that the curvature of the front reverses as it migrates, followed by the emergence and emission of droplets. We elucidate the origins of this behavior and discuss the stability of foams, establishing how the characteristic time scales of the process relate to each other.
1 Introduction
A liquid–gas foam is a jammed state composed of gas bubbles, liquid films, Plateau borders and the nodes.1,2 It has some unique properties, such as viscoelasticity of soft matter, distinct from ordinary gases and liquids.1–9 Foams are widely seen in daily life, for example, in fire extinguishing agents, foods, beverages, detergents, cosmetic products and pharmaceuticals.1,2 Foams also have notable disadvantages in certain situations. For example, foams of chemical materials such as surfactants are more stable and less likely to collapse and disappear, leading to environmental pollution if they are dumped into rivers and seas.1,2 The stability of such foams has been often controlled by the addition of chemical substances such as antifoams, defoamers, and foam control agents.10 However, the physical mechanism of foams which collapse without these additives is poorly understood.A foam is made up of liquid thin films on which surfactants adhere.1,2 Films are joined into a cellular network structure made of Plateau borders (PBs), the edges where groups of three films meet. The foam is sustained in a metastable non-equilibrium state and eventually collapses and disappears as time elapses. In general, for liquid–gas foams, it is known that liquid drainage, Ostwald ripening (coarsening) and bubble coalescence play a significant role in foam dynamics, decay and collapse.2 For the dry foam, the bursting of the liquid film is dominant for the foam collapse since its time scale is much smaller than that of the liquid drainage and that of coarsening. In this study, we focus on the collective bubble collapse (CBC) in the foam. It has been reported that when a liquid film in a foam ruptures, neighboring PBs undergo large oscillations.11 It is also known that bursting of a bubble can cause neighboring bubbles to crack during the foam collapse.12–15 In a previous study, we directly observed two modes of CBC; one is a propagating mode, where a neighboring liquid film is broken due to the impact of liquid absorption; the other is a penetrating mode, where liquid droplets emitted during absorption penetrate through other distant liquid films.15 In order to control the stability of foams, the mechanism of CBC such as how the emitted droplets are created should be clarified.
Breakage of a single isolated liquid film has been studied extensively.16–23 In the inertial regime, where the thickness of the film is several hundred nanometers, the velocity of a breaking film in three dimensions follows the Taylor–Culick velocity  , where γ, ρ and δ are the surface tension of the film, the density of the solution and the thickness of the film, respectively.16,17 It is also known that the velocity of a breaking film in a quasi-two-dimensional bubble, created by confining the monolayer of a bubble between two plates, follows the Taylor–Culick velocity.23 The receding rim of the collapsing liquid film then splits into small droplets via a Rayleigh–Plateau instability.19,20,22 In the viscous regime, when the thickness of a liquid film is several hundred micrometers and the surface tension of the detergent solution is lower, it has been reported that the hole in the liquid film grows exponentially over time.18 We note that the order of magnitude of the velocity is several meters per second in the inertial regime and several millimeters per second in the viscous regime.23 We also note here that the two regimes are interconnected, and stability in one regime in general transforms to the stability of the other due to the Marangoni effect in the liquid film.2,24–26 The Marangoni flow caused by the surface surfactant concentration gradient changes the local thickness of the film, and stabilizes the film by slowing the drainage of the film. However, the collapse of a liquid film in a foam is distinct from the breakage of a single, isolated film; each bubble in a foam interacts with neighboring bubbles due to their cellular structure.
Thus, in this letter, we experimentally reveal the mechanism and dynamics of the liquid film collapse in a foam using a high-speed camera. When a single film in the foam collapses, we find that the vertical PBs to which it is connected begin to oscillate, causing liquid to be transported from the edge to the center of the PBs. Most of the time, this is followed by the formation of a crack which propagates over the remaining two films in both directions with respect to the border. One of these fronts migrates with the PB itself with a curvature which reverses before a droplet is emitted. We note that this behavior is clearly distinct from the rupture of the single liquid film. We also propose that foam stability is determined by the relationship between the different characteristic time scales of these phenomena.
2 Materials and methods
Firstly, we show the experimental setup (see Fig. 1). The foams are created using a capillary glass tube connected to a syringe pump. We put the foam at the center of a glass plate and cover it with another glass plate. The diameter of the bubbles is about 2.5–4.0 mm. We took images of liquid film breakage from a diagonal angle using a high speed camera with a frame rate of 23![[thin space (1/6-em)]](https://www.rsc.org/images/entities/char_2009.gif) 000 fps. We used 0.24 wt% and 14 wt% solution of ionic surfactant TTAB (tetradecyl trimethyl ammonium bromide) in glycerol and deionized water. The critical micelle concentration of TTAB is about 0.12 wt%.27 In order to investigate the difference in behavior due to the difference in viscosity, we use two concentrations: 17 wt% glycerol and 75 wt% glycerol. All experiments use a solution of 14 wt% TTAB and 17 wt% glycerol unless otherwise stated. In addition, to confirm the dependence on the surfactant type, we use 2 wt% solution of nonionic surfactant C10E3 (triethylene glycol monododecyl ether). We also use an aqueous solution of household detergents (CHAMY, Lion Co., Japan), diluted to 25% with deionized water. For the collapse of liquid films in a quasi two-dimensional foam, the sample thickness h is set to 1.1 mm or 2.1 mm by using a spacer. We also use a h = 9.1 mm cell that can create foams of several bubbles thick to see the collapse of the liquid film in a three-dimensional foam. We took images using a high speed camera (KEYENCE, VW-9000, Japan). The liquid fraction is obtained using ϕ = Vliquid/Vfoam = m/ρhSfoam, where Vliquid, Vfoam, m, ρ, h, and Sfoam are the volume of liquid, the volume of the foam, the mass of liquid, the density of the liquid, the sample cell thickness and the area of the foam, respectively.15 In this calculation of ϕ, we took into account for the liquid on the plates. Sfoam is measured from the top view of the foam, and m is obtained by measuring the mass of liquid. The mean liquid fraction of the foam is 0.003–0.035. We note that at h = 9.1 mm, the liquid fraction has a local distribution due to liquid drainage. It takes only a few minutes to perform the experiment; thus evaporation of the liquid is negligible.
000 fps. We used 0.24 wt% and 14 wt% solution of ionic surfactant TTAB (tetradecyl trimethyl ammonium bromide) in glycerol and deionized water. The critical micelle concentration of TTAB is about 0.12 wt%.27 In order to investigate the difference in behavior due to the difference in viscosity, we use two concentrations: 17 wt% glycerol and 75 wt% glycerol. All experiments use a solution of 14 wt% TTAB and 17 wt% glycerol unless otherwise stated. In addition, to confirm the dependence on the surfactant type, we use 2 wt% solution of nonionic surfactant C10E3 (triethylene glycol monododecyl ether). We also use an aqueous solution of household detergents (CHAMY, Lion Co., Japan), diluted to 25% with deionized water. For the collapse of liquid films in a quasi two-dimensional foam, the sample thickness h is set to 1.1 mm or 2.1 mm by using a spacer. We also use a h = 9.1 mm cell that can create foams of several bubbles thick to see the collapse of the liquid film in a three-dimensional foam. We took images using a high speed camera (KEYENCE, VW-9000, Japan). The liquid fraction is obtained using ϕ = Vliquid/Vfoam = m/ρhSfoam, where Vliquid, Vfoam, m, ρ, h, and Sfoam are the volume of liquid, the volume of the foam, the mass of liquid, the density of the liquid, the sample cell thickness and the area of the foam, respectively.15 In this calculation of ϕ, we took into account for the liquid on the plates. Sfoam is measured from the top view of the foam, and m is obtained by measuring the mass of liquid. The mean liquid fraction of the foam is 0.003–0.035. We note that at h = 9.1 mm, the liquid fraction has a local distribution due to liquid drainage. It takes only a few minutes to perform the experiment; thus evaporation of the liquid is negligible.
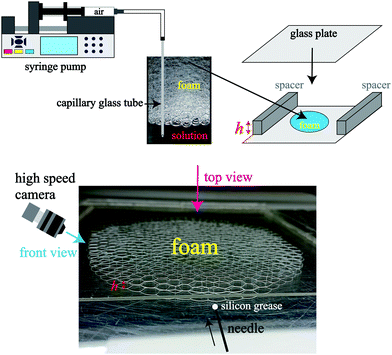 | ||
| Fig. 1 Schematic of the experimental setup. The sample cell (Hele-Shaw cell) thickness h is controlled by using the spacers. | ||
3 Results and discussion
3.1 An overview of liquid film collapse in a foam
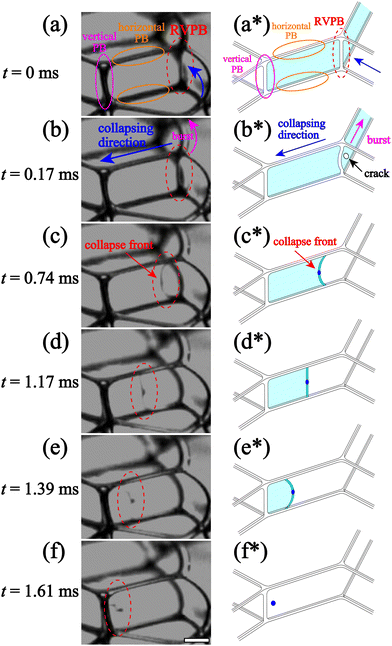
We perform in situ observation of liquid film breaking in a foam confined in a Hele-Shaw cell with thickness h. Fig. 2 shows enlarged images of liquid film breakage over time and the emission of a droplet during a CBC event, from time t = 0 ms to 1.61 ms at liquid fraction ϕ = 0.0090 the thickness of the sample cell h is 2.1 mm [see the ESI,† Movie S1]. We puncture a bubble on the outside of the foam using a capillary glass needle with a small amount of silicon grease on the tip.15 The liquid film on the perimeter of the foam bursts in the same way as an isolated liquid film, with a velocity of V > 20 m s−1, consistent with the Taylor–Culick velocity (∼25 m s−1). After it ruptures, vertical PBs connected with the film are released from tension since one of the three liquid films connected to the PB is no longer there (Fig. 2(a)). We call these Released Vertical PBs (RVPBs). We note that each RVPB is still connected to the other two liquid films at t = 0 ms in Fig. 2(a). In most cases, due to the impact of the collapse, a crack forms near the RVPB which propagates collapse fronts both towards and away from the RVPB (Fig. 2(b*)). The front moving away from the RVPB travels quickly, leading to a ‘burst’ mode of collapse for one of the two remaining films. The front which reaches out to the RVPB transports the liquid in the PB, effectively leading to a migrating RVPB (Fig. 2(b) and (c)). The focus of this study is this migrating RVPB, and the dynamics of how this leads to the final collapse of the film. Note that all future references to a collapse front refer to the motion of the RVPB after crack formation, unless otherwise stated. It is particularly interesting to note how the shape of the front changes as it migrates. The mean curvature just after the RVPB is released is negative as seen from the liquid side (Fig. 2(c)); it then becomes flat as the collapse progresses (Fig. 2(d)); as it goes further, the curvature in fact becomes positive (Fig. 2(e)). Finally, the liquid aggregated at the center of the RVPB forms droplets (Fig. 2(f)) which are subsequently emitted. These emitted droplets induce the penetrating mode of CBC found in previous work.15 The reversal of the curvature of the RVPB and the emission of droplets are both not seen during the rupture of a single liquid film in both inertial and viscous regimes.21,233.2 Oscillation of the RVPB
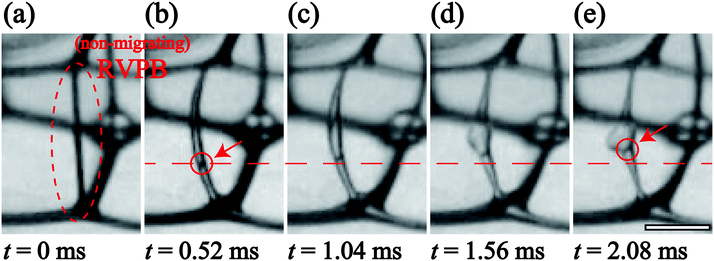
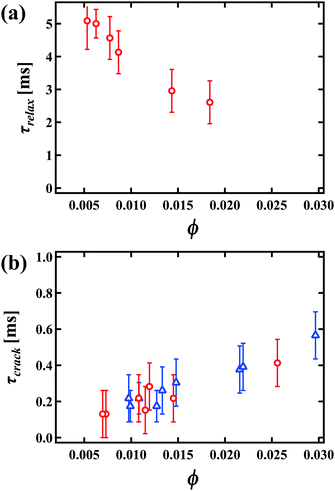
To understand the key characteristics of this collapse process, we focus on each step over the time series separately. Firstly, we consider the oscillation of the RVPB just after the breakage of the first bubble on the perimeter of the foam. Fig. 3(a)–(e) shows enlarged images of the RVPB dynamics caused by the impact of the first liquid film breaking, from time t = 0 ms to 2.08 ms at ϕ = 0.012 and h = 2.1 mm [see the ESI,† Movie S2]. To quantitatively investigate this dynamics without considering RVPB migration, we start by studying a case where the initial breakage does not induce crack formation in the two remaining liquid films i.e. the RVPB stays in the same position. As shown in Fig. 3 and the ESI,† Movie S2, it is found that the RVPB moves with a large amplitude perpendicular to the film, and that a pool of liquid is created at the center of the RVPB. The red circles shown in Fig. 3(b) and (e) indicate an impurity which happened to be inside the RVPB; this impurity is observed to move toward the center, clearly indicating a flow towards the center of the RVPB. In addition, we observe that the liquid aggregating at the center starts to relax and flow to the upper or lower PB after some critical time [see the ESI† Movie S3]. We define a relaxation time τrelax when the size of the liquid at the center becomes the same as that before the collapse. Fig. 4(a) shows τrelax as a function of ϕ for h = 2.1 mm. We see that τrelax decreases with increasing ϕ. We also find that τrelax at ϕ = 0.0090 is larger than the typical time scale over which a liquid film breaks with a migrating RVPB i.e.Fig. 2. This indicates that the velocity at which liquid is absorbed back into the top or bottom PB is lower than that of liquid film breakage due to a migrating RVPB for lower ϕ.We discuss why liquid is transported to the center of the RVPB. When a PB is released by the collapse of the connected liquid film, the RVPB is largely stretched perpendicular to the film, particularly the center part of the RVPB (Fig. 3(a) and (b)). We consider that the inertia may induce the transport of liquid to the center of the RVPB when the RVPB is stretched by the impact. In addition, PBs at the second plane also oscillate and then the liquid slightly aggregates at the center of the PB even though those PBs are in equilibrium. For higher ϕ, it is expected that the amplitude of the stretching becomes smaller and the inertial effect of transporting liquid to the center of the RVPB becomes weaker as the RVPB increases in mass i.e. τrelax becomes shorter.
Next, we quantitatively characterize the oscillation of the RVPB. There have been several studies on the oscillating PB.28,29 It is known that in the oscillation of a single PB isolated on a rigid frame, the scaling fR3/2 ∼ 46 mm3/2 s−1 is provided between the frequency f and the size of PB R.29 As shown in the ESI,† Movie S2, the time in Fig. 3(a)–(e) is a relaxation process, that is, the equilibrium position is shifted. After reaching the equilibrium position, the RVPB oscillates and we measure the half period of the frequency. By using f = 384 Hz, R = 0.1 mm at ϕ = 0.012, we obtain fR3/2 ∼ 12.1 mm3/2 s−1. This is almost consistent with the scaling within the measurement error range. We note that the oscillation of the PBs at the second plane is almost the same as that at the first plane. It also supports that the scaling holds in our system. Derec et al. also stated that the oscillation of the single PB is dominated by the inertia in high frequency.29 This supports our results; the transport of liquid to the center of the RVPB is caused by the inertia.
Having studied the oscillation in depth, we proceed to describe the microscopic dynamics of the first phase of the collapse, from crack formation to when the collapse front becomes flat. Fig. 4(b) shows the relationship between τcrack and ϕ, where τcrack corresponds to the time from when the oscillation starts to when the liquid film breaks (propagating mode) i.e. t = 0.17 ms in Fig. 2(b). The time it takes for a crack to emerge in the liquid film is much earlier than τrelax. Then it seems that the oscillation stops due to the impact of cracking. The motion of the RVPB changes after the emergence of the crack; it migrates parallel to the liquid film, distinct from the perpendicular oscillation of the RVPB shown in Fig. 3. We also find that the transportation of liquid in the RVPB only occurs up to τcrack. The amount of liquid at the center hardly changes from τcrack until the curvature of the collapse front becomes flat at τflat. We note here that the error bars in Fig. 4(a) and (b) come from the measurement error in each experiment.
3.3 Dynamics of the migrating RVPB
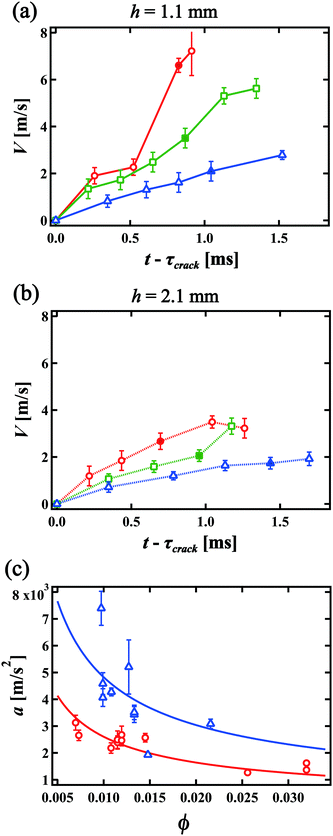
We consider the velocity of the migrating front in the film. Fig. 5(a) and (b) show the velocity of the center of the collapse front V as a function of time t for h = 1.1 mm and h = 2.1 mm, respectively. Red circles, green squares and blue triangles in Fig. 5(a) and (b) indicate the velocity for ϕ = 0.0097, 0.011 and 0.015 and for ϕ = 0.0070, 0.014 and 0.025, respectively. The filled symbols indicate the velocity at which the front becomes flat. The error bars in Fig. 5(a) and (b) come from the time resolution. We find that V increases with time and that V is smaller for higher ϕ and larger h. Again, this is different from the constant velocity observed in the breakage of a single liquid film, following the Taylor–Culick velocity. We note that the propagation of the rim of the original crack might look similar to an isolated liquid film, but that the thickness of the liquid film in the foam for lower ϕ is much thinner. Thus, the effect of the liquid in the original rim is negligible compared to the mass of the RVPB and the positive acceleration causes. We obtain the acceleration of the collapse front at the center a from linear fits in Fig. 5(a) and (b). Fig. 5(c) shows the relationship between a and ϕ. The blue triangles and red circles give the accelerations for h = 1.1 mm and 2.1 mm, respectively.In our previous study, we were unable to capture the collapse velocity of the liquid film due to the lack of time resolution, so the dynamics were only discussed using the terminal velocity.15 In this study, we find that the collapse front of the RVPB moves with constant acceleration. Thus, we theoretically revisit the dynamics of the collapsing liquid film. The driving forces of the collapse are the negative pressure P in the foam and the surface tension γ of the liquid film acting on the RVPB. We ignore the air resistance since the front moves with a constant acceleration as shown in Fig. 5(a) and (b). We then assume that the mass of the RVPB is constant since the mass at the center of the RVPB does not change from τcrack to τflat. We consider the central part of the RVPB to be composed of thin disks with thickness dh, diameter dc and mass dM, respectively. We obtain the equation of motion
| (dM)a = 2γdh + Pδdh, | (1) |
 | (2) |
By using γ = 37 mN m−1, ρ = 1032 kg m−3, dc = 0.15 mm at ϕ ≃ 0.01, we obtain a ≃ 4 × 10³ m s−2. This is consistent with the order of magnitude of a obtained from the experiment as shown in Fig. 5(c). Next, we discuss ϕ and h dependence of a. As discussed above, the liquid in the RVPB is aggregated at the center after τcrack. For the sake of simplicity, we assume that the liquid forms a sphere of diameter dc. We then obtain dc3 ∼ hrPB2 from the volume conservation of the RVPB. It is also known that rPB is proportional to ϕ0.5.30–32 Thus, from eqn (2), the acceleration adrop becomes
 | (3) |
The blue and red lines in Fig. 5(c) are fits to a = A(h)ϕ−2/3 for h = 1.1 mm and 2.1 mm, respectively, where A(h) is a fitting parameter. We obtain A(1.1) = 224 and A(2.1) = 121 and find that the value of A(1.1)/A(2.1) = 1.85 is close to (1.1/2.1)−2/3 = 1.54. Thus, we conclude that the dynamics of the liquid film collapse via a migrating RVPB is mainly determined by the mass of the RVPB and the surface tension of the liquid film.
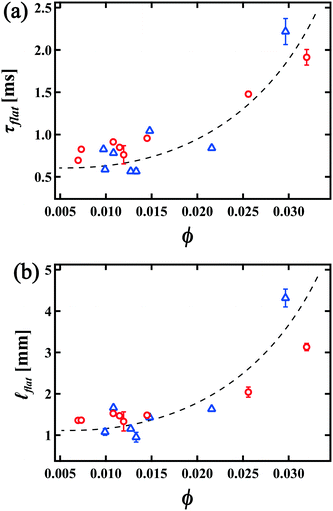
We also consider the time evolution of the curvature of the collapse front. At first, the curvature of the collapse front is negative as seen from the liquid. Its absolute value gradually decreases until it finally becomes flat. Here we estimate the time it takes for the front to become flat, τflat, and the distance it moves ![[small script l]](https://www.rsc.org/images/entities/i_char_e146.gif) flat. When the RVPB begins to migrate, the mass of the liquid at the center of the RVPB is larger than that at the top and the bottom edges. Meanwhile, the driving force acting on the RVPB is mainly the surface tension, which is uniform at any point on the RVPB. Thus, the edge of the RVPB is accelerated more than the center. We define the position and thickness of the collapse front at the center to be xc and dc, and at the edge, xe and de, respectively. The distance Δx between the center and the edge of the collapse front at a certain time t is expressed as
flat. When the RVPB begins to migrate, the mass of the liquid at the center of the RVPB is larger than that at the top and the bottom edges. Meanwhile, the driving force acting on the RVPB is mainly the surface tension, which is uniform at any point on the RVPB. Thus, the edge of the RVPB is accelerated more than the center. We define the position and thickness of the collapse front at the center to be xc and dc, and at the edge, xe and de, respectively. The distance Δx between the center and the edge of the collapse front at a certain time t is expressed as
 | (4) |
 | (5) |
![[small script l]](https://www.rsc.org/images/entities/i_char_e146.gif) flat = Δx0 + 4γτflat2/πρdc2 ≃ 0.9 mm by using dc = 0.15 mm, de = 0.1 mm and Δx0 = 0.5 mm at ϕ ≃ 0.01. These are approximately consistent with the experimental results, τflat = 0.7 ms and
flat = Δx0 + 4γτflat2/πρdc2 ≃ 0.9 mm by using dc = 0.15 mm, de = 0.1 mm and Δx0 = 0.5 mm at ϕ ≃ 0.01. These are approximately consistent with the experimental results, τflat = 0.7 ms and ![[small script l]](https://www.rsc.org/images/entities/i_char_e146.gif) flat = 1.1 mm. We also show the ϕ dependence of τflat and
flat = 1.1 mm. We also show the ϕ dependence of τflat and ![[small script l]](https://www.rsc.org/images/entities/i_char_e146.gif) flat in Fig. 6(a) and (b). The error bar in Fig. 6(a) and (b) corresponds to the measurement error in each experiment. It is found that both τflat and
flat in Fig. 6(a) and (b). The error bar in Fig. 6(a) and (b) corresponds to the measurement error in each experiment. It is found that both τflat and ![[small script l]](https://www.rsc.org/images/entities/i_char_e146.gif) flat increase as ϕ increases. This behavior is consistent with our predictions; for greater ϕ, since the oscillation of the RVPB becomes smaller, the mass difference between the center and edge of the RVPB also becomes smaller. Furthermore, we notice that when τcrack is occasionally longer than usual, the collapse front becomes flat earlier and droplets are emitted diagonally to the direction of the liquid film as shown in the ESI,† Movie S4. This behavior is also in agreement with the theoretical prediction that more liquid moves to the center of the RVPB for greater τcrack due to a larger oscillation of the RVPB; the collapse front then becomes flat at smaller τflat. Droplets are emitted away from the direction of motion since the center of the RVPB is off-axis with respect to the horizontal PBs above and below.
flat increase as ϕ increases. This behavior is consistent with our predictions; for greater ϕ, since the oscillation of the RVPB becomes smaller, the mass difference between the center and edge of the RVPB also becomes smaller. Furthermore, we notice that when τcrack is occasionally longer than usual, the collapse front becomes flat earlier and droplets are emitted diagonally to the direction of the liquid film as shown in the ESI,† Movie S4. This behavior is also in agreement with the theoretical prediction that more liquid moves to the center of the RVPB for greater τcrack due to a larger oscillation of the RVPB; the collapse front then becomes flat at smaller τflat. Droplets are emitted away from the direction of motion since the center of the RVPB is off-axis with respect to the horizontal PBs above and below.
After the curvature becomes flat, the center of the collapse front becomes round immediately, forming droplets. We propose that a Rayleigh–Plateau instability occurs due to the surface tension i.e. the shape of the liquid pool changes from a saddle to a sphere. We sometimes observe that one large droplet and one small droplet are generated. This is a typical feature of a Rayleigh–Plateau instability. In addition, the time scale of this instability is estimated to be 0.31 ms using  ,33 which is in good agreement with our experimental results.
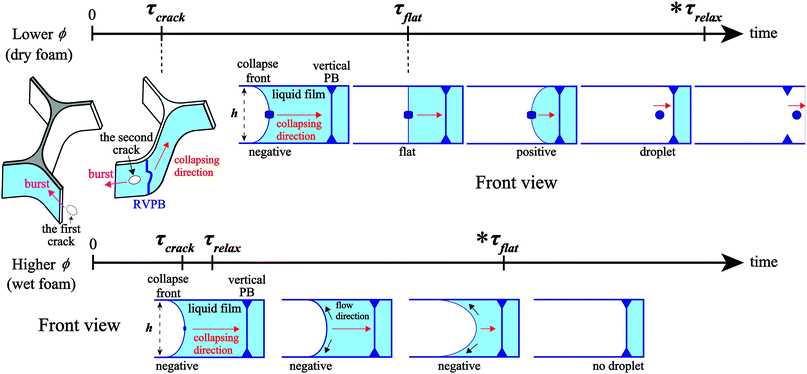
We summarize the above in the schematic in Fig. 7, also taking what happens for a wetter foam into consideration. In the dry foams studied here, the time evolution is in the order τcrack < τflat < τrelax. τflat is an important time scale for CBC since the penetrating mode is induced by the emission of droplets generated by a Rayleigh–Plateau instability; the Rayleigh–Plateau instability only occurs after the front becomes flat. As ϕ increases, the oscillation of the RVPB becomes smaller and τrelax becomes shorter, while τflat becomes longer since the mass difference between the center and the edge of the RVPB becomes smaller. As the foam gets wetter, there comes a point where τrelax < τflat. In fact, in preliminary experiments on wet foams, we observe that the liquid in the upper and lower horizontal Plateau regions increases after τrelax during the collapse, something not seen in the dry foam. In this case, the collapse front does not become flat, and droplets are not generated. More quantitative experiments and discussions are needed in the future to address the dry–wet crossover.
3.4 Generality of the liquid film collapse in a foam
Finally, we consider the generality of this phenomenon. We observe the collapse of the liquid film in a three-dimensional foam by using a cell with h = 9.1 mm that can contain several bubbles in the thickness direction (see the ESI,† Movie S5). In three dimensions, both the collapse of the liquid film and droplet formation are observed, similar to the quasi-two dimensional case. In the quasi-2D foam, horizontal PBs were fixed by a non-slip boundary;11 in the 3D foam, both horizontal and vertical PBs are free, with slip boundaries. Thus, we observe that horizontal PBs also oscillate with a large amplitude during the collapse. As we expected, we find that liquid films tend to collapse into droplets earlier than for quasi-2D, although it is difficult to demonstrate this quantitatively. We also investigate the highly viscous case by using a 75 wt% solution of glycerol compared with the 17 wt% solution used previously. We observe both the collapse of the liquid film and droplet formation for ϕ < 0.03; but as ϕ increases, droplet formation becomes much less likely than for 17 wt%. This is the effect of viscosity, weakening the influence of the overshoot due to inertia. So far, we have investigated the case in 14 wt% ionic surfactant TTAB, which is well above the critical micelle concentration (∼0.12 wt%27). Several recent works have shown that the concentration and the type of surfactant play a significant role in foam stability.24,25 Thus, we investigate the lower surfactant concentration case by using a 0.24 wt% solution of TTAB. As shown in the ESI,† Movie S6 (for ϕ = 0.0056), we see that the curvature of the collapse front becomes flat and the droplets have emerged. Those dynamics are the same as in 14 wt% TTAB. We also investigated the nonionic surfactant case by using a 2 wt% solution of C10E3 (triethylene glycol monododecyl ether). As shown in the ESI,† Movie S7 (for ϕ = 0.023), we see the same collapse dynamics in the liquid film with TTAB.We also tried household detergents instead of TTAB, confirming the oscillation of the RVPB (see the ESI,† Movie S8); we see the same aggregation of liquid at the center of the RVPBs due to the oscillation with TTAB, although liquid film breakage does not occur. For CBC, the RVPB should be released and migrate towards other PBs. To be released, two cracks need to be formed in a row (see Fig. 7), however, this event rarely occurs and it is hard to observe it. Here, it is worth noting that the amount of liquid aggregating at the center is less for the household detergent system. It is reported that foams composed of the household detergent show robust viscoelastic rheology, distinct from the foams made by TTAB.34 Furthermore, we externally develop the crack by bursting a bubble at the outside of the foam in this study. In real applications, the bursting bubble will possibly be located somewhere deep inside the foam, surrounded on all sides by bubbles. Then, we investigate the collapse of the liquid film inside the foam by using 0.24 wt% solution of TTAB when a bubble inside the foam naturally bursts. As shown in the ESI,† Movie S9, when a bubble bursts, we see the same aggregation process of liquid at the center of the non-moving RVPBs. Thus, the collapse of the liquid film with the migrating RVPB could be observed if the burst at the first liquid film causes a crack on the second liquid film near the RVPB.
3.5 Stability of the foams
In the end, following our experimental results, we discuss the stability of the foams. In our previous study, we clarified how CBC occurs,15 whereas the mechanism of the droplet emission, which is a condition for CBC to occur, has been unclear. In this study, we find that there are two physical conditions under which CBC occurs. One is that two cracks need to be formed in a row in order to release the RVPB (see Fig. 7). The other is that the curvature of the RVPB needs to be reversed during the liquid film collapse. Here we consider that the viscoelastic properties of the liquid surface and the chemical mixture of proteins may be effective for preventing cracking (see the household detergent case) and they also may affect the magnitude of the oscillation of the RVPB, which changes the amount of liquid aggregating at the center, and then the time τflat slows down. It is expected that the relationship between the physical properties and the effect of the chemical additives will be clarified in the near future.4 Conclusions
To summarize, we quantitatively investigate the collapse process of liquid films in a foam using a high-speed camera. When a bubble at the outside of the foam is burst, we find that RVPBs connected to it begin to oscillate, and that this oscillation causes abnormal liquid transport toward the center of the RVPB due to an inertial force. After a crack is formed near the RVPB and the RVPB starts migrating with the collapse front, we find that the curvature of the front reverses due to the mass difference between the center and the edge of the RVPB. Droplets are subsequently formed due to a Rayleigh–Plateau instability; these droplets are then emitted, inducing the penetrating mode of CBC. When the liquid fraction increases, it is found that both τflat and![[small script l]](https://www.rsc.org/images/entities/i_char_e146.gif) flat increase. Then the emission of the droplet does not occur if τflat > τrelax for high ϕ. For household detergents, it is expected that CBC is less likely to occur as the cracking of the liquid film is suppressed by the viscoelasticity of the solution.
flat increase. Then the emission of the droplet does not occur if τflat > τrelax for high ϕ. For household detergents, it is expected that CBC is less likely to occur as the cracking of the liquid film is suppressed by the viscoelasticity of the solution.
From our observations, there are two physical conditions under which CBC occurs. One is that two cracks need to be formed in a row in order to release the RVPB. The other is that the curvature of the RVPB needs to be reversed during the liquid film collapse. We believe that these findings make progress in our understanding of the liquid film collapse and the foam stability. Since foams are ubiquitously observed in nature, both in biological systems and industrial products, these findings with respect to the mechanism of the collapse and the foam stability may lead to new applications with product longevity and tailoring physical properties.
Conflicts of interest
There are no conflicts of interest to declare.Acknowledgements
N. Y. was supported by the JSPS Research Fellowship for Young Scientists (20J11840). R. K. was supported by JSPS KAKENHI (17H02945) and (20H01874). M. T. was supported by JSPS KAKENHI (20K14431).References
- D. L. Weaire and S. Hutzler, The physics of foams, Clarendon Press, Oxford, 1999 Search PubMed.
- I. Cantat, S. Cohen-Addad, F. Elias, F. Graner, R. Höhler, O. Pitois, F. Rouyer and A. Saint-Jalmes, Foams: structure and dynamics, Oxford University Press, Oxford, 2013 Search PubMed.
- J. Lauridsen, M. Twardos and M. Dennin, Phys. Rev. Lett., 2002, 89, 098303 CrossRef.
- M. L. Merrer, S. Cohen-Addad and R. Höhler, Phys. Rev. Lett., 2012, 108, 188301 CrossRef.
- B. Dollet and C. Raufaste, C. R. Phys., 2014, 15, 731–747 CrossRef CAS.
- Y. Furuta, N. Oikawa and R. Kurita, Sci. Rep., 2016, 6, 37506 CrossRef CAS.
- R. Kurita, Y. Furuta, N. Yanagisawa and N. Oikawa, Phys. Rev. E, 2017, 95, 062613 CrossRef.
- A. Kusaka, J. Sonoda, H. Tajima and T. Sakai, J. Phys. Chem. B, 2018, 122, 9786–9791 CrossRef CAS.
- N. Taccoen, B. Dollet and C. N. Baroud, Phys. Rev. Lett., 2019, 123, 238006 CrossRef CAS.
- N. D. Denkov, K. G. Marinova and S. S. Tcholakova, Adv. Colloid Interface Sci., 2014, 206, 57–67 CrossRef CAS.
- S. Arif, J.-C. Tsai and S. Hilgenfeldt, EPL, 2010, 92, 38001 CrossRef.
- W. Müller and J. D. Meglio, J. Phys.: Condens. Matter, 1999, 11, L209 CrossRef.
- N. Vandewalle, J. F. Lentz, S. Dorbolo and F. Brisbois, Phys. Rev. Lett., 2001, 86, 179 CrossRef CAS.
- N. Vandewalle and J. Lentz, Phys. Rev. E: Stat., Nonlinear, Soft Matter Phys., 2001, 64, 021507 CrossRef CAS.
- N. Yanagisawa and R. Kurita, Sci. Rep., 2019, 9, 1–9 CrossRef CAS.
- F. Culick, J. Appl. Phys., 1960, 31, 1128–1129 CrossRef.
- I. Ivanov, Thin liquid films, CRC Press, New York and Basel, 1988, vol. 29 Search PubMed.
- G. Debrégeas, P.-G. D. Gennes and F. Brochard-Wyart, Science, 1998, 279, 1704–1707 CrossRef.
- F. Müller, U. Kornek and R. Stannarius, Phys. Rev. E: Stat., Nonlinear, Soft Matter Phys., 2007, 75, 065302 CrossRef.
- J. C. Bird, R. De Ruiter, L. Courbin and H. A. Stone, Nature, 2010, 465, 759–762 CrossRef CAS.
- P. Petit, M. L. Merrer and A.-L. Biance, J. Fluid Mech., 2015, 774, R3 CrossRef.
- S. Poulain, E. Villermaux and L. Bourouiba, J. Fluid Mech., 2018, 851, 636–671 CrossRef CAS.
- M. Murano and K. Okumura, Phys. Rev. Fluids, 2018, 3, 031601 CrossRef.
- S. Sett, R. Sahu, D. Pelot and A. Yarin, Langmuir, 2014, 30, 14765–14775 CrossRef CAS.
- S. Sett, S. I. Karakashev, S. K. Smoukov and A. L. Yarin, Adv. Colloid Interface Sci., 2015, 225, 98–113 CrossRef CAS.
- A. Anazadehsayed, N. Rezaee, J. Naser and A. V. Nguyen, Adv. Colloid Interface Sci., 2018, 256, 203–229 CrossRef CAS.
- K. D. Danov, P. A. Kralchevsky and K. P. Ananthapadmanabhan, Adv. Colloid Interface Sci., 2014, 206, 17–45 CrossRef CAS.
- A. Cohen, N. Fraysse and C. Raufaste, Phys. Rev. Lett., 2017, 119, 238001 CrossRef.
- C. Derec, V. Leroy, D. Kaurin, L. Arbogast, C. Gay and F. Elias, EPL, 2015, 112, 34004 CrossRef.
- S. A. Koehler, S. Hilgenfeldt and H. A. Stone, Langmuir, 2000, 16, 6327–6341 CrossRef CAS.
- A.-L. Biance, A. Delbos and O. Pitois, Phys. Rev. Lett., 2011, 106, 068301 CrossRef.
- I. B. Salem, I. Cantat and B. Dollet, J. Fluid Mech., 2013, 714, 258–282 CrossRef.
- P.-G. De Gennes, F. Brochard-Wyart and D. Quéré, Capillarity and wetting phenomena: drops, bubbles, pearls, waves, Springer Science & Business Media, New York, 2013 Search PubMed.
- S. Frazier, X. Jiang and J. C. Burton, Phys. Rev. Fluids, 2020, 5, 013304 CrossRef.
Footnote |
| † Electronic supplementary information (ESI) available. See DOI: 10.1039/d0sm02153a |
| This journal is © The Royal Society of Chemistry 2021 |

