 Open Access Article
Creative Commons Attribution 3.0 Unported Licence
Impact of the number of rhamnose moieties of rhamnolipids on the structure, lateral organization and morphology of model biomembranes
Marius
Herzog
a,
Lei
Li
a,
Christian C.
Blesken
b,
Gina
Welsing
b,
Till
Tiso
 b,
Lars M.
Blank
 *b and
Roland
Winter
 *a
*a
aPhysical Chemistry I – Biophysical Chemistry, Faculty of Chemistry and Chemical Biology, TU Dortmund University, Otto-Hahn Street 4a, 44227 Dortmund, Germany. E-mail: roland.winter@tu-dortmund.de
biAMB – Institute of Applied Microbiology, ABBt – Aachen Biology and Biotechnology, RWTH Aachen University, Worringerweg 1, 52074 Aachen, Germany. E-mail: lars.blank@rwth-aachen.de
First published on 17th February 2021
Abstract
Various studies have described remarkable biological activities and surface-active properties of rhamnolipids, leading to their proposed use in a wide range of industrial applications. Here, we report on a study of the effects of monorhamnolipid RhaC10C10 and dirhamnolipid RhaRhaC10C10 incorporation into model membranes of varying complexity, including bacterial and heterogeneous model biomembranes. For comparison, we studied the effect of HAA (C10C10, lacking a sugar headgroup) partitioning into these membrane systems. AFM, confocal fluorescence microscopy, DSC, and Laurdan fluorescence spectroscopy were employed to yield insights into the rhamnolipid-induced morphological changes of lipid vesicles as well as modifications of the lipid order and lateral membrane organization of the model biomembranes upon partitioning of the different rhamnolipids. The partitioning of the three rhamnolipids into phospholipid bilayers changes the phase behavior, fluidity, lateral lipid organization and morphology of the phospholipid membranes dramatically, to what extent, depends on the headgroup structure of the rhamnolipid, which affects its packing and hydrogen bonding capacity. The incorporation into giant unilamellar vesicles (GUVs) of a heterogeneous anionic raft membrane system revealed budding of domains and fission of daughter vesicles and small aggregates for all three rhamnolipids, with major destabilization of the lipid vesicles upon insertion of RhaC10C10, and also formation of huge GUVs upon the incorporation of RhaRhaC10C10. Finally, we discuss the results with regard to the role these biosurfactants play in biology and their possible impact on applications, ranging from agricultural to pharmaceutical industries.
Introduction
Rhamnolipids were described for the first time in 19491 and are currently being developed as a “green replacement” for chemical surfactants due to their great performance as biosurfactants, the possibility of carbon neutral production, combined with lower toxicity, higher biodegradability, and higher ecological safety in comparison to synthetic surfactants from fossil resources.2–8 Rhamnolipids are naturally produced by mainly beta- and gamma-proteobacteria9,10 and are a diverse group of surface-active glycolipids, which self-assemble in water,11 with currently up to 60 congeners characterized in the literature.5 In general, their amphiphilic structure divides into a hydrophilic part, consisting of one or two rhamnose units linked by an α-1,2-glycosidic linkage, and a hydrophobic part, mostly composed of one or two esterified β-hydroxy-fatty acids.5,7,12–14 The high structural diversity of different rhamnolipid molecules arises from the numerous combinations of the number of rhamnose moieties and aliphatic chains, as well as the number of carbon atoms of each aliphatic chain and the degree of chain saturation.15–25 These structural differences have a pronounced influence on their biophysical properties, including the critical micelle concentration, surface tension, biological activity, and ability to insert into phospholipid membranes.26–28As described previously,29 the partitioning behavior of mono- and dirhamnolipids into lipid membranes are comparable. Mono- and dirhamnolipids cause a distortion of the packing of the phospholipid's acyl chains, resulting in a reduced cooperativity of the gel-to-fluid phase transition and an increase of the headgroup hydration. Despite this similarity, the dirhamnolipids show a more distinct effect, which is attributable to their additional rhamnose unit.30–34 Opposing effects were observed upon insertion of mono- and dirhamnolipids into phosphatidylethanolamine membranes. Here, dirhamnolipids stabilized, and monorhamnolipids destabilized lamellar lipid structures.35–38 In a previous study, we found that the insertion of monorhamnolipids into phospholipid bilayers induced significant changes in the lateral organization, and morphology of the lipid bilayer. Also a monorhamnolipid-induced budding and fission of vesicles with a leakage of the vesicle interior was observed.29
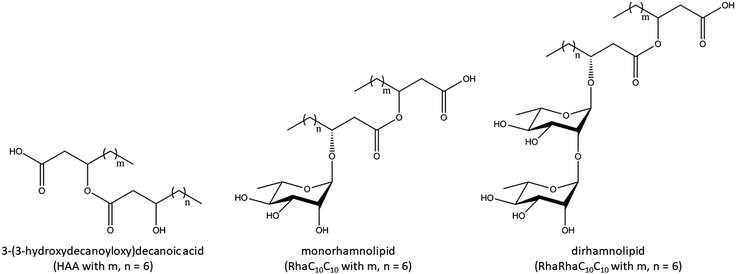
The influence of the number of rhamnose units of rhamnolipids on the physico-chemical properties of phospholipid membranes is still largely unknown. Hence, we set out and investigated the impact of a dirhamnolipid (RhaRhaC10C10), a monorhamnolipid (RhaC10C10), and the precursor of the rhamnolipids, the 3-(3-hydroxydecanoyloxy)decanoic acid (HAA) on model lipid membranes of varying complexity. The chemical structures are shown in Fig. 1. Three different lipid bilayer systems, DPPC, DOPE![[thin space (1/6-em)]](https://www.rsc.org/images/entities/char_2009.gif) :
:![[thin space (1/6-em)]](https://www.rsc.org/images/entities/char_2009.gif) DPPG (2
DPPG (2![[thin space (1/6-em)]](https://www.rsc.org/images/entities/char_2009.gif) :
:![[thin space (1/6-em)]](https://www.rsc.org/images/entities/char_2009.gif) 1 molar ratio) and DPPC
1 molar ratio) and DPPC![[thin space (1/6-em)]](https://www.rsc.org/images/entities/char_2009.gif) :
:![[thin space (1/6-em)]](https://www.rsc.org/images/entities/char_2009.gif) DPPG
DPPG![[thin space (1/6-em)]](https://www.rsc.org/images/entities/char_2009.gif) :
:![[thin space (1/6-em)]](https://www.rsc.org/images/entities/char_2009.gif) DOPC
DOPC![[thin space (1/6-em)]](https://www.rsc.org/images/entities/char_2009.gif) :
:![[thin space (1/6-em)]](https://www.rsc.org/images/entities/char_2009.gif) DOPG
DOPG![[thin space (1/6-em)]](https://www.rsc.org/images/entities/char_2009.gif) :
:![[thin space (1/6-em)]](https://www.rsc.org/images/entities/char_2009.gif) cholesterol (45
cholesterol (45![[thin space (1/6-em)]](https://www.rsc.org/images/entities/char_2009.gif) :
:![[thin space (1/6-em)]](https://www.rsc.org/images/entities/char_2009.gif) 5
5![[thin space (1/6-em)]](https://www.rsc.org/images/entities/char_2009.gif) :
:![[thin space (1/6-em)]](https://www.rsc.org/images/entities/char_2009.gif) 20
20![[thin space (1/6-em)]](https://www.rsc.org/images/entities/char_2009.gif) :
:![[thin space (1/6-em)]](https://www.rsc.org/images/entities/char_2009.gif) 5
5![[thin space (1/6-em)]](https://www.rsc.org/images/entities/char_2009.gif) :
:![[thin space (1/6-em)]](https://www.rsc.org/images/entities/char_2009.gif) 25 molar ratio) were investigated in a temperature and rhamnolipid-concentration dependent manner. The results show, to our knowledge for the first time, a distinct influence of the sugar units of rhamnolipids on the structure, fluidity, lateral organization, and morphology of lipid bilayer membranes.
25 molar ratio) were investigated in a temperature and rhamnolipid-concentration dependent manner. The results show, to our knowledge for the first time, a distinct influence of the sugar units of rhamnolipids on the structure, fluidity, lateral organization, and morphology of lipid bilayer membranes.
Material and methods
Chemicals
All phospholipids, 1,2-dipalmitoyl-sn-glycero-3-phosphocholine (DPPC), 1,2-dipalmitoyl-sn-glycero-3-phospho-(10-rac-glycerol) sodium salt (DPPG), 1,2-dioleoyl-sn-glycero-3-phosphocholine (DOPC), and 1,2-dioleoyl-sn-glycero-3-phospho-(10-rac-glycerol) sodium salt (DOPG) were obtained from Avanti Polar Lipids (Alabaster, AL), and cholesterol was purchased from Sigma-Aldrich (Steinheim, Germany). The lipids were used without further purification. The fluorescent dyes for the confocal fluorescence microscopy measurements, N-(lissamine rhodamine B sulfonyl)-1,2-dihexadecanoyl-sn-glycero-3-phosphoethanolamine triethylammonium salt (N-Rh-DHPE) and N-(7-nitrobenz-2-oxa-1,3-diazol-4-yl)-1,2-dihexadecanoyl-sn-glycero-3-phosphoethanolamin (NBD-DHPE), were purchased from Molecular Probes (Invitrogen, California, USA), and Atto 647-Carboxy was obtained from ATTO-TEC (Siegen, Germany). Laurdan, used in the fluorescence spectroscopy measurements, was obtained from Sigma-Aldrich (St. Louis, USA). As buffer, 10 mM HEPES (Sigma-Aldrich, St. Louis, USA) was chosen (pH 7.4), except for the AFM-measurements, which required a buffer consisting of 20 mM TRIS and 5 mM MgCl2 (pH 7.4). The measurements were reproduced at least three times by use of separately prepared samples.α-L-Rhamnopyranosyl-β-hydroxydecanoyl-β-hydroxy-decanoate (RhaC10C10), 2-O-α-L-rhamnopyra-nosyl-α-L-rhamnopyranosyl-β-hydroxydecanoyl-β-hydroxydecanoate (RhaRhaC10C10) and 3-(3-hydroxydecanoyloxy)decanoate (HAA) were obtained, characterized and purified by a combination of an adsorption/desorption and preparative liquid chromatography as described before.7,39 Briefly, after protein precipitation, the supernatant was adsorbed using the silica adsorbent AA12SA5 (YMC Europe GmbH Dinslaken, Germany). Subsequently, desorption was carried out with ethanol. The supernatant was separated and the ethanol evaporated. For the chromatographic separation, a preparative HPLC system consisting of the AZURA pump P6.1L and the AZURA autosampler 3950 (both Knauer GmbH, Berlin, Germany) connected to the SEDEX 58 LT-ELSD detector (SEDERE Olivet, France) and the fraction collector Foxy R1 (Teledyne ISCO Lincoln, USA) using a VP250/21 NUCLEODUR C18 HTec column (Macherey-Nagel GmbH & Co. KG, Düren, Germany) was employed. The flow rate was set to 10 mL min−1 and the used running buffers were acetonitrile and ultra-pure water supplied with 0.2% (v/v) formic acid. As a final step, the solvents were evaporated to achieve the pure product.
GUV and MLV preparation
Multilamellar vesicles (MLVs) were prepared by the freeze and thaw method. The required amount of lipids was dissolved in chloroform and mixed. After that, the chloroform was evaporated by a gently stream of nitrogen gas and remaining chloroform was removed by lyophilization for at least 2 hours. The dry lipid films were dissolved in the necessary amount of buffer and placed in an ultrasonic bath for 25 min at 70 °C. Thereafter, the lipids were frozen in liquid nitrogen and thawed. Both steps were repeated 5 times to obtain fully hydrated multilamellar vesicles.Giant unilamellar vesicles (GUVs) were prepared by using the electroformation as well as the PVA (polyvinyl alcohol)-assisted method. For both techniques, the required amount of each lipid was mixed by using 10 mg mL−1 stock solutions to obtain 100 μL of 1 mg mL−1 concentrated lipid solution. The fluorescently labeled lipids were added at a concentration of 0.1 mol% to achieve a ratio of unlabeled to labeled lipid of 500![[thin space (1/6-em)]](https://www.rsc.org/images/entities/char_2009.gif) :
:![[thin space (1/6-em)]](https://www.rsc.org/images/entities/char_2009.gif) 1. Atto-647 was used at a concentration of 5 μM in buffer solution.
1. Atto-647 was used at a concentration of 5 μM in buffer solution.
Electroformation was carried out as described in ref. 40, applying a constant frequency of 500 Hz and an alternating electric field of 0.14 V (5 min), 1.25 V (20 min) and 3.5 V (90 min). The PVA-assisted method was performed as described in ref. 41 and 42.
DSC
Differential scanning calorimetry (DSC) measurements were performed using a TA Instrument (New Castle, DE) Q20 differential scanning calorimeter. To this end, 20 μL of each lipid sample and the same volume of pure buffer in the reference cell were heated up from 20 to 55 °C with a heating rate of 1 °C min−1.Fluorescence spectroscopy
Information about the temperature-induced changes of the membrane fluidity and the lipid order parameter of the lipid membranes were obtained by Laurdan-based fluorescence spectroscopy measurements, which were performed on a K2 multifrequency phase and modulation fluorometer (ISS Inc., Urbana, IL). Three different lipid systems, DPPC, DOPE![[thin space (1/6-em)]](https://www.rsc.org/images/entities/char_2009.gif) :
:![[thin space (1/6-em)]](https://www.rsc.org/images/entities/char_2009.gif) DPPG (2
DPPG (2![[thin space (1/6-em)]](https://www.rsc.org/images/entities/char_2009.gif) :
:![[thin space (1/6-em)]](https://www.rsc.org/images/entities/char_2009.gif) 1 molar ratio) and DPPC
1 molar ratio) and DPPC![[thin space (1/6-em)]](https://www.rsc.org/images/entities/char_2009.gif) :
:![[thin space (1/6-em)]](https://www.rsc.org/images/entities/char_2009.gif) DPPG
DPPG![[thin space (1/6-em)]](https://www.rsc.org/images/entities/char_2009.gif) :
:![[thin space (1/6-em)]](https://www.rsc.org/images/entities/char_2009.gif) DOPC
DOPC![[thin space (1/6-em)]](https://www.rsc.org/images/entities/char_2009.gif) :
:![[thin space (1/6-em)]](https://www.rsc.org/images/entities/char_2009.gif) DOPG
DOPG![[thin space (1/6-em)]](https://www.rsc.org/images/entities/char_2009.gif) :
:![[thin space (1/6-em)]](https://www.rsc.org/images/entities/char_2009.gif) cholesterol (45
cholesterol (45![[thin space (1/6-em)]](https://www.rsc.org/images/entities/char_2009.gif) :
:![[thin space (1/6-em)]](https://www.rsc.org/images/entities/char_2009.gif) 5
5![[thin space (1/6-em)]](https://www.rsc.org/images/entities/char_2009.gif) :
:![[thin space (1/6-em)]](https://www.rsc.org/images/entities/char_2009.gif) 20
20![[thin space (1/6-em)]](https://www.rsc.org/images/entities/char_2009.gif) :
:![[thin space (1/6-em)]](https://www.rsc.org/images/entities/char_2009.gif) 5
5![[thin space (1/6-em)]](https://www.rsc.org/images/entities/char_2009.gif) :
:![[thin space (1/6-em)]](https://www.rsc.org/images/entities/char_2009.gif) 25 molar ratio), in the following referred to as 5 CS, were investigated in a temperature and rhamnolipid/HAA-concentration dependent manner. Different concentrations of the rhamnolipids and HAA were incorporated into the MLVs during preparation. The fluorescent dye Laurdan, which is sensitive to the environmental solvation conditions, was inserted in the MLVs at a concentration of 1 mM (ratio of lipids to Laurdan: 1
25 molar ratio), in the following referred to as 5 CS, were investigated in a temperature and rhamnolipid/HAA-concentration dependent manner. Different concentrations of the rhamnolipids and HAA were incorporated into the MLVs during preparation. The fluorescent dye Laurdan, which is sensitive to the environmental solvation conditions, was inserted in the MLVs at a concentration of 1 mM (ratio of lipids to Laurdan: 1![[thin space (1/6-em)]](https://www.rsc.org/images/entities/char_2009.gif) :
:![[thin space (1/6-em)]](https://www.rsc.org/images/entities/char_2009.gif) 0.000735) and excited at a wavelength of 390 nm. By use of the generalized polarization function, GP = (IB − IR)/(IB + IR), the spectral changes were analyzed. IB refers to the fluorescence intensity at 440 nm, which is characteristic for a gel/ordered lipid phase and IR can be assigned to the fluid/liquid-disordered phase with a fluorescence intensity maximum at 490 nm. More detailed information and a description of the sample preparation can be found in ref. 43 and 44.
0.000735) and excited at a wavelength of 390 nm. By use of the generalized polarization function, GP = (IB − IR)/(IB + IR), the spectral changes were analyzed. IB refers to the fluorescence intensity at 440 nm, which is characteristic for a gel/ordered lipid phase and IR can be assigned to the fluid/liquid-disordered phase with a fluorescence intensity maximum at 490 nm. More detailed information and a description of the sample preparation can be found in ref. 43 and 44.
Confocal fluorescence microscopy
The laser combiner Oxxius Simply Light, L4Cc-CSB-130 (Lannion, France) and the objective lens type CFI Plan Apochromat Lambda 100× Oil, NA 1.45, WD 0.13 (Nikon, Tokyo, Japan) were used for the confocal fluorescence microscopy detection. Before adding the 0.1 mg mL−1 concentrated rhamnolipid- or HAA-solution via syringe, samples containing Atto-647-Carboxy were rinsed several times with neat buffer.AFM
For the atomic force microscopy (AFM) measurements of DPPC![[thin space (1/6-em)]](https://www.rsc.org/images/entities/char_2009.gif) :
:![[thin space (1/6-em)]](https://www.rsc.org/images/entities/char_2009.gif) DPPG
DPPG![[thin space (1/6-em)]](https://www.rsc.org/images/entities/char_2009.gif) :
:![[thin space (1/6-em)]](https://www.rsc.org/images/entities/char_2009.gif) DOPC
DOPC![[thin space (1/6-em)]](https://www.rsc.org/images/entities/char_2009.gif) :
:![[thin space (1/6-em)]](https://www.rsc.org/images/entities/char_2009.gif) DOPG
DOPG![[thin space (1/6-em)]](https://www.rsc.org/images/entities/char_2009.gif) :
:![[thin space (1/6-em)]](https://www.rsc.org/images/entities/char_2009.gif) cholesterol (45
cholesterol (45![[thin space (1/6-em)]](https://www.rsc.org/images/entities/char_2009.gif) :
:![[thin space (1/6-em)]](https://www.rsc.org/images/entities/char_2009.gif) 5
5![[thin space (1/6-em)]](https://www.rsc.org/images/entities/char_2009.gif) :
:![[thin space (1/6-em)]](https://www.rsc.org/images/entities/char_2009.gif) 20
20![[thin space (1/6-em)]](https://www.rsc.org/images/entities/char_2009.gif) :
:![[thin space (1/6-em)]](https://www.rsc.org/images/entities/char_2009.gif) 5
5![[thin space (1/6-em)]](https://www.rsc.org/images/entities/char_2009.gif) :
:![[thin space (1/6-em)]](https://www.rsc.org/images/entities/char_2009.gif) 25 molar ratio) and DPPC
25 molar ratio) and DPPC![[thin space (1/6-em)]](https://www.rsc.org/images/entities/char_2009.gif) :
:![[thin space (1/6-em)]](https://www.rsc.org/images/entities/char_2009.gif) DPPG
DPPG![[thin space (1/6-em)]](https://www.rsc.org/images/entities/char_2009.gif) :
:![[thin space (1/6-em)]](https://www.rsc.org/images/entities/char_2009.gif) DOPC
DOPC![[thin space (1/6-em)]](https://www.rsc.org/images/entities/char_2009.gif) :
:![[thin space (1/6-em)]](https://www.rsc.org/images/entities/char_2009.gif) DOPG
DOPG![[thin space (1/6-em)]](https://www.rsc.org/images/entities/char_2009.gif) :
:![[thin space (1/6-em)]](https://www.rsc.org/images/entities/char_2009.gif) cholesterol
cholesterol![[thin space (1/6-em)]](https://www.rsc.org/images/entities/char_2009.gif) :
:![[thin space (1/6-em)]](https://www.rsc.org/images/entities/char_2009.gif) rhamnolipid/HAA (40.5
rhamnolipid/HAA (40.5![[thin space (1/6-em)]](https://www.rsc.org/images/entities/char_2009.gif) :
:![[thin space (1/6-em)]](https://www.rsc.org/images/entities/char_2009.gif) 4.5
4.5![[thin space (1/6-em)]](https://www.rsc.org/images/entities/char_2009.gif) :
:![[thin space (1/6-em)]](https://www.rsc.org/images/entities/char_2009.gif) 18
18![[thin space (1/6-em)]](https://www.rsc.org/images/entities/char_2009.gif) :
:![[thin space (1/6-em)]](https://www.rsc.org/images/entities/char_2009.gif) 4.5
4.5![[thin space (1/6-em)]](https://www.rsc.org/images/entities/char_2009.gif) :
:![[thin space (1/6-em)]](https://www.rsc.org/images/entities/char_2009.gif) 22.5
22.5![[thin space (1/6-em)]](https://www.rsc.org/images/entities/char_2009.gif) :
:![[thin space (1/6-em)]](https://www.rsc.org/images/entities/char_2009.gif) 10 molar ratio) system, MLVs were prepared as described above at a total lipid concentration of 1.94 mg mL−1. After that, the lipid solution was extruded 20 times through polycarbonate membranes (nominal pore size of 100 nm) at a temperature of 75 °C. 30 μL of the sample solution and 40 μL TRIS buffer were pipetted onto a freshly cleaved mica surface and incubated in a wet chamber for 2 h at 80 °C to achieve vesicle fusion. Unfused vesicles were removed by careful washing with buffer. To the neat five-component (5 CS) membrane, 0.1 mg mL−1 rhamnolipid- or HAA-solution was added via syringe. A MultiMode scanning probe microscope with a NanoScope IIIa controller (Digital Instruments, Santa Barbara, CA) and a J-Scanner with a scan size of 125 μm were used for imaging at room temperature. The samples were scanned in liquid with a sharp nitride cantilever (SNL) via tapping mode in a fluid cell (MTFML, Veeco Instruments (now Bruker), Mannheim, Germany) by use of tips with a nominal force constant of 0.35 N m−1. The drive amplitude was between 300 and 850 mV, the driving frequency was about 9 kHz and the scan frequency was 1 Hz. The analysis was performed with NanoScope version 5.3.1 and imageJ. A detailed description can be found in ref. 43 and 45.
10 molar ratio) system, MLVs were prepared as described above at a total lipid concentration of 1.94 mg mL−1. After that, the lipid solution was extruded 20 times through polycarbonate membranes (nominal pore size of 100 nm) at a temperature of 75 °C. 30 μL of the sample solution and 40 μL TRIS buffer were pipetted onto a freshly cleaved mica surface and incubated in a wet chamber for 2 h at 80 °C to achieve vesicle fusion. Unfused vesicles were removed by careful washing with buffer. To the neat five-component (5 CS) membrane, 0.1 mg mL−1 rhamnolipid- or HAA-solution was added via syringe. A MultiMode scanning probe microscope with a NanoScope IIIa controller (Digital Instruments, Santa Barbara, CA) and a J-Scanner with a scan size of 125 μm were used for imaging at room temperature. The samples were scanned in liquid with a sharp nitride cantilever (SNL) via tapping mode in a fluid cell (MTFML, Veeco Instruments (now Bruker), Mannheim, Germany) by use of tips with a nominal force constant of 0.35 N m−1. The drive amplitude was between 300 and 850 mV, the driving frequency was about 9 kHz and the scan frequency was 1 Hz. The analysis was performed with NanoScope version 5.3.1 and imageJ. A detailed description can be found in ref. 43 and 45.
Results and discussion
Following previous approaches,29 we studied the interaction of both purified HAA and two rhamnolipids of different headgroup with homogeneous DPPC-containing model membranes as well as a heterogeneous anionic “raft”-like model membrane46 by applying calorimetric, spectroscopic, and microscopic techniques.Calorimetry (DSC)
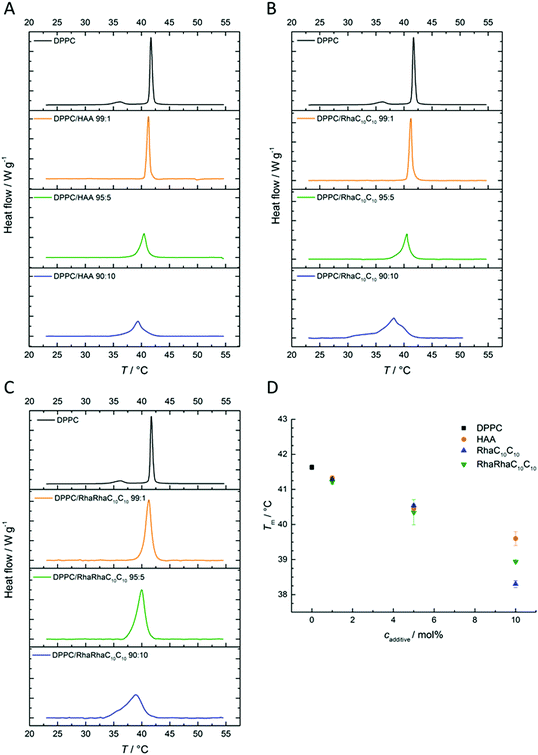
To gain insights into the thermodynamic properties of the phase transitions of the lipid bilayer membranes in the presence and absence of the three rhamnolipids, DSC measurements were carried out. We first discuss the influence of 1, 5, and 10 mol% HAA, RhaC10C10, and RhaRhaC10C10 on the phase transition temperature of MLVs consisting of pure DPPC (Fig. 2).The DSC-thermogram of the pure DPPC shows a pretransition from the Lβ to the Pβ′gel phase at 36.0 ± 0.5 °C and the gel-to-fluid main transition temperature (Pβ′- to Lα-phase) at 41.6 ± 0.1 °C. Up to a concentration of 5 mol%, the three rhamnolipids show a similar behavior. The pretransitional DSC peak disappears at 1 mol% of incorporated rhamnolipid, and the main transition temperature decreases slightly with increasing additive concentration, from 41.6 ± 0.1 °C to 39.6 ± 0.2 °C for 10 mol% HAA, to 38.3 ± 0.1 °C for 10 mol% RhaC10C10, and to 38.9 ± 0.1 °C for 10 mol% RhaRhaC10C10. At a concentration of 10 mol% rhamnolipid, the thermograms of all rhamnolipids indicate phase separation evident as shoulders and a significant broadening of the main transition peak.
Fluorescence spectroscopy
To yield complementary information about the lateral order and temperature-induced gel-to-fluid-phase transition, temperature-dependent Laurdan fluorescence spectroscopy measurements with membranes consisting of DPPC alone, a bacterial membrane-mimicking 2![[thin space (1/6-em)]](https://www.rsc.org/images/entities/char_2009.gif) :
:![[thin space (1/6-em)]](https://www.rsc.org/images/entities/char_2009.gif) 1 DOPE
1 DOPE![[thin space (1/6-em)]](https://www.rsc.org/images/entities/char_2009.gif) :
:![[thin space (1/6-em)]](https://www.rsc.org/images/entities/char_2009.gif) DPPG mixture,8 and an anionic heterogeneous five component system (5 CS) (DPPC
DPPG mixture,8 and an anionic heterogeneous five component system (5 CS) (DPPC![[thin space (1/6-em)]](https://www.rsc.org/images/entities/char_2009.gif) :
:![[thin space (1/6-em)]](https://www.rsc.org/images/entities/char_2009.gif) DPPG
DPPG![[thin space (1/6-em)]](https://www.rsc.org/images/entities/char_2009.gif) :
:![[thin space (1/6-em)]](https://www.rsc.org/images/entities/char_2009.gif) DOPC
DOPC![[thin space (1/6-em)]](https://www.rsc.org/images/entities/char_2009.gif) :
:![[thin space (1/6-em)]](https://www.rsc.org/images/entities/char_2009.gif) DOPG
DOPG![[thin space (1/6-em)]](https://www.rsc.org/images/entities/char_2009.gif) :
:![[thin space (1/6-em)]](https://www.rsc.org/images/entities/char_2009.gif) cholesterol; 45
cholesterol; 45![[thin space (1/6-em)]](https://www.rsc.org/images/entities/char_2009.gif) :
:![[thin space (1/6-em)]](https://www.rsc.org/images/entities/char_2009.gif) 5
5![[thin space (1/6-em)]](https://www.rsc.org/images/entities/char_2009.gif) :
:![[thin space (1/6-em)]](https://www.rsc.org/images/entities/char_2009.gif) 20
20![[thin space (1/6-em)]](https://www.rsc.org/images/entities/char_2009.gif) :
:![[thin space (1/6-em)]](https://www.rsc.org/images/entities/char_2009.gif) 5
5![[thin space (1/6-em)]](https://www.rsc.org/images/entities/char_2009.gif) :
:![[thin space (1/6-em)]](https://www.rsc.org/images/entities/char_2009.gif) 25) were performed. First, the results for the DPPC MLVs upon addition of 1, 5, 10 and 20 mol% of the corresponding rhamnolipid are discussed (Fig. 3).
25) were performed. First, the results for the DPPC MLVs upon addition of 1, 5, 10 and 20 mol% of the corresponding rhamnolipid are discussed (Fig. 3).
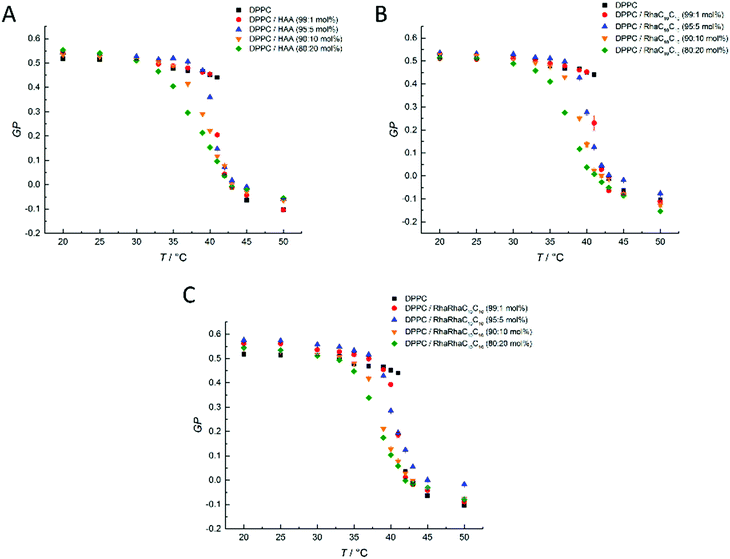 | ||
Fig. 3 Temperature-dependent GP-values of (A) HAA![[thin space (1/6-em)]](https://www.rsc.org/images/entities/char_2009.gif) : :![[thin space (1/6-em)]](https://www.rsc.org/images/entities/char_2009.gif) DPPC, (B) RhaC10C10 DPPC, (B) RhaC10C10![[thin space (1/6-em)]](https://www.rsc.org/images/entities/char_2009.gif) : :![[thin space (1/6-em)]](https://www.rsc.org/images/entities/char_2009.gif) DPPC, and (C) RhaRhaC10C10 DPPC, and (C) RhaRhaC10C10![[thin space (1/6-em)]](https://www.rsc.org/images/entities/char_2009.gif) : :![[thin space (1/6-em)]](https://www.rsc.org/images/entities/char_2009.gif) DPPC-containing MLVs at concentration ratios of 0 DPPC-containing MLVs at concentration ratios of 0![[thin space (1/6-em)]](https://www.rsc.org/images/entities/char_2009.gif) : :![[thin space (1/6-em)]](https://www.rsc.org/images/entities/char_2009.gif) 100, 1 100, 1![[thin space (1/6-em)]](https://www.rsc.org/images/entities/char_2009.gif) : :![[thin space (1/6-em)]](https://www.rsc.org/images/entities/char_2009.gif) 99, 5 99, 5![[thin space (1/6-em)]](https://www.rsc.org/images/entities/char_2009.gif) : :![[thin space (1/6-em)]](https://www.rsc.org/images/entities/char_2009.gif) 95, 10 95, 10![[thin space (1/6-em)]](https://www.rsc.org/images/entities/char_2009.gif) : :![[thin space (1/6-em)]](https://www.rsc.org/images/entities/char_2009.gif) 90 and 20 90 and 20![[thin space (1/6-em)]](https://www.rsc.org/images/entities/char_2009.gif) : :![[thin space (1/6-em)]](https://www.rsc.org/images/entities/char_2009.gif) 80 mol%. 80 mol%. | ||
At low temperatures, pure DPPC displays nearly constant GP-values of about 0.5, which indicates that the membrane is in an ordered gel phase. In this state, the membrane has a high lipid order parameter and the acyl chains mostly adopt the all-trans conformation. This state supports a less polar Laurdan environment in the upper chain region, resulting in an increased fluorescence emission at 440 nm. Between 41 and 42 °C, a relatively sharp transition from high to low GP-values is observed. At temperatures above the gel-to-fluid transition temperature, Tm, the membrane reaches an all-fluid phase with a low lateral lipid order parameter owing to a high mobility and conformational disorder of the acyl chains, which results from an entropically favored large number of gauche conformers and kinks. In this state, water can easily penetrate the upper region of the bilayer, leading to an increase of the fluorescence intensity of Laurdan at 490 nm and a concomitant decrease of the GP-values. Similar to the DSC measurements, the results for HAA, RhaC10C10 and RhaRhaC10C10 are almost identical. A difference can be seen in the fluid phase, where HAA and RhaRhaC10C10 cause a concentration-independent increase of the GP-values, whereas the RhaC10C10 tends to lower them. In the gel phase, the RhaRhaC10C10 seems to cause a small increase in the lateral order at low concentrations. and Tm decreases upon addition of the rhamnolipids, similar to what was seen in the DSC measurements. However, no dramatic differences were observed between HAA, RhaC10C10 and RhaRhaC10C10 regarding their effect on the overall lipid order and fluidity of the one-component phospholipid membrane DPPC.
Next, we discuss the results for the DOPE![[thin space (1/6-em)]](https://www.rsc.org/images/entities/char_2009.gif) :
:![[thin space (1/6-em)]](https://www.rsc.org/images/entities/char_2009.gif) DPPG bacterial model membrane system. For the DOPE
DPPG bacterial model membrane system. For the DOPE![[thin space (1/6-em)]](https://www.rsc.org/images/entities/char_2009.gif) :
:![[thin space (1/6-em)]](https://www.rsc.org/images/entities/char_2009.gif) DPPG (2
DPPG (2![[thin space (1/6-em)]](https://www.rsc.org/images/entities/char_2009.gif) :
:![[thin space (1/6-em)]](https://www.rsc.org/images/entities/char_2009.gif) 1 mol%)-system (Fig. 4), an almost linear decrease of the GP-values from 5 to 45 °C is observed for the lipid system without added rhamnolipids. Above 45 °C, approaching an overall fluid-like phase, the slope begins to flatten slightly. This broad phase transition range can be rationalized by the occurrence of phase transformations typical for a binary lipid mixture composed of a high-melting and a low-melting lipid involving different gel and fluid phases.47–49 An incorporation of RhaC10C10 does not change the shape of GP(T). Only HAA and RhaRhaC10C10 cause an increase of the GP-values at temperatures beyond 40 °C, indicating an overall slightly increased lipid order at high temperatures upon addition of these two rhamnolipid species.
1 mol%)-system (Fig. 4), an almost linear decrease of the GP-values from 5 to 45 °C is observed for the lipid system without added rhamnolipids. Above 45 °C, approaching an overall fluid-like phase, the slope begins to flatten slightly. This broad phase transition range can be rationalized by the occurrence of phase transformations typical for a binary lipid mixture composed of a high-melting and a low-melting lipid involving different gel and fluid phases.47–49 An incorporation of RhaC10C10 does not change the shape of GP(T). Only HAA and RhaRhaC10C10 cause an increase of the GP-values at temperatures beyond 40 °C, indicating an overall slightly increased lipid order at high temperatures upon addition of these two rhamnolipid species.
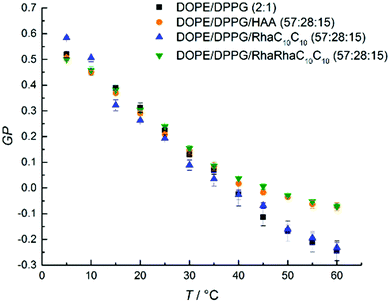 | ||
Fig. 4 Temperature dependent GP-values of HAA-, RhaC10C10- and RhaRhaC10C10-containing MLVs consisting of DOPE![[thin space (1/6-em)]](https://www.rsc.org/images/entities/char_2009.gif) : :![[thin space (1/6-em)]](https://www.rsc.org/images/entities/char_2009.gif) DPPG (2 DPPG (2![[thin space (1/6-em)]](https://www.rsc.org/images/entities/char_2009.gif) : :![[thin space (1/6-em)]](https://www.rsc.org/images/entities/char_2009.gif) 1 mol%). The phase transitions is very broad which is typical for a binary mixture of a high-melting and low-melting lipid, and involves various coexistence regions of gel and fluid-like lipid phases,48,49 the exact phase diagram is not known, however. 1 mol%). The phase transitions is very broad which is typical for a binary mixture of a high-melting and low-melting lipid, and involves various coexistence regions of gel and fluid-like lipid phases,48,49 the exact phase diagram is not known, however. | ||
Finally, we discuss the Laurdan fluorescence spectroscopic data of the heterogeneous 5-component model membrane system (5-CS) in the presence of various concentrations of the incorporated rhamnolipids (Fig. 5). In comparison to the pure DPPC membrane, the pure 5-CS membrane shows a rather broad overall phase transition region from a liquid-ordered (lo) to a liquid-disordered (ld) phase. HAA (Fig. 5A) causes a concentration-dependent drop in Tm and affects the lo-phase by decreasing the lateral order slightly, without largely affecting the lipid order in the ld-phase. RhaC10C10 (Fig. 5B) slightly affects both the ordered phase (decrease in GP-values) and the fluid-like (ld) phase (increase in GP-values). Furthermore, RhaC10C10 causes a broadening of the lo-to-ld phase transition region and slightly shifts the overall phase transition temperature to higher values. This indicates significant changes of the lateral membrane organization. Differences for the different rhamnolipid concentrations can be seen at high temperatures, only. RhaRhaC10C10 (C) increases the order of the disordered phase significantly and in a concentration dependent manner, possibly due to a condensing effect that is caused by the formation of more hydrogen bonds in the headgroup region. This effect can be seen for the RhaC10C10 as well, but it is more pronounced for the RhaRhaC10C10.
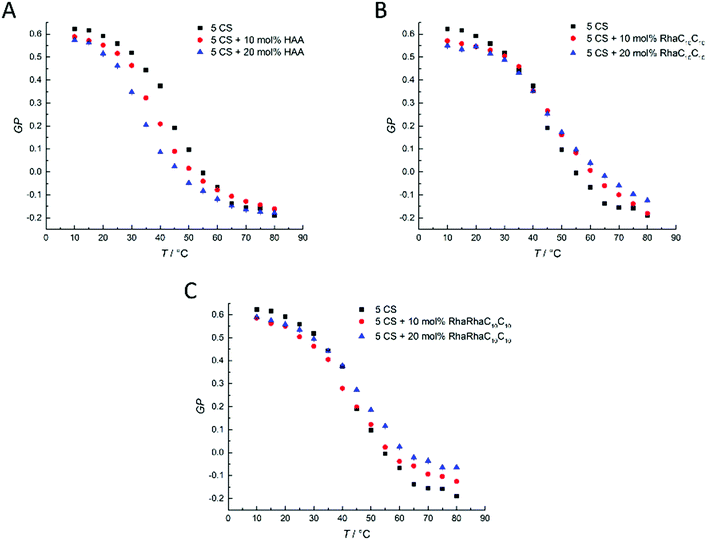 | ||
Fig. 5 Temperature-dependent GP-values of (A) HAA![[thin space (1/6-em)]](https://www.rsc.org/images/entities/char_2009.gif) : :![[thin space (1/6-em)]](https://www.rsc.org/images/entities/char_2009.gif) 5-CS, (B) RhaC10C10 5-CS, (B) RhaC10C10![[thin space (1/6-em)]](https://www.rsc.org/images/entities/char_2009.gif) : :![[thin space (1/6-em)]](https://www.rsc.org/images/entities/char_2009.gif) 5-CS, and (C) RhaRhaC10C10 5-CS, and (C) RhaRhaC10C10![[thin space (1/6-em)]](https://www.rsc.org/images/entities/char_2009.gif) : :![[thin space (1/6-em)]](https://www.rsc.org/images/entities/char_2009.gif) 5-CS MLVs at concentration ratios of 0 5-CS MLVs at concentration ratios of 0![[thin space (1/6-em)]](https://www.rsc.org/images/entities/char_2009.gif) : :![[thin space (1/6-em)]](https://www.rsc.org/images/entities/char_2009.gif) 100, 10 100, 10![[thin space (1/6-em)]](https://www.rsc.org/images/entities/char_2009.gif) : :![[thin space (1/6-em)]](https://www.rsc.org/images/entities/char_2009.gif) 90, 20 90, 20![[thin space (1/6-em)]](https://www.rsc.org/images/entities/char_2009.gif) : :![[thin space (1/6-em)]](https://www.rsc.org/images/entities/char_2009.gif) 80 mol%. 80 mol%. | ||
Of note, FT-IR spectroscopy data of the phospholipids’ C![[double bond, length as m-dash]](https://www.rsc.org/images/entities/char_e001.gif) O groups and TMA-DPH fluorescence polarization results revealed a dehydration effect upon addition of dirhamnolipids, which are able to establish a large number of hydrogen bonds and immobilize the surrounding water molecules, resulting in less free water available for the phospholipids' headgroup hydration. The dehydrated phospholipid head group leads to a rigidification of the interfacial membrane region, which results in an overall rise of the membrane surface hydrophobicity, in accord with our spectroscopic results.30 Such changes may be related to the release of the lipopolysaccharides from the bacterial outer membrane.50 For comparison, the interaction between monorhamnolipids and PC membranes and changes of the hydration state of PC's headgroups are less pronounced than reported for glycolipids with two rhamnose moieties.32 The results published so far do not indicate direct interactions between rhamnolipids and membrane lipids by means of hydrogen bonds.30,31,34,51
O groups and TMA-DPH fluorescence polarization results revealed a dehydration effect upon addition of dirhamnolipids, which are able to establish a large number of hydrogen bonds and immobilize the surrounding water molecules, resulting in less free water available for the phospholipids' headgroup hydration. The dehydrated phospholipid head group leads to a rigidification of the interfacial membrane region, which results in an overall rise of the membrane surface hydrophobicity, in accord with our spectroscopic results.30 Such changes may be related to the release of the lipopolysaccharides from the bacterial outer membrane.50 For comparison, the interaction between monorhamnolipids and PC membranes and changes of the hydration state of PC's headgroups are less pronounced than reported for glycolipids with two rhamnose moieties.32 The results published so far do not indicate direct interactions between rhamnolipids and membrane lipids by means of hydrogen bonds.30,31,34,51
AFM
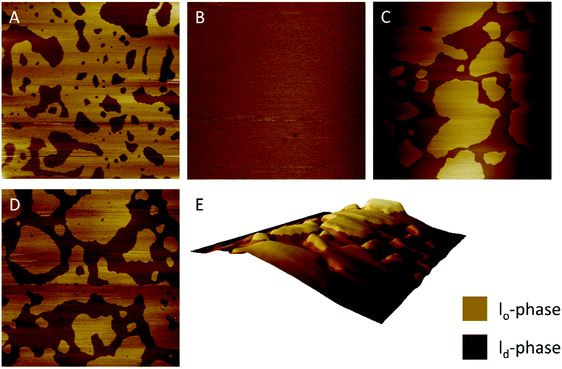
To gain further and high spatial resolution insights into the interactions between the anionic five-component raft mixture and the three rhamnolipids, AFM measurements were carried out. In the surface images obtained of this heterogeneous lipid bilayer, the ordered lo-phase is displayed in a light-brown color, whereas the thinner ld-phase is colored in dark-brown. At room temperature, the main components of the lo-phase are DPPC and cholesterol, whereas the cis-unsaturated DOPC is enriched in the ld-phase.52 Both phases have a difference in their bilayer thickness of about 1 nm.53,54Here, the results for an injection of 0.1 mg mL−1 rhamnolipid-containing buffer solution after preparation of the 5-CS bilayer are shown first. The injection experiments (labelled with a schematic syringe in the corresponding figure) are designed to model the exogenous exposure of rhamnolipids to an already formed membrane. A concentration of 0.1 mg mL−1 was chosen, since the critical micelle concentration of all three substrates is slightly higher (HAA: 0.113 mg mL−1, monorhamnolipid: 1.24 mg mL−1, dirhamnolipid: 1.48 mg mL−1).7 Additionally, a mixture of all three rhamnolipids was employed, referred to Rl-Mix in the following. This mixture consists of 15 mol% HAA, 34 mol% RhaC10C10 and 51 mol% RhaRhaC10C10 and was selected according to published rhamnolipid compositions of various rhamnolipid producers to achieve an almost natural-like mixture.19,34,55–58 The natural rhamnolipid mixtures mostly consist of more than three rhamnolipid congeners, however, which in addition to the number of rhamnose units, also vary in the length of their acyl chains.5Fig. 6 shows the surface images before and after injection of the corresponding rhamnolipid. Since the respective rhamnolipids were injected to bilayers of the 5-CS, which already differed slightly from each other in their height difference between the lo- and ld-domains before addition of the rhamnolipids, the height differences determined between the two phases after adding the corresponding rhamnolipid solution were related to the height differences of the pure 5-CS to allow precise comparability of the different additives. The corresponding height differences are listed in Table 1.
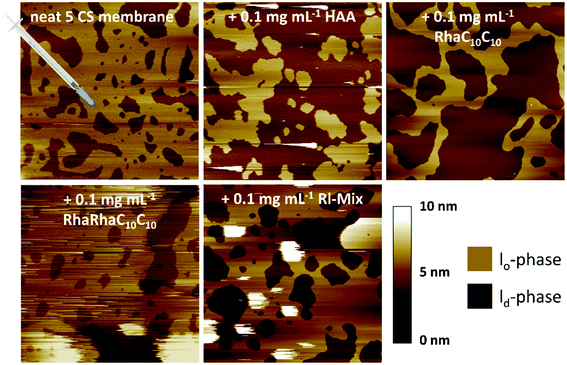 | ||
| Fig. 6 AFM measurements of the pure anionic 5-CS lipid bilayer immediately before and after the injection of 0.1 mg mL−1 HAA, RhaC10C10, RhaRhaC10C10 and Rl-Mix containing buffer solution. | ||
| System | Mean height difference lo-/ld-phase in relation to the pure 5-CS bilayer |
|---|---|
| Pure 5-CS | 0 nm |
| With HAA | + 0.8 ± 0.2 nm |
| With RhaC10C10 | + 1.1 ± 0.1 nm |
| With RhaRhaC10C10 | + 0.0 ± 0.1 nm |
| With Rl-Mix | + 0.5 ± 0.1 nm |
Upon addition of 0.1 mg mL−1 HAA and RhaC10C10 to this 5-component bilayer system, an immediate doubling of the bilayer thickness difference was observed. This suggests an approximately 1 nm thinning of the bilayer thickness due to the partitioning of these rhamnolipids into the fluid lipid phase, since an incorporation into the ld-phase is favored owing to its less dense packing density of the lipid molecules.59–62 Also Come et al. mentioned a higher rate of interaction of rhamnolipids with the ld-phase than with the lo-phase.63 Of note, Abbasi et al. reported a 1 nm increase of the lamellar d-spacing of a DPPC-bilayer in the gel-phase at 25 °C induced by a monorhamnolipid, as measured by SAXS.32 Further, insertion of HAA and RhaC10C10 into the ld-phase seems to increase the line tension at the boundaries of ld and lo domains, which results in a constriction of the lo-phase. Concomitantly, the proportion of ld-phase is observed to increase. In contrast, the RhaRhaC10C10 does not significantly influence the bilayer thickness and rather undisturbed lo- and ld-domains are observed, since their shape and size is similar to that of the untreated 5-CS bilayer. However, the disturbance of the AFM images, indicated by the occurrence of white spots with a height beyond 10 nm in the images, point to formation of large aggregates sitting on top of the bilayer surface. This indicates that RhaRhaC10C10 favors the formation of aggregates, such as micelles, instead of a mere partitioning into the heterogeneous lipid bilayer membrane, as also reported in ref. 64. The injection of the Rl-mixture to the pure 5-CS membrane shows the combined effects of RhaRhaC10C10, RhaC10C10 and HAA. Again, big aggregates are formed (large white patches in the AFM pictures), but now also the bilayer thickness difference increases after addition of the rhamnolipid mixture.
For comparison, membrane systems were also prepared by adding 10 mol% of the rhamnolipids already during preparation of the lipid bilayer, since the concentration of the rhamnolipids within the membrane is not clearly defined, when the rhamnolipids were added after bilayer preparation. In this case, no detachment of aggregates was observed. The surface images obtained are shown in Fig. 7 and the determined relative height differences between the lo- and ld-phases are listed in Table 1, which are quite similar to those obtained after later injection.
Due to the incorporation of 10 mol% rhamnolipids during the preparation, a homogeneous mixing of the lipid components and higher rhamnolipid concentrations inside the membrane are achieved in comparison to the injection to an already formed bilayer as described before. This leads to changes of the domain size distribution. Incorporation of 10 mol% HAA results in a significant reduction of the size of the ld-domains. Disappearance of the phase separation is also described for high cholesterol concentrations (33–50 mol%) in a lipid bilayer, leading to a homogeneous single raft-like lipid phase, while at intermediate cholesterol concentrations, phase separation can be observed and the lo-domains have a more irregularly shape and a greater variation in size.65 Similar to cholesterol, HAA possibly thickens phosphocholine (PC) membranes owing to a rearrangement of the lipids in a more perpendicular manner with respect to the bilayer plane.65 The RhaC10C10 induces a pronounced curvature of the lipid bilayer, most likely due to its cone-shape and lamellar bilayer destabilizing nature.36,66,67 The RhaRhaC10C10 is seen to have a marked effect on the domain size and phase distribution for such preparation conditions.
Confocal fluorescence microscopy
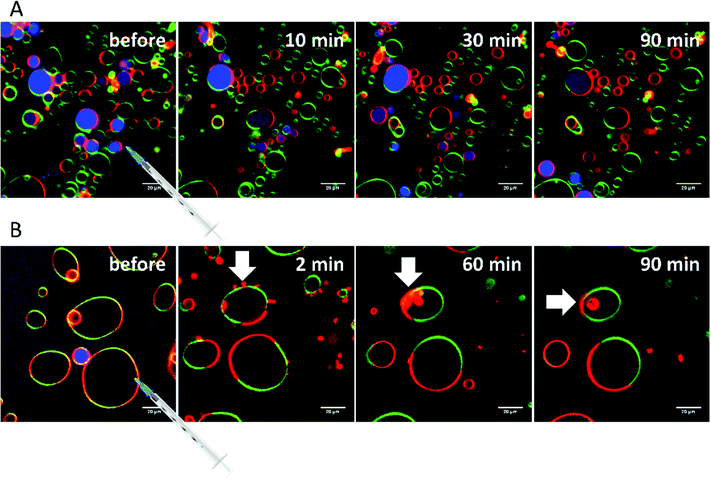
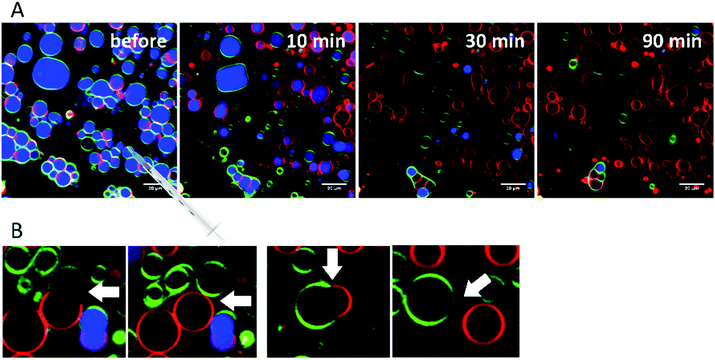
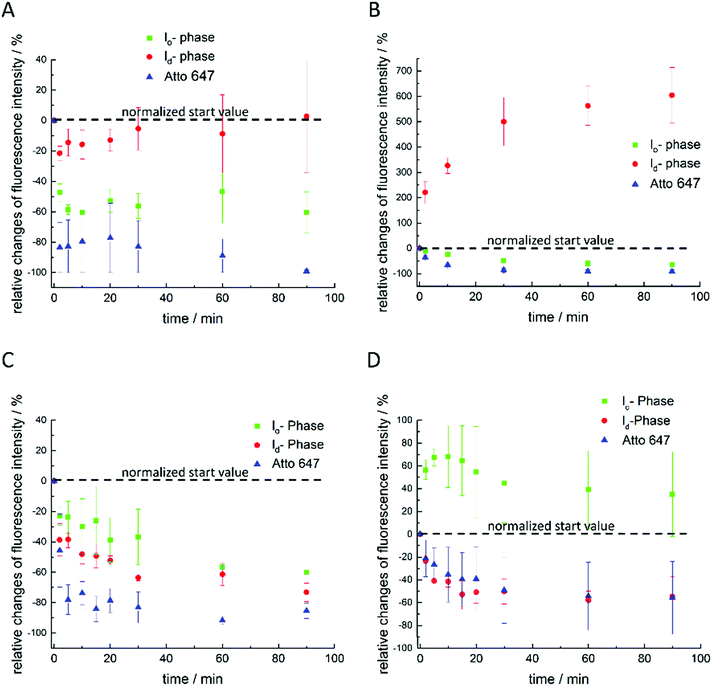
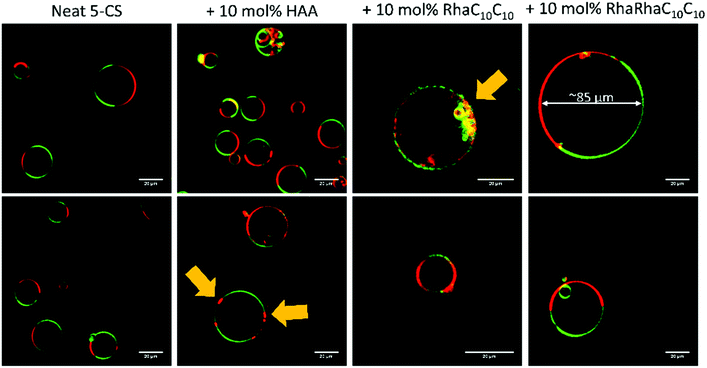
Finally, extensive confocal fluorescence microscopy measurements were carried out to visualize morphological changes on a larger (μm) length scale. To this end, GUVs of the 5-CS, fluorescently labelled with N-Rh-DHPE (ld-phase, red), NBD-DHPE (lo-phase, green) and Atto 647 (vesicles' interior, blue), were imaged after injection of 0.1 mg mL−1 rhamnolipid containing buffer solution (labelled again with a syringe in the figures). Additionally, temperature dependent measurements of the GUVs were performed. Fig. 8 shows representative images of the effect of an injected 0.1 mg mL−1 HAA-solution on 5-CS GUVs. At room temperature, before addition of the HAA solution, the GUVs show the well-known distinct phase separation into ld- (red) and lo-domains (green), and the GUVs are partially filled with Atto 647 (blue). The amount of Atto-filled vesicles depends to a large extent on the preparation procedure and may differ between samples,41 but this does not affect the conclusions drawn. Immediately after injection, the relative amount of both phases decreases, since some of the vesicles were rinsed out during the injection, which can also be observed by addition of pure buffer. The injected HAA causes fission of aggregates or small vesicles, mainly consisting of ld-phase (marked by white arrows, Fig. 8), which diffuse out of the image section depicted. With time, the proportion of both phases stays almost constant after injection of the HAA solution (for quantitative details, see Fig. 12, which indicates which phase is preferably promoted by each rhamnolipid), and after equilibration most vesicles decreased in size and were present either in lo- or in ld-phase. Atto 647 is released, but not completely from all the vesicles.Addition of RhaC10C10 causes a significant increase of the ld-phase area within minutes after injection (2-fold after 2 min, 5- to 6-fold after 90 min) (Fig. 12). Concomitantly, fission of vesicles is observed, resulting in the formation of two daughter vesicles of lo- or ld-phase, only. Additionally, the vesicles appear to be deformed. Atto 647 is released from almost all GUVs (Fig. 9). A detailed discussion of the effect of RhaC10C10 on the raft membrane can be found in ref. 29.
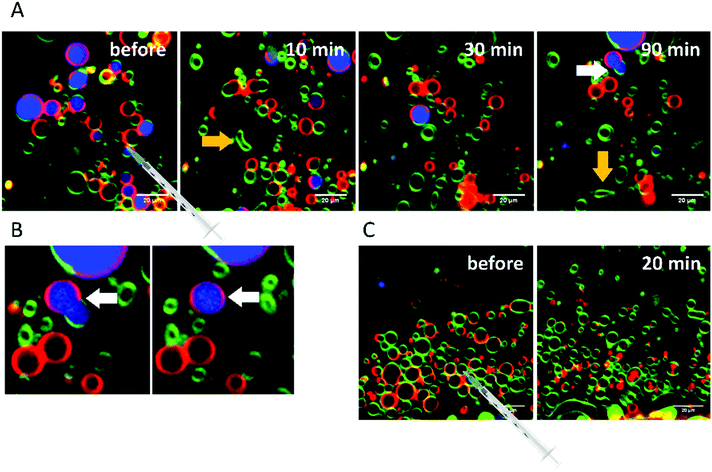
RhaRhaC10C10 causes a decrease in the number of vesicles in the image area over time as they peel off and diffuse through the sample. Similar to RhaC10C10, the vesicles separate into daughter vesicles of different phases (see white arrows in Fig. 10A and B), but in contrast, the Atto 647 generally remains inside the lipid vesicles (Fig. 10B). Furthermore, significant deformation of the vesicles (accompanied by an increase of membrane curvature elasticity) is observed (see yellow arrows in Fig. 10A). Again, after equilibration, most vesicles have decreased in size and consist of lo- or ld-phase, only. Viewed over time, the proportion of both the lo- and ld-phases in the image section decreases in relative terms (Fig. 12), since more and more vesicles detach from the surface. However, most of the remaining vesicles are present in the lo-phase and the number of small vesicles or aggregates increased significantly.
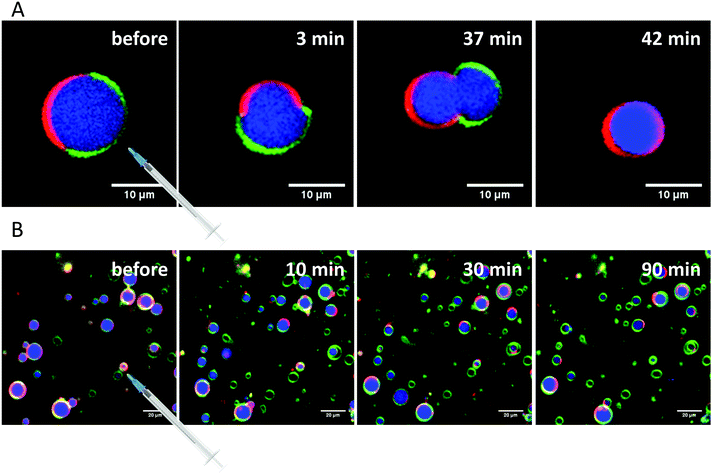
Finally, the influence of a mixture of all three additives on the same heterogeneous GUV system was investigated (Fig. 11). The images largely reflect the effects observed for RhaRhaC10C10, including development of large vesicle deformations. If budding occurs, the Atto 647 remains mostly inside the vesicles. Furthermore, the relative proportion of lo-phase in the image section increases by about 60 to 70%, while the relative proportion of the ld-phase decreases concurrently. After equilibration, the relative amount of both phases stays constant over time. Again, with time, the vesicles decrease in size.
To reach complete initial miscibility of all lipids, 10 mol% of the rhamnolipids were also added to the other lipid components when preparing the GUVs. The vesicles were prepared via the PVA-assisted method and were free to move in solution. This method was chosen, since the preparation by electroformation reduces the quality and size of the GUVs68,69 and vesicle immobilization was not necessary in this case. Additionally, temperature dependent measurements with these systems were carried out. For the temperature-dependent measurements, as for the previously shown measurements with injected rhamnolipids, an immobilization of the GUVs was necessary, which could be achieved through use of the electroformation technique. Details of both methods can be found in ref. 41. Fig. 12 shows the results upon incorporation of all rhamnolipids into GUVs consisting of the 5-CS. At room temperature, the GUVs of the 5-CS are phase separated into lo- and ld-domains and have diameters of 5 to 30 μm (Fig. 13). As also seen in the fluorescence spectroscopy data, the phase transition region is very broad and the overall main transition region to the all-fluid phase extends between 50 and 70 °C.
The incorporation of 10 mol% HAA caused no significant effect on the size and phase separation scenario of the GUVs compared to the neat 5-CS. However, occasionally, budding of ld-domains leading to small aggregates could be observed immediately following preparation. The number of GUVs found in the sample decreased slightly and some GUVs are enclosing aggregates and smaller vesicles. The main phase transition is shifted to lower temperatures, which is in accordance with the fluorescence spectroscopy measurements. Vesicles with incorporated 10 mol% RhaC10C10 were not stable over time. Directly after preparation (at high temperature (60 °C)), huge GUVs could be detected in the sample, which had already started to disintegrate. After some time and cooling down to room temperature, just a few small vesicles and aggregates remained, which might be caused due to the destabilizing and negative curvature-promoting effect of monorhamnolipids.29,36,66 Some vesicles exhibited the ld-phase, only. Further, a slight shift to lower temperature values of the main transition region was observed. The incorporation of 10 mol% RhaRhaC10C10 in the GUVs caused an enormous increase in the vesicle's diameter in comparison to the pure 5-CS GUVs. Most of the vesicles had a diameter above 40 μm up to about 90 μm. This might be explained by the proposed inverted cone shape of dirhamnolipids, which supports the stabilization of lamellar phases and possibly leads to formation of huge GUVs compared to the cone-shaped monorhamnolipids.29,36,66,67 A similar effect of the headgroup's bulkiness was observed for two imidazolium salts differing in the size (methyl- vs. isopropylphenyl-group) of their headgroups.70 Again, the number of vesicles in the samples decreases noticeably in comparison to the pure 5-CS. A significant shift of the main transition temperature range has not been observed.
Conclusions
Partitioning of all three rhamnolipids into phospholipid bilayers markedly changes the phase behavior, lateral lipid organization, and morphology of the phospholipid membranes. Differences between HAA, RhaC10C10, and RhaRhaC10C10 are most significant at higher concentrations, i.e. at and beyond about 10 mol%. In contrast to HAA, increasing concentrations of RhaC10C10 and RhaRhaC10C10 induce noticeable phase separation in one-component membranes (DPPC) and increase the overall lateral order in the fluid phase of the membrane. This effect becomes more pronounced with increasing propensity of the rhamnolipid's headgroup to form hydrogen bonds in the headgroup area (RhaRhaC10C10 > RhaC10C10 > HAA). Although the lateral lipid organization was markedly influenced by the rhamnolipids, the main phase transition still occurred for all investigated lipid systems and was just slightly shifted to lower temperature values.The confocal fluorescence microscopy data showed that the incorporation of the rhamnolipids into GUVs of a heterogeneous anionic raft membrane system leads to drastic morphological changes. Remarkably, all rhamnolipids stimulate domain budding or formation of daughter vesicles of either lo- or ld-phase upon insertion into phospholipid membranes. These findings indicate that the partitioning of the rhamnolipids into heterogeneous membranes leads to a marked increase of the line tension between domains, in that way fostering the propensity for fission of daughter vesicles. Generally, similar results were described by Come et al. (2021)63 and, to the best of our knowledge, has only been observed for rhamnolipids to date. A possible budding effect cannot be excluded for other glycolipid species, however. Next to budding and fission of fluid domains upon insertion of RhaC10C10, significant destabilization of the lipid vesicles occurs, which is accompanied by formation of small vesicles or aggregated structures and a drastic increase of vesicles present in the ld-phase. The incorporation of dirhamnolipids leads to a formation of huge GUVs. After injection, RhaRhaC10C10 induces rapid detachment of small fluid aggregates or vesicles from the coverslip's surface, while the remaining vesicles were almost present in the lo-phase, only. In contrast to the HAA and monorhamnolipid, RhaRhaC10C10 promotes the budding of ld-phase domains and fission into daughter vesicles with no major accompanying leakage of the interior of the lipid vesicles.
Via AFM, i.e. for the solid supported bilayer, a ld-phase-promoting effect was observed for RhaC10C10, accompanied by curvature of the membrane and a further increase of the height difference between the lo- and ld-phase of about 1 nm, again indicating a strong increase in line tension at domain boundaries and hence propensity for curvature and budding. The incorporation of 10 mol% HAA into this 5-CS bilayer membrane revealed a particular strong effect, reminiscent of the influence of high cholesterol concentrations in lipid membranes. The cooperative effect of cholesterol and HAA in the heterogeneous bilayer may cause the increased height difference between the domains and the ld-phase to almost disappear.
The connection of these biophysical results to the biological effects of rhamnolipids is still largely terra incognita. As described above, a change in headgroup size of the rhamnolipids has significant consequences for membrane curvature and integrity. As the microbes identified to produce rhamnolipids are not all ubiquitous like P. aeruginosa (from crude oil fields, via the rhizosphere, to human pathogen), one could speculate that the different environmental niches require different rhamnolipid congeners. Indeed, microbes equipped with the acetyltransferase RhlA only catalyze merely the synthesis of HAAs.10 Other microbes can synthesize monorhamnolipids only, while others, like P. aeruginosa, have the full genetic repertoire for the synthesis of dirhamnolipids. Notably, the latter organism has not a monocistronic operon of all genes involved in rhamnolipid synthesis, like the Burkholderia species, but rather rhlC encoding the rhamnosyltransferase 2 for dirhamnolipid synthesis independent of the other genes. This different genomic arrangement could increase the growth condition-dependent congener production that could foster competitiveness of a ubiquitously free-living organism. Indeed, the many P. aeruginosa studies on rhamnolipid production report differences in the congener distribution, while a full shift to a single head-group configuration is not reported. The chain length of the rhamnolipid moieties of Pseudomonas and Burkholderia do hardly overlap,10 asking for further studies of the molecular consequences of the congener diversity.
The rhamnolipid-caused increase in the membranes’ surface hydrophobicity and budding/fission propensity can possibly explain the rhamnolipid-induced lipopolysaccharide release from natural outer bacterial membranes.50 Based on a hydrophobicity increasing effect by rhamnolipids, a possible defense action for the producing organisms71 has been discussed next to the promotion of growth on hydrophobic surfaces and uptake as well as metabolism of hydrocarbon substrates.72 Rhamnolipids may either cause the cell surface to become hydrophobic, promoting an interaction between the hydrophobic substrate and the cell, or secreted rhamnolipids may emulsify the substrate, e.g. via budding of vesicles and fission of aggregates as observed in our model systems. The data shown here is obtained with rhamnolipids produced, e.g. by P. aeruginosa, a facultative pathogen. In the most prominent infection, this bacterium is causing severe pneumonia in humans with often an underlying lung disease.73 With the data presented here on budding/fission including membrane leakage, one could speculate about another functional role of rhamnolipids, the acquisition of nutrients by host cell lysis. The nutritional scarcity in the extracellular space of a healthy mammal requires pathogens to attack the host. Other roles like facilitating biofilm formation in the hydrophobic environment of the lung surface are well documented. In other environmental niches, like the soil, antimicrobial activity might be a mechanism, too, as we and others reported inhibition of growth of some Gram-positive bacteria, like Corynebacterium glutamicum and Bacillus subtilis.74,75 That rhamnolipids facilitate different functions might be also inferred from their structural diversity, in which the hydroxyl-fatty acid moieties range from C8 to C20.5,10
Biosurfactants, such as rhamnolipids, are in demand for a wide range of industrial applications, such as in the cosmetic industry for products as moisturizers, shampoos, and lubricants, as they increase solubility and foaming capacity and affect surface tension. The information gained here might also be useful for understanding different applications in the agro- and pharmaceutical industry. For example, rhamnolipids could provide an interesting approach in the research for novel efficient antibacterial substances or the design of alternative drug delivery systems. Regarding their potential antimicrobial activity, we have seen that rhamnolipid intercalation into membranes can cause membrane destabilization, disruption, and leakage, hence could cause cell lysis of the host cell. The combination of rhamnolipids with hydrophobic antibiotics could also provide a higher efficiency of drug delivery due to a rhamnolipid-induced increase of the hydrophobicity of the target membrane, which causes a higher susceptibility to the given hydrophobic antibiotic. The high structural diversity of rhamnolipids might allow the design of tailor-made systems with target-coordinated, effective properties.
To conclude, the detailed results discussed here, which illustrate the various strong effects of different rhamnolipids on synthetic membranes, argue for future joint interdisciplinary efforts to investigate biosurfactant membrane interactions. Depending on the biosurfactant's structure, uptake of hydrophobic substances, budding and fission of vesicles and emulsifying aggregates, membrane shedding (which is also reported for quorum sensing molecules),76 changes in membrane elastic properties and hence motility and growth, fusogenic properties, and leakage of membranes (inducing cell lysis) may be promoted. Understanding the ultimate structure–function relationships of these fascinating molecules would help make the variety of biosurfactants and their congeners available for further applications, ranging from such bulk applications as bioremediation of organic and heavy metal polluted suites to antibiotics and tailor-made drug delivery systems.
Conflicts of interest
There are no conflicts to declare.Acknowledgements
R. W. acknowledges funding from the Deutsche Forschungsgemeinschaft (DFG, German Research Foundation) under Germany's Excellence Strategy – EXC-2033 – Projektnummer 390677874. L. M. B. acknowledges funding by the Deutsche Forschungsgemeinschaft (DFG, German Research Foundation) under Germany's Excellence Strategy – Exzellenzcluster 2186 “The Fuel Science Center” ID: 390919832 and the Fachagentur Nachwachsende Rohstoffe (FNR) of the German Federal Ministry of Food and Agriculture (BMEL) within the project KERoSyn (No. 22403415). In addition, the funding from the European Union's Horizon 2020 research and innovation program under grant agreement no. 633962 for the project P4SB and no. 870294 for the project MIX-UP are acknowledged.References
- F. G. Jarvis and M. J. Johnson, J. Am. Chem. Soc., 1949, 71, 4124–4126 CrossRef CAS.
- S. Johann, T.-B. Seiler, T. Tiso, K. Bluhm, L. M. Blank and H. Hollert, Sci. Total Environ., 2016, 548–549, 155–163 CrossRef CAS.
- V. S. V. Santos, E. Silveira and B. B. Pereira, Chemosphere, 2019, 221, 519–525 CrossRef CAS.
- J. D. Desai and I. M. Banat, Fuel and Energy Abstracts, 1997, 38, 221 Search PubMed.
- A. M. Abdel-Mawgoud, F. Lépine and E. Déziel, Appl. Microbiol. Biotechnol., 2010, 86, 1323–1336 CrossRef CAS.
- P. Singh and S. S. Cameotra, Trends Biotechnol., 2004, 22, 142–146 CrossRef CAS.
- T. Tiso, R. Zauter, H. Tulke, B. Leuchtle, W.-J. Li, B. Behrens, A. Wittgens, F. Rosenau, H. Hayen and L. M. Blank, Microb. Cell Fact., 2017, 16, 1–14 CrossRef.
- J. Rühl, E.-M. Hein, H. Hayen, A. Schmid and L. M. Blank, Microbiol. Biotechnol., 2012, 5, 45–58 CrossRef.
- A. M. Pajarron, C. G. de Koster, W. Heerma, M. Schmidt and J. Haverkamp, Glycoconjugate J., 1993, 10, 219–226 CrossRef.
- A. Germer, T. Tiso, C. Müller, B. Behrens, C. Vosse, K. Scholz, M. Froning, H. Hayen and L. M. Blank, Appl. Environ. Microbiol., 2020, 86, 1–16 CrossRef.
- J. Penfold, R. K. Thomas and H.-H. Shen, Soft Matter, 2011, 8, 578–591 RSC.
- J. R. Edwards and J. A. Hayashi, Arch. Biochem. Biophys., 1965, 111, 415–421 CrossRef CAS.
- N. Shaw, Bacteriol. Rev., 1970, 34, 365–377 CrossRef CAS.
- A. Itoh, H. Honda, F. Tomato and T. Suzuki, J. Antibiot., 1971, 855–859 CrossRef.
- N. B. Rendell, G. W. Taylor, M. Somerville, H. Todd, R. Wilson and P. J. Cole, Biochim. Biophys. Acta, Mol. Cell Biol. Lipids, 1990, 1045, 189–193 CAS.
- Y. Zhang and R. M. Miller, Appl. Environ. Microbiol., 1994, 60, 2101–2106 CrossRef CAS.
- E. Déziel, F. Lépine, D. Dennie, D. Boismenu, O. A. Mamer and R. Villemur, Biochim. Biophys. Acta, Mol. Cell Biol. Lipids, 1999, 1440, 244–252 CrossRef.
- E. Déziel, F. Lépine, S. Milot and R. Villemur, Biochim. Biophys. Acta, Mol. Cell Biol. Lipids, 2000, 1485, 145–152 CrossRef.
- E. Haba, A. Abalos, O. Jáuregui, M. J. Espuny and A. Manresa, J. Surfactants Deterg., 2003, 6, 155–161 CrossRef CAS.
- N. W. Gunther, A. Nunez, W. Fett and D. K. Y. Solaiman, Appl. Environ. Microbiol., 2005, 71, 2288–2293 CrossRef CAS.
- A. Sharma, R. Jansen, M. Nimtz, B. N. Johri and V. Wray, J. Nat. Prod., 2007, 70, 941–947 CrossRef CAS.
- M. Nitschke, S. G. V. A. O. Costa and J. Contiero, Appl. Biochem. Biotechnol., 2010, 160, 2066–2074 CrossRef CAS.
- Y.-P. Guo, Y.-Y. Hu, R. R. Gu and H. Lin, J. Colloid Interface Sci., 2009, 331, 356–363 CrossRef CAS.
- M. Jadhav, S. Kalme, D. Tamboli and S. Govindwar, J. Basic Microbiol., 2011, 51, 385–396 CrossRef CAS.
- T. Rezanka, L. Siristova and K. Sigler, Extremophiles, 2011, 15, 697–709 CrossRef CAS.
- J. Howe, J. Bauer, J. Andrä, A. B. Schromm, M. Ernst, M. Rössle, U. Zähringer, J. Rademann and K. Brandenburg, FEBS J., 2006, 273, 5101–5112 CrossRef CAS.
- M. Nitschke, S. G. V. A. O. Costa and J. Contiero, Biotechnol. Prog., 2005, 21, 1593–1600 CrossRef CAS.
- J. Andrä, J. Rademann, J. Howe, M. H. J. Koch, H. Heine, U. Zähringer and K. Brandenburg, Biol. Chem., 2006, 387, 301–310 Search PubMed.
- M. Herzog, T. Tiso, L. M. Blank and R. Winter, Biochim. Biophys. Acta, Biomembr., 2020, 183431 CrossRef CAS.
- M. Sánchez, F. J. Aranda, J. A. Teruel and A. Ortiz, Chem. Phys. Lipids, 2009, 161, 51–55 CrossRef.
- A. Ortiz, J. A. Teruel, M. J. Espuny, A. Marqués, Á. Manresa and F. J. Aranda, Int. J. Pharm., 2006, 325, 99–107 CrossRef CAS.
- H. Abbasi, K. A. Noghabi and A. Ortiz, Chem. Phys. Lipids, 2012, 165, 745–752 CrossRef CAS.
- E. Haba, A. Pinazo, R. Pons, L. Pérez and A. Manresa, Biochim. Biophys. Acta, Biomembr., 2014, 1838, 776–783 CrossRef CAS.
- N. Monnier, A. Furlan, S. Buchoux, M. Deleu, M. Dauchez, S. Rippa and C. Sarazin, Int. J. Mol. Sci., 2019, 20, 1009 CrossRef CAS.
- H. Abbasi, F. J. Aranda, K. A. Noghabi and A. Ortiz, Biochim. Biophys. Acta, Biomembr., 2013, 1828, 2083–2090 CrossRef CAS.
- M. Sánchez, J. A. Teruel, M. J. Espuny, A. Marqués, F. J. Aranda, A. Manresa and A. Ortiz, Chem. Phys. Lipids, 2006, 142, 118–127 CrossRef.
- F. J. Aranda, M. J. Espuny, A. Marqués, J. A. Teruel, Á. Manresa and A. Ortiz, Langmuir, 2007, 23, 2700–2705 CrossRef CAS.
- M. Sánchez, F. J. Aranda, J. A. Teruel, M. J. Espuny, A. Marqués, Á. Manresa and A. Ortiz, J. Colloid Interface Sci., 2010, 341, 240–247 CrossRef.
- T. Tiso, D. F. Sauer, K. Beckerle, C. C. Blesken, J. Okuda and L. M. Blank, Catalysts, 2020, 10, 874 CrossRef CAS.
- E. Lump, L. M. Castellano, C. Meier, J. Seeliger, N. Erwin, B. Sperlich, C. M. Stürzel, S. Usmani, R. M. Hammond, J. von Einem, G. Gerold, F. Kreppel, K. Bravo-Rodriguez, T. Pietschmann, V. M. Holmes, D. Palesch, O. Zirafi, D. Weissman, A. Sowislok, B. Wettig, C. Heid, F. Kirchhoff, T. Weil, F.-G. Klärner, T. Schrader, G. Bitan, E. Sanchez-Garcia, R. Winter, J. Shorter and J. Münch, eLife, 2015, 4, e05397 CrossRef.
- H. Stein, S. Spindler, N. Bonakdar, C. Wang and V. Sandoghdar, Front. Physiol., 2017, 8, 1–16 Search PubMed.
- A. Weinberger, F.-C. Tsai, G. H. Koenderink, T. F. Schmidt, R. Itri, W. Meier, T. Schmatko, A. Schröder and C. Marques, Biophys. J., 2013, 105, 154–164 CrossRef CAS.
- M. Herzog, L. Li, H.-J. Galla and R. Winter, Colloids Surf., B, 2019, 173, 327–334 CrossRef CAS.
- M. Herzog, M. Dwivedi, R. K. Harishchandra, A. Bilstein, H.-J. Galla and R. Winter, Colloids Surf., B, 2019, 178, 404–411 CrossRef CAS.
- S. Bornemann, M. Herzog and R. Winter, Phys. Chem. Chem. Phys., 2019, 21, 5730–5743 RSC.
- S. Kapoor, A. Werkmüller, C. Denter, Y. Zhai, J. Markgraf, K. Weise, N. Opitz and R. Winter, Biochim. Biophys. Acta, Biomembr., 2011, 1808, 1187–1195 CrossRef CAS.
- E. Y. Shalaev and P. L. Steponkus, Biochim. Biophys. Acta, Biomembr., 1999, 1419, 229–247 CrossRef CAS.
- M. Fidorra, T. Heimburg and H. M. Seeger, Biochim. Biophys. Acta, Biomembr., 2009, 1788, 600–607 CrossRef CAS.
- P. Garidel and A. Blume, Eur. Biophys. J., 2000, 28, 629–638 CrossRef CAS.
- R. A. Al-Tahhan, T. R. Sandrin, A. A. Bodour and R. M. Maier, Appl. Environ. Microbiol., 2000, 66, 3262–3268 CrossRef CAS.
- A. Oliva, J. A. Teruel, F. J. Aranda and A. Ortiz, Colloids Surf., B, 2020, 185, 110576 CrossRef CAS.
- C. Jeworrek, M. Pühse and R. Winter, Langmuir, 2008, 24, 11851–11859 CrossRef CAS.
- R. Winter, F. Noll and C. Czeslik, Methoden der Biophysikalischen Chemie, Vieweg + Teuber, Wiesbaden, 2nd edn, 2011 Search PubMed.
- K. El Kirat, S. Morandat and Y. F. Dufrêne, Biochim. Biophys. Acta, Biomembr., 2010, 1798, 750–765 CrossRef CAS.
- A. Abalos, A. Pinazo, M. R. Infante, M. Casals, F. García and A. Manresa, Langmuir, 2001, 17, 1367–1371 CrossRef CAS.
- S. Lang and D. Wullbrandt, Appl. Microbiol. Biotechnol., 1999, 51, 22–32 CrossRef CAS.
- M. Benincasa, A. Abalos, I. Oliveira and A. Manresa, Antonie van Leeuwenhoek, 2004, 85, 1–8 CrossRef CAS.
- C. Syldatk, S. Lang, U. Matulovic and F. Wagner, Z. Naturforsch., C: Biosci., 1985, 40, 61–67 CAS.
- K. Weise, G. Triola, L. Brunsveld, H. Waldmann and R. Winter, J. Am. Chem. Soc., 2009, 131, 1557–1564 CrossRef CAS.
- K. Weise, S. Kapoor, C. Denter, J. Nikolaus, N. Opitz, S. Koch, G. Triola, A. Herrmann, H. Waldmann and R. Winter, J. Am. Chem. Soc., 2011, 133, 880–887 CrossRef CAS.
- A. Vogel, G. Reuther, K. Weise, G. Triola, J. Nikolaus, K.-T. Tan, C. Nowak, A. Herrmann, H. Waldmann, R. Winter and D. Huster, Angew. Chem., Int. Ed., 2009, 48, 8784–8787 CrossRef CAS.
- C. Nicolini, J. Baranski, S. Schlummer, J. Palomo, M. Lumbierres-Burgues, M. Kahms, J. Kuhlmann, S. Sanchez, E. Gratton, H. Waldmann and R. Winter, J. Am. Chem. Soc., 2006, 128, 192–201 CrossRef CAS.
- B. Come, M. Donato, L. F. Potenza, P. Mariani, R. Itri and F. Spinozzi, J. Colloid Interface Sci., 2021, 582, 669–677 CrossRef CAS.
- M. L. Chen, J. Penfold, R. K. Thomas, T. J. P. Smyth, A. Perfumo, R. Marchant, I. M. Banat, P. Stevenson, A. Parry, I. Tucker and I. Grillo, Langmuir, 2010, 26, 18281–18292 CrossRef CAS.
- J. C. Lawrence, D. E. Saslowsky, J. M. Edwardson and R. M. Henderson, Biophys. J., 2003, 84, 1827–1832 CrossRef CAS.
- D. E. Otzen, Biochim. Biophys. Acta, Biomembr., 2017, 1859, 639–649 CrossRef CAS.
- P. R. Cullis and B. De Kruijff, Biochim. Biophys. Acta, Biomembr., 1979, 559, 399–420 CrossRef CAS.
- J. Steinkühler, P. De Tillieux, R. L. Knorr, R. Lipowsky and R. Dimova, Sci. Rep., 2018, 8, 11838 CrossRef.
- C. Herold, G. Chwastek, P. Schwille and E. P. Petrov, Langmuir, 2012, 28, 5518–5521 CrossRef CAS.
- S. Bornemann, M. Herzog, L. Roling, T. O. Paulisch, D. Brandis, S. Kriegler, H.-J. Galla, F. Glorius and R. Winter, Phys. Chem. Chem. Phys., 2020, 22, 9775–9788 RSC.
- M. E. Stanghellini and R. M. Miller, Plant Dis., 1997, 81, 4–12 CrossRef CAS.
- A. Fiechter, Trends Biotechnol., 1992, 10, 208–217 CrossRef CAS.
- S. L. Gellatly and R. E. Hancock, Pathog. Dis., 2013, 67, 159–173 CrossRef CAS.
- A. Wittgens, T. Tiso, T. T. Arndt, P. Wenk, J. Hemmerich, C. Müller, R. Wichmann, B. Küpper, M. Zwick, S. Wilhelm, R. Hausmann, C. Syldatk, F. Rosenau and L. M. Blank, Microb. Cell Fact., 2011, 10, 1–17 CrossRef.
- P. Thakur, N. K. Saini, V. K. Thakur, V. K. Gupta, R. V. Saini and A. K. Saini, Microb. Cell Fact., 2021, 20, 1–15 CrossRef.
- J. Dickerhoff, B. Onel, L. Chen, Y. Chen and D. Yang, ACS Omega, 2010, 4, 2533–2539 CrossRef.
| This journal is © The Royal Society of Chemistry 2021 |

