 Open Access Article
Creative Commons Attribution 3.0 Unported Licence
How ambient conditions affect the Leidenfrost temperature†
Michiel A. J.
van Limbeek
 *ab,
Olinka
Ramírez-Soto
 ab,
Andrea
Prosperetti
ac and
Detlef
Lohse
 *ab
*ab
aUniversity of Twente, Physics of Fluids, Drienerlolaan 5, P. O. Box 217, 7500AE Enschede, The Netherlands. E-mail: m.a.j.vanlimbeek@utwente.nl; d.lohse@utwente.nl
bMax Planck Institute for Dynamics and Self-Organization, Am Faßberg 17, 37077 Göttingen, Germany
cUniversity of Houston, Department of Mechanical Engineering, N207 Engineering Building 1, 4726 Calhoun Road, Houston (TX), USA
First published on 19th February 2021
Abstract
By sufficiently heating a solid, a sessile drop can be prevented from contacting the surface by floating on its own vapour. While certain aspects of the dynamics of this so-called Leidenfrost effect are understood, it is still unclear why a minimum temperature (the Leidenfrost temperature TL) is required before the effect manifests itself, what properties affect this temperature, and what physical principles govern it. Here we investigate the dependence of the Leidenfrost temperature on the ambient conditions: first, by increasing (decreasing) the ambient pressure, we find an increase (decrease) in TL. We propose a rescaling of the temperature which allows us to collapse the curves for various organic liquids and water onto a single master curve, which yields a powerful tool to predict TL. Secondly, increasing the ambient temperature stabilizes meta-stable, levitating drops at increasingly lower temperatures below TL. This observation reveals the importance of thermal Marangoni flow in describing the Leidenfrost effect accurately. Our results shed new light on the mechanisms playing a role in the Leidenfrost effect and may help to eventually predict the Leidenfrost temperature and achieve complete understanding of the phenomenon, however, many questions still remain open.
1 Introduction
When a drop is deposited on a hot surface, a vapour film is formed, provided that the temperature of the surface exceeds the so-called Leidenfrost temperature.1 In this situation, the contact between the liquid and the hot surface is prevented by the vapour film. This effect manifests itself during spray combustion,2 liquid spreading3 and is very undesirable in contexts where evaporation is employed for temperature control, such as spray cooling.4 The insulating vapour layer between the liquid and the solid prevents efficient heat transfer. Therefore the Leidenfrost effect has attracted a lot of attention, focussing on the shape and the vapour layer thickness of the drops5–7 and the influence of the impact dynamics.4,8–12 The minimal temperature of the solid required for the effect to manifest itself is called the Leidenfrost temperature TL (after the first systematic description of the phenomen by Johann Gottlob Leidenfrost,13 although in fact it had first been mentioned already by Herman Boerhaave14 two decades earlier). The Leidenfrost temperature is often determined by observing when the drop has a 180° contact angle5,8,13 or a (local) maximum in its lifetime.6Once a drop is in the Leidenfrost state, for the vapour film thickness and profile, good agreement between observations and modelling is achieved.5,15 The typical thickness h of the vapour layer scales with the superheat ΔT = (T − Tsat) as h ∝ ΔT1/4, where T is the plate temperature and Tsat the saturation (i.e., boiling) temperature.5–7 However, the models predicting such scaling do not hold for vanishing superheat: no stable Leidenfrost drops are documented in literature for a plate temperature T → Tsat, whereas the models still predict a vapour layer in this limit e.g. in the order of micrometers for a superheat of ΔT = 1 K, much thicker than any long range forces. A few observations of unstable Leidenfrost drops exist however. Drops on superheated liquid pools16–18 and drops which are on a hot plate which was initially above TL, but which is cooling down over time below TL5,19 while the drop remains in the Leidenfrost state. Once the vapour film of these unstable drops gets pierced however, they do not recover back to the Leidenfrost state. Recently, this regime was explored by utilizing superhydrophobic surfaces to prevent wetting.20 In contrast to the classical boiling curve for wetting drops, where a local maximum in the evaporation time is found at T = TL, here, a monotonic decrease in evaporation time was observed with increasing plate temperature.
The prediction of the Leidenfrost temperature TL is however still an unsolved problem. It is known that TL depends on the type of liquid21 as well as the roughness22,23 and thermal conductivity21,24–27 of the plate. We also know that it increases with increasing impact velocity of the drop.4,8–11 Here we want to study how TL depends on the ambient pressure and the ambient temperature, for otherwise fixed parameters. A recent study28 found TL of water and organic liquids29,30 to decrease for reduced ambient pressures, but a more general approach for several liquids is still lacking in literature. We therefore will study various liquids under reduced and elevated pressures.
We divide the paper in two sections: after discussing the experimental aspects and general phenomenology (Sections 2 and 3), first (Section 4) we focus on the effect of the ambient pressure P on the Leidenfrost temperature. We will find a strong dependence of TL on P and after rescaling provide a data collapse of this behaviour for various liquids on one master curve. Second (Section 5), we will study the influence of the ambient temperature T0 on TL. We will find the existence of meta-stable Leidenfrost drops for smaller superheats when increasing the ambient temperature T0. We identify such metastable drops by the irreversibility towards the Leidenfrost state after disturbing them by vibration. In contrast, ‘stable’ Leidenfrost do recover back to their initial configuration after disturbances forced a touch-down onto the hot plate. The two sets of experiments provide new insight on the mechanism behind TL, which is of great importance for understanding and predicting the Leidenfrost effect.
2 Experimental aspects
The general setup to study the Leidenfrost effect consists of a heated plate, a drop dispenser, a light source and a (high speed) camera, see Fig. 1. To avoid the influence of roughness and cooling effects in the solid, we use a silicon plate (ThorLabs WG81050), which is optically smooth and has good thermal conductivity and sufficient thickness of 5 mm to avoid any cooling effects.21,25,27 The plate is resting on a brass heater block, whose temperature is controlled by a PID controller. The surface temperature T of the silicon plate was measured prior to the experiment by a Pt-100 sensor to calibrate the set point of the controller. The plate was placed inside either one of three containers which were designed to (1) reduce or, (2) elevate the ambient pressure, and (3) to control the ambient temperature to Tbox. The surrounding pressure is indicated by P, with an uncertainty of 0.01 bar for setup one and 2.05 bar for the second one. Fresh (dry) air entered the setup through a needle valve, which, together with the pump set the pressure. The second container was made of titanium, the inner wall of which served as the heated plate (i.e. without the silicon plate). The poor thermal conductivity of titanium needs to be taken into account.21 Here, the pressure was set by a check valve and vapour was removed by a condenser. All containers had windows to observe the phenomenon. For visualization we used shadowgraphy recorded by a camera at 1000 fps to capture fast dynamics.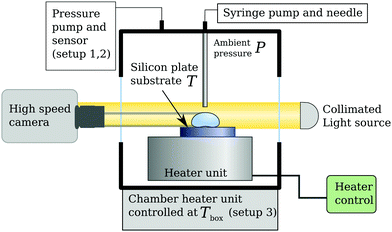 | ||
| Fig. 1 Schematic of the setups used. Three variations were built, see the main text; two for varying the ambient pressure P, one to vary the ambient temperature Tbox. | ||
Drops were generated at the tip of a needle using a syringe pump (Harvard PHD2000) or a HPLC pump (Shimadzu), which was a few millimeter away from the heated surface to avoid any impact dynamics when the drops are generated. The drop size was constant for all pressures, but dependent on the type of liquid, scaling as (γd)1/3, where γ is the temperature dependent drop size and d the needle diameter. In the case of the third setup, a glass capillary instead of a needle was placed inside the drops to allow for constant feeding of the drop during the experiment. The balance between evaporation and feeding leads to a static situation, since the size of the drop was controlled by the feeding rate. Both methods resulted in drops larger than the capillary length, for which the drop size does not affect the dynamics greatly,7 but below the regime where the puddles (i.e. large drops) exhibit shape oscillations.31
3 Phenomenology
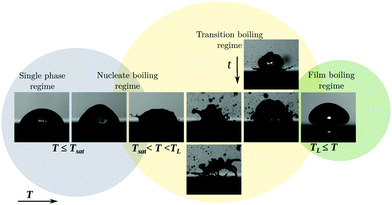
When a cold drop approaches the heated plate during deposition, contact is prevented by the viscous pressure build up. In the absence of any evaporation, this is the classical phenomenon of a draining film. Here however, the hot plate heats the bottom of the drop, which starts to evaporate. The vapour generation replenishes the escaping air at early times, until the film contains only vapour. Dissolved gas in the liquid was found to contribute little in terms of gas flux.32 When the evaporation is insufficient, the film breaks and the drop wets the surface, trapping small bubbles in the process. In Fig. 2 we show snapshots of ethanol drops for various plate temperatures T. For low plate superheats, the drop touches the plate after dispensing it from a needle and evaporates from the top. With increasing T, the bubbles start to grow faster and detach from the surface. The bubbles burst, causing great disturbances in the drop and finally fragmentation. The temperature range of this transitional behaviour is typically a few Kelvin. Beyond TL, light can pass underneath the drop, which is observed as a bright stripe in Fig. 2. This indicates that the drop levitates above the plate on its own vapour layer and we use this throughout the study to identify the Leidenfrost state. The Leidenfrost phenomenon can occur for T < TL (the aforementioned metastable Leidenfrost drops) as well, where the gas/vapour film does not rupture when the dispensed drop approaches the hot plate and the evaporating drop balances the film draining process.The vapour layer insulates the Leidenfrost drop, which results in a lower global evaporation rate6 and lower heat transfer coefficient. The temperature of the liquid–vapour interface under the drop is fixed at the saturation temperature, which is determined by the ambient pressure of the setup. Initially, the bulk is not yet heated to saturation temperature and so is the top surface of the drop. As the surface tension depends on the temperature, the difference between the top and bottom temperature results in a stress imbalance on the interface. This Marangoni stress induces a flow in the bulk, transporting hot liquid away from the plate towards the top of the drop, see Fig. 9. Cold liquid descends in the centre, draining additional heat from the plate. Since the top of the drop is now at an elevated temperature, additional evaporation takes place, for which the latent heat is removed from the drop. In contrast to the vapour film below the drop, which contains pure vapour, here, evaporation takes place into dry air. Two boundary layers form around the drop: a thermal layer which limits additional convective heat transfer to the surroundings, and a mass boundary layer, controlling the evaporation rate. The magnitudes of the fluxes are thus controlled by the (far-field ambient) temperature, since the vapour concentration depends on it. In the present study however, the surroundings are flushed with dry air. We thus identified a complex interplay between the hot plate, the cold drop and environmental conditions, especially in the transient phase during the approach of the drop towards the plate. Energy from the plate is removed for heating the drop, evaporating liquid and heating the gas surrounding the plate. In our study, we focus on the dependence of TL on the ambient pressure and temperature and their impact on metastable Leidenfrost drops.
4 Influence of surrounding pressure
The first set of experiments involves the reduction of the ambient pressure P below 1 bar down to 30 mbar, for which we studied six different liquids. While varying the pressure, we changed the set-point of the plate temperature and registered at which minimum plate temperature the drops were in a stable Leidenfrost configuration. The employed liquids were: water, n-heptane 2-propanol, ethanol, acetone (propanone) and FC-72 (perfluorohexane C6F14). The measured Leidenfrost temperatures are presented together with the (pressure dependent) saturation temperature Tsat(P) in Fig. 3. The latter is equated using the Clausius–Clapeyron equation where L is the latent heat and Δv the volumetric change of the substance. The datapoints indicate the minimal plate temperature where the drop does not touch the plate after dispensing. The bottom uncertainty is the minimal temperature at which a drop recovers from a sessile state into a Leidenfrost state, whereas the top uncertainty indicates the minimal plate temperature at which the drop never touches the plate during its evaporation. Note that these uncertainties in principle can coincide with the datapoint.
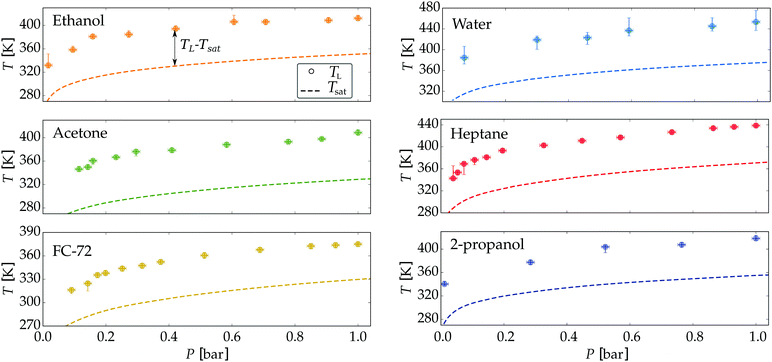 | ||
| Fig. 3 Measured Leidenfrost temperature for six different liquids drops under reduced ambient pressure. The saturation temperature (dashed line) is calculated from the Clausius–Clapeyron equation using the coefficients from the NIST database.38 | ||
It is clear that for all liquids TL shows a strong dependence on P. When plotting the Leidenfrost temperature against the saturation temperature, a linear trend appears for each liquid, with prefactors between 0.95 and 1.12, see Fig. 10. Since the film thickness scales with the superheat5 (TL − Tsat)1/4 no explicit dependency on P can be expected. For selfpropulsion33–35 however, the force on the drop is affected by the vapour viscosity, which depends (non-trivially) on both the pressure and temperautre of the gas. Our results are in good agreement with those found by Mills and Fry36 and Mills and Sharrock,37 who studied TL of alkanes and alcohols respectively at P = 1 bar. A linear relation between TL and Tsat was found there, where the latter increases with increasing chain length of the alkanes resp. alcohols.
Since a linear dependence of the Leidenfrost temperature on the saturation temperature was found for all employed liquids, we now seek a unifying description, i.e. a single relation which holds for all liquids. The slopes b1 of the fits
| TL = b1Tsat + b0 | (1) |
The employed liquids differ greatly in latent heat of evaporation L and gas specific heat Cp,g. The ratio between these two quantities appears naturally when solving the heat equation for the surrounding gas/vapour phase, see for instance.39 The ratio L/Cp,g can be interpreted as the relative amount of energy available for evaporation, compared to that being lost from the drop to the surrounding gas. We therefore define the non-dimensional temperature:
| Θ = TCp,g/L | (2) |
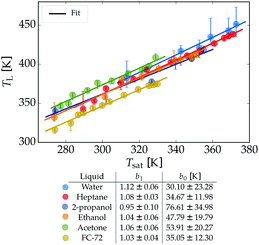 | ||
| Fig. 4 The Leidenfrost temperature as a function of Tsat(P), using the data of Fig. 3. The data is fitted by a linear relation: TL = b1·Tsat + b0, where the coefficients are listed in the table. | ||
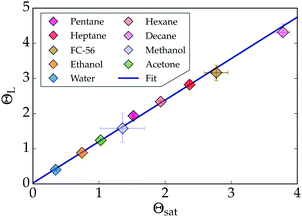 | ||
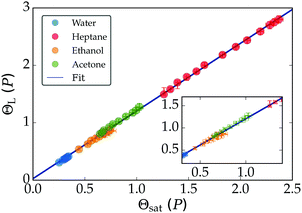
| Fig. 6 The linear relation between the non-dimensional saturation- and Leidenfrost temperatures of various liquids measured ambient pressure (P = 1 bar). The data is fitted as ΘL = 1.13Θsat + 0.08. For comparison, some data from Fig. 4 was added. | ||
Using the second setup described in Section 2 we studied the Leidenfrost phenomena at elevated pressures for water, ethanol, and acetone. Data from ref. 30 for Freon 113 (1,1,2-trichloro-1,2,2-trifluoroethane) was added to test the rescaling towards the critical point. From the result of Fig. 7 we conclude that the found linear relation between the saturation and Leidenfrost temperature well predicts the latter for most liquids. The Freon data however start to deviate towards the critical temperature. We employ a second correlation to account for the observed non-linearity, which is of a similar form as the model suggested by Orejon et al.:28
| ΘL−1 = aΘsat−1 + β. | (3) |
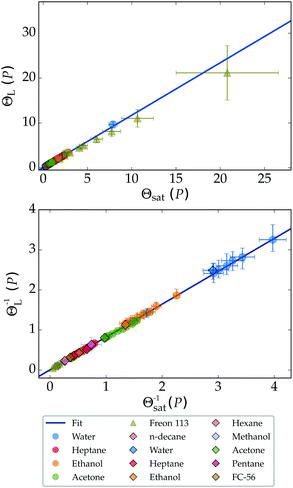 | ||
| Fig. 7 All data for the non-dimensional Leidenfrost temperature can be collapsed onto a single curve (upper), described by ΘL = 1.17Θsat + 0.02. The lower figure shows eqn (3), fitted as ΘL−1 = 0.82Θsat−1 + 0.004. | ||
The result is presented in the lower panel of Fig. 7. Our data was fitted best for a = 0.004 and β = 0.82, which yielded after further manipulation the following universal relation for all experiments:
 | (4) |
This nonlinear model can be expanded around any temperature T0 linearly to recover eqn (1), where the coefficients depend on T0. It is clear that the non-linearity in TL(Tsat), i.e. the correction term in the denominator, is important for large Cp,g/L or Tsat. Since Cp,g/L increases for Tsat(P) → Tc as well (Tc being the critical temperature), one can expect the non-linearity to manifest itself for increasing ambient pressure P. Close to Tc the ratio diverges as L → 0, which however does not reduce eqn (4) to TL = Tsat. Our data does not allow further speculation on the exact form in this limit.
5 Influence of the surrounding temperature: metastable Leidenfrost drops
5.1 Observations
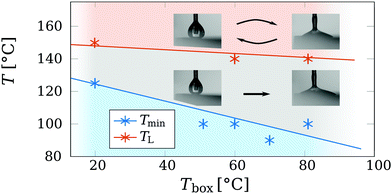
Since we expect some heat losses to the surroundings (for instance from the top of the drop) we investigate the Leidenfrost temperature of ethanol while we vary the temperature Tbox of the surrounding box. We reduced the complexity of the study by restricting us to a single liquid. The slow infusion rate of the syringe pump made forming drops first creep up the capillary, until the size became large enough to be pulled down by gravity, descending slowly towards the hot plate. Then, the drop could either directly wet the plate or be in a Leidenfrost state. The observations are presented in Fig. 8, where Tmin denotes the lowest plate temperature where drops do not directly wet the plate, but enter the Leidenfrost state.Next, every Leidenfrost drop was vibrated by touching the glass capillary. The drops then made contact with the plate, followed by one of two phenomena: (i) for moderate plate temperatures, the drops remained in contact with the plate, boiling violently, as presented by the transition boiling regime of Fig. 2, and rapidly boiled away. (ii) For higher plate temperature T, this behaviour changes and the drop recovers into the Leidenfrost state. The two scenarios are indicated by the snapshots of Fig. 8, where the arrow(s) indicate (ir)reversibility. Drops in scenario (i) are thus metastable, indicated by the gray area. Cleaning the silicon plate of residue from previously wetted drops and dust particles lowered Tmin significantly, by several tens of Kelvin. The cases where the drop did recover into the Leidenfrost state (scenario ii) are thus stable. The minimal plate temperature at which this reversible behaviour is observed is roughly 145 °C (red data points). This value agrees well within the literature values of 140 °C < TL < 155 °C.21,37 The amount of disturbance is not of great importance, as the aim of this study is not to quantify the robustness of metastable Leidenfrost drops against disturbances. Since this is a metastable system, such a study would also require control over the plate roughness and contamination levels of both the air, liquid and injection system, which is beyond the scope of this study. We here identified a third classification method of the Leidenfrost state, based on the ability of recovering from a wetted state. This method deals with the possibility of meta-stable drops, a distinction which the life time6 of the drop or the 180° contact angle appearance cannot5,8 provide.
To our knowledge, metastable Leidenfrost drops have only been reported as such only twice in literature.5,19 In both studies, a water drop was placed on a hot surface above TL. Then the heating was ceased and the plate temperature was lowered by a cooling circuit. Surprisingly, the Leidenfrost drop remained in this state at T ≈ 100 °C. Contamination,40 roughness and drop oscillations were suggested to be able to pierce the thinning vapour layer,41 breaking the metastable configuration and making the drop wet the plate. Metastable drops are also found in the case of Leidenfrost drops on a pool, called a ‘boule’, which can survive on a superheat of a few Kelvin above saturation as well.16,17 Contamination,16 was identified for this system to control the stability of the vapour layer, highlighting the metastability of the ‘boule’. Finally, small drops can be levitated by a Stefan flow even at conditions below the saturation temperature.42
We therefore concluded that, although Leidenfrost-like drops can be made at temperatures below TL, these drops are metastable and can easily be forced into the contact-/nucleate-boiling state. The Leidenfrost state is therefore to be associated to a rapid change in contact line dynamics for which a drop starts to dewet the plate once contact has been made. Such a dramatic change can be observed by using high-speed FTIR-imaging. The gradual, diffusive bubble growth found for T < TL changes into rapid dewetting contact lines, where bubbles loose the spherical shape, see the movies of Shirota et al.10 We thus propose that for the prediction of the (stable) Leidenfrost temperature, one needs to focus on the contact line dynamics and on how these are affected by an increasing superheat.
A trend can be observed for the minimum plate temperature Tmin at which metastable drops can survive. As shown in Fig. 8, Tmin approaches Tsat = 78 °C for ethanol with increasing Tbox. This can readily be understood by introducing a vanishing effect of the Marangoni flow on the drop surface. The evaporation from the top of the drop makes the drop interface to cool locally.43,44 As a result of the increase in surface tension by the local cooling, a surface tension gradient ∂rΓ occurs, scaling as ∂rΓ ≈ ∂TΓΔTbt/R. Here Γ is the surface tension, ∂T the partial derivative with respect to temperature and ΔTbt the temperature difference between the top and bottom of the drop. The surface tension gradient induces a shear flow condition at the interface of the drop, including at the lower gap between the liquid and the vapour phase. The shear flow condition lowers the pressure build-up in the gap, resulting in a thinner gap thickness h. Thus, suppressing the Marangoni flow, by increasing the ambient temperature Tbox, requires a lower plate temperature T to provide the same gap thickness. Next, we will formalize and quantify this argument by developing a simple model below to further evaluate this hypothesis.
5.2 Modelling
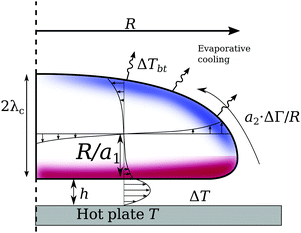
As discussed above, the heat losses from the top of the drop induce a temperature gradient. This leads to a Marangoni flow, inducing a shear stress condition on the drop interface. The shear stress is balanced by the viscous shear in both the vapour gap as well as the drop. The resulting velocity hence becomes a combination of a Couette and a Poiseuille flow, in which only the latter is balancing the pressure build-up under the drop to levitate the drop. Fig. 9 shows this model, which is formalized as follows: the solution for the gap thickness h must consider the Marangoni stress at the drop interface. Levitation requires the vertical pressure balance between the weight of the drop, and the viscous pressure build-up in the gap. Below the capillary length
 ![[small script l]](https://www.rsc.org/images/entities/char_e146.gif) c = (Γ/(ρlg))1/2, we take the (horizontal) radius R as the vertical length scale,
c = (Γ/(ρlg))1/2, we take the (horizontal) radius R as the vertical length scale,  , whereas it saturates at 2
![[small script l]](https://www.rsc.org/images/entities/char_e146.gif) c for puddles R >
c for puddles R > ![[small script l]](https://www.rsc.org/images/entities/char_e146.gif) c. The separation of length-scales in the vapour gap allows for the use of the axi-symmetric steady Stokes equation, where 0 < y < h ≪ R.
c. The separation of length-scales in the vapour gap allows for the use of the axi-symmetric steady Stokes equation, where 0 < y < h ≪ R.| ∂rP = ηv∂yyu, | (5) |
 | (6) |
The Couette flow does not directly contribute to the levitation and is determined by the stress balance at the vapour–drop interface, including a Marangoni shear stress. The average flux then is:
 | (7) |
 | (8) |
The flow if driven by the over-pressure in the gap with respect to the ambient pressure, which was estimated before as ρg![[small script l]](https://www.rsc.org/images/entities/char_e146.gif) c. The pressure would then drop over the radial length scale R, yielding a pressure gradient ∂rP = −ρg
c. The pressure would then drop over the radial length scale R, yielding a pressure gradient ∂rP = −ρg![[small script l]](https://www.rsc.org/images/entities/char_e146.gif) c/R. Using mass conservation, we find
c/R. Using mass conservation, we find
| ρv∂r(rhū) = rṁ(h), | (9) |
 | (10) |
For the limiting case Uc → 0, i.e. no slip, the model recovers that of Wachters5 and Biance.6
The problem is closed by finding the velocity at the drop interface, Uc. This is set by satisfying the shear stress continuity: ηl∂yul + ηv∂yuv = ∂rΓ for y = h.45 We find ∂yuv = (Uc − Up)/h. After some transient effects, recirculation emerges inside the drop. We allow for a large recirculation roll inside the drop, finding ∂yul ≈ a1Uc/R, where a1 is a geometrical constant. For small drops, only a single cell exists,44 for which a1 ≈ 1. For larger drops (R ≈ ![[small script l]](https://www.rsc.org/images/entities/char_e146.gif) c), a secondary cell emerges. Naturally, a1 increases as well, thus we vary a1 to study its role.
c), a secondary cell emerges. Naturally, a1 increases as well, thus we vary a1 to study its role.
The Marangoni stress is modelled as a2ΔΓ/![[script L]](https://www.rsc.org/images/entities/char_e144.gif) = a2
= a2![[thin space (1/6-em)]](https://www.rsc.org/images/entities/char_2009.gif) ΔTbt∂TΓ/R. This gradient varies over the length scale of the drop as well, thus a2 is also of order one. Bouillant et al.44 studied the thermal gradient along the drop interface, from which we can use for R <
ΔTbt∂TΓ/R. This gradient varies over the length scale of the drop as well, thus a2 is also of order one. Bouillant et al.44 studied the thermal gradient along the drop interface, from which we can use for R < ![[small script l]](https://www.rsc.org/images/entities/char_e146.gif) c:ΔTbt ≈ 20 K and a2 ≈ 2. For large drops however, ΔTbt ≈ 10 K, but the gradient is localized close to the plate, leading to a2 ≈ 5. A more global estimate leads to ΔTbt ≈ 15 and a2 = 1. For all cases however, Bouillant et al.'s44 observations yield for a2ΔTbt a value between 20 K and 50 K.
c:ΔTbt ≈ 20 K and a2 ≈ 2. For large drops however, ΔTbt ≈ 10 K, but the gradient is localized close to the plate, leading to a2 ≈ 5. A more global estimate leads to ΔTbt ≈ 15 and a2 = 1. For all cases however, Bouillant et al.'s44 observations yield for a2ΔTbt a value between 20 K and 50 K.
We now solve eqn (10), where Up and Uc are given by eqn (8) and the shear stress balance:
 | (11) |
The solutions without Marangoni stresses (a2 = 0) are presented in Fig. 10 to highlight the role of the viscous stresses in the drop. The length scale R/a1, over which the viscous gradients in the drop decay, controls the importance of the Couette contribution of the vapour flow. The Couette component does not contribute to the levitation of the drop; hence we find thinner films for decreasing shear stresses in the drop. For the case of infinitesimally small velocity gradient, i.e. no Marangoni flow, the model recovers that of Wachters5 and Biance,6 which will be used as a reference case, and the corresponding height of that case is called h0.
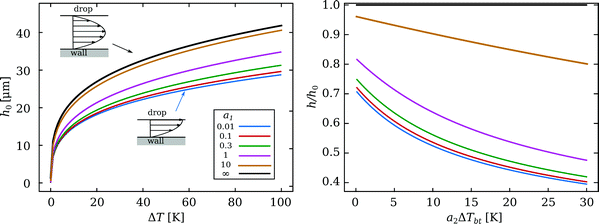 | ||
| Fig. 10 Solutions of eqn (10) for an ethanol drop of R = 1 mm. The dissipation in the drop is varied via a1. The black line corresponds to Uc(a1) = 0: the limit of a no-shear-flow boundary condition,5,6 whereas the blue curve approaches the limit of zero shear stress, see the flow sketches. The right panel shows the (scaled) thinning of the film, resulting from the Marangoni stress for various a1, depending on the strength of the temperature gradient. Here, ΔT = 50 K. | ||
The Marangoni flow thins the film as well, as shown in the right panel of Fig. 10, where the plate is set to ΔT = 50 K. The thickness is compared with h0 for various a1. We find a strong decrease in film thickness for only a few Kelvin of temperature difference between the top and bottom of the drop. The viscous stresses from the drop still influence the Couette flow in the vapour gap as shown by the various curves. Our model predicts average vapour flow velocities of several tens of cm per second, in agreement with previous studies.6,27 Significant influences of the Marangoni flow imply that Up and Uc are of the same order. For the realistic values discussed earlier, a1 ≈ 1 and a2ΔTbt ≈ 25, we find a reduction of h by a factor 2. Note that, for models using a no-shear boundary condition (i.e. a1 = ∞), this would imply a change in plate superheat ΔT by a factor 24 = 16.
The system can also be analysed from an energy based point of view. The vapour generation drives the flow and hence, work is performed. This kinetic energy is dissipated along the gap by both the wall and the liquid drop,46,47 where, for the latter, its strength scales with the viscosity and the length scale (a1/R)2. The Marangoni stress also performs work and thus acts as an energy source. The problem is then solved by adding the work originating from the vapour generation and the Marangoni stress and balance it with the viscous dissipation in the drop and the vapour gap due to the presence of the solid wall.
In our experiment, the Marangoni stress was changed by altering the box temperature. Addition of ethanol vapour in the box prior to the drop formation made it possible to form metastable Leidenfrost drops at plate temperatures even below the data shown in Fig. 8. The (temporarily) increase in vapour concentration in the box reduces the evaporation from the top of the drop and thus would suppress the Marangoni flow. Naturally, the evaporation rate and thus the cooling at the top of the drop decreases, leading to a thicker vapour layer. Therefore, the film becomes less subject to disturbances. The increase of the vapor concentration in the enclosure reduces the evaporation from the drop thus slowing down the evaporative cooling and, with it, the Marangoni flow. Two other factors tend to decrease the evaporation rate. In the first place, condensation at the walls acts as a vapour sink for temperatures below Tsat and this effect is reduced if the wall temperature is increased. Secondly, the warmer environment acts as a source of thermal energy besides the hot plate, which also tends to reduce evaporative cooling. The result is a thicker vapour film under the drop which is less sensitive to disturbances.
A reduction in the film thickness will also have an effect on the evaporation rate of the drop. The change in the (local) evaporation rate is also straightforward, since ṁ ∝ 1/h, thus doubling for a decrease in vapour thickness by a factor 2. However, since the strength of the Marangoni stress is altered by influencing the evaporation rate at the top of the drop, it is far from trivial how these effects compare and determine the global drop evaporation rate.
6 Conclusions and outlook
We have shown experimentally that the Leidenfrost phenomenon and the corresponding Leidenfrost temperature TL are influenced strongly by the environment. Increasing the ambient pressure increases TL, which shows a linear relation with the saturation temperature of the liquid at the same environmental pressure. By non-dimensionalizing the temperatures by the ratio of latent and specific heat of the vapour, we show that all the liquids studied follow a universal curve, correlating the (non-dimensional) Leidenfrost temperature with the (non-dimensional) saturation temperature.At ambient pressure we studied the existence of Leidenfrost drops at lower plate temperatures than TL. These drops however are metastable: a drop which is carefully prepared in the Leidenfrost state, will not recover to it once a touchdown has (intentionally) occurred. We hypothesised that a minimal vapour thickness must form to prevent touch-down of (metastable) Leidenfrost drops: lowering the superheat leads to a thinner vapour film. The temperature range at which metastable drops were observed depends strongly on the ambient temperature. TL however does not depend on the ambient temperature and thus is not expected to appear in the non-dimensional prediction derived in Section 4. We explored the possibility that evaporation from the top of the drop leads to local cooling, and thus a Marangoni stress along the drop surface. Increasing the ambient temperature would reduce the strength of the Marangoni stress by suppressing the evaporation. This leads to a thinner vapour film for the same plate temperature.
We suggest that the resulting increase in vapour film thickness increases the stability of the metastable Leidenfrost drop. In this study we only provided a general concept, based on global estimates on the Leidenfrost dynamics. A follow-up studies aiming at solving the full transport problem numerically would yield quantitative insight on the proposed model, where the role of the ambient vapour concentration and temperature field in the box are of particular interest. Additional liquids should be assessed as well to investigate the potential universality of the phenomenon. Moreover, based on the study of these metastable Leidenfrost drops, we suggest that the Leidenfrost effect originates from the dynamics at the liquid–solid contact line, prior to levitation. A careful assessment of the contact line dynamics in the limit of non-wetting drops will provide more insight on this point, potentially leading to a full understanding of the Leidenfrost phenomenon. Further insight may be obtained by from studying binary and ternary Leidenfrost droplets, as volatilities and surface tension of the components bringing rich physicochemical hydrodynamics of the droplets48 and offer the opportunity to make use of the relative initial concentration as an extra control parameter.49
Conflicts of interest
There are no conflicts to declare.Acknowledgements
The authors thank Pierre Chantelot and Chao Sun for valuable discussions. This study was supported by the ERC Advanced Grant “DDD” under the project number 740479. O. R.-S. acknowledges the Mexican National Council on Science and Technology (CONACyT) for the postgraduate fellowship.References
- D. Quéré, Annu. Rev. Fluid Mech., 2013, 45, 197–215 CrossRef.
- A. L. N. Moreira, A. S. Moita and M. R. Panão, Prog. Energy Combust. Sci., 2010, 36, 554–580 CrossRef CAS.
- D. Attinger, Z. Zhao and D. Poulikakos, J. Heat Transfer, 2000, 122, 544–555 CrossRef CAS.
- J. Kim, Int. J. Heat Fluid Flow, 2007, 28, 753–767 CrossRef.
- L. H. J. Wachters, H. Bonne and H. J. van Nouhuis, Chem. Eng. Sci., 1966, 21, 923–936 CrossRef CAS.
- A.-L. Biance, C. Clanet and D. Quéré, Phys. Fluids, 2003, 15, 1632–1637 CrossRef CAS.
- B. Sobac, A. Rednikov, S. Dorbolo and P. Colinet, Phys. Rev. E: Stat., Nonlinear, Soft Matter Phys., 2014, 90, 053011 CrossRef CAS.
- S. Chandra and C. T. Avedisian, Proc. R. Soc. London, Ser. A, 1991, 432, 13–41 CrossRef.
- T. Tran, H. J. J. Staat, A. Prosperetti, C. Sun and D. Lohse, Phys. Rev. Lett., 2012, 108, 036101 CrossRef.
- M. Shirota, M. A. J. van Limbeek, C. Sun, A. Prosperetti and D. Lohse, Phys. Rev. Lett., 2016, 116, 064501 CrossRef.
- C. Josserand and S. T. Thoroddsen, Annu. Rev. Fluid Mech., 2016, 48, 365–391 CrossRef.
- M. A. J. van Limbeek, T. H. Nes and S. Vanapalli, Int. J. Heat Mass Transfer, 2020, 148, 118999 CrossRef CAS.
- J. G. Leidenfrost, De aquae communis nonnullis qualitatibus tractatus, Ovenius, Duisburg, 1756 Search PubMed.
- H. Boerhaave, Elementa Chemiae, Lugduni Batavorum, 1732, pp. 258–259 Search PubMed.
- J. H. Snoeijer, P. Brunet and J. Eggers, Phys. Rev. E: Stat., Nonlinear, Soft Matter Phys., 2009, 79, 036307 CrossRef.
- K. C. D. Hickman, Ind. Eng. Chem., 1964, 56, 18–31 CrossRef CAS.
- L. Maquet, B. Sobac, B. Darbois-Texier, A. Duchesne, M. Brandenbourger, A. Rednikov, P. Colinet and S. Dorbolo, Phys. Rev. Fluids, 2016, 1, 053902 CrossRef.
- M. A. J. Van Limbeek, B. Sobac, A. Rednikov, P. Colinet and J. H. Snoeijer, J. Fluid Mech., 2019, 863, 1157–1189 CrossRef CAS.
- K. J. Baumeister, R. C. Hendricks and T. D. Hamill, Metastable Leidenfrost states, National Aeronautics and Space Administration, 1966 Search PubMed.
- P. Bourrianne, C. Lv and D. Quéré, Sci. Adv., 2019, 5, eaaw0304 CrossRef CAS.
- K. J. Baumeister and F. F. Simon, J. Heat Transfer, 1973, 95, 166–173 CrossRef CAS.
- H. Kim, B. Truong, J. Buongiorno and L.-W. Hu, Appl. Phys. Lett., 2011, 98, 083121 CrossRef.
- H.-m. Kwon, J. C. Bird and K. K. Varanasi, Appl. Phys. Lett., 2013, 103, 201601 CrossRef.
- J. D. Bernardin and I. Mudawar, J. Heat Transfer, 1999, 121, 894–903 CrossRef.
- M. A. J. van Limbeek, M. Shirota, P. Sleutel, C. Sun, A. Prosperetti and D. Lohse, Int. J. Heat Mass Transfer, 2016, 97, 101–109 CrossRef.
- M. Khavari and T. Tran, Phys. Rev. E, 2017, 96, 043102 CrossRef.
- M. A. J. van Limbeek, M. H. Klein Schaarsberg, B. Sobac, A. Rednikov, C. Sun, P. Colinet and D. Lohse, J. Fluid Mech., 2017, 827, 614–639 CrossRef CAS.
- D. Orejon, K. Sefiane and Y. Takata, Phys. Rev. E: Stat., Nonlinear, Soft Matter Phys., 2014, 90, 053012 CrossRef.
- G. Emmerson, Int. J. Heat Mass Transfer, 1975, 18, 381–386 CrossRef CAS.
- G. S. Emmerson and C. W. Snoek, Int. J. Heat Mass Transfer, 1978, 21, 1081–1086 CrossRef CAS.
- W. Bouwhuis, K. G. Winkels, I. R. Peters, P. Brunet, D. van der Meer and J. H. Snoeijer, Phys. Rev. E: Stat., Nonlinear, Soft Matter Phys., 2013, 88, 023017 CrossRef.
- Q. Cui, S. Chandra and S. McCahan, J. Heat Transfer, 2001, 123, 719–728 CrossRef CAS.
- H. Linke, B. J. Alemán, L. D. Melling, M. J. Taormina, M. J. Francis, C. C. Dow-Hygelund, V. Narayanan, R. P. Taylor and A. Stout, Phys. Rev. Lett., 2006, 96, 154502 CrossRef CAS.
- G. Lagubeau, M. Le Merrer, C. Clanet and D. Quéré, Nat. Phys., 2011, 7, 395–398 Search PubMed.
- P. Yi, P. Thurgood, N. Nguyen, H. Abdelwahab, P. Petersen, C. Gilliam, K. Ghorbani, E. Pirogova, S.-Y. Tang and K. Khoshmanesh, Soft Matter, 2020, 16, 8854–8860 RSC.
- A. A. Mills and J. D. Fry, Eur. J. Phys., 1982, 3, 152 CrossRef CAS.
- A. Mills and N. Sharrock, Eur. J. Phys., 1986, 7, 52 CrossRef CAS.
- K. Kroenlein, et. al., NIST/TRC Web Thermo Tables (WTT), NIST SRSD-3, Version 2-2012-1-pro technical report.
- L. R. Villegas, R. Alis, M. Lepilliez and S. Tanguy, J. Comput. Phys., 2016, 316, 789–813 CrossRef.
- J. M. Kolinski, L. Mahadevan and S. Rubinstein, EPL, 2014, 108, 24001 CrossRef.
- S. Lyu, V. Mathai, Y. Wang, B. Sobac, P. Colinet, D. Lohse and C. Sun, Sci. Adv., 2019, 5, eaav8081 CrossRef CAS.
- D. V. Zaitsev, D. P. Kirichenko, V. S. Ajaev and O. A. Kabov, Int. Heat Transfer Conf. Digital Library, 2018 Search PubMed.
- A. Shahriari, P. V. Acharya and V. Bahadur, ASME 2018 16th Int. Conf. on Nanochannels, Microchannels, and Minichannels, 2018, p. V001T06A006.
- A. Bouillant, T. Mouterde, P. Bourrianne, A. Lagarde, C. Clanet and D. Quéré, Nat. Phys., 2018, 14, 1188–1192 Search PubMed.
- V. S. Ajaev and O. A. Kabov, Int. J. Heat Mass Transfer, 2017, 108, 918–932 CrossRef.
- S. Wildeman, C. W. Visser, C. Sun and D. Lohse, J. Fluid Mech., 2016, 805, 636–655 CrossRef CAS.
- O. Ramrez-Soto, V. Sanjay, D. Lohse, J. T. Pham and D. Vollmer, Sci. Adv., 2020, 6, eaba4330 CrossRef.
- D. Lohse and X. Zhang, Nat. Rev. Phys., 2020, 1–18 Search PubMed.
- S. Lyu, H. Tan, Y. Wakata, X. Yang, C. K. Law, D. Lohse and C. Sun, Proc. Natl. Acad. Sci. U. S. A., 2021, 118, e2016107118 CrossRef.
Footnote |
| † Electronic supplementary information (ESI) available: Figure of the Leidenfrost temperature as a function of the saturation temperature, both normalized by the critical temperature. See DOI: 10.1039/d0sm01570a |
| This journal is © The Royal Society of Chemistry 2021 |

