
 Open Access Article
 This Open Access Article is licensed under a Creative Commons Attribution-Non Commercial 3.0 Unported Licence
Parasitic crystallization of colloidal electrolytes: growing a metastable crystal from the nucleus of a stable phase
Ignacio
Sanchez-Burgos
 a,
Adiran
Garaizar
a,
Carlos
Vega
b,
Eduardo
Sanz
b and
Jorge R.
Espinosa
*a
a,
Adiran
Garaizar
a,
Carlos
Vega
b,
Eduardo
Sanz
b and
Jorge R.
Espinosa
*a
aMaxwell Centre, Cavendish Laboratory, Department of Physics, University of Cambridge, J J Thomson Avenue, Cambridge CB3 0HE, UK. E-mail: jr752@cam.ac.uk
bDepartamento de Quimica Fisica, Facultad de Ciencias Quimicas, Universidad Complutense de Madrid, 28040 Madrid, Spain
First published on 21st December 2020
Abstract
Colloidal particles have been extensively used to comprehend the main principles governing liquid-crystal nucleation. Multiple mechanisms and frameworks have been proposed, through either experiments or computational approaches, to rationalise the ubiquitous formation of colloidal crystals. In this work, we elucidate the nucleation scenario behind the crystallization of oppositely charged colloids. By performing molecular dynamics simulations of colloidal electrolytes in combination with the Seeding technique, we evaluate the fundamental factors, such as the nucleation rate, free energy barrier, surface tension and kinetic pre-factor, that determine the liquid-to-solid transition of several crystalline polymorphs. Our results show that at a high packing fraction, there is a cross-over between the nucleation of the CsCl structure and that of a substitutionally disordered fcc phase, despite the CuAu crystal being the most stable phase. We demonstrate that the crucial factor in determining which phase nucleates the fastest is the free energy cost of the cluster formation rather than their kinetic ability to grow from the liquid. While at a low packing fraction, the stable phase, CsCl, is the one that nucleates and subsequently grows, we show how at moderate and high packing fractions, a disordered fcc phase subsequently grows regardless of the nature of the nucleating phase, termed parasitic crystallization. Taken together, our results provide a panoramic perspective of the complex nucleation scenario of oppositely charged colloids at moderate temperature and rationalise the different thermodynamic and kinetic aspects behind it.
I. Introduction
Liquids can be often cooled down below their freezing temperature without undergoing spontaneous crystallization. The reason behind this common behaviour is that metastable liquids need to overcome a free energy barrier to transform into a stable solid phase.1,2 The surmounting of such a barrier involves the formation of a critical nucleus of the solid phase, which, depending on the system and conditions, may range from a few to an arbitrarily large number of particles when close to coexistence (although within the range where experimentalists are able to determine nucleation rates, the critical nucleus ranges from tens to a few thousand particles).3 Nucleus formation is a stochastic process, which implies that foreseeing where and when the cluster will appear is not feasible. Besides, critical nuclei are usually rather small (of a few nm) and exhibit fast growth after their emergence, making their observation extremely challenging.4–7One of the most employed systems to gain comprehension about nucleation and crystallization processes is colloidal particles.8–13 Besides being highly interesting systems per se for their many different technological applications,14,15 they represent one of the few cases in which the formation of the nucleus can be directly tracked.4,7 Due to their large size (∼0.5 μm) and slow motion, colloids can be considered as big atoms, where the observation of the rising nucleus, and its size, shape, and post-critical growth can be experimentally accessible.4,7,16,17
In complement, molecular simulations have been widely used to perform nucleation studies of many diverse systems, such as hard-spheres,18–25 NaCl,26–32 argon,20,33 alloys,34,35 methane hydrates36–38 and water.39–48 On one hand, computational methods are highly suitable to tackle liquid-crystal transitions since the typical size of the nuclei ideally fits within the feasible simulation system size range. On the other hand, the emergence of the critical nucleus and its subsequent growth also match the affordable timescales in computer simulations (from hundreds to thousands of nanoseconds). Nonetheless, since nucleation entails the surmounting of a free energy barrier, spontaneous crystallization rarely occurs.49 Hence, to bias the formation of the critical nucleus, rare event techniques need to be employed. During the last 20 years, a huge effort in developing rare event methods to track nucleation by molecular simulations has been made.50–54
However, a good example of how challenging nucleation studies are is the several discrepancies still present in the literature regarding the nucleation rate. The nucleation rate, J, is the number of nuclei per unit of volume and time that appear in a system under the given conditions. J is a key magnitude in characterising the nucleation phenomenon, since (1) it accounts for the likelihood of the system to undergo the liquid-crystal phase transition and (2) it can bridge predictions from experiments and computer simulations. Nonetheless, discrepancies in the nucleation rate of common substances, such as water, are currently under debate, not only between different simulation techniques39,55,56 but also among different experimental setups.5,6,57 Likewise, in hard-sphere colloidal crystal nucleation, a long-standing discrepancy among crystal nucleation rates from experiments and computer simulations still persists,11,58,59 although several possible explanations have been recently discussed such as heterogeneous nucleation,60 incomplete shear melting,61 hydrodynamic effects on the crystal growth62 and the nucleation rate63,64 or sedimentation.65,66
In addition to these methodological, and experimental vs. numerical discrepancies in the nucleation rates of these systems, there is also a general debate in the nucleation community about the validity of Classical Nucleation Theory (CNT)67,68 to successfully describe nucleation in widely diverse scenarios. A considerable body of literature has shown that CNT may lead to quantitative inaccuracies when predicting nucleation rates69–73 (an excellent review on the assumptions, and therefore the limitations, of CNT is given in ref. 74). Some of these assumptions, such as the capillary approximation,75 non-Markovian dynamics76,77 or an inappropriate choice of the reaction coordinate78,79 can lead to a breakdown of the CNT predictions. Nonetheless, CNT has also been shown to provide remarkably good predictions for many different systems such as for the liquid-crystal nucleation of the 3-D Ising model,80 hard-spheres,19,20 NaCl,28 aluminum alloys,81 supercooled high-pressure silica,82 water,20,56 and bubble nucleation of argon.83 These several open debates clearly highlight the extreme complexity of the nucleation phenomenon.
Within colloidal systems, a particularly interesting case is the one of oppositely charged colloids,84–86 where the electrostatic interactions between colloids can be tuned such that different crystal structures87,88 may arise in the phase diagram (see Fig. 1).87 Due to this fact, polymorphic competition among different crystal phases can occur depending on the specific conditions,72,85 and an interplay between the free energy barrier of the cluster formation and its kinetic ability to grow from the metastable liquid can be crucial.
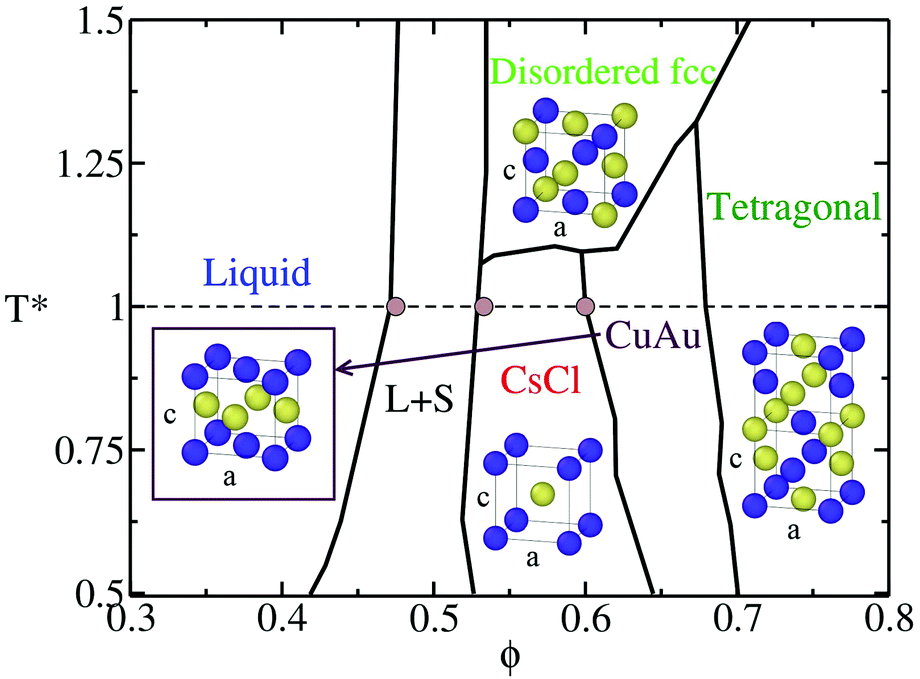 | ||
| Fig. 1 Phase diagram in the T*–ϕ plane of the discontinuous Yukawa potential (HS-Y) parametrised for reproducing the behaviour of oppositely charged colloids,86 taken from ref. 72 and 87. The unit cell of the different crystal structures is shown: CsCl (cubic symmetry), CuAu (tetragonal symmetry where c/a ∼ 0.96), tetragonal (tetragonal symmetry) and disordered fcc (cubic symmetry). The CuAu–tetragonal and CsCl–CuAu transitions are first order, but with a small density jump89 (see also Fig. 2); for this reason, a line depicts these transitions. Note that the disordered fcc unit cell only illustrates one possible disordered distribution of the oppositely charged colloids. L + S stands for the liquid–solid coexistence region. The horizontal dashed line indicates the considered isotherm of this study (T* = 1) and brown circles show the coexistence packing fractions predicted by our continuous model (PHS-Y). Note that the maximum packing fraction of the tetragonal phase is ∼0.74, although to better visualise the tetragonal unit cell, this region has been expanded. | ||
In this work, we investigate the crystal nucleation scenario of oppositely charged colloids by means of computer simulations. By developing a continuous potential version of the Yukawa model parametrised for reproducing the phase behaviour of colloidal electrolytes,86,87 we perform highly-optimized parallel Molecular Dynamics (MD) simulations within the Seeding framework90–92 to unveil the kinetic and thermodynamic interplay during the crystallization of several polymorphs with different crystal structures, CsCl, CuAu and a substitutionally ion-disordered fcc phase. In what follows, we show how, depending on the phase diagram region, the nucleating crystal phase may differ from the stable one, and that out-of-equilibrium post-critical growth of a parasitic phase can also take place independently of either the nucleating or the most stable crystalline phase under those conditions. Overall, our results provide a detailed characterisation of the key factors that determine the polymorphic crystallization scenario of oppositely charged colloids.
II. A continuous potential for oppositely charged colloidal particles
Monodisperse binary mixtures of oppositely charged colloids are standardly modelled by using a purely repulsive hard-sphere (HS) potential in combination with a screened Coulombic–Yukawa interaction term, uYukawa, of the form:86,87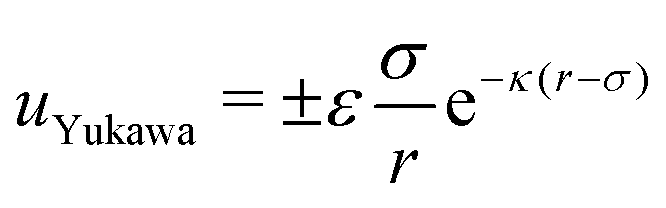 | (1) |
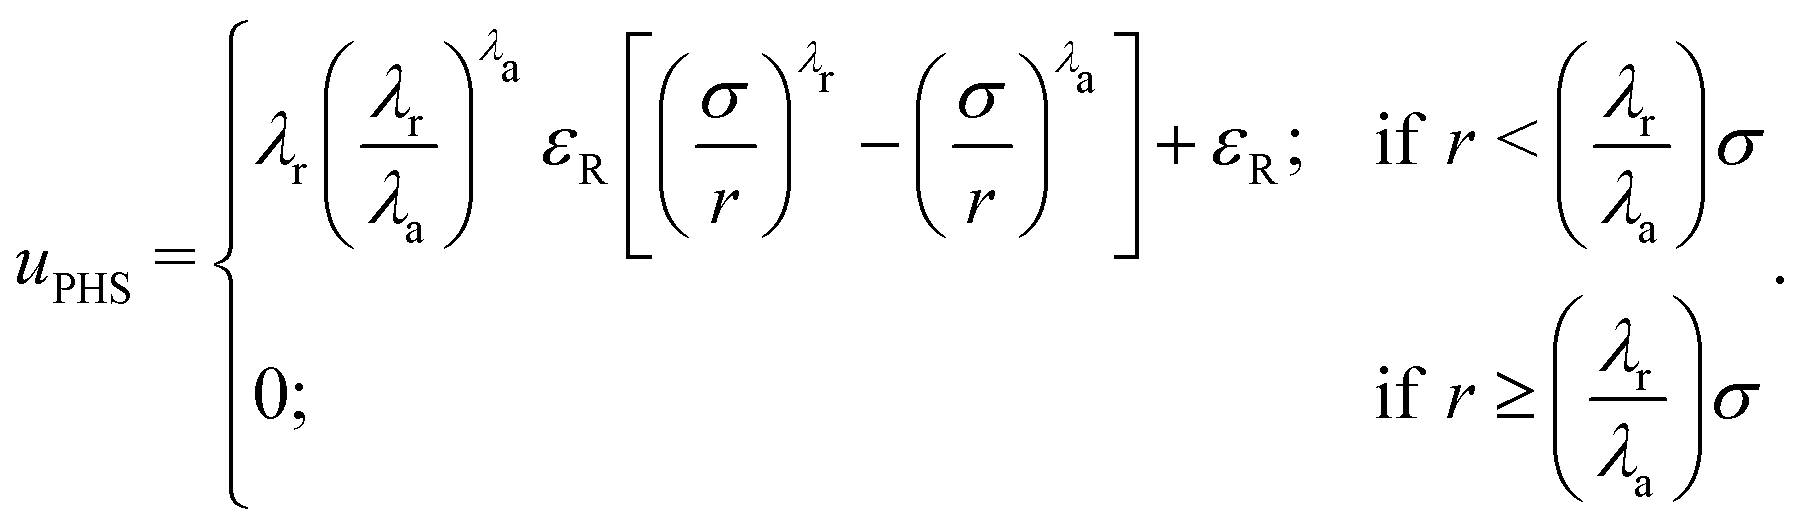
However, the HS-Y potential is discontinuous and, hence, not convenient for MD simulations. To be able to use MD simulations that can be efficiently parallelized, we substitute the HS potential by the successful pseudo-HS (PHS) model of Jover et al.93 The PHS potential quantitatively reproduces many properties of the HS phase behaviour such as the melting pressure,94 equation of state,93 diffusion coefficient,95 surface tension96 and nucleation rate among many others:97
 | (2) |
In this model, the diameter of the colloids is represented by σ, λa = 49 and λr = 50 are the exponents of the attractive and repulsive terms, respectively, εR is the energy shift of the pseudo hard-sphere interaction and r is the distance between two PHS particles.
We refer to the combination of the PHS and the Yukawa potentials as the PHS-Y model. To reproduce with this model the phase behaviour of 50![[thin space (1/6-em)]](https://www.rsc.org/images/entities/char_2009.gif) :50 binary mixtures of oppositely charged colloids,15 we set σ = 3.405 Å, εR/kB = 119.87 K and κσ = 6, as described in ref. 72 and 87. Since the continuous version of the HS potential, uPHS, can only capture the original HS behaviour at kBT/εR = 1.5 (which implies T = 179.81 K), we fixed the temperature in our simulations at T = 179.81 K and defined the temperature as T* = kBT/ε, modulating ε of the Yukawa term to vary the effective temperature of the system. Given that our study has been performed at T* = 1, the value of ε/kB is set to 179.81 K. The chosen cut-off radius for the colloidal interactions is 3σ. In what follows, we shall use reduced units: the reduced temperature T* = kBT/ε, the reduced pressure p* = pσ3/kBT, the reduced density ρ* = (N/V)σ3 and the volume fraction as ϕ = (π/6)ρ*. The unit of time is defined as τ = σ2/6DL, with DL being the liquid diffusion coefficient at each corresponding state.
:50 binary mixtures of oppositely charged colloids,15 we set σ = 3.405 Å, εR/kB = 119.87 K and κσ = 6, as described in ref. 72 and 87. Since the continuous version of the HS potential, uPHS, can only capture the original HS behaviour at kBT/εR = 1.5 (which implies T = 179.81 K), we fixed the temperature in our simulations at T = 179.81 K and defined the temperature as T* = kBT/ε, modulating ε of the Yukawa term to vary the effective temperature of the system. Given that our study has been performed at T* = 1, the value of ε/kB is set to 179.81 K. The chosen cut-off radius for the colloidal interactions is 3σ. In what follows, we shall use reduced units: the reduced temperature T* = kBT/ε, the reduced pressure p* = pσ3/kBT, the reduced density ρ* = (N/V)σ3 and the volume fraction as ϕ = (π/6)ρ*. The unit of time is defined as τ = σ2/6DL, with DL being the liquid diffusion coefficient at each corresponding state.
To implement the potential and carry out our simulations, we employed the MD LAMMPS package98 with the following numerical details; the chosen timestep for the Verlet integration of the equations of motion was 0.0016  (m is the mass of the colloidal particles and is 20 u.a.m), for NVT simulations we used the Nosé–Hoover thermostat99,100 with a typical relaxation time of 0.16
 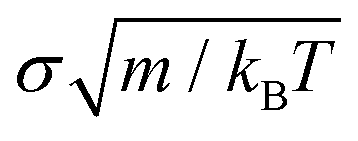 , and for NpT simulations, we additionally applied the Nosé–Hoover barostat101 with a typical relaxation time of 0.805
  . The continuous PHS-Y potential described in eqn (1) and (2) is introduced in tabular form.
We tested the accuracy of the new continuous potential (PHS-Y) against the original Yukawa model (HS-Y)86,87 by evaluating the equation of state (EOS) of the liquid and the different crystalline structures that may compete in nucleating at T* = 1. In Fig. 2, we compare Monte Carlo (MC) results of the HS-Y model (squares) with our continuous potential (lines) for the EOS of the liquid (blue), CsCl (red), CuAu (maroon) and substitutionally ion disordered face-centered-cubic (fcc) crystal phase (green). As can be seen, the agreement between the continuous and the discontinuous potential is excellent. Moreover, we computed the liquid and CsCl packing fraction at the liquid–CsCl coexistence pressure at T* = 1 as well as the CuAu ϕ at the CsCl–CuAU coexistence line for our model (further details are provided in Section IV.A). As shown in Fig. 1 (brown circles), the phase diagram of the PHS-Y potential employed in this work is very similar to that of the HS-Y model (at least at T* = 1, although it is expected to work for other T* values as well). In Fig. 2, MC data obtained by following the numerical details given in ref. 86 and 87 are shown. For generating the substitutionally disordered fcc crystal configurations used in this work, we employed MC swap moves as detailed in ref. 85 and 87, adjusting the disorder degree of the lattice to the one corresponding to T* = 1.4, just above the disordered-to-ordered (CuAu) transition temperature observed from T* ∼ 1.3 to 1.15 depending on ϕ.89 Interestingly, despite having a similar arrangement of atoms (when c/a = 1), the density of the CuAu crystal phase is significantly higher than that of the disordered fcc phase. This is due to the fact that in the CuAu phase, every colloid is surrounded by other colloids of the opposite charge, so the lattice can reach a higher density without being destabilised by unfavourable interactions of the same sign as in the disordered fcc crystal.
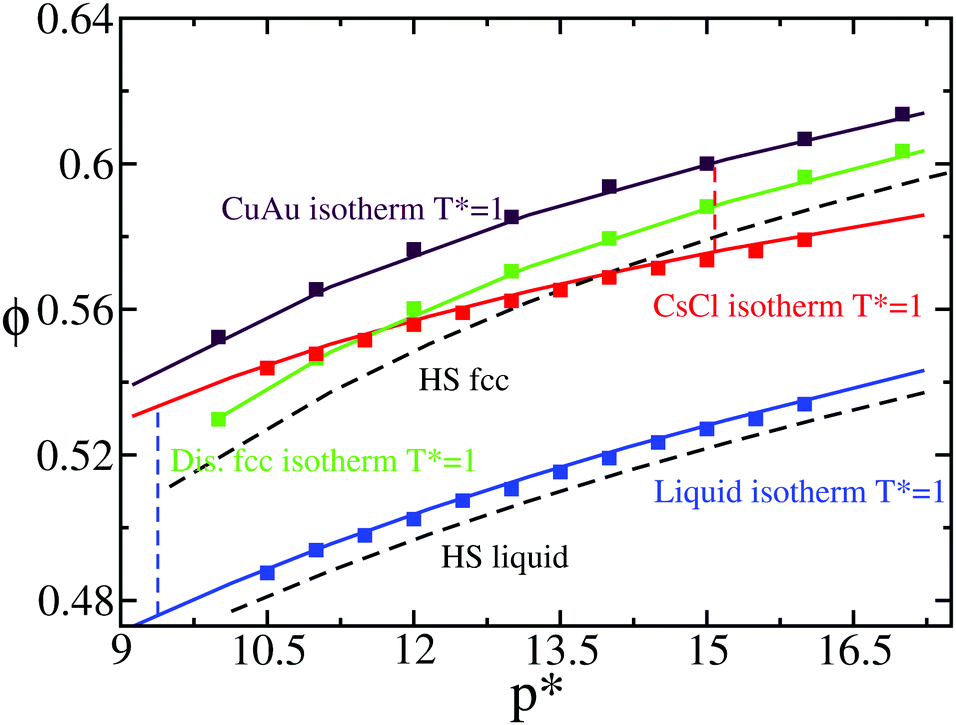 | ||
| Fig. 2 Equation of state (EOS) of the liquid (blue) and the different crystal phases CsCl (red), CuAu (maroon) and disordered fcc (green) at T* = 1. Square symbols represent values from the HS-Y model using Monte Carlo simulations, while lines represent the values of our new continuous potential, PHS-Y. The disordered fcc crystals were generated using MC swap moves at T* = 1.4. A quadratic fit of the liquid EOS of our continuous model is given by p* = 99.087 − 455.61ϕl + 561.24ϕl2. Note that this fit is only valid from a liquid volume fraction of ϕl = 0.47 to ϕl = 0.55. Black dashed curves indicate the equation of state of the liquid and the fcc crystal phase of hard spheres93 for later comparison. The coexistence pressure of the liquid–CsCl and CsCl–CuAu transitions is represented by blue and red vertical dashed lines, respectively. | ||
III. Seeding framework for crystal nucleation
In the last few years, among the different available rare event techniques used to study crystal nucleation,50–52,54 a simple and computationally efficient approach has emerged, the Seeding technique.90–92 Even though the success of Seeding in predicting accurate nucleation rates and free energy barriers relies on the validity of Classical Nucleation Theory67,68 (extensively discussed in ref. 74) and on the assumption that a local order parameter can adequately distinguish between particles belonging to the stable and metastable phases, the popularity of Seeding for nucleation studies is sharply increasing.102–107 Despite its approximations, Seeding has been shown to be consistent with independent calculations at moderate metastability using techniques like Umbrella sampling50 or Forward flux sampling51 as well as with non-biased calculations (i.e. brute force simulations) in the deep supercooled regime.20,28,108 Thus, we employ Seeding to investigate the crystal nucleation scenario among the different crystal polymorphs of oppositely charged colloids. Within the CNT-Seeding framework, the nucleation rate J is defined as18,68| J = ρlZf+exp(−ΔG/(kBT)) | (3) |
 ), Z is the Zeldovich factor, which accounts for the curvature of the top of the free energy barrier, and f+ is the frequency of ion attachment/detachment to the critical cluster. The expression for Z is
 | (4) |
 | (5) |
 | (6) |
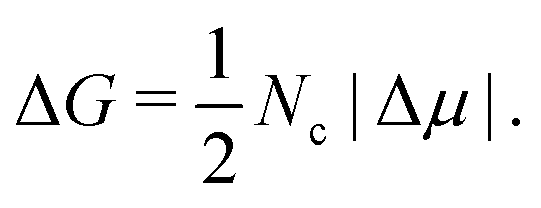
Additionally, by assuming a spherical shape of the critical cluster, the CNT framework also provides an expression for the interfacial free energy:
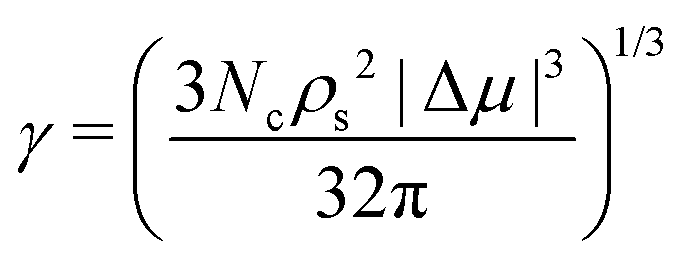 | (7) |
 ).
).
As previously mentioned, the success of Seeding predictions relies on how accurate a local order parameter is when distinguishing the number of particles that belong to the critical cluster. In earlier work,20 it has been demonstrated that when the number of mislabelled particles by the order parameter is the same for the bulk solid phase and for the bulk liquid one, the order parameter can provide reliable estimates of J and, hence, free energy barriers and interfacial free energies.
Here, we use the ![[q with combining macron]](https://www.rsc.org/images/entities/i_char_0071_0304.gif) 4–6 local order parameters proposed by Lechner and Dellago109 within the mislabelling scheme20 to identify the number of particles belonging to clusters of each crystal polymorph. The cut-off distance for both computing the 4 and 6 parameters and identifying the biggest cluster was 1.41σ. In Fig. 3(a), we show a plot of the 4–6 points for colloidal particles in the bulk liquid (blue) and in the different bulk crystal phases, CsCl (red), CuAu (maroon) and disordered fcc (green), at T* = 1 and p* = 13 (liquid packing fraction ϕl = 0.514). As can be observed, the 6 parameter successfully discriminates between liquid-like and the different crystal-like particles. Likewise, the 4 parameter distinguishes between the CsCl (body centered cubic) crystal structure and the ion-disordered fcc and CuAu crystal phases. However, the 4 parameter cannot reliably discriminate between CuAu-like particles and disordered fcc-like ones, since the main difference between these two crystal phases is the charge identity of the ions rather than their position within the lattice. A criterion to distinguish between CuAu-like particles and disordered fcc-like ones is described in Section IV.B (Fig. 7). Additionally, in Fig. 3(b), we plot the mislabelling 6 optimal threshold for discriminating between liquid-like and crystal-like colloids as a function of the liquid packing fraction at T* = 1. The 4 optimal threshold for identifying CsCl-like particles versus CuAu-like or disordered fcc ones as a function of ϕl is shown in the inset of Fig. 3(b). Within the mislabelling scheme, we find that the percentage of mislabelled particles in the bulk phases at the selected 6 and 4 optimal thresholds is below 0.001% and 0.1%, respectively.
4–6 local order parameters proposed by Lechner and Dellago109 within the mislabelling scheme20 to identify the number of particles belonging to clusters of each crystal polymorph. The cut-off distance for both computing the 4 and 6 parameters and identifying the biggest cluster was 1.41σ. In Fig. 3(a), we show a plot of the 4–6 points for colloidal particles in the bulk liquid (blue) and in the different bulk crystal phases, CsCl (red), CuAu (maroon) and disordered fcc (green), at T* = 1 and p* = 13 (liquid packing fraction ϕl = 0.514). As can be observed, the 6 parameter successfully discriminates between liquid-like and the different crystal-like particles. Likewise, the 4 parameter distinguishes between the CsCl (body centered cubic) crystal structure and the ion-disordered fcc and CuAu crystal phases. However, the 4 parameter cannot reliably discriminate between CuAu-like particles and disordered fcc-like ones, since the main difference between these two crystal phases is the charge identity of the ions rather than their position within the lattice. A criterion to distinguish between CuAu-like particles and disordered fcc-like ones is described in Section IV.B (Fig. 7). Additionally, in Fig. 3(b), we plot the mislabelling 6 optimal threshold for discriminating between liquid-like and crystal-like colloids as a function of the liquid packing fraction at T* = 1. The 4 optimal threshold for identifying CsCl-like particles versus CuAu-like or disordered fcc ones as a function of ϕl is shown in the inset of Fig. 3(b). Within the mislabelling scheme, we find that the percentage of mislabelled particles in the bulk phases at the selected 6 and 4 optimal thresholds is below 0.001% and 0.1%, respectively.
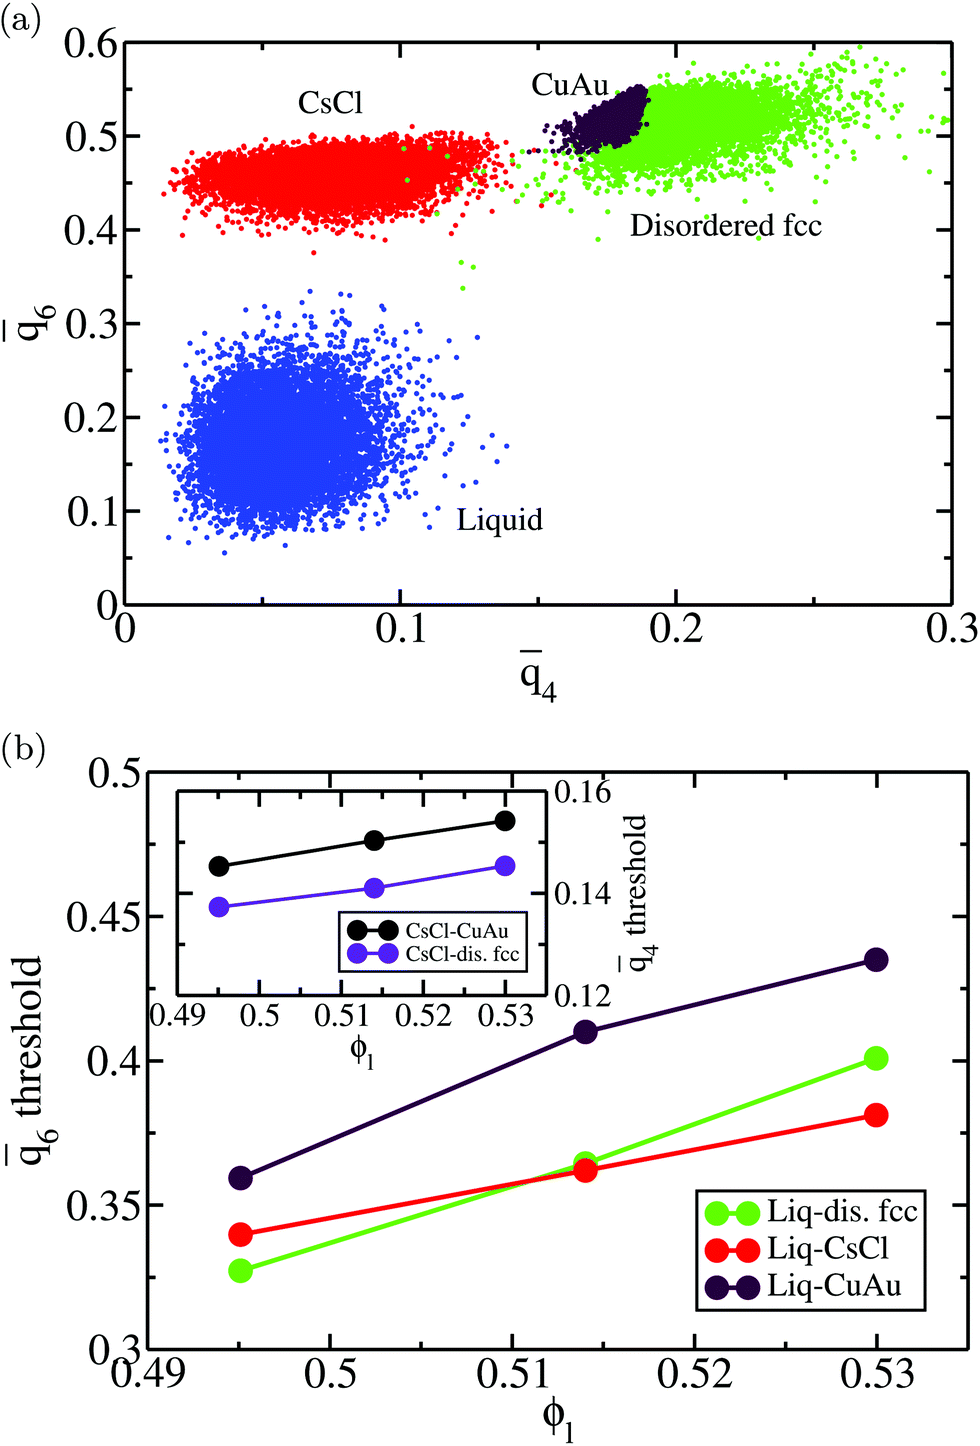 | ||
| Fig. 3 (a) 4–6 plot for 10000 particles of the bulk liquid (blue) and the different crystal bulk phases, CsCl (red), CuAu (maroon) and disordered fcc (green), at T* = 1 and p* = 13, which corresponds to a liquid packing fraction of ϕl = 0.514. (b) Dependence of the 6 optimal threshold within the mislabelling criterion between the liquid and the different crystalline structures as a function of the liquid packing fraction at T* = 1. The liquid and solid phases studied are compared at the same pressure, which corresponds to that of the liquid at the liquid packing fraction indicated in the figure. The inset shows the 4 optimal threshold for distinguishing between the CsCl crystal phase (body centered cubic) and the CuAu and disordered fcc phases as a function of ϕl at T* = 1. | ||
IV. Nucleation scenario of oppositely charged colloids
A. On the relative stability between the liquid and the different crystal phases
The phase diagram of 50:50 binary mixtures of colloidal electrolytes contains several different crystal phases87 that may compete in nucleating from the liquid depending on the T*–ϕ conditions (see Fig. 1). Whereas at moderately high temperatures (T* > 1.15), the liquid coexists with a substitutionally disordered fcc colloidal phase, at low temperatures, the stable solid coexisting with the liquid is the CsCl crystal phase. Additionally, at a low temperature and a higher packing fraction, the CuAu crystal becomes more stable than the CsCl phase. However, the stability limit of the CuAu phase only extends up to a reasonably high packing fraction, where upon reaching that limit, the most stable phase becomes the tetragonal crystal phase87,89 (see Fig. 1).
Since we shall focus on the nucleation scenario at T* = 1, we start determining the relative stability between the liquid and the different crystal phases that may nucleate at T* = 1 using direct coexistence (DC) simulations.94,110 By placing in the same simulation box a liquid slab of ∼3000 colloidal particles in contact with a slab of ∼3000 colloidal particles of each crystal phase, we evaluate the coexistence pressure at which the crystals neither grow nor melt. The coexistence pressures at T* = 1 for each solid phase with the liquid are 9.38(3), 11.19(3) and 11.62(3) (in reduced units) for the CsCl, CuAu and disordered fcc phases, respectively.
Furthermore, we perform thermodynamic integration111 to (1) evaluate the chemical potential difference (Δμ) between the liquid and each crystal phase along ϕl and (2) study the relative stability among the different crystal phases. In Fig. 4, we plot Δμ as a function of the liquid packing fraction for the three different crystal phases. As can be seen, at a low packing fraction, the CsCl crystal (red) is the most stable phase, while at a moderate packing fraction, ϕl > 0.53, the CuAu crystal (maroon) becomes the most stable phase. We also observe that, independently of ϕl, the disordered fcc phase (green) always remains metastable, with respect to the CsCl phase (at a low packing fraction) or to the CuAu crystal (at any ϕl). However, at ϕl ∼ 0.54, the chemical potentials of the CsCl and disordered fcc phases become similar.
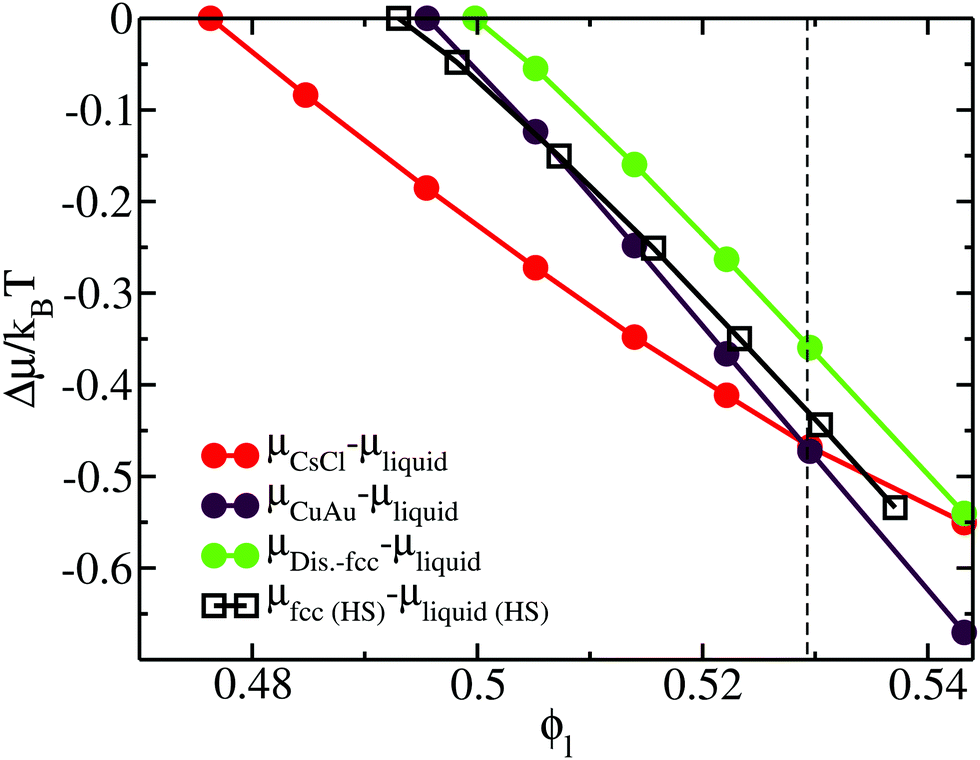 | ||
| Fig. 4 Chemical potential difference (per particle) (μsolid–μliquid) between the different colloidal crystal phases and the liquid (filled circles) as a function of the liquid packing fraction at T* = 1. The chemical potential of the solid is evaluated at the same pressure that has to be applied in the liquid to obtain ϕl. Results of the chemical potential difference between the fcc crystal phase and the bulk liquid phase (empty squares) of purely repulsive hard-sphere colloids93 as a function of ϕl are also included. The black vertical dashed line indicates the packing fraction at which the CsCl–CuAu transition takes place in the HS-Y model from ref. 72 and 87. | ||
B. Crystal nucleation rate of the different polymorphs
We exploit the Seeding suitability to investigate the different crystalline structures emerging from the metastable liquid112 by performing Seeding simulations of the CsCl, CuAu and disordered fcc solid phases. In Table 1, we report the results for the number of particles in the critical cluster (Nc), the pressure, , and the packing fraction, ϕl, at which the cluster was found critical, as well as the density of the liquid and solid phases (
 and
and  ), the chemical potential difference between the solid and the liquid (Δμ), the liquid–crystal interfacial free energy (γ), the free energy barrier height (ΔG), the attachment rate (f+), the Zeldovich factor (Z) and the decimal logarithm of the nucleation rate (log10J) at such conditions.
|
|
ϕ l | N c |
|
|
Δμ/kBT | γ/(kBT/σ2) | ΔG/kBT | f +/(6DL/σ2) | Z | log10(J/(6DL/σ5)) |
|---|---|---|---|---|---|---|---|---|---|---|
| CsCl | ||||||||||
| 12.931 | 0.5119 | 212 | 0.9777 | 1.0760 | −0.331 | 0.643 | 35.07 | 525.5 | 0.0091 | −14.56 |
| 12.564 | 0.5086 | 276 | 0.9715 | 1.0711 | −0.304 | 0.642 | 41.93 | 1143.5 | 0.0076 | −17.28 |
| 12.022 | 0.5036 | 399 | 0.9619 | 1.0634 | −0.261 | 0.621 | 52.10 | 1084.0 | 0.0059 | −21.84 |
| 11.350 | 0.4971 | 801 | 0.9495 | 1.0533 | −0.203 | 0.606 | 81.35 | 1164.5 | 0.0037 | −34.72 |
| Disordered fcc | ||||||||||
| 15.140 | 0.5295 | 193 | 1.0114 | 1.1264 | −0.357 | 0.692 | 34.43 | 2537.0 | 0.0099 | −13.55 |
| 14.700 | 0.5263 | 334 | 1.0052 | 1.1195 | −0.315 | 0.731 | 52.61 | 4128.0 | 0.0071 | −21.38 |
| 14.260 | 0.5229 | 460 | 0.9988 | 1.1121 | −0.272 | 0.699 | 62.59 | 4935.5 | 0.0056 | −25.74 |
| 13.904 | 0.5201 | 681 | 0.9934 | 1.1057 | −0.237 | 0.691 | 80.59 | 3082.5 | 0.0043 | −33.88 |


Even though crystalline clusters of the three polymorphs were inserted, we were only able to measure the nucleation rate for the CsCl and disordered fcc phases. CuAu crystal clusters rapidly show a martensitic transformation113 into the stable CsCl phase at any packing fraction below ϕl < 0.528, and beyond that, the fluid spontaneously crystallizes (so that Seeding is not needed). The mechanism by which the CuAu nuclei transform into CsCl ones in the stability region of the CsCl crystal (below a packing fraction of 0.528) is a diffusionless phenomenon (i.e., particle diffusion is not necessary to produce it) in which the solid interconversion (martensitic transformation) occurs via deformation of the unit cell. In this case, the tetragonal unit cell of the CuAu crystal nuclei transforms into the cubic unit cell of the CsCl crystal. This is possible because the cubic CsCl crystal (c = a) can also be considered as a tetragonal CuAu-like structure with  (see Fig. 1 for more details on these two unit cells).89
We show the nucleation scenario between the CsCl and the disordered fcc crystal phases at T* = 1 by plotting in Fig. 5 the nucleation rate of both polymorphs as a function of ϕl. Our results clearly evidence that, from low to moderate packing fraction (ϕl < 0.53), the CsCl structure possesses the fastest nucleation rate (red curve). At a higher packing fraction (ϕl > 0.535), the disordered fcc J (green curve) becomes equivalently competitive with respect to the CsCl rate. Nonetheless, for ϕl > 0.517, we observe post-critical crystal growth of the disordered fcc phase from the CsCl critical nuclei, termed parasitic crystallization (red dashed dotted vertical line). We also show an estimation of the nucleation rate for the CuAu structure in Fig. 5 (dashed dotted maroon curve). By assuming that γ does not depend sensibly on the crystal structure (as will be shown in Section IV.C) and using the previously calculated values of Δμ and  for the CuAu crystal, we calculate Nc as a function of ϕlviaeqn (7). Then, using eqn (8), we evaluate ΔG, and assuming that the attachment rate must be of the order of magnitude of the CsCl one, we estimate J (using eqn (3)) for the CuAu crystal phase. As expected, the nucleation rate of the CuAu structure only becomes competitive with respect to that of the CsCl phase at pressures where ϕl > 0.53 (i.e. at a moderately high packing fraction), in the stability region of the CuAu crystal. Since γ for CuAu is assumed to be the same as those for the CsCl and disordered fcc crystals, the key factors in determining the nucleation rate are the solid density and the chemical potential difference Δμ. Note that the predicted CuAu J can also be regarded as the approximate upper bound limit of very small disordered fcc crystals (with a positional ion-disorder degree lower than that at T* = 1.4).
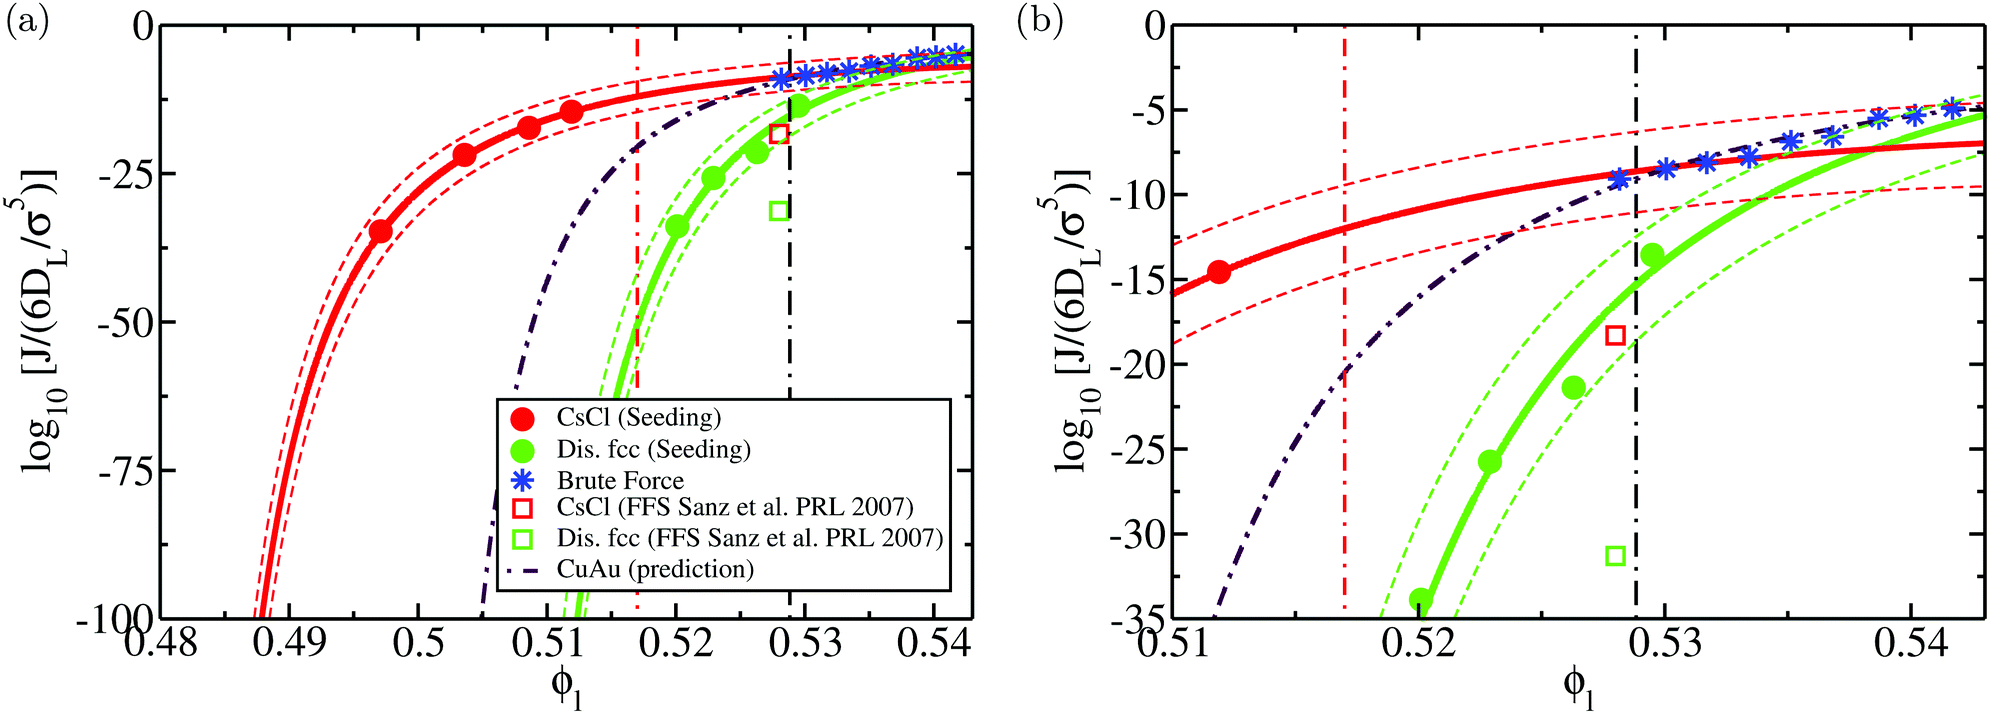 | ||
| Fig. 5 (a) Logarithm of the nucleation rate as a function of the liquid packing fraction for the CsCl (red) and disordered fcc (green) crystal phases. Circles indicate the Seeding estimates of J while continuous lines are the CNT-like fits20 to the Seeding results. Dashed curves indicate the upper and lower bounds of uncertainty of the Seeding results. Empty squares represent the nucleation rate obtained via Forward-Flux Sampling calculations from ref. 72 for the CsCl crystal phase (red) and for a disordered fcc phase (green). Blue asterisks account for the nucleation rates obtained using brute force calculations. The dashed dotted maroon curve shows a prediction of the nucleation rate for the CuAu crystal phase assuming that its γ is the same as those of the CsCl and disordered fcc phases. The vertical black dashed dotted line indicates the coexistence line between the CsCl and CuAu crystal phases according to the crossover in Δμ shown in Fig. 4, while the red dashed dotted line represents the lowest ϕl at which parasitic crystallization from the CsCl phase is observed. (b) Inset of (a) to better visualise the spontaneous nucleation regime. | ||
To further check which crystal phase nucleates the fastest at a moderately high ϕl (p* = 15), we insert “frozen” clusters (where the particles belonging to the crystal structure are kept rigid to avoid the martensitic transformation from CuAu to CsCl) of the three different polymorphs into the liquid phase. By inserting clusters of N = 30, we observe that the average time (of five independent trajectories) that it takes for each solid cluster to irreversibly grow under such conditions is 25, 40 and 2200σ2/6DL for the CsCl, CuAu and disordered fcc phases, respectively. Although these results cannot be directly related to the nucleation rate, they support the predicted scenario of J shown in Fig. 5.
Moreover, to validate our Seeding estimations of the nucleation rate, we perform brute force calculations at a high packing fraction (from ϕl = 0.528 to ϕl = 0.542, see Table 2). As can be seen in Fig. 5, the CsCl curve of J converges at ϕl > 0.528 with the brute force nucleation rates (blue asterisks), whereas the disordered fcc values of J coincide with the brute force nucleation rates at ϕl > 0.538. We obtain the structure of the crystalline clusters near the top of the free energy barrier (just before irreversible crystal growth) by comparing their radial distribution function, g(r), to those of spherical clusters of similar size cut from the different bulk crystal polymorphs under such conditions (only the particles belonging to the cluster are considered when computing g(r), thus their convergence to zero occurs at long distances). Our simulations reveal that at p* = 15, the structure of the crystalline clusters is predominantly CsCl-like (see snapshots a, b and c of Fig. 6). The radial distribution function of these clusters is plotted in Fig. 6(j) against those of the CsCl, CuAu and disordered fcc spherical clusters of 50 colloidal particles cut from equilibrated bulk configurations. As indicated by black arrows, the g(r) functions of the different brute force clusters exhibit the characteristic peaks of a CsCl-like radial distribution function. Nevertheless, at p* = 16.75, the structure of the clusters turns out to be more disordered, although, given their small size, it is difficult to discern. In the inset of Fig. 6j, we show how their g(r) functions compare to those of spherical clusters of 15 colloids for each polymorph cut from bulk simulations at p* = 16.75. Obviously, it is difficult (and maybe useless) to assign a solid structure to a cluster having only 15 particles. We additionally determine the nature of the resulting crystallized systems from brute force simulations by comparing their radial distribution function with those of the different bulk polymorphs. As shown in Fig. 6k, the resulting crystals (blue thin curves) predominantly exhibit fcc coordination with ion charge disorder as depicted in the snapshots shown in (d) and (h) for p* = 15 and p* = 16.75, respectively.
| p* | N T | 〈V〉/σ3 | 〈t〉/(σ2/6DL) | log10(J/(6DL/σ5)) |
|---|---|---|---|---|
| 17.25 | 1000 | 964 | 19.9 | −4.28 |
| 17 | 2000 | 1932 | 41.4 | −4.90 |
| 16.75 | 2000 | 1938 | 109.0 | −5.32 |
| 16.5 | 2000 | 1945 | 162.6 | −5.50 |
| 16.25 | 54000 |
52670 |
73.0 | −6.58 |
| 16 | 54000 |
52806 |
140.4 | −6.87 |
| 15.75 | 54000 |
52941 |
1123 | −7.77 |
| 15.5 | 54000 |
53177 |
2401 | −8.11 |
| 15.25 | 54000 |
53347 |
5461 | −8.46 |
| 15 | 54000 |
53530 |
22459 |
−9.08 |
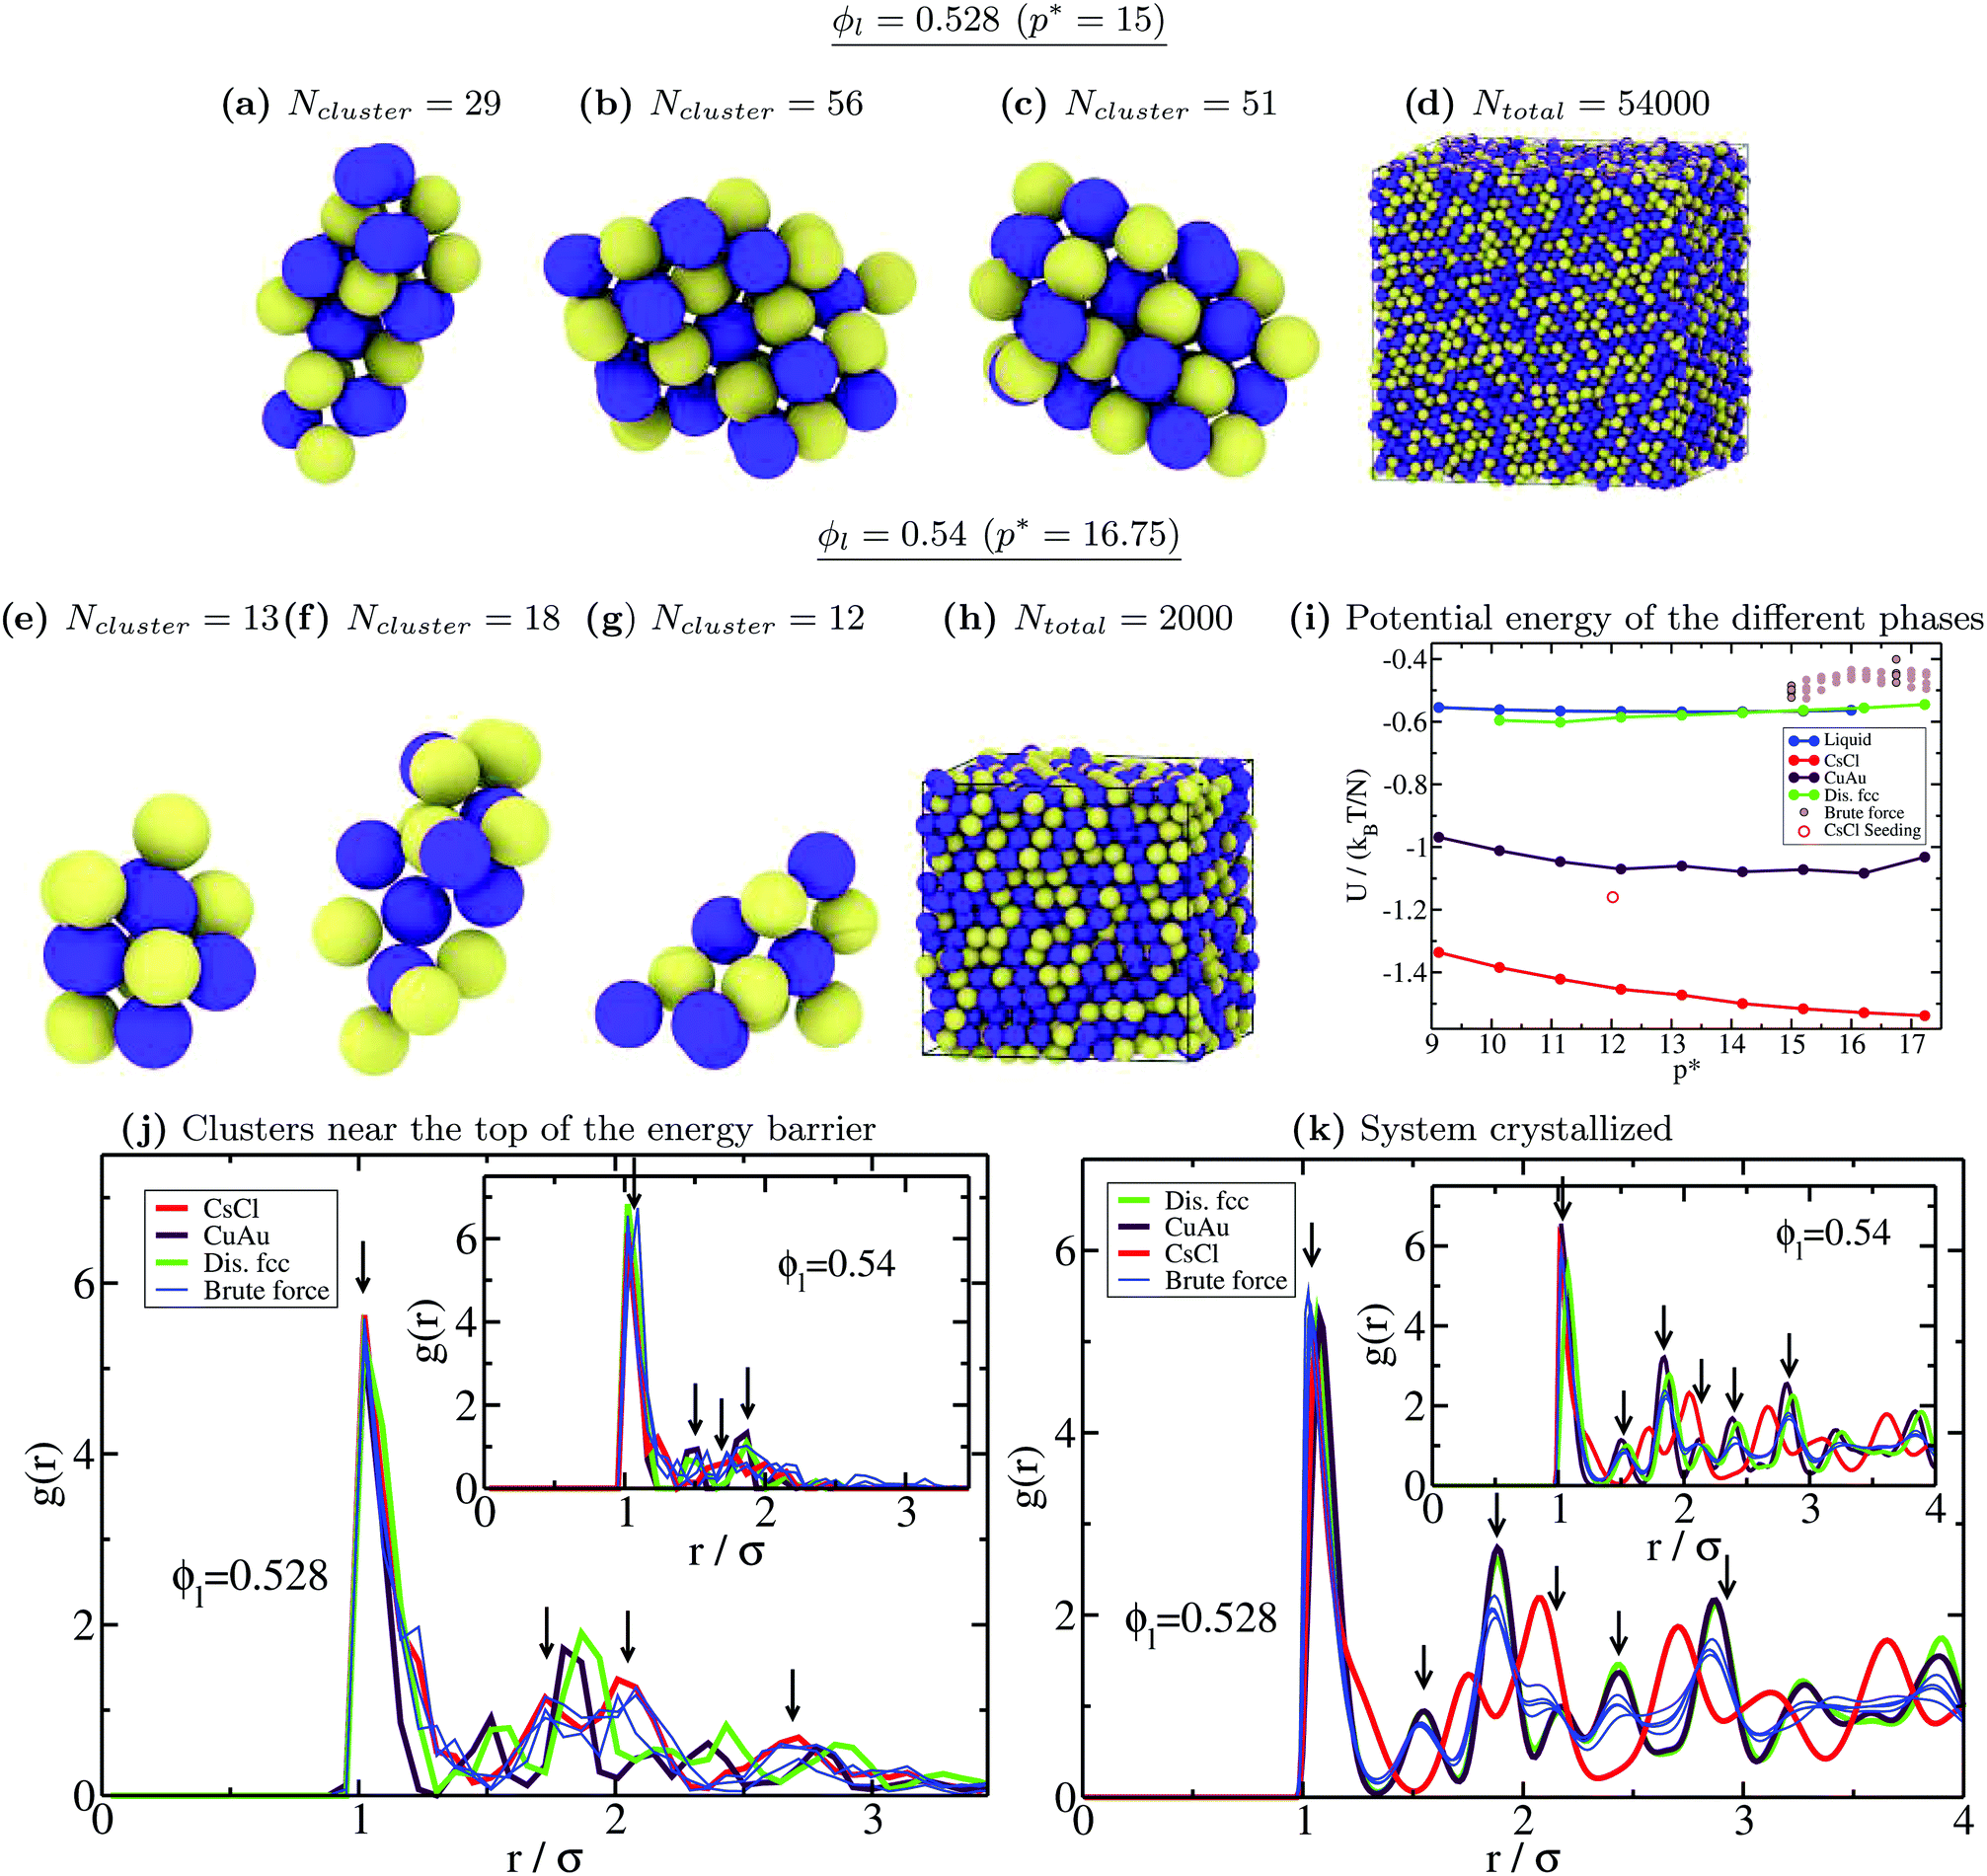 | ||
| Fig. 6 (a)–(c) Snapshots of three different crystalline clusters from independent trajectories identified just before irreversible crystal growth in brute force calculations at ϕl = 0.528 and T* = 1. Yellow particles indicate positively charged colloids and blue ones indicate negatively charged colloids. Ncluster indicates the total number of colloidal particles determined by the 6 local order parameter within the mislabelling criterion. (d) Snapshot of the crystallized system (disordered fcc) of a brute force trajectory at ϕl = 0.528. Similar results in all the different trajectories were found. (e)–(g) Snapshots of three different crystalline clusters from independent runs identified just before irreversible crystal growth in brute force simulations at ϕl = 0.54 and T* = 1. (h) Snapshot of the crystallized system (disordered fcc) of a brute force simulation at ϕl = 0.54. (i) Potential energy U of the bulk liquid (blue), and CsCl (red), CuAu (maroon) and disordered fcc (green) crystal phases as a function of pressure. Brown circles indicate the potential energy of the different brute force trajectories upon crystallization (thick contours indicate the two pressures considered in this figure). The red circle represents U for the crystallized system of a Seeding trajectory with a CsCl seed at ϕl = 0.512 (see the snapshot in Fig. 7). (j) All-particle radial distribution function of spherical 50-colloid clusters cut from bulk configurations of the different crystal polymorphs at ϕl = 0.528 and T* = 1 (inset: 15-colloid clusters cut from bulk crystal configurations at ϕl = 0.54 and T* = 1). Blue thin curves represent the radial distribution function of the clusters shown above. Black down arrows indicate the most representative peaks shown by the cluster g(r) functions. (k) All-particle radial distribution function of the different bulk crystal structures at ϕl = 0.528 and T* = 1 (inset: ϕl = 0.54 and T* = 1) along with those obtained for the crystallized system (blue curves) resulting from several independent trajectories of brute force simulations under those conditions. | ||
We also compare the potential energy U (configurational contribution to the internal energy) of the different crystallized systems with those of the different bulk phases as a function of pressure (Fig. 6i). As can be seen, the obtained crystals from brute force simulations show slightly higher values of U, but of the same order, than that of the disordered fcc bulk phase under such conditions. The higher values of U can be explained by the presence of lattice defects caused by fast crystal growth, defects near the boundary conditions due to a mismatch between the crystal orientation and the simulation box, or just by a higher degree of ion disorder in the crystal lattice. For similar reasons, the potential energy of a crystallized CsCl-seeded trajectory into a CsCl crystal (according to the 4 local order parameter, as shown in Fig. 7) also exceeds the bulk CsCl U under the same conditions (empty red square in Fig. 6i).
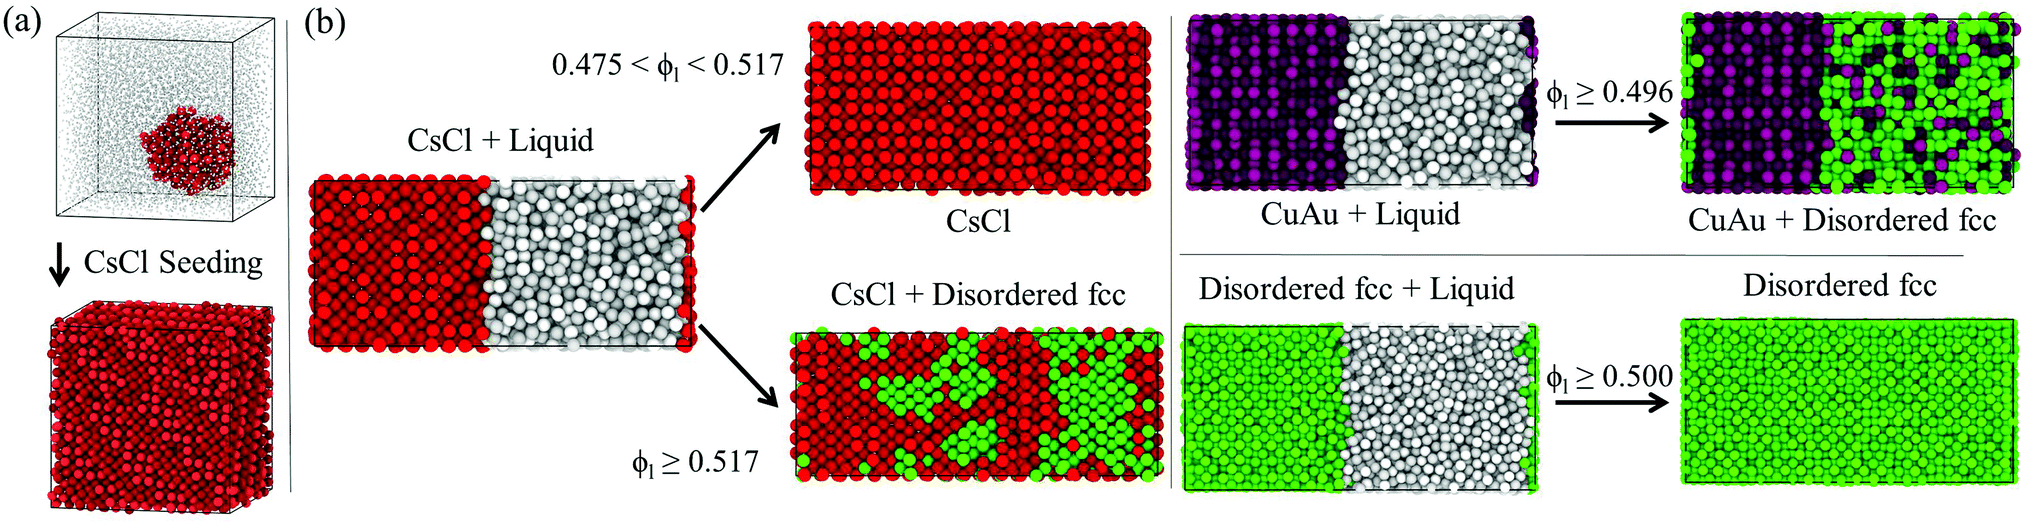 | ||
| Fig. 7 (a) Initial and final configurations of a CsCl-seed Seeding trajectory at ϕl = 0.512 and T* = 1. CsCl-like particles are labelled in red and liquid-like particles are labelled in grey according to the 6 mislabelling criterion. To provide better visualisation of the nucleus, liquid-like colloids are resized to a lower σ. The internal energy of the final configuration is given in Fig. 6(i) (empty red circle). (b) Direct coexistence simulations showing the crystal growth behaviour of the different polymorphs at different packing fractions at T* = 1. CsCl-like particles are labelled in red, CuAu-like ones are labelled in maroon, disordered fcc-like ones are labelled in green and liquid-like ones are labelled in grey. To discriminate between liquid-like and crystal-like particles, we use the 6 local order parameter, while for differentiating between CsCl-like (bcc) particles and either CuAu or disordered fcc-like ones, we use the 4 parameter, as shown in Fig. 3. To distinguish between CuAu (ordered) and disordered fcc crystal-like particles, we employ a criterion based on labelling CuAu-like particles those that have at least 12 CuAu-like neighbours, considering as a CuAu neighbour a particle that possesses at least 8 or more neighbours of the opposite charge at a cut-off distance of 1.25σ (the first minimum of an all-particle radial distribution function of a bulk fcc crystal including the first two coordination shells). | ||
In Fig. 5, we also include the values of J evaluated via Forward flux sampling (FFS) calculations at p* = 15 for the CsCl crystal phase (red square) and a disordered fcc structure (green square) reported in ref. 72. Our Seeding results predict a nucleation rate of both phases about 10 orders of magnitude higher than those reported in ref. 72. In contrast, our Seeding results for the CsCl phase are in very good agreement with the brute force calculations under such conditions (and also up to a higher packing fraction). Since brute force results contain no approximation, and they can be regarded as a benchmark for methodologies aiming to estimate J for nucleation, these results support the validity of CNT in describing the nucleation behaviour of colloidal electrolytes (at least at T* = 1). The discrepancy between the Seeding and FFS nucleation rates is somewhat not surprising since, on the one hand, it has been previously found that FFS calculations may underestimate the nucleation rate by a few orders of magnitude when the sampling is not extremely large,26,44,114,115 and on the other, because Seeding results may also have an uncertainty (systematic + statistical) of about 3–5 orders of magnitude in the nucleation rate (see Fig. 5). However, our estimations of J qualitatively agree with those from ref. 72 in arguing that the nucleation rate of CsCl is sensibly faster than that of the disordered fcc phase at this packing fraction.
The Seeding uncertainty in the nucleation rate (and also in ΔG and γ) mainly comes from (1) the systematic error in the calculation of the number of particles in the critical cluster (Nc) and (2) the statistical uncertainty in the determination of the conditions under which the cluster becomes critical. It is difficult to accurately evaluate the impact of the systematic error in Nc since different (reasonable) order parameters may provide moderately different values of the critical cluster size. For that reason, we consider that our estimates of Nc might be affected by an uncertainty of ±Nc2/3 (the outer layer particles in the cluster, which is where different order parameters may provide different estimations). Regarding the statistical uncertainty in the determination of the critical pressure of each cluster (trajectory stochasticity + the use of a given grid of simulated pressures), we ascribe to the associated error of the critical pressure ±1/2 of the pressure grid employed to determine the critical pressure of each cluster (we typically use ten independent trajectories every 0.01p*). Other minor sources of error, such as the uncertainty in the chemical potential difference between the liquid and the crystal phases and their density dependence on pressure, have also been considered, although they contribute very modestly. By taking into account these different sources of error, we have evaluated the upper and lower bounds of the nucleation rate uncertainty, as shown in Fig. 5 (the uncertainty in ΔG and γ will be shown in the following section).
We observe in our Seeding simulations that independent of the nature of the inserted crystalline seeds, the post-critical cluster growth is highly enriched in disordered fcc crystal domains at a moderately high packing fraction. To quantitatively characterise this parasitic crystal growth behaviour of a metastable phase upon the formation of the critical nucleus, we perform direct coexistence simulations of a liquid slab in coexistence with each different crystalline structure from low to high packing fraction.
As depicted in Fig. 7, CsCl crystals (the spherical cluster in (a) or the solid slab with a flat interface in (b) left panel) only grow in equilibrium up to packing fractions of ϕl < 0.517, well below their stability limit at ϕl = 0.528. Above ϕl > 0.517, the crystal growth occurs so fast that it impedes the correct positional order of the colloids into the stable CsCl lattice, and thus, stacking mixtures of CsCl and disordered fcc layers arise. Conversely, CuAu and disordered fcc crystals (right panel) exhibit positional-charge disorder growth either at a low or high packing fraction. These results clearly indicate that parasitic growth of the metastable disordered fcc phase (which likely contains stacking faults of hexagonal-close-packing due to the high resemblance in free energy that these two crystal lattices present for hard-spheres116) occurs regardless of the nature of the stable crystalline phase, at moderate ϕl from the CsCl crystal, and at high packing fraction from the CuAu phase. This behaviour may explain why in ref. 87 CuAu crystals in the presence of disordered close-packed ones were found within 18 days after the sample preparation of an oppositely charged colloidal suspension at ϕl = 0.58. According to our simulations, positionally disordered close packing crystal domains (most likely containing stacking faults) may have quickly grown from the critical nuclei along with stable CuAu domains, or even the CuAu domains may have appeared later after recrystallization from the disordered close packing domains.
We also evaluate the crystal growth rate (u) as a function of ϕl for the different polymorphs using direct coexistence simulations (Fig. 8A). To measure u, we monitor the position of the crystal front as a function of time for each interface during the DC simulation. We find that the growth rate of the disordered fcc phase is between 4 to 10 times faster than that of CsCl depending on the considered ϕl. We also observe that the disordered fcc growth rate may depend on the initial crystal phase in contact with the liquid (at least when measured at short distances from the precursor crystal phase as in our simulations). When the disordered fcc phase grows from the CsCl crystal (bcc lattice), it requires more time to grow the same distance than when starting from its own lattice or the CuAu phase (fcc lattice). This is likely happening (1) because of the initial time spent by the system to accommodate the fcc lattice (and its density) from the precursor bcc lattice, (2) because the disordered fcc phase may grow under stress conditions due to the mismatch between its crystal lattice and the simulation box size that matches the precursor crystal lattice, and (3) because the growing crystal orientation that best matches the precursor CsCl lattice could have a lower growth rate than those emerging from the disordered fcc or CuAu crystals. Nonetheless, even under these unfavourable circumstances, the disordered fcc crystal manages to grow much faster from the CsCl crystal than the CsCl itself. To further confirm the nature of the emerging crystals without the use of a local order parameter (in Fig. 7, that was determined using the 4 and 6 parameters), we compute the all-particle radial distribution function of the initial CsCl slab (orange curve), the grown crystal (dark green), and the interfacial region connecting the initial crystal and the emerged one (pink) of a DC trajectory at ϕ = 0.518 and T* = 1 (Fig. 8B). When comparing these three radial distribution functions to those of the bulk solid CsCl and disordered fcc phases under the same conditions (red and light green curves, respectively), we find that the structure of the new grown solid and the interfacial crystal mostly corresponds to a disordered fcc phase (although it probably contains a certain degree of hexagonal-close packing and CsCl stacking faults), as predicted by the order parameter in Fig. 7. We expect that the degree of CsCl-like vs disordered fcc-like particles of the emerging crystal will depend on ϕl, being higher for fcc-like particles at a higher packing fraction. These results evidence how parasitic crystallization is not an artifact of the employed order parameter.
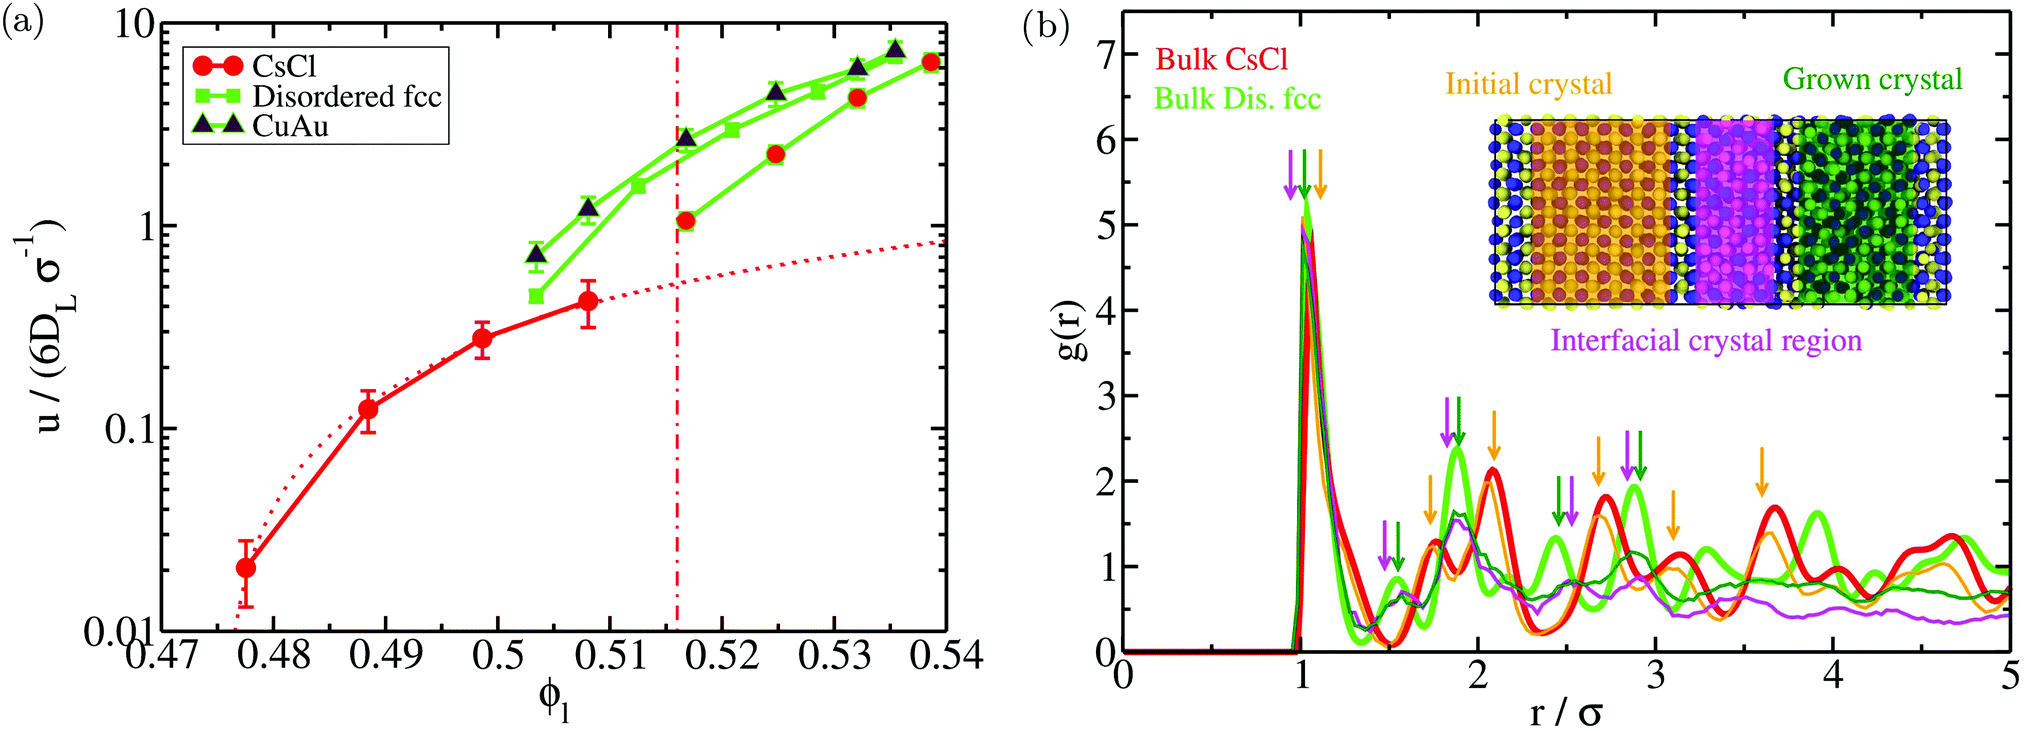 | ||
| Fig. 8 (a) Crystal growth rate (u) as a function of the liquid packing fraction computed by means of direct coexistence simulations for different initial crystalline slabs in contact with the liquid. Red circles indicate the obtained growth rates when the initial crystal phase was CsCl, maroon diamonds indicate the case when the initial crystal phase was CuAu, and green squares indicate the case when the starting crystal phase was disordered fcc. The color of the continuous lines connecting the different symbols indicates whether the emerging crystal phase is CsCl (red) or disordered fcc (green). The red dotted line shows a linear fit to the CsCl growth rates extrapolated into the parasitic crystallization regime for visual comparison with the disordered fcc u. The vertical red dashed dotted line indicates the lower ϕl at which parasitic crystallization from CsCl is observed. (b) All-particle radial distribution function (g(r)) of the initial CsCl crystal (orange), the grown crystal (dark green), and the interfacial region from which the emerging crystal grew (pink) of a direct coexistence simulation at ϕl = 0.518 and T* = 1. Bulk CsCl (red) and disordered fcc (light green) all-particle radial distribution functions at ϕl = 0.518 and T* = 1 are also included for comparison. Note that the g(r) functions of the different crystal regions of the DC simulation converge to zero at long distances since the radial distribution functions have only been evaluated for those particles of the considered region. Bulk CsCl and disordered fcc g(r) functions converge to 1 at long distances. Different coloured down arrows indicate the most representative peaks of each g(r). A snapshot of the different considered regions of the direct coexistence simulation for which the radial distribution function has been computed is shown. | ||
Even though parasitic crystallization entails the nucleation of one phase and the subsequent post-critical crystal growth of a different phase from the critical cluster, it should not be regarded as the well-known Ostwald step rule117 proposed in 1897. In the Ostwald step rule, the crystal phase that nucleates from the melt need not be the one that is thermodynamically most stable, but the one that is closest in free energy to the fluid phase. Next, from the nucleated phase, the thermodynamically most stable phase is expected to form.118 This rule was later reexamined by Stranski and Totomanow,119 who argued that the nucleating phase will be the phase with the lowest free-energy barrier of formation, rather than the phase that is globally most stable under the prevailing conditions. However, what we term as parasitic crystallization here is a phenomenon where, even when the nucleating phase is the thermodynamically most stable one, the post-critical crystal growth occurs through an out-of-equilibrium process by which a different (metastable) phase from the nucleating one and/or the most stable one grows from the critical nucleus.
C. Key factors behind the polymorphic crystal competition
To elucidate the thermodynamic and kinetic factors leading to the crystal nucleation scenario shown in the previous section, we analyse the magnitudes that play a role in the polymorphic competition among the different crystal phases. To that end, we firstly focus on the kinetic pre-factor, ρlZf+, of the CNT expression for the nucleation rate (eqn (3)). We compute the kinetic pre-factors of the CsCl and disordered fcc crystals (both polymorphs for which Seeding calculations were successfully performed) by multiplying ρlZf+ from the given values in Table 1. We find that the kinetic term of the disordered fcc clusters is about 5 times higher than that of CsCl at any ϕl from 0.50 to 0.53. Considering that J varies by tens of orders of magnitude in small ϕl intervals, we conclude that the kinetic pre-factor cannot play a crucial role in ultimately determining which phase nucleates the fastest.Hence, the significant differences in the nucleation rate between the two polymorphs must come from the free energy barrier. In Fig. 9, we show the free energy barrier, ΔG, for each solid as a function of the liquid packing fraction. Up to ϕl = 0.53, ΔG is sensibly lower for CsCl than those measured for disordered fcc clusters, thus explaining the observed behaviour in the nucleation rate (Fig. 5). Only at a high packing fraction, ϕl > 0.535, the free energy barrier of both crystals become comparable. Our results point to the fact that, at ϕl > 0.54, disordered fcc clusters will nucleate faster than those of CsCl. In contrast to the nucleation rate, for the free energy barriers, we find excellent agreement between our Seeding calculations and the umbrella sampling results reported in ref. 72 for the CsCl and disordered fcc ΔG (red and green empty squares in Fig. 9, respectively).
 | ||
| Fig. 9 Free energy barriers obtained from our Seeding calculations as a function of liquid packing fraction for CsCl (red circles) and disordered fcc clusters (green circles). Continuous lines represent CNT-like fits (as shown in ref. 20) to our Seeding results, while dashed curves account for their upper and lower uncertainty bounds. Umbrella sampling free-energy calculations from ref. 72 for CsCl (red square) and disordered fcc (green square) crystals are also included. | ||
Provided that the differences in J between the two polymorphs come from the free energy barrier, we now focus on the thermodynamic factors that are behind such a difference. According to the CNT expression, the free energy barrier of a spherical cluster is
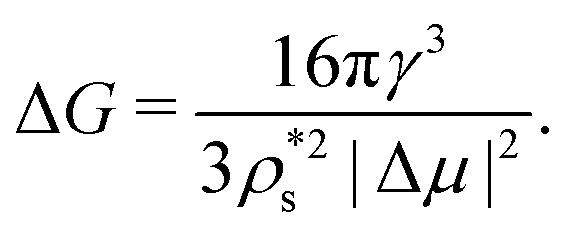 | (8) |
Therefore, the chemical potential difference between the solid and bulk liquid phases (Δμ), the density of the crystal phase  and the liquid–crystal interfacial free energy (γ) are the factors that modulate the height of the free energy barrier and, thus, the nucleation rate. Since in Fig. 2 and 4 we have already evaluated the density of the solid phases
  and its Δμ dependence on the liquid packing fraction, respectively, we now plot the interfacial free energy of the CsCl and disordered fcc phases as a function of ϕl (Fig. 10).
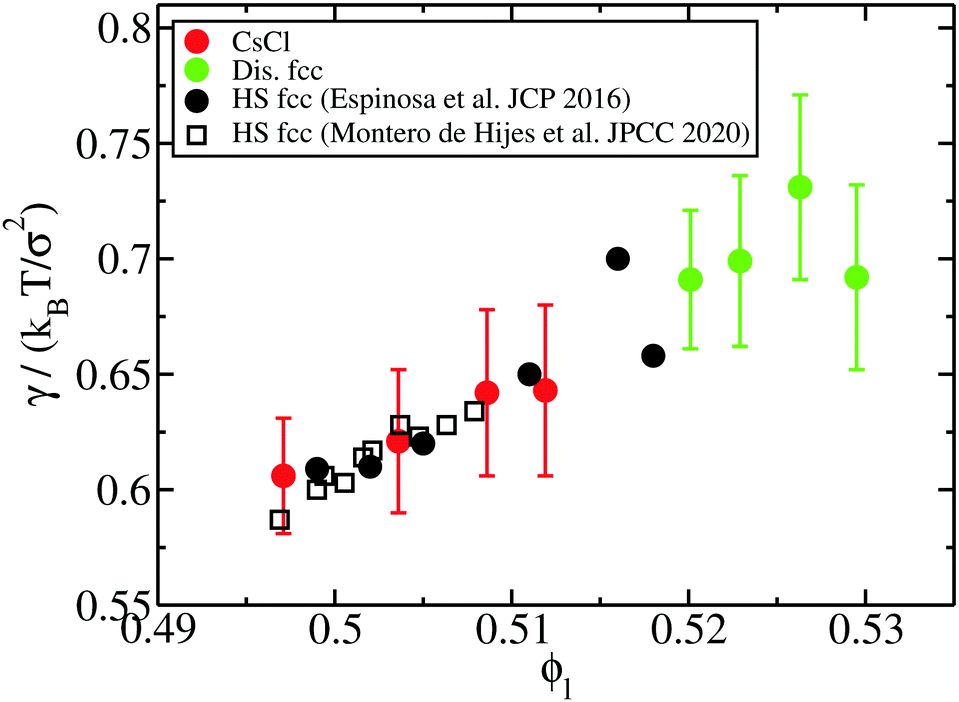 | ||
| Fig. 10 Liquid–solid interfacial free energy as a function of the liquid packing fraction for CsCl (red circles) and disordered fcc crystals (green ones). Black filled circles and empty squares depict the interfacial free energy as a function of ϕl evaluated in ref. 20 and 97, respectively, for fcc clusters of purely repulsive hard-spheres. | ||
Our results reveal that the interfacial free energy of both solids increases with ϕl. Assuming a linear dependence of γ versus ϕl, as our data suggest, and as has been successfully proposed for hard-sphere colloids,20,97 we find that γ(ϕl) for both crystals is roughly similar. Therefore, we cannot ascribe the differences in the free energy barrier to significant variations in the liquid–crystal interfacial free energy among these two polymorphs. Based on these results, we hypothesize our prediction for the nucleation rate of the CuAu crystal phase given in Fig. 5. Moreover, our simulations indicate that the increasing similarity of ΔG between the CsCl and disordered fcc clusters at high ϕl comes from Δμ and/or  .
.
As shown in Fig. 2 and 4, at a low packing fraction, the density of the disordered fcc and CsCl phases is comparable, while Δμ is sensibly lower for CsCl. This contributes to the substantial decrease of the free energy barrier of CsCl clusters with respect to those of disordered fcc, as shown in Fig. 9. Nonetheless, at a high packing fraction, ϕl > 0.535, Δμ for both polymorphs becomes alike, whereas the density of the disordered fcc phase becomes larger than that of CsCl. This behaviour leads to the observed cross-over of the disordered fcc clusters in ΔG and J at high ϕl.
D. Hard-spheres vs. oppositely charged colloids: a comparison between their nucleation scenarios
In this section, we focus on how the crystal nucleation landscape of purely repulsive HS compares with that of colloidal electrolytes. To that end, we examine the main factors that determine the nucleation rate in both colloidal systems. In the first place, we focus on the kinetic term of the nucleation rate of HS and colloidal electrolytes. Consistent with our previous observations for CsCl and disordered fcc clusters, the kinetic pre-factor of HS fcc clusters (see Table 3 of ref. 20) is of the same order of magnitude as those reported in Table 1 for both charged colloidal polymorphs. Hence, in what follows, we analyse the different factors (γ, Δμ and ) that determine the height of the free energy barrier.
In Fig. 10, we compare the interfacial free energy of HS fcc clusters20,97 as a function of ϕl (black symbols) with our results of γ for CsCl and disordered fcc clusters. For the three systems, we find very similar values of γ versus ϕl. This is not surprising given the resemblance between the liquid and solid structures and the packing fraction in hard-spheres and oppositely charged colloids. On the other hand, we also analyse in Fig. 4 the chemical potential difference between the bulk liquid and the fcc crystal of HS as a function of ϕl. Our results show that Δμ for HS is almost identical to that of the CuAu crystal with the liquid in charged colloids. Additionally, we observe that Δμ for HS is moderately lower than that of the disordered fcc phase, where unfavourable interactions among colloids of the same sign partially destabilize the fcc lattice. Finally, regarding the density of the HS fcc crystal phase, we observe in Fig. 2 that its packing fraction is slightly lower than that of the disordered fcc phase as a function of p*. However, as the liquid ϕl of HS is also lower than that of charged colloids as a function of p*, when comparing both solid densities as a function of ϕl, we find that HS fcc  is roughly similar to that of the disordered fcc crystal.
Having discussed the relative differences among the factors behind the nucleation rate of HS and colloidal electrolytes, we compare J for the CsCl phase, predicted CuAu and disordered fcc crystals along with previous computational18,20,21,120 and experimental nucleation studies8–10 of HS. As shown in Fig. 11, the nucleation rate of hard-spheres (black curve) lies close to the CuAu prediction of J (maroon dashed line) and above the disordered fcc nucleation rate (green curve). In contrast, we observe that the nucleation rate of the CsCl crystal phase (red curve) is significantly higher than that of HS, especially at low ϕl. This is somehow expected since (1) γ is very similar for all the systems and (2) Δμ is roughly the same for fcc HS and for the CuAu phase, moderately lower than that of the ion-disordered fcc phase, and sensibly higher than that of CsCl.
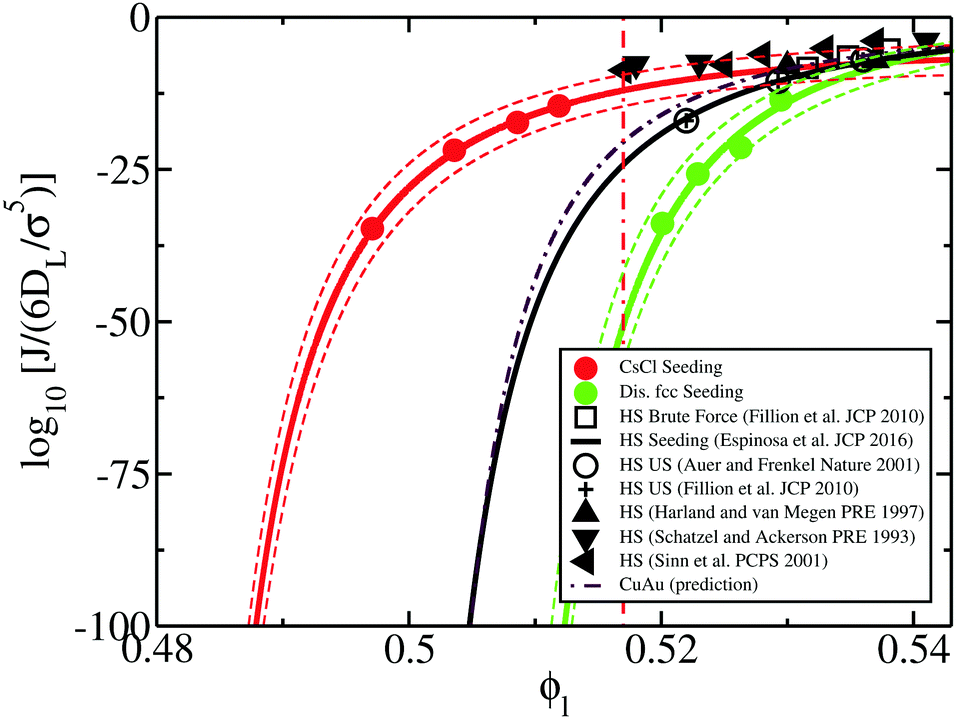 | ||
| Fig. 11 Logarithm of the nucleation rate versus liquid packing fraction for several colloidal systems. Red, green and maroon (dashed dotted) curves represent the CsCl, disordered fcc and CuAu (predicted) nucleation rates of charged colloidal crystals, respectively, while the black curve indicates J for fcc crystals of purely repulsive HS from ref. 20 using the Seeding method. Dashed red and green curves indicate the upper and lower bounds of uncertainty of the Seeding results for the CsCl and disordered fcc phases, respectively. Empty circles represent the computational estimations of J for HS using Umbrella sampling calculations,18,120 whereas cross symbols and empty squares represent those calculated via Forward flux sampling and brute force simulations, respectively (ref. 21). Black filled triangles depict different experimental measurements of the nucleation rate for hard-sphere colloids from ref. 8–10. The vertical red dashed dotted line represents the lowest liquid packing fraction at which CsCl nuclei post-critically grow as disordered fcc crystals (parasitic crystallization). | ||
Simultaneously, in Fig. 11, considerable disagreement can be observed between the experimental (black triangles) and computational (black curve and empty symbols) homogeneous nucleation rates for HS at a moderate packing fraction (ϕl ∼ 0.515).11,58,60,61,66 Several different possible explanations for the discrepancy between experiments and simulations have already been postulated, such as heterogeneous nucleation, sedimentation, incomplete shear melting or hydrodynamic effects.11,60,61,65,66 Nonetheless, quite surprisingly, we observe that the nucleation rate curve of the CsCl crystal phase closely follows the experimental trend of J for HS. In this respect, our results may suggest that an alternative crystalline polymorph sustained by weak electrostatic attractive interactions among (the assumed) HS colloidal particles might lead to higher nucleation rates at low-moderate packing fractions, and that phase may post-critically grow through a parasitic crystal phase with a lower J but a faster growth rate similarly to the phenomenon that occurs in oppositely charged colloids with the disordered fcc phase.
V. Concluding remarks
In this work, we study the crystal nucleation scenario of oppositely charged colloids by means of computer simulations. For that purpose, we develop a continuous potential that allows highly-efficient parallel MD simulations of unprecedentedly large systems and that accurately reproduces the original Yukawa model parametrized for describing the phase diagram of colloidal electrolytes. We focus on the crystal nucleation competition of three different solids at moderate temperature, T* = 1; the CsCl crystal, the CuAu crystal, and a substitutionally disordered fcc phase. On the one hand, our findings show that, from low to moderately-high packing fraction, ϕl < 0.53, the CsCl crystal phase exhibits the fastest nucleation rate, while at higher ϕl, a cross-over between the nucleation rate of the disordered fcc phase (and possibly of the CuAu phase as well) and that of the CsCl polymorph takes place, with nucleation of the two (three) phases becoming comparably quick. A martensitic transformation of the CuAu clusters into CsCl ones is also observed at any packing fraction below spontaneous crystallization.Our results reveal that colloidal electrolytes only show standard nucleation behaviour at low packing fractions, ϕl < 0.517, where the stable phase, CsCl, is the one that nucleates and grows. In contrast, at higher packing fractions (ϕl > 0.53), neither the nucleating nor the post-critical growing phase is the stable crystal phase. We observe that the post-critical crystal growth of the nuclei in the moderate/high ϕl regime (i.e., between ϕl = 0.517 and ϕl = 0.535) occurs so fast that the growing crystals are predominantly composed of disordered fcc domains rather than constituted by crystals of the stable CsCl or CuAu phases. Furthermore, we analyse the thermodynamic and kinetic factors leading to this complex polymorphic scenario, finding that the free energy cost of the cluster formation is the crucial factor in determining which phase nucleates the fastest, whereas the crystal growth rate of the different polymorphs is what determines the post-critical crystallization.
We illustrate how a phase that is not thermodynamically stable (the disordered fcc phase) manages to grow at post-critical level using the critical nucleus of the stable phase (CsCl). We term this behaviour parasitic crystallization. Nonetheless, to understand the values of J, one needs to use the nucleation rate of the stable thermodynamic phase (CsCl). Thus, the mechanism of crystallisation, nucleation and growth, may entail some surprises since one phase can firstly nucleate and then grow another one at post-critical level. However, it seems that, to understand the value of J at low and moderately high ϕl values, the nucleation rate of the stable phase (CsCl in this case) should be considered.
To conclude, we compare the oppositely charged colloidal nucleation scenario with that of purely repulsive hard-spheres. Our results show that the interfacial free energy of HS fcc clusters is very similar to those of CsCl and disordered fcc clusters. Moreover, we note that the CsCl nucleation rate surprisingly lies close to the experimental nucleation rates of hard-sphere colloids, and that the computational J of HS resembles our prediction for the CuAu phase. Taken together, our results provide a panoramic perspective of the nucleation landscape of oppositely charged colloids and rationalise the different kinetic and thermodynamic aspects behind it.
Conflicts of interest
There are no conflicts to declare.Acknowledgements
This project has received funding from the Oppenheimer Research Fellowship of the University of Cambridge. A. G. was funded by an EPSRC studentship (EP/N509620/1) and the Winton Programme for the Physics of Sustainability (University of Cambridge). J. R. E. acknowledges funding from the Roger Ekins Research Fellowship of Emmanuel College. I. S.-B. acknowledges funding from the Oppenheimer Fellowship, Derek Brewer scholarship of Emmanuel College and EPSRC Doctoral Training Programme studentship. This work has been performed using the resources provided by the Cambridge Tier-2 system operated by the University of Cambridge Research Computing Service (http://www.hpc.cam.ac.uk) funded by EPSRC Tier-2 capital grant EP/P020259/1. C. V and E. S acknowledge the funding through Grant No. FIS2016-78117-P and PID2019-105898GB-C21 of the MEC and project FI-2020-2-0031 of the RES. We gratefully acknowledge Dr Fumi de Morata for inspiring us to recognize a parasitic behaviour.References
- K. F. Kelton, Crystal Nucleation in Liquids and Glasses, Academic, Boston, 1991 Search PubMed.
- P. G. Debenedetti, Metastable liquids: Concepts and Principles, Princeton University Press, 1996 Search PubMed.
- G. C. Sosso, J. Chen, S. J. Cox, M. Fitzner, P. Pedevilla and A. Zen, et al., Crystal Nucleation in Liquids: Open Questions and Future Challenges in Molecular Dynamics Simulations, Chem. Rev., 2016, 116(12), 7078–7116 CrossRef CAS PubMed.
- U. Gasser, E. R. Weeks, A. Schofield, P. N. Pusey and D. A. Weitz, Real-Space Imaging of Nucleation and Growth in Colloidal Crystallization, Science, 2001, 292, 258 CrossRef CAS PubMed.
- A. J. Amaya and B. E. Wyslouzil, Ice nucleation rates near ∼ 225 K, J. Chem. Phys., 2018, 148(8), 084501 CrossRef PubMed.
- A. Manka, H. Pathak, S. Tanimura, J. Wolk, R. Strey and B. E. Wyslouzil, Freezing water in no man's land, Phys. Chem. Chem. Phys., 2012, 14, 4505–4516 RSC.
- F. Ziese, G. Maret and U. Gasser, Heterogeneous nucleation and crystal growth on curved surfaces observed by real-space imaging, J. Phys.: Condens. Matter, 2013, 25(37), 375105 CrossRef CAS PubMed.
- J. L. Harland and W. van Megen, Crystallization kinetics of suspensions of hard colloidal spheres, Phys. Rev. E: Stat. Phys., Plasmas, Fluids, Relat. Interdiscip. Top., 1997, 55, 3054 CrossRef CAS.
- C. Sinn, A. Heymann, A. Stipp and T. Palberg, Solidification kinetics of hard-sphere colloidal suspensions. Trends in Colloid and Interface Science XV, Springer, 2001, pp. 266–275 Search PubMed.
- K. Schätzel and B. J. Ackerson, Density fluctuations during crystallization of colloids, Phys. Rev. E: Stat. Phys., Plasmas, Fluids, Relat. Interdiscip. Top., 1993, 48(5), 3766 CrossRef.
- T. Palberg, Crystallization kinetics of colloidal model suspensions: recent achievements and new perspectives, J. Phys.: Condens. Matter, 2014, 26(33), 333101 CrossRef PubMed.
- P. N. Pusey and W. van Megen, Phase behaviour of concentrated suspensions of nearly hard colloidal spheres, Nature, 1986, 320(27), 340 CrossRef CAS.
- C. P. Royall, W. C. K. Poon and E. R. Weeks, In Search of Colloidal Hard Spheres, Soft Matter, 2013, 9(1), 17–27 RSC.
- R. Blaak, M. A. Miller and J. P. Hansen, Reversible gelation and dynamical arrest of dipolar colloids, Europhys. Lett., 2007, 78, 26002 CrossRef.
- M. E. Leunissen, C. G. Christova, A. P. Hynninen, C. P. Royall, A. I. Campbell and A. Imhof, et al., Ionic colloidal crystals of oppositely charged particles, Nature, 2005, 437, 235 CrossRef CAS PubMed.
- R. Besseling, E. R. Weeks, A. B. Schofield and W. C. K. Poon, Three-Dimensional Imaging of Colloidal Glasses Under Shear, Phys. Rev. Lett., 2007, 99, 028301 CrossRef CAS PubMed.
- E. R. Weeks, J. C. Crocker, A. C. Levitt, A. Schofield and D. A. Weitz, Three-Dimensional Direct Imaging of Structural Relaxation Near the Colloidal Glass Transition, Science, 2000, 287, 627 CrossRef CAS PubMed.
- S. Auer and D. Frenkel, Prediction of absolute crystal-nucleation rate in hard-sphere colloids, Nature, 2001, 409, 1020 CrossRef CAS.
- D. Richard and T. Speck, Crystallization of hard spheres revisited. II. Thermodynamic modeling, nucleation work, and the surface of tension, J. Chem. Phys., 2018, 148(22), 224102 CrossRef PubMed.
- J. R. Espinosa, C. Vega, C. Valeriani and E. Sanz, Seeding approach to crystal nucleation, J. Chem. Phys., 2016, 144, 034501 CrossRef PubMed.
- L. Filion, M. Hermes, R. Ni and M. Dijkstra, Crystal nucleation of hard spheres using molecular dynamics, umbrella sampling, and forward flux sampling: A comparison of simulation techniques, J. Chem. Phys., 2010, 133(24), 244115 CrossRef CAS PubMed.
- S. Punnathanam and P. Monson, Crystal nucleation in binary hard sphere mixtures: A Monte Carlo simulation study. The, J. Chem. Phys., 2006, 125(2), 024508 CrossRef CAS PubMed.
- J. Russo and H. Tanaka, The microscopic pathway to crystallization in supercooled liquids, Sci. Rep., 2012, 2, 505 CrossRef PubMed.
- T. Schilling, S. Dorosz, H. J. Schöpe and G. Opletal, Crystallization in suspensions of hard spheres: a Monte Carlo and molecular dynamics simulation study, J. Phys.: Condens. Matter, 2011, 23(19), 194120 CrossRef CAS PubMed.
- S. Dorosz and T. Schilling, On the influence of a patterned substrate on crystallization in suspensions of hard spheres, J. Chem. Phys., 2012, 136(4), 044702 CrossRef PubMed.
- C. Valeriani, E. Sanz and D. Frenkel, Rate of homogeneous crystal nucleation in molten NaCl, J. Chem. Phys., 2005, 122, 194501 CrossRef CAS PubMed.
- T. Zykova-Timan, C. Valeriani, E. Sanz, D. Frenkel and E. Tosatti, Irreducible Finite-Size Effects in the Surface Free Energy of NaCl Crystals from Crystal-Nucleation Data, Phys. Rev. Lett., 2008, 100, 036103 CrossRef CAS PubMed.
- J. R. Espinosa, C. Vega, C. Valeriani and E. Sanz, The crystal-fluid interfacial free energy and nucleation rate of NaCl from different simulation methods, J. Chem. Phys., 2015, 142(19), 194709 CrossRef PubMed.
- N. E. R. Zimmermann, B. Vorselaars, D. Quigley and B. Peters, Nucleation of NaCl from Aqueous Solution: Critical Sizes, Ion-Attachment Kinetics, and Rates, J. Am. Chem. Soc., 2015, 137(41), 13352–13361 CrossRef CAS PubMed.
- H. Jiang, A. Haji-Akbari, P. G. Debenedetti and A. Z. Panagiotopoulos, Forward flux sampling calculation of homogeneous nucleation rates from aqueous NaCl solutions, J. Chem. Phys., 2018, 148(4), 044505 CrossRef PubMed.
- H. Jiang, P. G. Debenedetti and A. Z. Panagiotopoulos, Communication: Nucleation rates of supersaturated aqueous NaCl using a polarizable force field, J. Chem. Phys., 2018, 149(14), 141102 CrossRef.
- H. Jiang, P. G. Debenedetti and A. Z. Panagiotopoulos, Nucleation in aqueous NaCl solutions shifts from 1-step to 2-step mechanism on crossing the spinodal, J. Chem. Phys., 2019, 150(12), 124502 CrossRef PubMed.
- V. G. Baidakov, A. O. Tipeev, K. S. Bobrov and G. V. Ionov, Crystal nucleation rate isotherms in Lennard-Jones liquids, J. Chem. Phys., 2010, 132(23), 234505 CrossRef PubMed.
- A. Mahata, M. A. Zaeem and M. I. Baskes, Understanding homogeneous nucleation in solidification of aluminum by molecular dynamics simulations, Modell. Simul. Mater. Sci. Eng., 2018, 26(2), 025007 CrossRef.
- C. Desgranges and J. Delhommelle, Molecular simulation of the crystallization of aluminum from the supercooled liquid, J. Chem. Phys., 2007, 127(14), 144509 CrossRef PubMed.
- S. Sarupria and P. G. Debenedetti, Homogeneous nucleation of methane hydrate in microsecond molecular dynamics simulations, J. Phys. Chem. Lett., 2012, 3(20), 2942–2947 CrossRef CAS PubMed.
- R. S. DeFever and S. Sarupria, Nucleation mechanism of clathrate hydrates of water-soluble guest molecules, J. Chem. Phys., 2017, 147(20), 204503 CrossRef PubMed.
- T. A. Berendsen and P. G. Bolhuis, et al., Unbiased atomistic insight in the competing nucleation mechanisms of methane hydrates, Proc. Natl. Acad. Sci. U. S. A., 2019, 116(39), 19305–19310 CrossRef PubMed.
- A. Haji-Akbari and P. G. Debenedetti, Direct calculation of ice homogeneous nucleation rate for a molecular model of water, Proc. Natl. Acad. Sci. U. S. A., 2015, 112(34), 10582–10588 CrossRef CAS PubMed.
- G. D. Soria, J. R. Espinosa, J. Ramirez, C. Valeriani, C. Vega and E. Sanz, A simulation study of homogeneous ice nucleation in supercooled salty water, J. Chem. Phys., 2018, 148(22), 222811 CrossRef PubMed.
- J. R. Espinosa, G. D. Soria, J. Ramirez, C. Valeriani, C. Vega and E. Sanz, Role of Salt, Pressure, and Water Activity on Homogeneous Ice Nucleation, J. Phys. Chem. Lett., 2017, 8, 4486 CrossRef CAS.
- A. V. Brukhno, J. Anwar, R. Davidchack and R. Handel, Challenges in molecular simulation of homogeneous ice nucleation, J. Phys.: Condens. Matter, 2008, 20(49), 494243 CrossRef.
- T. Li, D. Donadio, G. Russo and G. Galli, Homogeneous ice nucleation from supercooled water, Phys. Chem. Chem. Phys., 2011, 13, 19807–19813 RSC.
- A. Haji-Akbari, R. S. DeFever, S. Sarupria and P. G. Debenedetti, Suppression of sub-surface freezing in free-standing thin films of a coarse-grained model of water, Phys. Chem. Chem. Phys., 2014, 16, 25916–25927 RSC.
- A. Hudait and V. Molinero, Ice Crystallization in Ultrafine Water-Salt Aerosols: Nucleation, Ice-Solution Equilibrium, and Internal Structure, J. Am. Chem. Soc., 2014, 136(22), 8081–8093 CrossRef CAS PubMed.
- E. B. Moore and V. Molinero, Structural transformation in supercooled water controls the crystallization rate of ice, Nature, 2011, 479(7374), 506–508 CrossRef CAS.
- S. J. Cox, S. M. Kathmann, B. Slater and A. Michaelides, Molecular simulations of heterogeneous ice nucleation. I. Controlling ice nucleation through surface hydrophilicity. The, J. Chem. Phys., 2015, 142(18), 184704 CrossRef.
- M. Fitzner, G. C. Sosso, S. J. Cox and A. Michaelides, Ice is born in low-mobility regions of supercooled liquid water, Proc. Natl. Acad. Sci. U. S. A., 2019, 116(6), 2009–2014 CrossRef CAS PubMed.
- M. Matsumoto, S. Saito and I. Ohmine, Molecular dynamics simulation of the ice nucleation and growth process leading to water freezing, Nature, 2002, 416, 409 CrossRef CAS PubMed.
- G. M. Torrie and J. P. Valleau, Nonphysical sampling distributions in Monte Carlo free-energy estimation: Umbrella sampling, J. Comput. Phys., 1977, 23(2), 187–199 CrossRef.
- R. J. Allen, D. Frenkel and P. R. ten Wolde, Forward flux sampling-type schemes for simulating rare events: Efficiency analysis, J. Chem. Phys., 2006, 124(19), 194111 CrossRef PubMed.
- P. G. Bolhuis, D. Chandler, C. Dellago and P. L. Geissler, TRANSITION PATH SAMPLING: Throwing Ropes Over Rough Mountain Passes, in the Dark, Annu. Rev. Phys. Chem., 2002, 53, 291 CrossRef CAS PubMed.
- X. M. Bai and M. Li, Calculation of solid-liquid interfacial free energy: A classical nucleation theory based approach, J. Chem. Phys., 2006, 124(12), 124707 CrossRef PubMed.
- P. Koss, A. Statt, P. Virnau and K. Binder, Free Energy Barriers for Crystal Nucleation from Fluid Phases, arXiv. 2017, 1705.08216.
- J. R. Espinosa, A. Zaragoza, P. Rosales-Pelaez, C. Navarro, C. Valeriani and C. Vega, et al., Interfacial free energy as the key to the pressure-induced deceleration of ice nucleation, Phys. Rev. Lett., 2016, 117, 135702 CrossRef PubMed.
- H. Niu, Y. I. Yang and M. Parrinello, Temperature dependence of homogeneous nucleation in ice, Phys. Rev. Lett., 2019, 122(24), 245501 CrossRef CAS PubMed.
- T. Koop and B. J. Murray, A physically constrained classical description of the homogeneous nucleation of ice in water, J. Chem. Phys., 2016, 145(21), 211915 CrossRef PubMed.
- L. Filion, R. Ni, D. Frenkel and M. Dijkstra, Simulation of nucleation in almost hard-sphere colloids: The discrepancy between experiment and simulation persists, J. Chem. Phys., 2011, 134(13), 134901 CrossRef CAS PubMed.
- U. Gasser, Crystallization in three-and two-dimensional colloidal suspensions, J. Phys.: Condens. Matter, 2009, 21(20), 203101 CrossRef CAS.
- J. R. Espinosa, C. Vega, C. Valeriani, D. Frenkel and E. Sanz, Heterogeneous versus homogeneous crystal nucleation of hard spheres, Soft Matter, 2019, 15(47), 9625–9631 RSC.
- S. Ketzetzi, J. Russo and D. Bonn, Crystal nucleation in sedimenting colloidal suspensions, J. Chem. Phys., 2018, 148(6), 064901 CrossRef PubMed.
- D. Roehm, S. Kesselheim and A. Arnold, Hydrodynamic interactions slow down crystallization of soft colloids, Soft Matter, 2014, 10(30), 5503–5509 RSC.
- M. Radu and T. Schilling, Solvent hydrodynamics speed up crystal nucleation in suspensions of hard spheres, EPL, 2014, 105(2), 26001 CrossRef.
- G. Fiorucci, G. M. Coli, J. T. Padding and M. Dijkstra, The effect of hydrodynamics on the crystal nucleation of nearly hard spheres, J. Chem. Phys., 2020, 152(6), 064903 CrossRef CAS PubMed.
- N. Wood, J. Russo, F. Turci and C. P. Royall, Coupling of sedimentation and liquid structure: Influence on hard sphere nucleation, J. Chem. Phys., 2018, 149(20), 204506 CrossRef PubMed.
- J. Russo, A. C. Maggs, D. Bonn and H. Tanaka, The interplay of sedimentation and crystallization in hard-sphere suspensions, Soft Matter, 2013, 9(30), 7369–7383 RSC.
- M. Volmer and A. Weber, Keimbildung in ubersattigten Gebilden, Z. Phys. Chem., 1926, 119, 277 CrossRef CAS.
- R. Becker and W. Doring, Kinetische behandlung der keimbildung in ubersattigten dampfen, Ann. Phys., 1935, 416, 719–752 CrossRef.
- J. Merikanto, E. Zapadinsky, A. Lauri and H. Vehkamäki, Origin of the failure of classical nucleation theory: Incorrect description of the smallest clusters, Phys. Rev. Lett., 2007, 98(14), 145702 CrossRef PubMed.
- A. Cacciuto, S. Auer and D. Frenkel, Breakdown of classical nucleation theory near isostructural phase transitions, Phys. Rev. Lett., 2004, 93(16), 166105 CrossRef CAS PubMed.
- T. Schilling, H. J. Schöpe, M. Oettel, G. Opletal and I. Snook, Precursor-mediated crystallization process in suspensions of hard spheres, Phys. Rev. Lett., 2010, 105(2), 025701 CrossRef CAS PubMed.
- E. Sanz, C. Valeriani, D. Frenkel and M. Dijkstra, Evidence for Out-of-Equilibrium Crystal Nucleation in Suspensions of Oppositely Charged Colloids, Phys. Rev. Lett., 2007, 99, 055501 CrossRef PubMed.
- M. Horsch, J. Vrabec and H. Hasse, Modification of the classical nucleation theory based on molecular simulation data for surface tension, critical nucleus size, and nucleation rate, Phys. Rev. E: Stat., Nonlinear, Soft Matter Phys., 2008, 78(1), 011603 CrossRef PubMed.
- R. P. Sear, The non-classical nucleation of crystals: microscopic mechanisms and applications to molecular crystals, ice and calcium carbonate, Int. Mater. Rev., 2012, 57(6), 328–356 CrossRef CAS.
- M. Schrader, P. Virnau and K. Binder, Simulation of vapor-liquid coexistence in finite volumes: A method to compute the surface free energy of droplets, Phys. Rev. E: Stat., Nonlinear, Soft Matter Phys., 2009, 79(6), 061104 CrossRef PubMed.
- A. Kuhnhold, H. Meyer, G. Amati, P. Pelagejcev and T. Schilling, Derivation of an exact, nonequilibrium framework for nucleation: Nucleation is a priori neither diffusive nor Markovian, Phys. Rev. E, 2019, 100(5), 052140 CrossRef CAS PubMed.
- M. Sorokin, V. Dubinko and V. Borodin, Applicability of the Fokker-Planck equation to the description of diffusion effects on nucleation, Phys. Rev. E, 2017, 95(1), 012801 CrossRef CAS.
- B. Peters and B. L. Trout, Obtaining reaction coordinates by likelihood maximization, J. Chem. Phys., 2006, 125(5), 054108 CrossRef PubMed.
- D. Moroni, P. R. Ten Wolde and P. G. Bolhuis, Interplay between structure and size in a critical crystal nucleus, Phys. Rev. Lett., 2005, 94(23), 235703 CrossRef PubMed.
- S. Wonczak, R. Strey and D. Stauffer, Confirmation of classical nucleation theory by Monte Carlo simulations in the 3-dimensional Ising model at low temperature, J. Chem. Phys., 2000, 113(5), 1976–1980 CrossRef CAS.
- E. Clouet, M. Nastar and C. Sigli, Nucleation of Al 3 Zr and Al 3 Sc in aluminum alloys: From kinetic Monte Carlo simulations to classical theory, Phys. Rev. B: Condens. Matter Mater. Phys., 2004, 69(6), 064109 CrossRef.
- I. Saika-Voivod, P. H. Poole and R. K. Bowles, Test of classical nucleation theory on deeply supercooled high-pressure simulated silica, J. Chem. Phys., 2006, 124(22), 224709 CrossRef PubMed.
- J. Diemand, R. Angélil, K. K. Tanaka and H. Tanaka, Direct simulations of homogeneous bubble nucleation: Agreement with classical nucleation theory and no local hot spots, Phys. Rev. E: Stat., Nonlinear, Soft Matter Phys., 2014, 90(5), 052407 CrossRef PubMed.
- M. E. Leunissen, C. G. Christova, A. P. Hynninen, C. P. Royall, A. I. Campbell and A. Imhof, et al., Ionic colloidal crystals of oppositely charged particles, Nature, 2005, 437(7056), 235–240 CrossRef CAS PubMed.
- E. Sanz, M. E. Leunissen, A. Fortini, A. van Blaaderen and M. Dijkstra, Gel formation in Suspensions of oppositely charged colloids: mechanism and relation to the equilibrium phase diagram, J. Phys. Chem. B, 2008, 112, 10861 CrossRef CAS PubMed.
- A. Fortini, A. Hynninen and M. Dijkstra, Gas-liquid phase separation in oppositely charged colloids: Stability and interfacial tension, J. Chem. Phys., 2006, 125, 094502 CrossRef PubMed.
- A. P. Hynninen, M. E. Leunissen, A. van Blaaderen and M. Dijkstra, CuAu Structure in the Restricted Primitive Model and Oppositely Charged Colloids, Phys. Rev. Lett., 2006, 96, 018303 CrossRef PubMed.
- F. Bresme, C. Vega and J. L. Abascal, Order-disorder transition in the solid phase of a charged hard sphere model, Phys. Rev. Lett., 2000, 85(15), 3217 CrossRef CAS PubMed.
- J. B. Caballero, E. G. Noya and C. Vega, Complete phase behaviour of the symmetrical colloidal elecrolyte, J. Chem. Phys., 2007, 127, 244910 CrossRef PubMed.
- X. M. Bai and M. Li, Differences between solid superheating and liquid supercooling, J. Chem. Phys., 2005, 123, 151102 CrossRef PubMed.
- B. C. Knott, V. Molinero, M. F. Doherty and B. Peters, Homogeneous Nucleation of Methane Hydrates: Unrealistic under Realistic Conditions, J. Am. Chem. Soc., 2012, 134, 19544–19547 CrossRef CAS PubMed.
- E. Sanz, C. Vega, J. R. Espinosa, R. Caballero-Bernal, J. L. F. Abascal and C. Valeriani, Homogeneous ice nucleation at moderate supercooling from molecular simulation, J. Am. Chem. Soc., 2013, 135(40), 15008–15017 CrossRef CAS PubMed.
- J. Jover, A. J. Haslam, A. Galindo, G. Jackson and E. A. Muller, Pseudo hard-sphere potential for use in continuous molecular-dynamics simulation of spherical and chain molecules, J. Chem. Phys., 2012, 137(14), 144505 CrossRef CAS PubMed.
- J. R. Espinosa, E. Sanz, C. Valeriani and C. Vega, On fluid-solid direct coexistence simulations: The pseudo-hard sphere model, J. Chem. Phys., 2013, 139(14), 144502 CrossRef PubMed.
- P. Rosales-Pelaez, P. M. de Hijes, E. Sanz and C. Valeriani, Avalanche mediated devitrification in a glass of pseudo hard-spheres, J. Stat. Mech.: Theory Exp., 2016, 2016(9), 094005 CrossRef.
- J. R. Espinosa, C. Vega and E. Sanz, The mold integration method for the calculation of the crystal-fluid interfacial free energy from simulations, J. Chem. Phys., 2014, 141(13), 134709 CrossRef CAS PubMed.
- P. Montero de Hijes, J. R. Espinosa, V. Bianco, E. Sanz and C. Vega, Interfacial Free Energy and Tolman Length of Curved Liquid–Solid Interfaces from Equilibrium Studies, J. Phys. Chem. C, 2020, 124(16), 8795–8805 CrossRef CAS.
- S. Plimpton, J. Comput. Phys., 1995, 117, 1 CrossRef CAS.
- W. G. Hoover, Canonical dynamics: Equilibrium phase-space distributions, Phys. Rev. A: At., Mol., Opt. Phys., 1985, 31, 1695 CrossRef.
- S. Nosé, A unified formulation of the constant temperature molecular dynamics methods, J. Chem. Phys., 1984, 81, 511 CrossRef.
- W. G. Hoover, Constant-pressure equations of motion, Phys. Rev. A: At., Mol., Opt. Phys., 1986, 34, 2499–2500 CrossRef.
- Y. Lifanov, B. Vorselaars and D. Quigley, Nucleation barrier reconstruction via the seeding method in a lattice model with competing nucleation pathways, J. Chem. Phys., 2016, 145(21), 211912 CrossRef PubMed.
- Y. Sun, H. Song, F. Zhang, L. Yang, Z. Ye and M. I. Mendelev, et al., Overcoming the time limitation in Molecular Dynamics simulation of crystal nucleation: a persistent-embryo approach, Phys. Rev. Lett., 2018, 120(8), 085703 CrossRef CAS.
- A. O. Tipeev, E. D. Zanotto and J. P. Rino, Diffusivity, interfacial free energy, and crystal nucleation in a supercooled Lennard-Jones liquid, J. Phys. Chem. C, 2018, 122(50), 28884–28894 CrossRef CAS.
- A. Zaragoza, J. R. Espinosa, R. Ramos, J. A. Cobos, J. L. Aragones and C. Vega, et al., Phase boundaries, nucleation rates and speed of crystal growth of the water-to-ice transition under an electric field: A simulation study, J. Phys.: Condens. Matter, 2018, 30(17), 174002 CrossRef PubMed.
- A. K. Sharma and F. A. Escobedo, Nucleus-size pinning for determination of nucleation free-energy barriers and nucleus geometry, J. Chem. Phys., 2018, 148(18), 184104 CrossRef PubMed.
- P. K. Bommineni and S. N. Punnathanam, Molecular simulation of homogeneous crystal nucleation of AB2 solid phase from a binary hard sphere mixture, J. Chem. Phys., 2017, 147(6), 064504 CrossRef PubMed.
- V. Baidakov and K. Protsenko, Molecular dynamics simulation of cavitation in a Lennard-Jones liquid at negative pressures, Chem. Phys. Lett., 2020, 138030 CrossRef CAS.
- W. Lechner and C. Dellago, Accurate determination of crystal structures based on averaged local bond order parameters, J. Chem. Phys., 2008, 129(11), 114707 CrossRef.
- A. J. C. Ladd and L. V. Woodcock, Triple-point coexistence properties of the Lennard-Jones system, Chem. Phys. Lett., 1977, 51(1), 155–159 CrossRef CAS.
- D. Frenkel and B. Smit, Understanding Molecular Simulation, Academic Press, London, 1996 Search PubMed.
- J. R. Espinosa, A. L. Diez, C. Vega, C. Valeriani, J. Ramirez and E. Sanz, Ice Ih vs. ice III along the homogeneous nucleation line, Phys. Chem. Chem. Phys., 2019, 21(10), 5655–5660 RSC.
- Z. Nishiyama, Martensitic transformation, Elsevier, 2012 Search PubMed.
- A. Haji-Akbari, Forward-flux sampling with jumpy order parameters, J. Chem. Phys., 2018, 149(7), 072303 CrossRef PubMed.
- S. Hussain and A. Haji-Akbari, Studying rare events using forward-flux sampling: Recent breakthroughs and future outlook, J. Chem. Phys., 2020, 152(6), 060901 CrossRef CAS PubMed.
- D. Frenkel and A. J. Ladd, New Monte Carlo method to compute the free energy of arbitrary solids. Application to the fcc and hcp phases of hard spheres, J. Chem. Phys., 1984, 81(7), 3188–3193 CrossRef CAS.
- W. Ostwald, File: Wilhelm Ostwald-Studien über die Bildung und Umwandlung fester Körper. pdf, Z. Phys. Chem., 1897, 22, 289–330 CrossRef CAS.
- P. R. ten Wolde and D. Frenkel, Homogeneous nucleation and the Ostwald step rule, Phys. Chem. Chem. Phys., 1999, 1(9), 2191–2196 RSC.
- I. Stranski and D. Totomanow, Rate of formation of (crystal) nuclei and the Ostwald step rule, Z. Phys. Chem., 1933, 163, 399–408 CrossRef.
- S. Auer and D. Frenkel, Numerical prediction of absolute crystallization rates in hard-sphere colloids, J. Phys.: Condens. Matter, 2004, 120, 3015 CAS.
| This journal is © The Royal Society of Chemistry 2021 |