
 Open Access Article
 This Open Access Article is licensed under a Creative Commons Attribution-Non Commercial 3.0 Unported Licence
Is electrochemical CO2 reduction the future technology for power-to-chemicals? An environmental comparison with H2-based pathways†
Jan
Wyndorps
 ,
Hesam
Ostovari
and
Niklas
von der Assen
*
,
Hesam
Ostovari
and
Niklas
von der Assen
*
Institute of Technical Thermodynamics, RWTH Aachen University, Schinkelstr. 8, 52062 Aachen, Germany. E-mail: niklas.vonderassen@ltt.rwth-aachen.de
First published on 14th October 2021
Abstract
Power-to-chemical pathways are gaining attention as a promising approach to reduce greenhouse gas (GHG) emissions of the chemical industry. Most power-to-chemical pathways use water electrolysis and hydrogenation of carbon dioxide (H2-based pathways). An emerging power-to-chemical technology is electrochemical CO2 reduction (eCO2R) that converts carbon dioxide (CO2) and water (H2O) directly into chemical products. An early assessment of the environmental potential of eCO2R can accelerate the eCO2R development toward more sustainable technology. So far, only a few environmental assessments have been conducted using fixed assumptions of eCO2R operating parameters. To overcome this limitation and reflect all possibilities of future eCO2R development, we design a parameter-dependent approach using a variable eCO2R model. The considered eCO2R model can produce carbon monoxide (CO), methanol, or ethylene. Together with the conversion of syngas (CO and hydrogen mixture) to methanol and with the methanol-to-olefins (MtO) conversion to ethylene, five different eCO2R pathways to produce methanol and ethylene are possible. By applying our parameter-dependent approach, we determine the minimum development requirements for the eCO2R pathways to achieve climate benefits over the H2-based pathways. By comparing the obtained minimum development requirements to data from experimental studies, we evaluate potential development gaps. The direct eCO2R to ethylene pathway shows a moderate development gap and could reduce GHG emissions over the H2-based pathway by up to 44%. The eCO2R via CO to methanol and eCO2R via CO to ethylene pathways can already fulfill the minimum development requirements; however, the GHG reduction potential is limited to 12%. The direct eCO2R to methanol pathway shows a significant development gap. Compared to the fossil fuel-based technologies, both the H2-based and the eCO2R pathways offer large climate benefits of up to 88% and up to 93%, respectively. The presented parameter-dependent assessment offers an in-depth understanding of the eCO2R operating parameters and provides a valuable approach for future assessments of the emerging eCO2R technology.
1. Introduction
The urgency of reducing anthropogenic greenhouse gas (GHG) emissions has intensified in all sectors. The chemical industry is one contributor with about 6% of worldwide GHG emissions.1 Hence, more low-carbon technologies to produce chemicals need to be developed. Many researchers focus on bulk chemicals due to their quantitative significance.2 Two bulk chemicals with large market volumes are methanol (145 mmt a−1 global annual capacity3) and ethylene (185 mmt a−1 global annual capacity3). Methanol (CH3OH) serves as a universal feedstock for chemical syntheses and as an intermediate energy carrier for synthetic fuels, while ethylene (C2H4) is an essential material for most plastics.In addition to biomass-based and photocatalytic syntheses, power-to-chemical is a promising technology in a future low-carbon energy system.4 All power-to-chemical technologies rely on a highly decarbonized electricity sector to be able to reduce GHG emissions.4 Most power-to-chemical technologies use hydrogen as an intermediate (H2-based). Hydrogen (H2) can be synthesized electrochemically via proton exchange membrane (PEM) water electrolysis. H2 is subsequently reacted to synthesize chemicals by hydrogenation of carbon dioxide (CO2).5–7 In recent years, a new power-to-chemical technology has drawn attention: electrochemical CO2 reduction (eCO2R). The eCO2R converts CO2 and water (H2O) directly into valuable products in an electrochemical cell. Four key operating parameters can measure the performance of the eCO2R cell: cell voltage, faradaic efficiency, single-pass CO2 conversion, and current density. The cell voltage provides the electrochemical potential for the chemical conversions. The lower limit of the cell voltage is the equilibrium voltage; however, excess voltage is needed to enforce the electrochemical conversion.2 The faradaic efficiency defines the ratio of electric charge converted into the desired product to the total applied electric charge. Hence, the higher the faradaic efficiency, the better is the selectivity toward the desired product. The single-pass CO2 conversion reflects that part of the inlet CO2 leaves the cell unreacted. The current density states the electrical current per cell area and can indicate economic feasibility since increasing current density reduces the specific investment costs of an electrochemical cell.8
Theoretically, both eCO2R and H2-based technologies could produce chemicals independent from fossil resources using only electricity, CO2, and H2O. Low-carbon electricity is needed for both technologies to be able to reduce GHG emissions of the chemical industry; however, low-carbon electricity is currently limited and is expected to remain limited in the future due to an increasing demand by electrification ambitions in all sectors.4 With low-carbon electricity being limited, eCO2R and H2-based technologies are competing power-to-chemical technologies. While PEM electrolyzers are already available at industrial scale (1 MW),5 practical realization of eCO2R still requires development as its technology readiness level ranges from 2–4.9 Laboratory eCO2R setups have investigated catalyst behavior,10 electrolyte interactions,11 and general setup optimization.12 However, several technical challenges have to be overcome to reach industrial feasibility, such as lowering cell voltages, increasing faradaic efficiency, enhancing CO2 conversion, and increasing current densities.2,10
To accelerate the development of eCO2R, it is desirable to evaluate the technological prospect of eCO2R as soon as possible to identify the most promising approaches and potential development gaps. For this purpose, previous studies13–15 analyzed future eCO2R technologies using estimations for the operating parameters based on other alkaline electrolyzers. The varying estimated parameters and future developments are summarized in Table 1.
| Author | Power-to-chemical | eCO2R product | Estimated Ucell | Estimated faradaic efficiency | Estimated CO2 conversion (single-pass) | Separation equipment | Lowest GHG emissions: eCO2R vs. H2-based? |
|---|---|---|---|---|---|---|---|
| Adnan and Kibria (2020)13 | Power-to-methanol | CO | 7.4 V | 100% | 50% | None | H2-based |
| Adnan and Kibria (2020)13 | Power-to-methanol | CO | 3.7 V | 100% | 50% | None | H2-based |
| Adnan and Kibria (2020)13 | Power-to-methanol | Methanol | 4.4 V | 80% | 50% | Electrolyte recirculation, distillation, and PSA | H2-based |
| Adnan and Kibria (2020)13 | Power-to-methanol | Methanol | 2.5 V | 90% | 50% | Electrolyte recirculation, distillation, and PSA | H2-based |
| Guzmán et al. (2020)14 | Power-to-methanol | Methanol | n.a. | 32.7% | n.a. | Flash and distillation | H2-based |
| Guzmán et al. (2020)14 | Power-to-methanol | Methanol | n.a. | 89.3% | n.a. | Flash and distillation | Equal |
| Nabil et al. (2021)15 | Power-to-methanol | CO | n.a. (total 4.8 kW h kg−1 CO) | n.a. (total 4.8 kW h kg−1 CO) | 50% | Pressure swing adsorption | eCO2R |
| Nabil et al. (2021)15 | Power-to-methanol | Methanol | 2.6 V (1.4 V overpotential) | 90% | 50% | Pressure swing adsorption and distillation | H2-based |
| Nabil et al. (2021)15 | Power-to-ethylene | Ethylene | 2.55 V (1.4 V overpotential) | 90% | 50% | Pressure swing adsorption | eCO2R |
Adnan and Kibria13 conducted a comparative techno-economic and environmental assessment of three power-to-methanol technologies, including an H2-based pathway, a direct eCO2R pathway to methanol, and an eCO2R pathway to carbon monoxide (CO) with subsequent methanol synthesis from syngas. They estimated the electrochemical cells to operate at cell voltages from 3.5 V to 7.4 V and faradaic efficiencies from 80% to 100%. A cradle-to-gate life cycle analysis showed that the H2-based pathway leads to the lowest GHG emissions for methanol production, followed by the eCO2R to CO pathway.
Guzmán et al.14 compared the GHG emissions of eCO2R to methanol with an H2-based pathway. The estimated faradaic efficiency to methanol ranges from 32.7% to 89.3%. Their comparative life cycle assessment concluded that eCO2R and H2-based pathways emit equal GHG emissions in the most optimistic scenario, while the H2-based pathway is preferable in all other scenarios. Furthermore, Guzmán et al. reported a considerable electricity demand for compression and pumping with 28% of the total electricity consumption for a low faradaic efficiency of 32.7%.
The most current study published by Nabil et al.15 evaluated the global warming impact of eight eCO2R products, including CO, methanol, and ethylene. Methanol and ethylene were produced with a membrane electrode assembly cell operating at a faradaic efficiency of 90% and cell voltages of 2.6 V and 2.55 V, respectively. For eCO2R to CO, a solid-oxide electrolysis cell was considered with an electricity demand of 4.8 kW h kg−1 CO; the corresponding cell voltage and faradaic efficiency were not reported. The energy demand of liquid product separation by distillation contributes to 62% of the total energy demand of eCO2R to methanol. In contrast, gaseous product separation (i.e., CO and ethylene) has a substantially low impact due to an efficient pressure swing adsorption. Consistent with previous studies, Nabil et al.'s assessment reported that eCO2R to methanol is not environmentally favorable compared to the H2-based pathway in terms of GHG emissions. For eCO2R to CO and ethylene, they concluded climate benefits of the eCO2R pathway over the H2-based pathway.
All three studies rely on fixed estimations regarding eCO2R technology development and the future operating parameters.13–15 Hence, the comparative assessments of eCO2R and H2-based pathways are only valid for the specific parameter estimations that differ between the studies (cf.Table 1). To provide a more comprehensive assessment, a comparative study including all possible parameters is desirable. For this purpose, we consider a variable process inventory for eCO2R based on an electrochemical model. Thereby, we can evaluate the entire range of eCO2R operating parameters in a parameter-dependent assessment (Section 2.2). This parameter-dependent assessment allows us to derive minimum development requirements for eCO2R technologies to achieve equal or lower GHG emissions than H2-based pathways (Sections 4.2 and 4.3). We compare the minimum development requirements with the state-of-the-art experimental data to examine the development gaps. By applying our parameter-dependent assessment, we provide a deeper understanding of the technical development requirements for eCO2R to achieve climate benefits compared to H2-based power-to-chemicals pathways.
This article is structured in four sections. Section 2 introduces the applied methods, followed by presenting the eCO2R model and the chemical system in Section 3. In Section 4, we illustrate the results of the eCO2R model and chemical system. Section 5 discusses our results and their limitations. In Section 6, we conclude and summarize the findings of this study.
2. Methods
In this section, we introduce the methodological framework to identify optimal production pathways in a parameter-dependent assessment.2.1. Technology choice optimization
In the present study, we investigate technological pathways within a chemical system that consists of many individual production processes. We use a technology choice optimization to find the production pathway with the lowest global warming impact.16 The technology choice optimization solves a linear programming problem according to eqn (1)–(3). | (1) |
| s.t. A s = f | (2) |
| sj ≥ 0 | (3) |
The notation of process inventory follows the generalized calculus for life cycle assessment.17,18 The technology matrix A describes process exchanges within the chemical system, e.g., material and energy balances of each process. Each column of the technology matrix A contains the process inputs that are defined as negative values, and the process outputs that are positive (cf. ESI 3†). The desired outcome of the chemical system is set by the functional unit f; here, 1 kg of methanol or 1 kg of ethylene. The scaling vector s expresses the usage of each process. The scaling vector s can only be positive since the processes cannot be inverted (eqn (3)). All solutions of eqn (2) define a valid technology choice of the chemical system to supply the functional unit f. The elementary flow matrix B contains information about interactions with the environment, e.g., direct process emissions (cf. ESI 3†). The characterization vector qGWP weights each elementary flow by its global warming potential using ReCiPe 2016.19 Thus, the objective function (eqn (1)) finds the technology choice with the lowest global warming impact, i.e., the most climate friendly production pathway.
2.2. Parameter-dependent assessment
Most life cycle assessment studies using technology choice optimization use static process inventories. However, for our investigation of the emerging eCO2R technology, a static process inventory cannot reflect the process development. Therefore, we complement a static process inventory for the state-of-the-art chemical system with a variable process inventory for the eCO2R process. First, we identify the key operating parameters of eCO2R. We discretize the range of eCO2R development with a resolution of 50 steps per eCO2R parameter within a reasonable range. Second, we develop an eCO2R model to gain a variable process inventory. The non-linear eCO2R model determines the eCO2R process exchanges for each parameter combination. Third, each parameter combination of the variable eCO2R process inventory is combined with the static inventory of the chemical system and fed to the technology choice optimization (cf.Fig. 1). The linear technology choice optimization finds the production pathway with the lowest GHG emissions for the entire pattern of discretized eCO2R parameters (i.e., 50 × 50 resolution refers to 2.500 technology choice optimization runs per pathway). Thereby, we conduct a parameter-dependent assessment that evaluates the entire range of eCO2R development.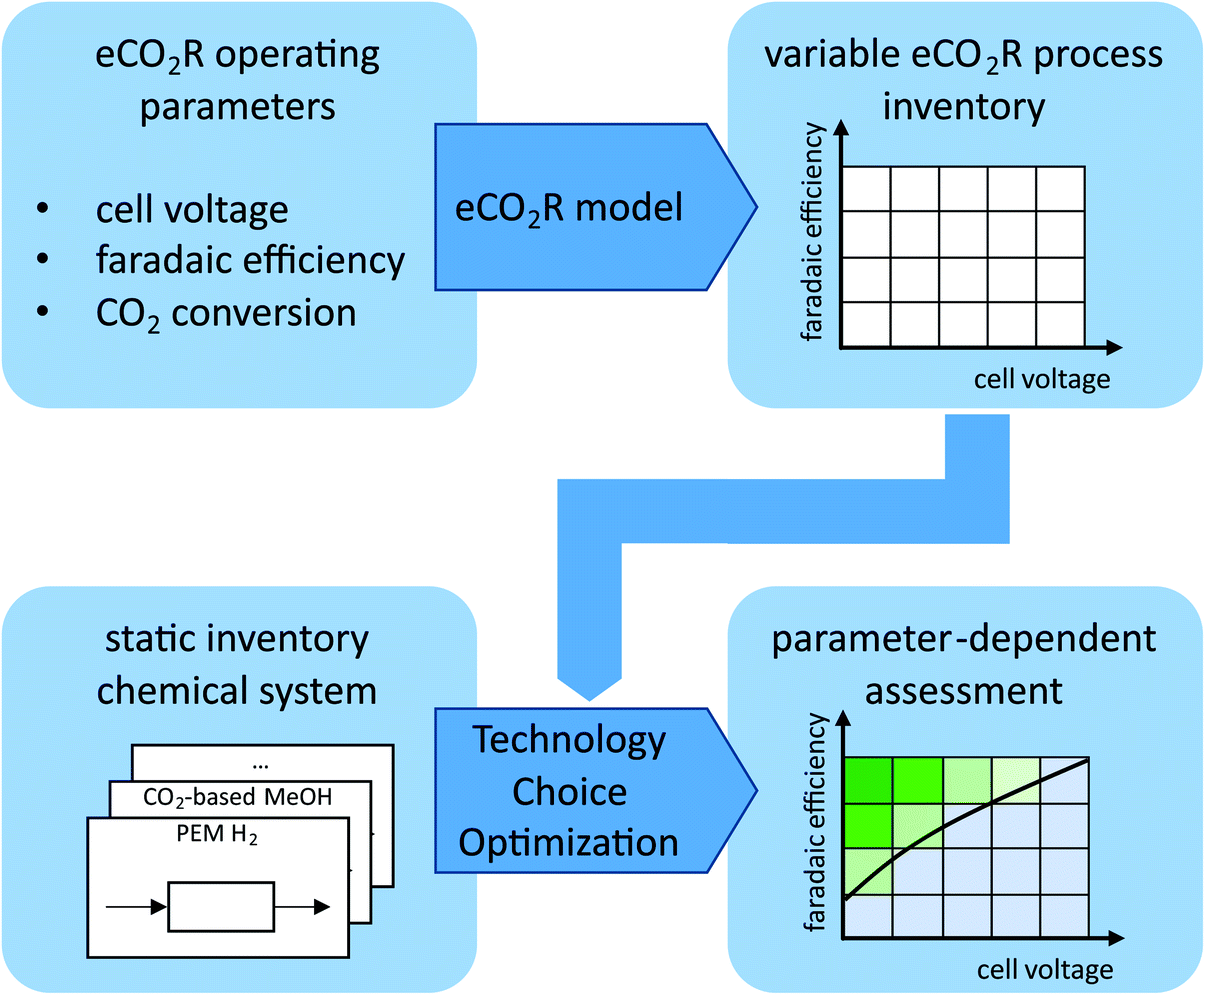 | ||
| Fig. 1 Methodological approach of the parameter-dependent assessment. The static process inventory contains the state-of-the-art chemical processes, while the variable process inventory reflects the eCO2R. | ||
The production pathway is either static using only state-of-the-art processes from the static chemical system or an eCO2R pathway using the variable eCO2R process inventory. If a static production pathway is favorable compared to the variable eCO2R pathway, GHG emissions of the optimal production pathway (which does not include any variable eCO2R processes) are independent from the variable eCO2R operating parameters (cf.Fig. 1: parameter-dependent assessment at high cell voltage and low faradaic efficiency). If the eCO2R pathway is favorable, the parameter-dependent assessment shows the GHG emissions depending on the eCO2R operating parameters (cf.Fig. 1: parameter-dependent assessment at low cell voltage and high faradaic efficiency). With our methodological approach, the minimum development requirements for eCO2R can be derived that are necessary to compete against state-of-the-art H2-based power-to-chemical pathways using water electrolysis and CO2 hydrogenation.
3. Model
The model of this study consists of two parts with different levels of detail: the chemical system and the more detailed eCO2R model. The chemical system uses static process inventories and represents the state-of-the-art chemical processes. The eCO2R model describes the eCO2R process and provides a variable process inventory depending on the operating parameters.3.1. ECO2R model
Fig. 2 presents the status of the current eCO2R development (cf. ESI 2†).11,12,20–24 We focus on two of the most common eCO2R products, CO and ethylene. Additionally, we evaluate eCO2R to methanol due to its universality as energy carrier and basic chemical. The laboratory experiments are sorted by cell voltage on the horizontal axes and faradaic efficiency on the vertical axes. If no anode potential was reported, we assumed the ideal oxygen evolution reaction potential of 1.23 V. Therefore, the applied cell voltage during the experiment might be higher than illustrated in Fig. 2. Many experiments have been conducted on eCO2R to carbon monoxide (CO) up to high faradaic efficiencies of over 90% and cell voltages down to 2 V. ECO2R to ethylene is commonly reported at similar cell voltages; yet, faradaic efficiencies do not regularly reach more than 50%. Methanol is only detected with very low faradaic efficiencies. The current density indicates that economically feasible operation8 at ≥300 mA cm−2 is within reach for eCO2R to CO and eCO2R to ethylene. The single-pass CO2 conversion reported reaches only 4% on average and 28% at maximum. However, our review shows that increasing current density correlates with increasing CO2 conversion (cf. ESI 1 Section 2†). Thus, by further technology development toward industrial operation at high current density, we expect the CO2 conversion to increase. | ||
| Fig. 2 Status of laboratory eCO2R operating parameters sorted by product: (A) carbon monoxide (CO), (B) methanol, and (C) ethylene. High faradaic efficiency and low cell voltage yield energy-efficient operation; high current density indicates economic feasibility. | ||
For our study, we developed an eCO2R model (cf.Fig. 3) based on the following operating parameters: cell voltage, faradaic efficiency, and single-pass CO2 conversion. The current density is not considered here since it mainly affects capital investments, and previous LCA studies on electrolyzers have shown a negligible ecological impact from capital construction.5 The model is solely based on energy, mass, and entropy balances and is valid for all construction types, i.e., alkaline electrolyzers or solid oxide electrolyzers. In the electrochemical cell, CO2 and H2O are converted into chemical products with the single-pass CO2 conversion defining the ratio of reacted CO2 at a single pass.
 | ||
| Fig. 3 Schematic illustration of the eCO2R model that allows calculating the electricity demand Pel, the required CO2, and the required water per kilogram product (i.e., carbon monoxide (CO), methanol, or ethylene) depending on the operating parameters cell voltage, faradaic efficiency, and single-pass CO2 conversion. | ||
The eCO2R's electricity demand per kilogram product includes the energy demand of the cell and the separation unit (eqn (4)).
| wel = wel,cell + wel,SU | (4) |
The electricity demand of the cell wel,cell depends on the cell voltage Ucell and the faradaic efficiency ηFE (eqn (5)).
 | (5) |
The cell voltage cannot be lower than the equilibrium voltage of (a) 1.33 V for CO, (b) 1.20 V for methanol, and (c) 1.15 V for ethylene.2 The number of exchanged electrons zp and the molecular weight Mp depend on the product. The Faraday constant F expresses the electric charge per mole of electrons. The generated oxygen at the anode is released into the environment without further utilization. All cathode products are assumed to be gaseous under the industrial operating temperature of 70–80 °C. Possible electrolyte and liquid product fractions are assumed to be recycled without further treatment or separation. The outlet vapor is a mixture of unreacted CO2, the main product, and by-products. The chemical composition of outlet vapor is determined by the faradaic efficiency, the single-pass CO2 conversion, and a by-product distribution factor. We assume a commonly reported distribution of by-products with H2 (40%), CO (30%), formate (10%), methane (10%), and ethylene (10%).2
In the subsequent separation unit, unreacted CO2 is separated and recycled, and the product is purified from by-products. An exact modeling of the separation unit for eCO2R post-processing is difficult, given the variety of eCO2R products2 and the amount of unreacted CO2 in the cathode stream.12 The separation of eCO2R is more complex than for water electrolysis5 due to the higher number of chemical compounds involved at similar vapor pressures.2 Regarding the separation unit, several technologies are applicable: from energy-intensive distillation with good numerical models to energy-efficient membrane technologies with poor numerical models being available. Previous studies used generalized process calculations for standard separation processes, i.e., pressure swing adsorption and distillation (cf.Table 1).13–15 While they generated a more accurate separation duty of each process, the dependency on input compositions and superposition of separation processes25 could not be considered. To avoid complex process design but consider the dependency on input compositions, we use an ideal separation unit that estimates the separation duty based on the minimum thermodynamic energy for separation (eqn (6)).
 | (6) |
The difference between the mixing entropy of the incoming vapor (vap) and the separated outlet streams (sep) determines the required electricity. The index i represents each component in the streams, while T refers to ambient temperature, and R represents the universal gas constant. We analyze the effect of non-ideal separation in Section 4.1 and discuss the impact on the results in Section 5.2.
All by-products are regarded as waste and are released into the environment as off-gases at fully oxidized state without heat integration. We do not consider multi-product eCO2R pathways that synthesize several valuable eCO2R products simultaneously. This assumption is in line with the findings of Larrazábal et al.,10 who concluded the need for high selectivity toward a single eCO2R product. In Section 5.1, we discuss the effect of multi-product eCO2R on our results.
Our eCO2R model allows calculating the amount of required electricity, carbon dioxide, and water per kilogram desired chemical. Due to the equation-based approach, a variable eCO2R process inventory is available to conduct a parameter-dependent assessment. More details regarding the eCO2R model can be found in the ESI 1 Section 3.†
3.2. Chemical system
The chemical system complements the variable (non-linear) eCO2R model with a static (linear) model of the state-of-the-art chemical processes. The goal of the chemical system is to produce methanol (1) or ethylene (2), as illustrated in Fig. 4. All energy requirements, i.e., electricity, heat, and cooling energy, are provided by electricity using electric heating and compression chillers (cf. ESI 3†). We consider low-carbon electricity from wind power with 0.017 kg CO2-eq. per kW h,26 while the impact of other electricity sources is evaluated in Section 4.4. A direct air capture (DAC) plant adsorbs carbon dioxide (CO2) from the atmosphere to supply the chemical's carbon demand.27 The desorption energy of the DAC is provided by a heat pump system.27 An industrial-scale proton exchange membrane (PEM) electrolyzer generates hydrogen (H2) from electricity and water (H2O).5 The eCO2R system reduces CO2 and H2O to three single products: (a) CO, (b) methanol, or (c) ethylene. The reverse water gas shift (rWGS) reaction28 tunes the ratio of H2 to CO to produce syngas with the suitable composition for the syngas-to-methanol13 process. The CO2-based methanol29 process converts H2 and CO2 to methanol. The methanol-to-olefins (MtO) process produces ethylene with a high energy efficiency of 98%.30 For both methanol and ethylene, we assume these products to be incinerated with stoichiometric combustion to reflect the carbon release at their end-of-life. Thereby, we consider the entire life cycle from cradle-to-grave. The process inventories are obtained from scientific studies that conducted detailed process design and are provided (cf. ESI 3†). Further background data like the supply of deionized water are taken from the database ecoinvent v3.7 (cf. ESI 1 Section 1†).26 | ||
| Fig. 4 Illustration of the chemical system. The color indicates the product of each process. H2 PEM: proton exchange membrane water electrolysis, DAC: direct air capture, rWGS: reverse water gas shift, eCO2R: electrochemical CO2 reduction, MeOH: methanol, MtO: methanol to olefins. | ||
In summary, the chemical system has three technological options for power-to-methanol production (cf.Table 2). The H2-based pathway using PEM electrolysis, DAC, and CO2-based methanol synthesis defines the state-of-the-art reference (Ref1). Regarding eCO2R, two pathways are possible: (a) the eCO2R via CO to MeOH pathway that reacts CO2 from DAC to CO with H2 from PEM electrolysis to produce methanol via the syngas-to-methanol process (1a), and (b) the direct eCO2R to MeOH pathway, where the eCO2R cell generates methanol directly from CO2 and H2O (1b).
| (1) Methanol | (2) Ethylene | |||
|---|---|---|---|---|
| H2-based | Ref1 | H 2 -based MeOH pathway (H2 PEM + DAC + CO2-based MeOH) | Ref2 | H 2 -based ethylene pathway (H2 PEM + DAC + CO2-based MeOH + MtO) |
| eCO2R | 1a | eCO 2 R via CO to MeOH pathway (DAC + eCO2R to CO + H2 PEM + syngas-to-MeOH) | 2a | eCO 2 R via CO to ethylene pathway (DAC + eCO2R to CO + H2 PEM + syngas-to-MeOH + MtO) |
| 1b | Direct eCO 2 R to MeOH pathway (DAC + eCO2R to MeOH) | 2b | eCO 2 R via MeOH to ethylene pathway (DAC + eCO2R to MeOH + MtO) | |
| 2c | Direct eCO 2 R to ethylene pathway (DAC + eCO2R to ethylene) | |||
For power-to-ethylene production, a total of four pathways are possible (cf.Table 2). The reference pathway (Ref2) uses the H2-based pathway to methanol with subsequent conversion to ethylene via the MtO process. Pathways 2a and 2b express the two eCO2R pathways to methanol with subsequent MtO conversion to ethylene. The direct eCO2R to ethylene pathway (2c) directly converts CO2 and H2O to ethylene. All technological pathways and their abbreviations are summarized in Table 2.
4. Results
We present the results starting with the analysis of the eCO2R model in Section 4.1. In Sections 4.2 and 4.3, we show the results of the parameter-dependent assessment and the minimum development requirements for eCO2R for the two products, methanol (Section 4.2) and ethylene (Section 4.3). We continue by presenting the sensitivity analysis on the electricity source and the comparison to fossil technologies in Sections 4.4 and 4.5, respectively.4.1. ECO2R system analysis
Fig. 5A shows the electricity demand per kilogram of carbon monoxide (CO) for a constant single-pass CO2 conversion of 50%. The electricity demand rises progressively with decreasing faradaic efficiency. Decreasing faradaic efficiency increases the electric charge that does not contribute to the production of the desired product. The high dependency on the faradaic efficiency underlines the importance of selective catalysts, as already highlighted by Larrazábal et al.10 The cell voltage Ucell increases the electricity demand linearly. In practice, the cell voltage cannot be decreased down to the equilibrium potential because excess voltage is required to enforce the electrochemical conversion. Thus, minimal difference to the equilibrium potential, i.e., minimal overpotential, is necessary for efficient electrochemical processes. | ||
| Fig. 5 Electricity demand of eCO2R depending on the key operating parameters: (A) the influence of faradaic efficiency (FE) and cell voltage, (B) the impact of the single-pass CO2 conversion and non-ideal separation units (SU). | ||
To illustrate the effect of the single-pass CO2 conversion on the electricity demand (cf.Fig. 5B), we chose commonly estimated future values of the cell voltage Ucell = 2.5 V and the faradaic efficiency ηFE = 90%.13,15 The ideal separation unit has a limited contribution of 0.8% to the overall electricity demand at a CO2 conversion of 50%. Fig. 5B also shows the effect of the separation unit requiring 10 and 100 times the ideal separation duty. For comparison purposes, a study on CO2 sources reported that the separation units require between 1.5 and 9 times the ideal separation duty.31 The illustrated non-ideal separation units of 10 and 100 times the ideal separation duty refer to a contribution of 7.5% and 45% of the overall electricity demand at a CO2 conversion of 50%. Thus, efficient separation processes are essential to achieve climate benefits. Yet, the precise energy demand depends on the design of the separation unit that varies for different eCO2R products and mass flows.15 To avoid complex process design, we continue with an ideal separation unit to analyze the minimum development requirements for eCO2R. We further discuss the effect of non-ideal separation in Section 5.2 and ESI 1 Section 4.† As shown in Fig. 5, the impact of the single-pass CO2 conversion is limited compared to cell voltage and faradaic efficiency. For further investigations, the single-pass CO2 conversion is set to the commonly estimated level of 50%.13–15
4.2. Power-to-methanol
Fig. 6 presents the parameter-dependent assessment of power-to-methanol technologies. It shows the cradle-to-grave global warming impact (indicated by colors) of the chemical system for 1 kg of methanol (MeOH) as a function of the eCO2R operating parameters (cell voltage on the x-axes and faradaic efficiency on the y-axes). If the eCO2R pathways (1a and 1b) emit more GHG emissions than the competing H2-based pathway (Ref1), Ref1 is chosen; thus, the GHG emission of methanol production remains independent from the eCO2R operation parameters. At the breakeven line, the GHG emissions of 1 kg methanol production are identical for the eCO2R pathway (1a or 1b) and the H2-based pathway (Ref1). Thus, the eCO2R operating parameters at the breakeven line represent minimum development requirements for eCO2R to achieve climate change competitiveness. From the scatter of experimental studies, we can identify the development gap. To investigate the GHG reduction potential of the eCO2R pathways, we define the best-case as operation at equilibrium voltage and 100% faradaic efficiency (top-left corners in Fig. 6). | ||
| Fig. 6 Parameter-dependent assessment of (A) the eCO2R via CO to MeOH pathway 1a and (B) the direct eCO2R to MeOH pathway 1b using wind power with 0.017 kg CO2-eq. per kW h. The single-pass CO2 conversion is set to 50%. The black line illustrates the minimum development requirements to achieve climate benefits over the H2-based pathway to methanol (Ref1). The scatter indicates the status of laboratory experiments. | ||
Regarding the eCO2R via CO to MeOH pathway (1a), the eCO2R has to reach a faradaic efficiency higher than 46% and a cell voltage lower than 3.3 V to reduce GHG emissions (cf.Fig. 6A). Several laboratory studies investigating the cathodic behavior already fulfill these requirements.12,23,24 The eCO2R via CO to MeOH pathway (1a) benefits from the higher energy efficiency of the syngas-to-methanol process compared to the CO2-based methanol process. However, most of the electricity demand is still due to the PEM electrolysis to generate hydrogen for the syngas. Therefore, the GHG reduction potential per kilogram of methanol is limited to 12% for the best-case eCO2R (1a best-case: 0.210 kg CO2-eq. per kg MeOH, Ref1: 0.238 kg CO2-eq. per kg MeOH).
Fig. 6B shows the parameter-dependent assessment of the direct eCO2R to MeOH pathway (1b). In contrast to the eCO2R via CO to MeOH pathway, all chemical conversions occur inside the eCO2R cell, and no PEM electrolysis is needed. The direct eCO2R to MeOH pathway (1b) requires a faradaic efficiency higher than 64% and a cell voltage below 2.3 V for climate benefits over the H2-based pathway. The minimum development requirements are more ambitious than those for the eCO2R via CO to MeOH pathway (1a) since the highly efficient PEM electrolysis is replaced. However, the GHG reduction potential is more significant once the minimum development requirements are fulfilled, up to 38% for the best-case direct eCO2R to MeOH pathway (1b best-case: 0.147 kg CO2-eq. per kg MeOH, Ref1: 0.238 kg CO2-eq. per kg MeOH). Unfortunately, methanol proves very difficult to be produced directly in electrochemical cells despite recent efforts.13,21 Thus, the development gap to achieve climate benefits with the direct eCO2R to MeOH pathway is large, as illustrated by the scatter in Fig. 6B.
4.3. Power-to-ethylene
Besides power-to-ethylene pathways using methanol as an intermediate (2a, 2b, and Ref2), direct eCO2R to ethylene (2c) is possible. The minimum development requirements for the eCO2R via CO to ethylene pathway (2a) and the eCO2R via MeOH to ethylene pathway (2b) are identical to the previous assessment (Section 4.2). The reason for the identical minimum development requirements is that the same methanol-to-olefins process is required for the 2a, 2b, and Ref2 pathways. The GHG emissions per kilogram ethylene using the H2-based pathway Ref2 refer to 0.589 kg CO2-eq. per kg ethylene (cf.Fig. 7). Assuming the best-case for the eCO2R via CO to ethylene pathway (2a) and the eCO2R via MeOH to ethylene pathway (2b), the same relative reductions of 12% and 38% as for methanol alone would be achieved (2a best-case: 0.522 kg CO2-eq. per kg ethylene, 2b best-case: 0.367 kg CO2-eq. per kg ethylene; cf.Fig. 7A and B). | ||
| Fig. 7 Parameter-dependent assessment of (A) the eCO2R via CO to ethylene pathway 2a, (B) the eCO2R via MeOH to ethylene pathway 2b, and (C) the direct eCO2R to ethylene pathway 2c using wind power with 0.017 kg CO2-eq. per kW h. The single-pass CO2 conversion is set to 50%. The black line illustrates the minimum development requirements to achieve climate benefits over the H2-based pathway to ethylene (Ref2). The scatter indicates the status of laboratory experiments. | ||
The direct eCO2R to ethylene pathway (2c) requires a faradaic efficiency higher than 58% and a cell voltage below 2.5 V to achieve climate benefits over the H2-based pathway Ref2 (cf.Fig. 7C). The minimum development requirements of the direct eCO2R to ethylene pathway (2c) are about 10% less ambitious than ones for the eCO2R via methanol to ethylene pathway (2b) since efficiency losses and direct process emissions of the methanol-to-olefins process are omitted. The best-case for the direct eCO2R to ethylene pathway (2c) can reduce the GHG emissions of ethylene production by 44% compared to the H2-based pathway (2c best-case: 0.328 kg CO2-eq. per kg ethylene).
While the relative reduction potential of the eCO2R via CO to ethylene pathway (2a) is limited to 12%, both eCO2R via MeOH to ethylene pathway (2b) and direct eCO2R to ethylene pathway (2c) have high reduction potentials once the minimum development requirements are fulfilled. In contrast to eCO2R to methanol, eCO2R to ethylene is commonly reported in experimental studies.12 The more straightforward synthesis of ethylene in eCO2R cells implicates a smaller development gap to achieve climate benefits. Additionally, the omission of the methanol-to-olefins process contributes to 10% less ambitious minimum development requirements. Hence, the small development gap to reach significant climate benefits over the H2-based pathway is promising. Our findings are in line with Nabil et al.'s study, which predicted future benefits for eCO2R to ethylene over the H2-based pathways.15 Our results show that the direct eCO2R to ethylene pathway has considerable potential for GHG emission reduction in the chemical industry.
4.4. Sensitivity on electricity source
Since power-to-chemical pathways are inherently dependent on the electricity source, we evaluate the sensitivity of our findings with respect to the electricity source. Fig. 8 shows the parameter-dependent assessment of the direct eCO2R to ethylene pathway using wind power, photovoltaic, and the current German grid mix.26 Wind power represents the lowest GHG emissions, and the German grid mix represents a considerable fossil fuel-based electricity generation. Photovoltaic and other low-carbon electricity sources like concentrated solar power are in-between and follow the same trends. The life cycle GHG emissions of the power-to-ethylene pathways increase with the increase of the electricity's carbon intensity. Nevertheless, both the minimum development requirements and the relative reduction potential of the direct eCO2R to ethylene pathway over the H2-based pathway remain constant. The same trend can be seen in all the five eCO2R pathways. Thus, our findings for minimum development requirements are independent of the electricity source. | ||
| Fig. 8 Sensitivity analysis for the direct eCO2R to ethylene pathway (2c) vs. H2-based pathway to ethylene (Ref2) using (A) wind power 0.017 kg CO2-eq. per kW h, (B) electricity from photovoltaic 0.095 kg CO2-eq. per kW h, and (C) the current German grid mix 0.580 kg CO2-eq. per kW h.26 The horizontal black line in the color bar indicates the fossil state-of-the-art technology of 4.54 kg CO2-eq. per kg ethylene.26 | ||
The GHG emissions of all considered power-to-chemical pathways are dominated by the electricity source. However, not all GHG emissions are caused by the electricity supply since there are process emissions from eCO2R off-gases, the CO2-based methanol process, the syngas-to-methanol process, the methanol-to-olefins process, and the deionized water supply (cf. ESI 3†). Therefore, a minimization of the electricity demand instead of our chosen objective of GHG minimization would yield similar but not identical results regarding the minimum development requirements of eCO2R.
4.5. Comparison to fossil technologies
Power-to-chemical pathways are usually not beneficial unless the electricity sector is largely decarbonized. The black line in the color bar of Fig. 8 indicates the fossil state-of-the-art ethylene production of 4.54 kg CO2-eq. per kg ethylene.26 An implementation with the current German grid mix would increase the GHG emissions of ethylene production by at least 149% (2c best-case using German grid mix: 11.3 kg CO2-eq. per kg ethylene) up to 347% (Ref2 using German grid mix: 20.3 kg CO2-eq. per kg ethylene).Fig. 8 also illustrates that the relative reduction potential of the direct eCO2R to ethylene pathway over the H2-based pathway is minor compared to the reduction potential by using low-carbon electricity. The same trend is observed for all eCO2R pathways. In Table 3, we compare the GHG reduction potential of all considered power-to-chemical pathways over the state-of-the-art fossil-based pathway.26 By using low carbon wind power for H2-based pathways, the GHG emissions per kilogram chemical are reduced by 88% for methanol and by 87% for ethylene. The necessary technologies of PEM electrolysis, direct air capture, and heat pumps for the H2-based pathways are already available on an industrial scale. While PEM electrolysis currently reaches 60% energy efficiency,5 further efficiency gains in water electrolysis are expected due to higher plant efficiency of PEM electrolyzers5 and more advanced solid oxide water electrolyzers becoming industrial available. Best-case water electrolysis operating under the same assumptions of equilibrium voltage and 100% faradaic efficiency would reduce the GHG emissions by 92% for methanol and by 91% for ethylene (cf.Table 3).
| Fossil state of the art26 | Wind-powered power-to-chemicals | |||||
|---|---|---|---|---|---|---|
| H2-based (Ref) | H2-based (best-case) | Best-case eCO2R to CO (a) | Best-case eCO2R to methanol (b) | Best-case eCO2R to ethylene (c) | ||
| Methanol (1) | 2.00 | 0.238 (−88%) | 0.168 (−92%) | 0.210 (−90%) | 0.147 (−93%) | |
| Ethylene (2) | 4.54 | 0.589 (−87%) | 0.419 (−91%) | 0.522 (−89%) | 0.367 (−92%) | 0.328 (−93%) |
The eCO2R pathways could further reduce the GHG emissions of chemical production. Assuming best-case eCO2R that operates at equilibrium voltage and 100% faradaic efficiency, the eCO2R pathways yield GHG emission reduction between 89% and 93% compared to the fossil state-of-the-art. The direct eCO2R to ethylene pathway reaches the largest relative reduction and the eCO2R via CO pathways the smallest relative reduction (cf.Table 3). The additional reduction potential of eCO2R pathways over the H2-based pathways is minor in relation to the fossil-based state-of-the-art technology.
Given the limited reduction potential over the industrial available H2-based pathway, the low technology readiness level of eCO2R,9 the complex electrochemical phenomena,2 the product separation energy demand,15 and expected efficiency gains in water electrolysis,5 we see major challenges for eCO2R to play a key role to reduce GHG emissions of the chemical industry in the near future. Nonetheless, efficient eCO2R can contribute to a reduction in GHG emissions. The direct eCO2R to ethylene pathway is the most promising candidate to achieve climate change competitiveness over the H2-based power-to-chemical pathway.
5. Discussion
5.1. Multi-product eCO2R pathways
In the present article, we investigated eCO2R to single products only and considered all by-products as waste. Nonetheless, the simultaneous production of several products by eCO2R is possible and might yield further GHG emission reduction. We differentiate three types of multi-product eCO2R: (a) co-electrolysis, where eCO2R by-products are used without further separation, (b) heat recovery from eCO2R by-products incineration, and (c) stand-alone multi-product eCO2R, where by-products are purified and sold as stand-alone products.The most common co-electrolysis is the simultaneous production of carbon monoxide (CO) and hydrogen (H2), where the by-product H2 does not need to be separated from CO.32 The usage of the by-product H2 lowers the required H2 from other sources and thus, yields further GHG emission reduction. In practice, the co-production of H2 in eCO2R cells has to compete against the PEM electrolysis that is optimized on H2.5 Therefore, co-electrolysis usually focuses on maximal CO yield33 and the GHG reduction potential is limited.
Heat recovery of eCO2R by-products has a similar effect. The incineration of by-products for heat recovery and subsequent integration reduces the heat demand from other sources and yields further GHG emission reduction. The potential of eCO2R by-products as electricity-based heating fuels is limited since more efficient technology is available to generate heat from electricity.34
Multi-product eCO2R in terms of simultaneous production of several stand-alone products requires further separation and purification. On one side, the by-product usage decreases GHG emissions; on the other side, the increased energy demands for separation and purification increases GHG emissions. From an economic point of view, eCO2R with complex separation units is unlikely to be economically feasible due to the limited scale-up potential of electrolyzers.5,10
While a utilization of by-products might further reduce GHG emissions and the minimum development requirements of eCO2R, the above discussion shows that these reductions are expected to be limited in practice.
5.2. Separation duty of eCO2R
The minimum development requirements for eCO2R presented in this article refer to an ideal separation unit and serve as a lower bound to guide eCO2R development. The preliminary assumption of ideal separation is an appropriate approach to avoid complex design; however, the assumption underestimates the energy demand of real separation processes. Thus, the conducted minimum development requirements only illustrate the lower bound for eCO2R development and guide toward the most promising pathways. A detailed process design for the eCO2R separation needs to be performed to determine the development requirements for eCO2R practical implementation and is out of the scope of this study. A sensitivity analysis on the separation duty (cf. ESI 1 Section 4†) has shown that the energy demand for separation can considerably increase the development requirements for eCO2R. When using energy-efficient separation processes requiring previously reported ratios31 of up to 10 times the ideal separation duty, the development requirements are moderately increased by 6%. Before implementing an eCO2R pathway, we recommend conducting a detailed separation process design and determine the eCO2R process requirements for the specific design.5.3. Further perspectives
We thoroughly examined the eCO2R pathways regarding their potential to reduce GHG emissions and the technological competition against the industrial available H2-based pathways. However, there are further perspectives on eCO2R.The eCO2R pathways could yield economic benefits. The one-step conversion of the direct eCO2R to MeOH pathway and the direct eCO2R to ethylene pathway offer reduced plant complexity and geographical independence from chemical production sites for pre- or post-processing. Furthermore, the omission of PEM electrolysis provides potential capital investment savings by using less expensive catalysts for eCO2R than the noble metals for PEM electrolysis.5 A previous study by Adnan et al.13 has shown similar costs for both the eCO2R and H2-based pathways. A detailed techno-economic assessment including capital expenditure remains uncertain until higher technological readiness levels are reached, given the different catalysts used for eCO2R10 and divers cell construction types.12 A preliminary analysis of operating expenditure (cf. ESI 1 Section 5†) shows that the power-to-chemical pathways range from −4% cost reduction to 73% cost increase compared to fossil-based state-of-the-art technologies. A detailed assessment of the development requirements from an economic point will further clarify the prospect of eCO2R and can be the object of future work.
Flexible operation of eCO2R can be beneficial for the surrounding energy system. When interconnecting the chemical industry with the electricity sector, more flexible operation due to the volatile characteristics of renewable electricity sources is needed.4 Flexible operation of eCO2R and the comparison to the flexibility provided by H2-based pathways are yet to be investigated.
Future development of other technologies may affect eCO2R. In the present article, we intensively assessed the future development of eCO2R but used a static process inventory for the state-of-the-art chemical system. The interacting chemical processes might yield efficiency gains in future, and new technologies may be developed. Future development of competing technologies will increase the minimum development requirements for eCO2R and has to be regarded over time.
6. Conclusions
Electrochemical CO2 reduction is an emerging technology that is competing against H2-based power-to-chemical pathways. Comparative assessments using fixed estimations of future eCO2R operating parameters cannot reflect the development entirely. Our approach of a parameter-dependent assessment provides an in-depth understanding of the key operating parameters of eCO2R. We determined the eCO2R minimum development requirements on a multi-dimensional scale to achieve climate benefits over the H2-based pathway for power-to-methanol and power-to-ethylene.• Electrochemical CO2 reduction to ethylene requires a cell voltage below 2.5 V and a faradaic efficiency higher than 58% to achieve climate benefits over the H2-based pathway. According to reported experimental studies of direct eCO2R to ethylene, the development gap to fulfill the minimum development requirements is moderate. Regarding GHG emissions, the direct eCO2R to ethylene pathway offers a reduction potential of 44% over the H2-based pathway.
• Electrochemical CO2 reduction to carbon monoxide requires a faradaic efficiency higher than 46% and a cell voltage lower than 3.3 V. Experimental studies have already fulfilled these requirements; however, the reduction potential over the H2-based pathway is limited to 12%.
• Electrochemical CO2 reduction to methanol shows the most significant development gap to fulfill the minimum development requirements since eCO2R to methanol is rarely reported in experimental studies. Yet, the reduction potential over the H2-based pathway is 38%.
Compared to the fossil state of the art, both the H2-based and the eCO2R power-to-chemical pathways offer large GHG reduction of up to 88% and up to 93%, respectively. The additional reduction potential of the eCO2R pathways over the industrial available H2-based pathways is minor compared to the reduction potential by using low-carbon electricity. While H2-based pathways excel with high technology readiness level and further efficiency gains in water electrolysis are expected, the eCO2R pathways show a lower technology readiness level and require a complex separation. For these reasons, we see major challenges for eCO2R to be a key technology to reduce GHG emissions of the chemical industry. Nonetheless, efficient eCO2R, operating at low cell voltages and high faradaic efficiencies, can reduce GHG emissions of chemical production even more than H2-based pathways. We recommend focusing further research on direct eCO2R to ethylene due to its reduction potential over the H2-based pathway and the moderate experimental development gap.
Conflicts of interest
There are no conflicts to declare.Acknowledgements
This work has been carried out within the project “ProMet” (033RC017G). The project is funded by the German Federal Ministry of Education and Research (BMBF). We would like to thank our project partners from RWTH Aachen University and Covestro AG for their continuous support and cooperation.References
- Global Change Data Lab, Our World in Data, https://ourworldindata.org/emissions-by-sector#direct-industrial-processes-5-2, accessed 19 March 2021, 308Z Search PubMed.
- S. Nitopi, E. Bertheussen, S. B. Scott, X. Liu, A. K. Engstfeld, S. Horch, B. Seger, I. E. L. Stephens, K. Chan, C. Hahn, J. K. Nørskov, T. F. Jaramillo and I. Chorkendorff, Progress and Perspectives of Electrochemical CO2 Reduction on Copper in Aqueous Electrolyte, Chem. Rev., 2019, 119, 7610–7672 CrossRef CAS PubMed.
- Thomson Reuters, Global Data Petrochemical, https://emea1.apps.cp.thomsonreuters.com/web/cms/?navid=20365, accessed 5 January 2021 Search PubMed.
- F. Bauer and M. Sterner, Power-to-X im Kontext der Energiewende und des Klimaschutzes in Deutschland, Chem. Ing. Tech., 2020, 92, 85–90 CrossRef CAS.
- K. Bareiß, C. de La Rua, M. Möckl and T. Hamacher, Life cycle assessment of hydrogen from proton exchange membrane water electrolysis in future energy systems, Appl. Energy, 2019, 237, 862–872 CrossRef.
- D. S. Kourkoumpas, E. Papadimou, K. Atsonios, S. Karellas, P. Grammelis and E. Kakaras, Implementation of the Power to Methanol concept by using CO2 from lignite power plants: Techno-economic investigation, Int. J. Hydrogen Energy, 2016, 41, 16674–16687 CrossRef CAS.
- M. Pérez-Fortes, J. C. Schöneberger, A. Boulamanti and E. Tzimas, Methanol synthesis using captured CO2 as raw material: Techno-economic and environmental assessment, Appl. Energy, 2016, 161, 718–732 CrossRef.
- C. Oloman and H. Li, Electrochemical Processing of Carbon Dioxide, ChemSusChem, 2008, 1, 385–391 CrossRef CAS PubMed.
- K. Roh, A. Bardow, D. Bongartz, J. Burre, W. Chung, S. Deutz, D. Han, M. Heßelmann, Y. Kohlhaas, A. König, J. S. Lee, R. Meys, S. Völker, M. Wessling, J. H. Lee and A. Mitsos, Early-stage evaluation of emerging CO 2 utilization technologies at low technology readiness levels, Green Chem., 2020, 22, 3842–3859 RSC.
- G. O. Larrazábal, A. J. Martín and J. Pérez-Ramírez, Building Blocks for High Performance in Electrocatalytic CO2 Reduction: Materials, Optimization Strategies, and Device Engineering, J. Phys. Chem. Lett., 2017, 8, 3933–3944 CrossRef PubMed.
- L. M. Aeshala, R. Uppaluri and A. Verma, Electrochemical conversion of CO2 to fuels: tuning of the reaction zone using suitable functional groups in a solid polymer electrolyte, Phys. Chem. Chem. Phys., 2014, 16, 17588–17594 RSC.
- J.-B. Vennekoetter, R. Sengpiel and M. Wessling, Beyond the catalyst: How electrode and reactor design determine the product spectrum during electrochemical CO2 reduction, Chem. Eng. J., 2019, 364, 89–101 CrossRef CAS.
- M. A. Adnan and M. G. Kibria, Comparative techno-economic and life-cycle assessment of power-to-methanol synthesis pathways, Appl. Energy, 2020, 278, 115614 CrossRef CAS.
- H. Guzmán, F. Salomone, E. Batuecas, T. Tommasi, N. Russo, S. Bensaid and S. Hernández, How to make sustainable CO2 conversion to methanol: thermocatalytic versus electrocatalytic technology, Chem. Eng. J., 2020, 127973 Search PubMed.
- S. Kibria Nabil, S. McCoy and M. G. Kibria, Comparative life cycle assessment of electrochemical upgrading of CO 2 to fuels and feedstocks, Green Chem., 2021, 32(2), 867–880 RSC.
- A. Kätelhön, A. Bardow and S. Suh, Stochastic Technology Choice Model for Consequential Life Cycle Assessment, Environ. Sci. Technol., 2016, 50, 12575–12583 CrossRef PubMed.
- S. Suh, Functions, commodities and environmental impacts in an ecological–economic model, Ecol. Econ., 2004, 48, 451–467 CrossRef.
- R. Heijungs and S. Suh, The Computational Structure of Life Cycle Assessment, Springer, Dordrecht, 2002 Search PubMed.
- M. A. J. Huijbregts, Z. J. N. Steinmann, P. M. F. Elshout, G. Stam, F. Verones and M. Vieira, Michiel Zijp, Anne Hollander and Rosalie van Zelm, ReCiPe2016: a harmonised life cycle impact assessment method at midpoint and endpoint level, Int. J. Life Cycle Assess., 2017, 22, 138–147 CrossRef.
- L. Wang, S. A. Nitopi, E. Bertheussen, M. Orazov, C. G. Morales-Guio, X. Liu, D. C. Higgins, K. Chan, J. K. Nørskov, C. Hahn and T. F. Jaramillo, Electrochemical Carbon Monoxide Reduction on Polycrystalline Copper: Effects of Potential, Pressure, and pH on Selectivity toward Multicarbon and Oxygenated Products, ACS Catal., 2018, 8, 7445–7454 CrossRef CAS.
- K. P. Kuhl, E. R. Cave, D. N. Abram and T. F. Jaramillo, New insights into the electrochemical reduction of carbon dioxide on metallic copper surfaces, Energy Environ. Sci., 2012, 5, 7050–7059 RSC.
- Y. Hori, A. Murata and R. Takahashi, Formation of hydrocarbons in the electrochemical reduction of carbon dioxide at a copper electrode in aqueous solution, J. Chem. Soc., Faraday Trans. 1, 1989, 85, 2309 RSC.
- E. J. Dufek, T. E. Lister and M. E. McIlwain, Bench-scale electrochemical system for generation of CO and syn-gas, J. Appl. Electrochem., 2011, 41, 623–631 CrossRef CAS.
- C. Delacourt, P. L. Ridgway, J. B. Kerr and J. Newman, Design of an Electrochemical Cell Making Syngas (CO + H2) from CO2 and H2O Reduction at Room Temperature, J. Electrochem. Soc., 2007, 155, B42 CrossRef.
- U. Lee, J. Burre, A. Caspari, J. Kleinekorte, A. M. Schweidtmann and A. Mitsos, Techno-economic Optimization of a Green-Field Post-Combustion CO2 Capture Process Using Superstructure and Rate-Based Models, Ind. Eng. Chem. Res., 2016, 55, 12014–12026 CrossRef CAS.
- G. Wernet, C. Bauer, B. Steubing, J. Reinhard, E. Moreno-Ruiz and B. Weidema, The ecoinvent database version 3 (part I): overview and methodology, Int. J. Life Cycle Assess., 2016, 21, 1218–1230 CrossRef.
- S. Deutz and A. Bardow, Life-cycle assessment of an industrial direct air capture process based on temperature–vacuum swing adsorption, Nat. Energy, 2021, 6, 203–213 CrossRef CAS.
- A. Sternberg, M. J. Christian and A. Bardow, Life cycle assessment of CO2-based C1-chemicals, Green Chem., 2017, 19, 2244–2259 RSC.
- L. K. Rihko-Struckmann, A. Peschel, R. Hanke-Rauschenbach and K. Sundmacher, Assessment of Methanol Synthesis Utilizing Exhaust CO 2 for Chemical Storage of Electrical Energy, Ind. Eng. Chem. Res., 2010, 49, 11073–11078 CrossRef CAS.
- A. C. Dimian and C. S. Bildea, Energy efficient methanol-to-olefins process, Chem. Eng. Res. Des., 2018, 131, 41–54 CrossRef CAS.
- N. von der Assen, L. J. Müller, A. Steingrube, P. Voll and A. Bardow, Selecting CO2 Sources for CO2 Utilization by Environmental-Merit-Order Curves, Environ. Sci. Technol., 2016, 50, 1093–1101 CrossRef CAS PubMed.
- A. Schreiber, A. Peschel, B. Hentschel and P. Zapp, Life Cycle Assessment of Power-to-Syngas: Comparing High Temperature Co-Electrolysis and Steam Methane Reforming, Front. Energy Res., 2020, 8, 287 Search PubMed.
- T. Haas, R. Krause, R. Weber, M. Demler and G. Schmid, Technical photosynthesis involving CO2 electrolysis and fermentation, Nat. Catal., 2018, 1, 32–39 CrossRef CAS.
- H. Willem, Y. Lin and A. Lekov, Review of energy efficiency and system performance of residential heat pump water heaters, Energy Build., 2017, 143, 191–201 CrossRef.
Footnote |
| † Electronic supplementary information (ESI) available. See DOI: 10.1039/d1se00975c |
| This journal is © The Royal Society of Chemistry 2021 |