
 Open Access Article
 This Open Access Article is licensed under a Creative Commons Attribution-Non Commercial 3.0 Unported Licence
The environmental performance of a fossil-free ship propulsion system with onboard carbon capture – a life cycle assessment of the HyMethShip concept†
Elin
Malmgren
 *a,
Selma
Brynolf
a,
Erik
Fridell
ab,
Maria
Grahn
a and
Karin
Andersson
a
*a,
Selma
Brynolf
a,
Erik
Fridell
ab,
Maria
Grahn
a and
Karin
Andersson
a
aDepartment of Mechanics and Maritime Sciences, Maritime Environmental Science, Chalmers University of Technology, Campus Lindholmen, SE-412 96 Göteborg, Sweden. E-mail: elin.malmgren@chalmers.se
bIVL Swedish Environmental Research Institute, Aschebergsgatan 44, SE-411 33 Göteborg, Sweden
First published on 26th April 2021
Abstract
The climate impact caused by the shipping industry has increased over the past decades despite attempts to improve the energy efficiency of vessels and lower induced emissions. A tool in reducing climate and other environmental impacts is new low emissions propulsion technologies. These new technologies need to reduce harmful emissions not only in the tailpipe but also over the entire life cycle. This study uses life cycle assessment to investigate the life cycle environmental impact of a propulsion concept currently under development: the HyMethShip concept. The HyMethShip concept combines electro-methanol energy storage, an onboard pre-combustion carbon capture system, and a dual fuel internal combustion engine. The concept aims for an almost closed CO2 loop by installing CO2 capture onboard. The CO2 is unloaded in port and converted into electro-methanol which is used to fuel the ship again. This is made possible by a pre-combustion process converting electro-methanol to hydrogen and CO2. The assessment is conducted from well-to-propeller and focuses on ship operation in the North Sea in 2030. The results indicate that this technology could be an alternative to reduce the climate impact from shipping. The results show a lower impact on acidification, climate change, marine eutrophication, particulate matter, photochemical ozone formation, and terrestrial eutrophication compared to internal combustion engines run on either marine gas oil (0.1% sulphur content), biogenic methanol, fossil methanol, or electro-methanol. Electricity with low climate and environmental impact is likely required to achieve this, and low NOx emissions from combustion processes need to be maintained. A potential trade-off is higher toxicity impacts from the HyMethShip concept compared to most other options, due to metal needs in wind power plants.
1. Introduction
The transport sector is an integrated part of today's global economy.1 Ships carried around 70% of the world trade value in 2017 (ref. 2) and shipping is one of the cheapest ways to transport goods and people.1 While sea transport is important for the economy, it also has a significant impact on the environment. The maritime sector is estimated to be responsible for around 3% of the global anthropogenic carbon dioxide (CO2) emissions.3,4 Together with other emissions, such as sulfur oxides (SOx), nitrogen oxides (NOx) and particulate matter (PM), shipping has an established negative impact on human health and the local, regional and global environment.5–10 Although decarbonizing international shipping has been the focus of much work during the past decades,3,7,11–16 the absolute emissions from the shipping sector have increased since 1990.3 With the expected increase of globalization and world trade, the quantity of emissions from ships is expected to rise even further.3With few exceptions, today's ships use fossil fuels, which cause an increased net contribution of CO2 to the atmosphere when combusted. The main fuels used are heavy fuel oil (HFO), liquified natural gas (LNG), and marine gas oil (MGO). Ships are almost exclusively propelled by internal combustion engines (ICE:s). Two-stroke and four-stroke diesel engines are the dominating technologies in today's shipping fleet.3 Reducing the environmental impact from the shipping industry will likely require a combined introduction of alternative marine fuels, energy efficiency measures, and/or new propulsion technologies.17–19 New solutions may include electric propulsion,20,21 hybrid solutions,22 fuel cell driven propulsion,23–26 carbon capture technologies,27–29 alternative fuels,13,30–35 sailing, and wind/wave/solar assisted vessel operation.36–40 All proposed systems have different environmental performance, technical limitations, and economic prerequisites. Moreover, combinations of new systems will be required to reach the global environmental targets17 proposed by the International Maritime Organization (IMO). Hence, finding the best option between these technologies is not paramount, rather the importance lies in establishing if the technology leads to lower emissions compared to current conventional options and assessing the long-term potential of the options. It is therefore imperative to investigate the potential of each technology to assess under what circumstances they can contribute to lower environmental impact from the shipping industry.
Hydrogen propulsion is a promising future propulsion option, with low tailpipe emissions of CO2, NOx, and environmentally harmful organic compounds, such as volatile organic compounds (VOC).41–43 Hydrogen (H2) can be produced by using water electrolyzers with renewable electricity. However, the infrastructure required to distribute H2 at large scales is not yet available and the introduction of H2 as fuel will require large investments. Another challenge with using H2 to propel ships is the space required for onboard storage, as H2 has an energy density of 8 MJ liter−1 (ref. 44) when stored in liquid form, compared to 44 MJ liter−1 of conventional marine gas oil (MGO), thus requiring larger storage space. H2 tanks also require more space. To increase the energy density of the stored fuel, and to simplify infrastructure requirements, a hydrogen carrier such as methanol could be an option.
Methanol is a simple alcohol which is currently used to propel vessels.45 The fuel has an energy density of 15.6 MJ liter−1,46 is liquid at atmospheric pressure and is biodegradable if leaked to the marine environment.47 Methanol can be produced from natural gas or biomass,13 but also from water, electricity and CO2,33 so called electro-methanol.‡ The environmental performance of the fuel mainly depends on the feedstock.13 In the shipping industry solutions without carbon emissions, i.e. zero emissions shipping, have gained increasing interest and combining electro-fuels with onboard carbon capture, can be an interesting zero carbon emission alternative.
This study investigates if one such alternative: the HyMethShip concept,48 see Fig. 1, can be an environmentally beneficial concept for shipping. In the HyMethShip concept the ship is bunkered with electro-methanol, the first time produced using CO2 captured from the atmosphere33 and thereafter produced using recycled CO2 unloaded from the ship in port. To be able to close the carbon loop, the electro-methanol is separated into H2 and CO2 in a pre-combustion carbon capture process. The CO2 is stored onboard, unloaded onshore and reused to produce new electro-methanol, thereby creating a closed carbon loop. H2 propel the vessel in a dual fuel internal combustion engine (ICE). Although fuel cells could reduce the tailpipe emissions further, the duel fuel ICE is preferred over a fuel cell, in the HyMethShip concept, due to the heat requirements of the pre-combustion process which the ICE can meet.
 | ||
| Fig. 1 Outline of the HyMethShip concept. The HyMethShip concept combines a reformer, storage systems for CO2 and methanol, as well as an ICE into one system (www.hymethship.com). Hydrogen produced from an electrolyzer is used together with captured carbon to produce methanol. The produced electro-methanol is used as a hydrogen carrier stored on the vessel until required for propulsion. A reformer splits the methanol into hydrogen, which is used to propel the vessel, and carbon dioxide, which is captured and liquified, brought to shore and utilized in the electro-methanol production. The orange colored processes occur onboard the vessel. The pink system boundary shows the main processes included in this work and the grey system boundary marks the re-circulated CO2. | ||
To determine the effects on health and the environment from using a new technology, the full life cycle of the technology needs to be investigated,49–52 from electricity production and water management, to vessel operation and end-of-life treatment. The results need to be benchmarked against conventional technologies, to give insight to the order of magnitude of the impact, and if there is a trade-off between different impacts from the technologies studied. Knowledge on how shipping technologies affect human health has been brought into focus in recent years,32 but assessments of health impacts from the production and use of electro-fuels are not commonly available in the scientific literature with only few studies performed.53–56 Some studies are available which quantifies environmental impacts from use of electro-fuels in the transport sector.57–61 However, these studies focus on road vehicles and no studies have been published assessing electro-fuels used in shipping from a life cycle perspective. The authors are not aware of any papers which quantify the environmental or health impact from onboard carbon capture systems for shipping vessels. Therefore, the aim of this paper is to compare the health impacts and environmental performance of the HyMethShip concept with today's conventional propulsion technologies (ICE using MGO and/or methanol produced from different sources) through life cycle assessment (LCA) and thereby establish whether or not uptake of the HyMethShip concept could lead to lower environmental pressure and health impact from the shipping industry.
The paper begins with a description of the concept in Section 2. This is followed by an outline of the goal and scope of the LCA (Section 3), in which the setting and limitations of the study is presented. In Section 4 data used for the assessment is presented. Section 5 presents and discusses the results of the LCA, including a sensitivity analysis. A discussion around the applicability of the study is presented in Section 6. Finally, the findings are summarized in Section 7.
2. The HyMethShip concept
The HyMethShip system is a new emerging propulsion technology currently under development. The HyMethShip concept refers to the onboard HyMethShip system used together with electro-methanol in a closed carbon loop. The electro-methanol is first time produced using CO2 from direct air capture (thereafter from recycled CO2) and hydrogen from water electrolysis. The methanol is stored at the production facility and then transported to the harbor where it is stored until utilized. The fuel is then bunkered and stored onboard the vessel. Two propulsion modes are possible onboard, either the engine can be run on methanol directly (back-up system) or the methanol is pumped to the pre-combustion system (reformer). In the reformer the methanol and water are converted into H2 and CO2. This reformer technology currently being developed within the HyMethShip project funded by European Union's Horizon 2020 research and innovation program under grant agreement no. 768945 is a central part of this onboard carbon capture concept. More information about the technology is available in Wermunth et al.48 The H2 is utilized to propel the vessel and the CO2 is cooled until liquefied and stored onboard. When in port the liquid CO2 is unloaded and stored until it can be transported to an electro-methanol production facility. The recycled CO2 is then substituting CO2 from direct air capture (DAC) in the electro-methanol production. In this way the concept allows for a ship propulsion system with an almost closed CO2 loop while utilizing the reliability of proven technologies.§The reformer converts methanol and water into H2 and CO2 through an endothermic process (see Scheme 1). Waste heat from the ICE when it combusts fuel (heat from the exhaust gas) is used in the reformer to run the endothermic process. From energy balance calculations of the current design of the HyMethShip concept it is assumed that all heat required in the reformer can be provided by the ICE. As a result, the total system efficiency of the HyMethShip onboard system is slightly higher than the engine efficiency. As heat is needed to run the reformer reaction, an initial phase of operation where the engine is run on methanol is required until the engine is warm, referred to as the start-up phase. When the reformer is heated the vessel shifts to hydrogen propulsion.
 | ||
| Scheme 1 Reformer functionality and reaction, including feedstocks and primary material flows. The system achieves a complete reaction due to recirculation of reactants and heat supplied from the engine exhaust gas. | ||
The HyMethShip concept is a fossil free system which can be used onboard vessels in the not so distance future, and it can also use methanol from other sources than electro-methanol. Using fossil methanol leads to some reductions in climate impact compared to conventional crude oil-based options,13,62 but combined with carbon capture and hydrogen propulsion the climate impact can be reduced further. Combining the onboard system with fossil and biogenic methanol is not the primary focus of this study, but a sensitivity analysis including these system configurations can be found in the ESI.†
3. Life cycle assessment
The LCA was performed following the ISO14044 standard63 and the recommendations for carbon capture and utilization related LCA studies provided by van der Assen et al.64 and Müller et al.65 LCA is used to assess the environmental impact of a product or technology by mapping all material and energy flows from each process in the life cycle.50 The flows are then linked to impacts on the environment through characterization methods. In this way, the environmental impact of similar options can be quantified and compared.This study was conducted as a comparative prospective attributional LCA study and the impact assessment was based on the International Reference Life Cycle Data Systems' (ILCD) recommended characterization methods.66 Calculations were performed in the open-source tool openLCA. In the following chapter, the goal and scope of the LCA are outlined.
3.1. The functional unit
LCA assesses different technologies or products based on their function. This is done by establishing a quantifiable unit within the system, a so-called functional unit, which is then used as a basis.49 The functional unit used in this study is a voyage with a RoPax vessel traveling from Gothenburg harbor, Sweden, to Kiel harbor, Germany, and back again. During operation, the ship enters four main phases as outlined in Table 1. The data on engine operation were collected from the current ICE system installed on a RoPax vessel in operation between Gothenburg and Kiel. The aggregated data is assumed to be representative for the current engine set up as well as a situation where a similar vessel is using a different engine system on the same route.| Anchored | Maneuvering phase | Travelling at sea | Maneuvering phase | |||||||||
|---|---|---|---|---|---|---|---|---|---|---|---|---|
| Engine work (kW h) | Speed (knots) | Engine load (%) | Engine work (kW h) | Speed (knots) | Engine load (%) | Engine work (kW h) | Speed (knots) | Engine load (%) | Engine work (kW h) | Speed (knots) | Engine load (%) | |
| Gothenburg–Kiel | 16![[thin space (1/6-em)]](https://www.rsc.org/images/entities/char_2009.gif) 740 740 |
0 | 0 | 5600 | 0–12 | 25 | 192000 |
18 | 80 | 5600 | 0–12 | 25 |
| Kiel–Gothenburg | 16740 |
0 | 25 | 5600 | 0–12 | 25 | 192000 |
18 | 80 | 5600 | 0–12 | 25 |
3.2. Assessed concepts
The results from the life cycle assessment of the HyMethShip concept is compared to 6 conventional systems with similar infrastructure and vessel requirements. An outline of the life cycle and included technologies for each concept can be viewed in Fig. 2. The investigated technological options are based on 4 engine systems and 4 fuel production pathways (see Table 2). As of 2021 IMO has restricted the allowed emission levels of NOx from new engines in the NECA region67 (including the Baltic and North Seas). To show a plausible future MGO propulsion concept NOx abatement technology is assumed to be used on the vessel, noted as scenario G in Fig. 2. This results in 7 different concepts (see Fig. 2 and Table 2). | ||
| Fig. 2 Life cycles of the 7 assessed concepts. The notation on the left side of the figure corresponds to the abbreviation used for the different concepts in the text. The top panel (A) shows an outline of the HyMeth concept as it is assessed in this paper. Panel (B) shows an outline of a scenario where an ICE is run on electro-methanol directly without using an onboard carbon capture system. Biogenic methanol from willow is used in the concept outlined in the green panel (C). (D) and (E) shows to concepts where fossil methanol is used in two different engine systems. In panel (D) pure methanol propulsions is used and in panel (E) a pilot fuel setup is used. In the two bottom panels (F) and (G) you can see the life cycle of two MGO based options, where in the yellow panel (G) additional abatement technology is used. Grey box text show processes based on data gathered from databases. | ||
| Functional unit | 1 voyage with a case study vessel from Gothenburg harbor to Kiel harbor and back to Gothenburg harbor |
|---|---|
| Time horizon | 2030 |
| Geographical boundaries | North European SECAs (the English channel, the North Sea and the Baltic Sea) |
| System boundaries | Cradle to propeller of the fuel life cycle from one functional unit. The ship life cycle is not included. Capital goods manufacturing not included |
| Allocation | System expansion |
| Impact categories66 | Acidification |
| Climate change, GWP2069 | |
| Climate change, GWP10069 | |
| Freshwater ecotoxicity | |
| Human toxicity, cancer effects | |
| Human toxicity, non-cancer effects | |
| Marine eutrophication | |
| Ozone depletion | |
| Particulate matter | |
| Photochemical ozone formation | |
| Terrestrial eutrophication | |
| Included primary pollutants | Black carbon |
| Carbon dioxide (CO2) | |
| Carbon monoxide (CO) | |
| Nitrogen oxides (NOx) | |
| Nitrous oxide (N2O) | |
| Sulphur dioxide (SO2) | |
| Methane (CH4) | |
| Ammonia (NH3) | |
| Formaldehyde (CH2O) | |
| Particulate matter (PM10) | |
| Non-methane volatile organic compounds (NMVOC) | |
| Normalization | CI ICE using MGO, per case |
| Fuels included | Biogenic methanol (BioMeOH) produced with biomass (willow) as main feedstock |
| Fossil methanol produced by steam reforming natural gas (NGMeOH) | |
| Electro-methanol (eMeOH) produced using direct air capture (DAC) and electrolysis driven by wind power | |
| MGO | |
| Engine systems included | Dual fuel spark ignited ICE combined with the HyMethShip reformer |
| Spark ignited ICE (SI ICE) optimized to run on methanol | |
| Conventional compression ignition ICE (CI ICE) | |
| Running on methanol using MGO as a pilot fuel | |
| CI ICE optimized for MGO propulsion | |
| Compared concepts | HyMethShip using electro-methanol from DAC and wind power (HyMethShip–baseline) |
| SI ICE using electro-methanol (ICE–eMeOH) | |
| SI ICE using biomethanol (ICE–BioMeOH) | |
| SI ICE using fossil methanol (ICE–NGMeOH) | |
| CI ICE using fossil methanol and pilot diesel (CI ICE–NGMeOH) | |
| CI ICE using marine gas oil (CI ICE–MGO) | |
| CI ICE using MGO and selective catalytic reduction (CI ICE + SCR–MGO) |
As this is an LCA study aimed at comparing different main engine systems, auxiliary engines and boilers are assumed to be the same for all alternative systems and are therefore excluded from the analysis. All engines are assumed to be medium speed engines.
3.3. System boundaries
The time perspective considered in this study is until 2030. The study object is a well-to-propeller system of the fuel life cycle. The studied system includes the acquisition of raw materials, production and transportation, bunkering, onboard storage, and fuel combustion in the engines (see Fig. 2 for details on each scenario). The geographical boundary for the ship operation is set to the north European SECAs (the English Channel, the North Sea and the Baltic Sea). Extraction, production, and processing of the fuels are in most cases taking place in Europe, except for the MGO production were the data represents a global average68 (see scenarios E–G in Fig. 2).Some infrastructure processes are included in the background data sets, but no additional infrastructure was considered. As of now the project partners expects no changes to the hull or operational pattern between a vessel with the HyMethShip system and a vessel run on a conventional ICE. The fuel cycle of the system is thus better known and expected to influence the results to a higher degree. Differences in emissions from the engine production, required harbor infrastructure, etc. will contribute to the full impact of the system,70 and large differences might affect the LCA results.
3.4. Primary emissions
Most emissions from the shipping sector are released as exhaust gases and these emissions have an acknowledged impact on the environment71,72 leading to effects on the climate, human health and the marine environment among other. Since emissions to air are the most important emissions the foreground system is limited to the emissions to air. Emissions to water, soil and noise emissions have thereby been excluded. Included primary emissions can be seen in Table 2.3.5. Impact assessment
The International Reference Life Cycle Data System (ILCD) set of impact assessment methods is commonly used in LCAs performed in a European setting. All flows entering or leaving the life cycle of the different engine technologies are characterized based on their impact relative to a reference emission on the selected environmental impact categories. The total impact on the category (indicator result, IRc) is given by:where CFcs is the characterization factor which connects the mass of substance emitted (ms) with the impact category (c). All emitted substances (s) impacting a specific impact category, such as climate change, is thereby aggregated into a total number represented by a mass of equivalents (i.e. emission equivalents). The characterization in this study has been done at “midpoint level”, meaning that the categories are not based on end effects in the environment or on human health, but collected in relation to less aggregated categories such as climate change or acidification. For example, effects on climate change over the next 100 years are estimated based on the aggregated global warming potential measured in CO2 equivalents.
The impact categories included can be viewed in Table 2. To not exclude relevant environmental impacts that could be assessed in this work all impact categories included in the International Reference Life Cycle Data System (ILCD) was considered for the study. For Climate change, both GWP100 and GWP20 are assessed as they are directly affected by the primary pollutants covered in this study and central to future environmental regulations. In ILCD at midpoint, phosphate is assumed to be the limiting substance for eutrophication in freshwater. As this is the assumption done in the methodology, and phosphate is mainly emitted to soil and water rather than through emission to air, the impact category Freshwater eutrophication was excluded from this paper. The impact categories ionizing radiation, ionizing radiation E (interim), land use, mineral, fossil and renewable resource depletion, and water resource depletion are not linked to the primary, pollutants of this LCA study66 and were therefore excluded. The primary pollutants affect several different impact categories, but they do not cover the full inventory of emissions affecting each impact category. The inventory for climate change impacts is the most comprehensive. However, to exclude impact categories which are affected by the accounted pollutants could hide potential trade-offs between environmental issues. The validity of each impact category result is discussed in the result section.
3.6. Sensitivity analysis
(1, 2, 3, 4) 4 different sensitivity analyses where preformed to validate the robustness of the result, see Table 3. First, the impact of varying electricity source for electro-methanol production was analyzed. The electricity sources were selected to represent a range of CO2 intensities.| Different sensitivity analyses of the HyMethShip concept | Parameters adjusted | Cases, parameter adjusted to |
|---|---|---|
| (1) Varying electricity source in the fuel production | Electricity used in the fuel production | (i) Photovoltaic ground mounted power plant |
| (ii) Nuclear power plant based on a pressure water reactor | ||
| (iii) Hard coal IGCC power plant | ||
| (iv) Lignite power plant | ||
| (2) Monte Carlo simulation of uncertainties in assumptions of technical performance | Technical system uncertainties | (i) CO2 loss when unloading CO2 in port |
| (ii) H2 loss | ||
| (iii) Electrolyzer electricity consumption | ||
| (iv) DAC electricity consumption | ||
| (3) Varying the fuel production pathway | All electro-methanol required to be produced with DAC is instead produced using other fuel pathways | (i) Biogenic methanol from willow used onboard |
| (ii) Natural gas-based methanol used onboard | ||
| (4) Expanded life cycle inventory to include tail pipe emissions of metal from MGO combustion | Emissions added to inventory bases on73 | (i) Additional scenario from CI ICE–MGO including emissions of metals in combustion process |
Secondly, a Monte Carlo simulation was performed to investigate the influence of uncertainties in technology development.74 The technologies in focus in this paper are under development and the assessment therefore includes assumptions around how the technologies will develop over time.75 The parameters varied in the Monte Carlo simulation and their uncertainty ranges were selected based on estimates from experts as well as literature data on estimated future performance (see Table 4).
| Parameter | Base case | Low range | High range |
|---|---|---|---|
| CO2 loss when unloading CO2 in port | 2% | 0.5% | 5% |
| H2 loss | 0% | 0% | 2% |
| Electrolyzer electricity consumption | 57 kW h per kg H2 (ref. 80) | 40 kW h per kg H2 (ref. 84) | 84 kW h per kg H2 (ref. 84) |
| DAC electricity consumption | 1.1 MJ per kg CO2 (ref. 80) | 0.3 MJ per kg CO2 (ref. 85) | 3.2 MJ per kg CO2 (ref. 85) |
Third, as the feasibility of DAC technology and its future performance are highly uncertain,76–78 alternatives to use DAC was investigated. This was done by assuming that BioMeOH and NGMeOH were bunkered onboard the vessel instead of eMeOH. By doing this the DAC is bypassed. The CO2 captured onboard was then used to produce new electro-methanol. The circular carbon loop is thus maintained. The results of this analysis can be viewed in chapter 7 of the ESI.† Lastly, additional known metal emissions were added to the CI ICE–MGO inventory to evaluate the potential influence of missing inventory data.
4. Life cycle model and data inventory
The life cycle inventory consists of the accounted mass and energy information for all flows leaving and entering the life cycle system for the 7 different concepts. The mass and energy contents are collected and analyzed for the fuel production and vessel operation in Section 4.1 and 4.2 respectively. In Section 4.3 original sources for data used as input to the primary analysis is presented. For full details see ESI†.4.1. Production phase: fuel production pathways
The inventory data for the electro-methanol production pathway investigated is based on Aspen Plus process simulations79 as no published measurement data have been found. The electro-methanol case is based on production near Gothenburg harbor, where H2 and CO2 are captured in connection with the methanol synthesis (see scenarios A and B in Fig. 2). As a result, there is no need for transport of the products and the storage need is considered negligible. All heat used to produce electro-methanol are assumed to come from electric heating and all electricity is assumed to be offshore wind power. The heat required is assumed to be provided through electric boilers with a 98% efficiency.The H2 gas is assumed to be produced via an alkaline electrolyzer.80 When producing H2 using renewable energy a proton exchange membrane electrolyzer may be preferable since it can react more quickly to fluctuations in the energy production.81 However, this technology has a high investment cost compared to alkaline electrolyzers and are still in the development phase. The CO2 is captured using DAC based on a theoretical calculation/process as presented by Lackner.80 CO2 captured in the DAC process are considered as negative carbon emission, and the carbon emissions are therefore viewed as coming from fossil origin in the calculations. Details on each process can be found in Section S3 of the ESI.† Over the entire life cycle the CO2 supply from DAC corresponds to 5.5% of the total CO2 required. No benefits to the system have been given based on the additional heat and oxygen produced in the electrolyzer. This together with the air capture as sources for CO2 leads to that no further allocation is required in the electro-methanol production.
The methanol produced from biomass is modelled after willow, produced in southern Sweden, which is pretreated and turned to methanol through a syngas reaction (see scenario C in Fig. 2). Four major processes are included: collection of willow,82 transportation,82 pre-treatment83 and the methanol synthesis.83 The methanol synthesis goes via syngas and the pre-treatment process only uses electricity to dry the biomass. To estimate the amount of carbon fixed in the willow mean carbon concentration values of 490 mg g−1 was used.86 Ash created in the methanol synthesis was assumed to release its carbon content to the atmosphere over time. This production pathway does not represent large production quantities and might have limited scale-up potential; however, it is a data set which includes the full life cycle of fuel production. The inventory results can be viewed in Table 5.
| Emission | Unit | eMeOH | BioMeOH | NGMeOH |
|---|---|---|---|---|
| Black carbon | kg MJ−1 fuel | 0 | 0 | 0 |
| Carbon dioxide (CO2) | kg MJ−1 fuel | −0.065 | −0.06075 | 0.0267 |
| Carbon monoxide (CO) | kg MJ−1 fuel | 1.2 × 10⁻⁵ | 2.71198 × 10⁻⁵ | 4.97 × 10⁻⁶ |
| Nitrogen oxides (NOx) | kg MJ−1 fuel | 6.1 × 10⁻⁶ | 3.56 × 10⁻⁵ | 8.8 × 10⁻⁶ |
| Nitrous oxide (N2O) | kg MJ−1 fuel | 0 | 1.26 × 10⁻⁵ | 0 |
| Sulphur dioxide (SO2) | kg MJ−1 fuel | 7.75 × 10⁻⁶ | 2.1 × 10⁻⁵ | 7.9 × 10⁻⁷ |
| Methane (CH4) | kg MJ−1 fuel | 4.4 × 10⁻⁶ | 1.55 × 10⁻⁵ | 1.4 × 10⁻⁷ |
| Ammonia (NH3) | kg MJ−1 fuel | 3.3 × 10⁻⁷ | 3.5 × 10⁻⁶ | 2 × 10⁻⁹ |
| Formaldehyde (CH2O) | kg MJ−1 fuel | 1 × 10⁻⁹ | 4.0 × 10⁻⁸ | 4.4 × 10⁻¹¹ |
| Particulate matter (PM10) | kg MJ−1 fuel | 7 × 10⁻⁶ | 5.4 × 10⁻⁷ | 7.4 × 10⁻⁷ |
| Non-methane volatile organic compounds (NMVOC) | kg MJ−1 fuel | 1.6 × 10⁻⁶ | 9.3 × 10⁻⁶ | 0.00025 |
The methanol from a fossil source considered in this assessment is methanol produced using natural gas through stream reforming (see scenario D and E in Fig. 2). The case investigated is based in Norway, where the natural gas is extracted and produced on an offshore facility, brought to shore and then methanol is produced on shore. CO2 capture has not been considered in the production steps for NGMeOH nor BioMeOH. For detailed process information see Section S6 in the ESI.† The main part of the methanol produced today is used as chemical base material, and the production is mainly done through steam reforming of natural gas.46
Data for MGO production was collected from a European platform on life cycle assessment (ELCD) data set including cradle to gate data, from crude oil to light fuel oil containing 0.1% Sulphur.68 The LCI data sets include all material requirements and energy requirements over the full life cycle of the technology. The data set used is based on several subprocesses, but in this analysis aggregated data for the whole production chain per MJ fuel is used and no adjustments have been made to the original data.
4.2. Use phase: vessel operation and combustion processes
The propulsion of the RoPax vessel is in all assessed cases created by a combustion process in an ICE. The input and output flows to the combustion processes in the different cases are dependent both on the engine technology and the fuel used.3 The energy output combined with the engine efficiency has been used to calculate the fuel consumption. The assumed emission factors for the combustion phase for all loads, propulsion technologies and fuels can be seen in Table 6.| Emission | Unit | SI ICE | CI ICE–NGMeOH | CI ICE–MGO | HyMethShip | |||||
|---|---|---|---|---|---|---|---|---|---|---|
| Traveling at sea | Maneuvering | Traveling at sea | Maneuvering | Traveling at sea | Maneuvering | Traveling at sea | Maneuvering | Back-up using MeOH | ||
| Outputs | ||||||||||
| Black carbon | g kW−1 h−1 | 0 | 0 | 0.016 (ref. 95) | 0.033 (ref. 95) | 0.053 (ref. 96) | 0.057 (ref. 96) | 0 | 0 | 0 |
| CO2 | g kW−1 h−1 | 583 | 630 | 597 (ref. 95) | 640 (ref. 95) | 677 | 728 | 0 | 0 | 697 |
| CO | g kW−1 h−1 | 4.8 (ref. 97) | 3.5 (ref. 97) | 3.7 (ref. 95) | 6.6 (ref. 95) | 1.1 (ref. 32) | 2.2 (ref. 32) | 0.128 | 0.0037 | 10.69 |
| NOx | g kW−1 h−1 | 2.6 (ref. 97) | 3.8 (ref. 97) | 6.5 (ref. 95) | 12.3 (ref. 95) | 13.2 (ref. 87) | 13.2 (ref. 87) | 0.078 | 1.6 | 1.78 |
| SOx | g kW−1 h−1 | 0 | 0 | 0.05 (ref. 95) | 0.074 (ref. 95) | 0.408 | 0.439 | 0 | 0 | 0 |
| Methane | g kW−1 h−1 | 0 | 0 | 0.02 (ref. 95) | 0.04 (ref. 95) | 0.004 (ref. 32) | 0.008 (ref. 32) | 0 | 0 | 0 |
| Formaldehyde | g kW−1 h−1 | 0.225 (ref. 97) | 0.242 (ref. 97) | 0.00049 | 0.00053 (ref. 95) | 0 | 0 | 0.0141 | 0.0119 | 0.27 |
| Particulates, <10 um | g kW−1 h−1 | 0.141 (ref. 97) | 0.153 (ref. 97) | 0.093 (ref. 95) | 0.01 (ref. 95) | 0.38 (ref. 32) | 0.43 (ref. 32) | 0.0213 | 0.0126 | 0.17 |
| NMVOC | g kW−1 h−1 | 0 | 0 | 1.295 (ref. 95) | 1.46 (ref. 95) | 0.2 (ref. 87) | 0.4 (ref. 87) | 0.0028 | 0 | 0.843 |
|
||||||||||
| Inputs | ||||||||||
| Fuel, methanol | g kW−1 h−1 | 414 | 446 | 365 | 370 | N/A | N/A | 361 | 389 | 501 |
| Fuel, MGO | g kW−1 h−1 | N/A | N/A | 25 | 37 | 204 | 219.8 | N/A | N/A | N/A |
| Water | g kW−1 h−1 | N/A | N/A | N/A | N/A | N/A | N/A | 740 | 500 | N/A |
As more onboard measurements from vessels using methanol and low Sulphur MGO becomes available the emission factors used here should be updated.
The exhaust emissions from an ICE is dependent on the engine load factor.87 The three different operating modes outlined in Table 6 are assumed to correlate to two different engine loads: 80% MCR when the vessel is travelling at sea (cruising) and 25% when maneuvering and operating the vessel in harbor (see Table 1). The expected possible future efficiencies of the dual fuel ICE used in the HyMethShip concept have been assessed within the project and as these efficiencies are in accordance with current reported figures for ICEs.3,88–90 For a load factor of around 25% an engine efficiency of 36% was used, and for a load factor of 80% we used an engine efficiency of 40%. The same efficiencies are assumed for the different technologies. The dual fuel ICE is optimized for hydrogen operation resulting in a lower fuel efficiency during methanol operation (see Table 6).
The emission factors for CO2 and SOx are in all cases derived from the carbon and sulphur content of the fuel. The emission factors are adjusted for engine efficiency. The CO2 emissions are adjusted for carbon emitted in the form of CO. As the vessel operates in the Baltic sea region the sulphur content of the MGO is assumed to follow the 0.1% sulphur content SECA limit for 2020.67 Methanol is assumed to be free from sulphur.
In this study the emission factors for MGO are primarily collected from Sofiev et al.,32 which in turn are based on emission models presented in J. P. Jalkanen, L. Johansson and J. Kukkonen.91 In today's literature emission factors for MGO from Goldsworthy and Goldsworthy92 are primarily used, which are instead partly based on the emissions factors established in Cooper and Gustafsson.87 However, Sofiev et al.32 presents specific emission factors for MGO with 0.1% sulphur and is therefore preferred for the scope of this LCA.
In the additional case the Tier III (retrofitted engine) requirements are met using a selective catalytic reduction system (SCR). The SCR used for NOx abatement is assumed to only reduce NOx emissions and the data are based on the work performed by Winnes et al.93 The process uses urea which react with NOx in the exhaust gas and forms CO2, H2O and N2. The urea is assumed to be produced within Europe and the consumption is based on the required reduction of NOx emissions. It is assumed that the ammonia slip is below 0.01 g kW−1 h−1.93
4.3. Additional processes
Life cycle electricity production data developed in the New Energy Externalities Developments for Sustainability (NEEDs) project94 was used. The LCI data sets include all material requirements and energy requirements over the full life cycle of the technology. Table S6 in the ESI† summarizes all used data gathered from databases.5. Environmental impacts of the HyMethShip concept
Environmental impacts from hotspots in the system are in focus in Section 5.1. In Section 5.2, we compare the impacts of the HyMethShip concept life cycle to six alternative propulsion concepts.5.1. Life cycle analysis of the HyMethShip concept's life cycle
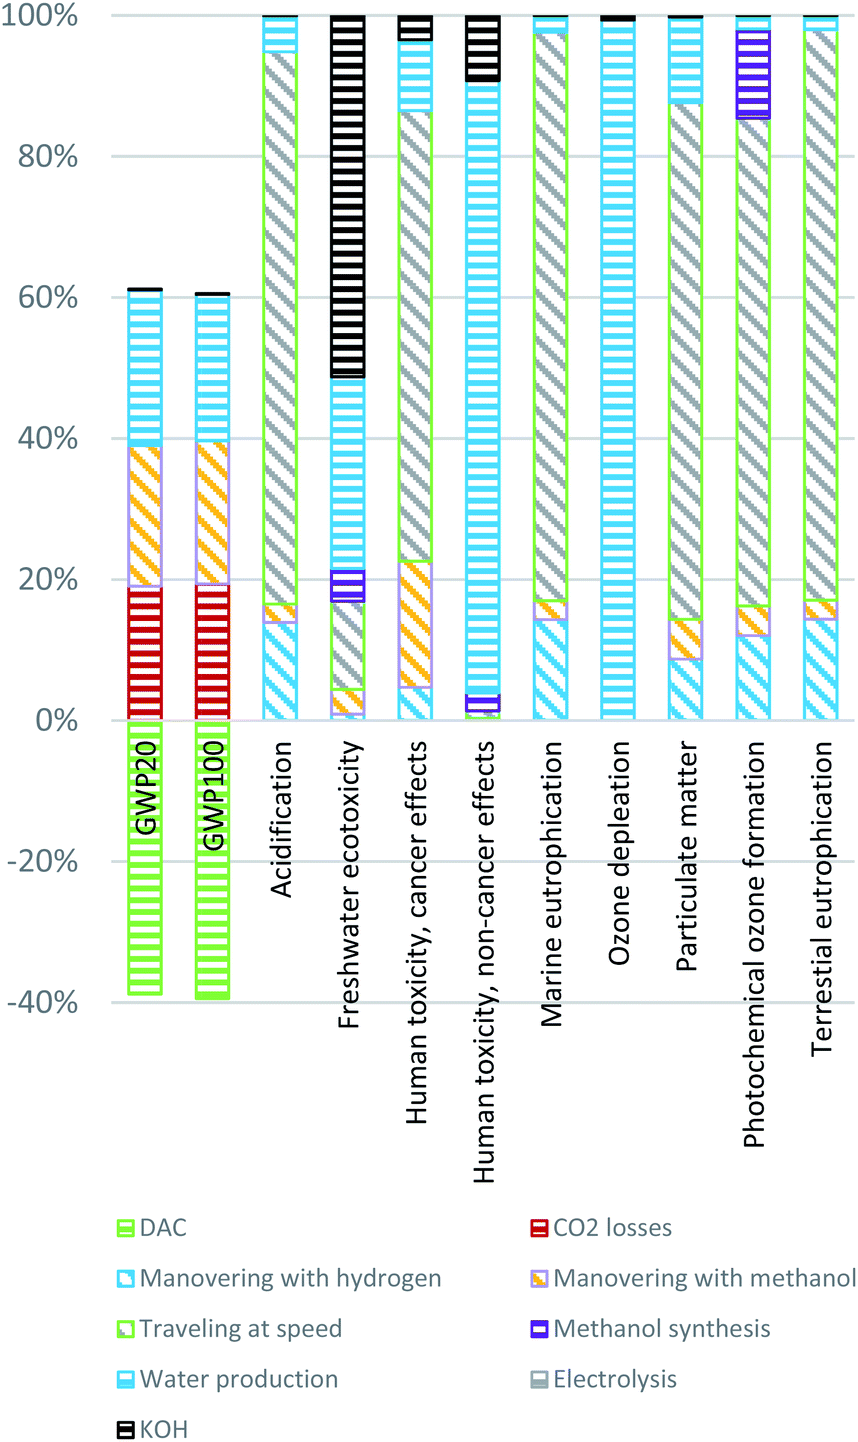
Fig. 3 shows the relative contribution of each process in the HyMethShip system to the total impact for each environmental impact category. Two different types of processes account for the main impact in most impact categories: (1) combustion processes (travelling at speed and maneuvering with hydrogen/methanol) for the propulsion of the vessel and (2) the electricity production processes. The main emission source impacting climate change is CO2 emissions in the electricity production. 87% of the electricity used in the life cycle is needed for the electrolyzer process (see Table 7). The CO2 losses when unloading the stored CO2 in port results in around 17% of the total impact on climate, when 2% CO2 loss is assumed. The CO2 loss from bunkering, CO2 emitted in the methanol combustion and greenhouse gas emissions from the electro-methanol production are all in the same order of magnitude. | ||
| Fig. 3 The contribution to each impact category presented per process in the life cycle of the HyMethShip concept as described in Section 2 and scenario A in Fig. 2. Combustion processes for propulsion include travelling at speed, maneuvering with hydrogen, and maneuvering with methanol. Electricity for fuel production includes electricity production from offshore wind power used in direct air capture, methanol synthesis, and electrolysis. | ||
| Process | Electricity demand per functional unit (MJ) | Electricity demand of total electricity consumption (%) | Process efficiency (based on LHV) (%) |
|---|---|---|---|
| Methanol synthesis | 725000 |
11 | 73.47 |
| Hotel load | 60200 |
0.97 | 99 |
| Electrolyzer | 5430000 |
87 | 58.3 |
| DAC | 8350 | 0.13 | N/A |
The combustion processes (travelling at speed, maneuvering, and start-up) are the main drivers of the impact on acidification, eutrophication, and photochemical ozone formation. The travelling at speed process stands for 94% of the total engine energy usage and therefore contribute to a higher degree to the total impact compared to maneuvering and start-up. The acidification and eutrophication categories are first and foremost affected by NOx emitted when H2 is combusted onboard. For the photochemical ozone formation NOx emissions stands for the largest emission equivalents, however also formaldehyde, SOx, NMVOC, and CO emissions from combustion processes, as well as liquid methanol emissions in the wastewater from the methanol synthesis process, contribute. These methanol emissions occur when methanol is solved in wastewater from the separation boiler, which then evaporates, and the methanol is emitted to the air.
The particulate matter impact category is as well affected by NOx emissions, but also particulates of various sizes and SOx emissions originating in electricity production has a significant impact. These emissions appear to mainly come from fuel combusted by vessels and vehicles used in the construction and maintenance of the wind power plant.94 NOx emissions thereby have a significant impact on several of the impact categories and maintaining low NOx emission levels in the ICE combustion process should be considered in the design of the engine system.
The main influencing factors for the toxicity impact categories are materials used in the construction of the offshore wind power construction. Contributing emissions are hexavalent chromium (chromium VI), metal emissions and a variety of metal ions. Hexavalent chromium is the main contributor for both human toxicity cancer effects and the freshwater ecotoxicity. How hexavalent chromium should be considered in LCAs and USEtox is still discussed and explored in the scientific literature.98 The applicability of these results is therefore limited; however, the results are analyzed in this paper as the HyMethShip concept is using electricity to a higher degree than other technologies and this can be a potential trade-off between concepts. As the assessment of metal toxicity is deemed uncertain, these categories are presented separately in the comparative analysis. A minor contributor to the human health, cancer effect category is the methanol emissions from the methanol synthesis.
Fig. 4 presents the results without the contribution from electricity production, as the electricity background data affects the results significantly and can hide contributing impacts from other processes. For the particulate matter impact category emissions of CO, NOx and particulates all contributes to the end effects. NOx emissions stand for 68% of the total impact and particulates of various sizes for 31%. Acidification, marine eutrophication, and terrestrial eutrophication are all primarily affected by NOx (as earlier), and human health cancer effects is mainly affected by formaldehyde emissions. The human toxicity non-cancer impact is affected to almost 70% by the methanol synthesis (Fig. 4) mainly due to the negative health impacts of emitting methanol, indicating that accidental emissions of methanol also in other parts of the value chain will contribute to this impact. Therefore, producers, users, and designers should aim at reducing fuel leakage throughout the life cycle. However, methanol is quickly degraded in the ecosystem compared to diesel99 and is estimated to be in a similar range of human toxicity, indicating that limiting fuel leakage is influential for all fuel pathways. Freshwater ecotoxicity is also affected by the methanol emissions from the synthesis process.
 | ||
| Fig. 4 The contribution to each impact category presented per process in the life cycle of the HyMethShip concept without background electricity production processes. The results are for scenario A in Fig. 2. | ||
5.2. Results from the comparative LCA
In Fig. 5 the results on GWP100 can be viewed for the 7 assessed concepts. The HyMethShip concept shows the lowest impact. The main contributing emission to the climate change impact categories for the non-HyMethShip concepts are CO2 emissions from the combustion processes. These emissions are mitigated when onboard carbon capture is used. The lower demand for DAC makes HyMethShip–Base case preferable to ICE–eMeOH. Only slight changes appear between the GWP100 and GWP20 impact categories (see Fig. 6).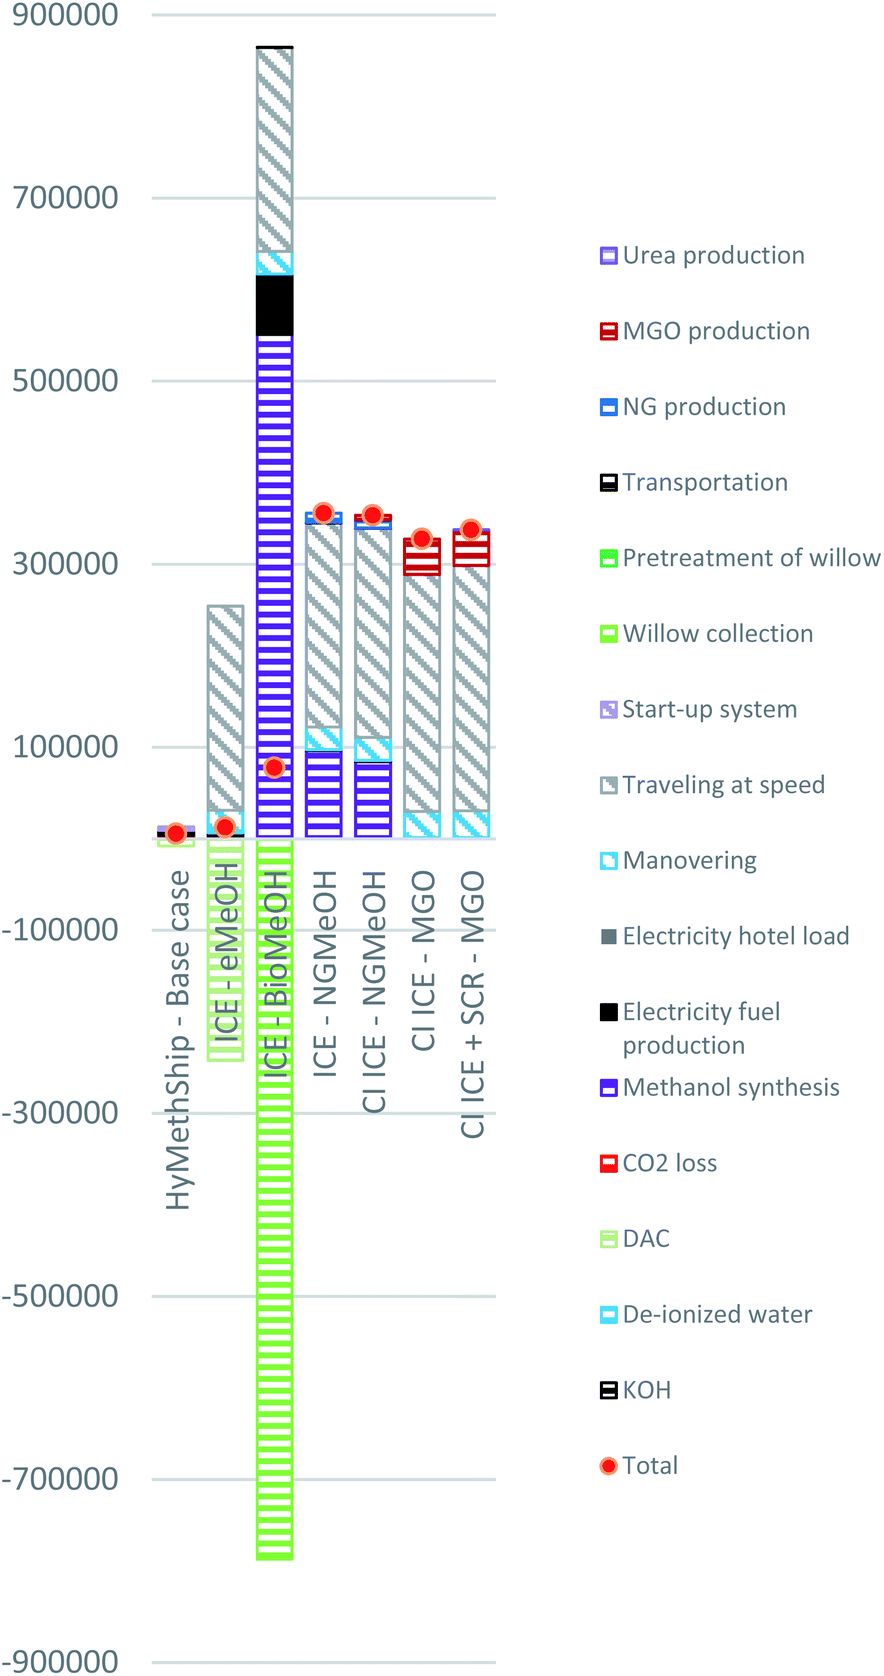 | ||
| Fig. 5 Process contribution to climate change (GWP100) for all cases. Unit kg CO2 equivalents. Presented per round trip between Gothenburg and Kiel on a RoPax vessel. | ||
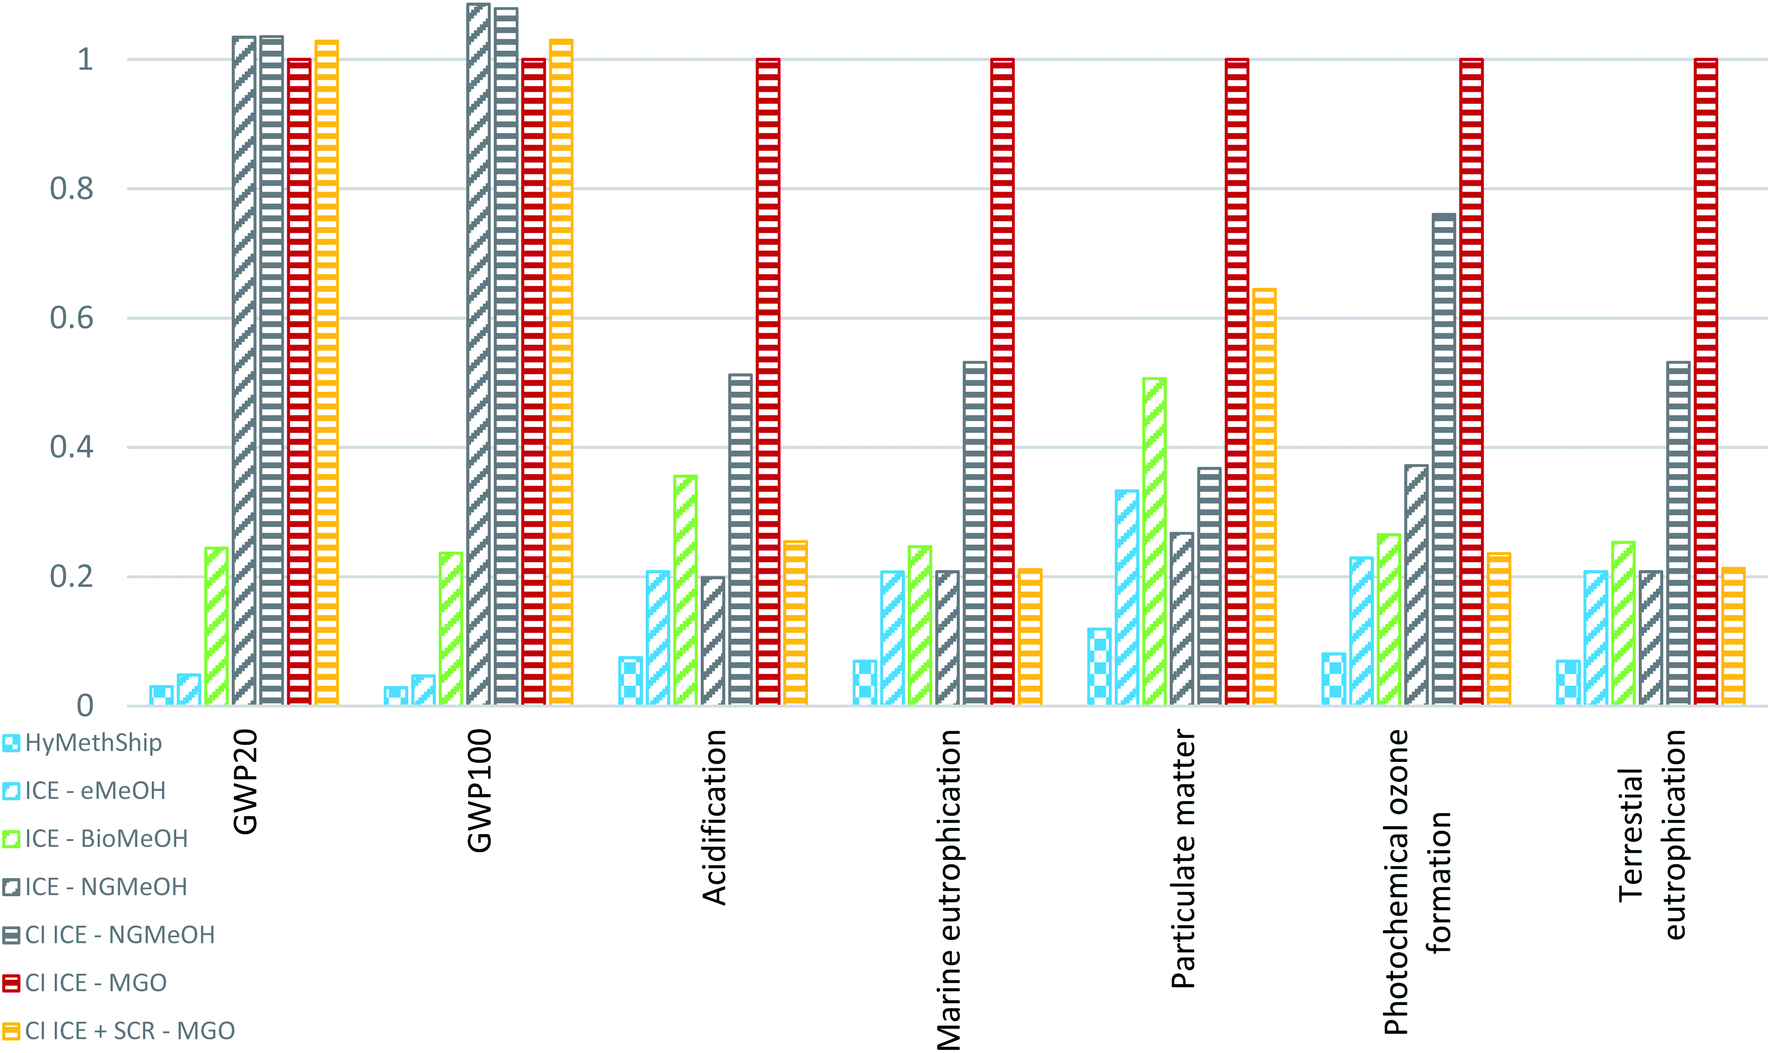 | ||
| Fig. 6 Life cycle assessment results for GWP, acidification, marine eutrophication, particulate matter, photochemical ozone formation and terrestrial eutrophication. Results normalized per CI ICE using MGO and presented per round trip between Gothenburg and Kiel on a RoPax vessel. The y-axel indicates the same values for both sides of the graph, where 1 = CI ICE–MGO. | ||
For the concepts using eMeOH and BioMeOH negative emissions are presented (see “DAC” and “Willow collection”). This is due to the accounting methodology used, where CO2 captured from air is accounted for as negative emissions both when DAC is used and when the willow grows. The carbon captured this way become emissions to the environment when they leave the system boundary. Over the whole life cycle all carbon entering the system is also emitted. The negative emission from ICE–BioMeOH are larger than for the eMeOH concepts due to the stochiometric carbon requirements. Methanol contains less carbon per hydrogen unit than the carbon/hydrogen ratio in the biomass. Only around 55% of the carbon in the cultivated willow is converted to methanol.
The accumulated impact on climate change from the ICE–BioMeOH concept mainly derives from carbon emissions in the electricity production and N2O released from fertilizers used in the cultivation of the willow. Currently N2O emissions stand for less than 20% of the total impact. However, these emissions vary between different biomass sources. The impact caused by the N2O could potentially be removed if the biomass used for production of methanol comes from uncultivated sources such as forest residues, but the availability of biogenic waste products is restricted.100
To use an SCR to purify the exhaust gas from the CI ICE leads to a slight increase in climate impact due to additional CO2 formed in the exhaust gas and production of consumables. For the ICE–NGMeOH and CI ICE–NGMeOH concepts carbon and methane emissions from the natural gas production and methanol synthesis have significant impacts on the result. Emissions from natural gas-based fuels used here are taken from official numbers and does not include emissions from accidents or unreported leakage. This means that calculated amount of methane emissions in the life cycle might be underestimated.
The results for all investigated impact categories, combustion technologies and fuels can be viewed in Fig. 6 and 7. The HyMethShip concept shows a better environmental performance than today's conventional MGO system, the ICE using NGMeOH concept and the ICE using BioMeOH concept in all but three categories. The HyMethShip concept performs better than the ICE using eMeOH in all categories.
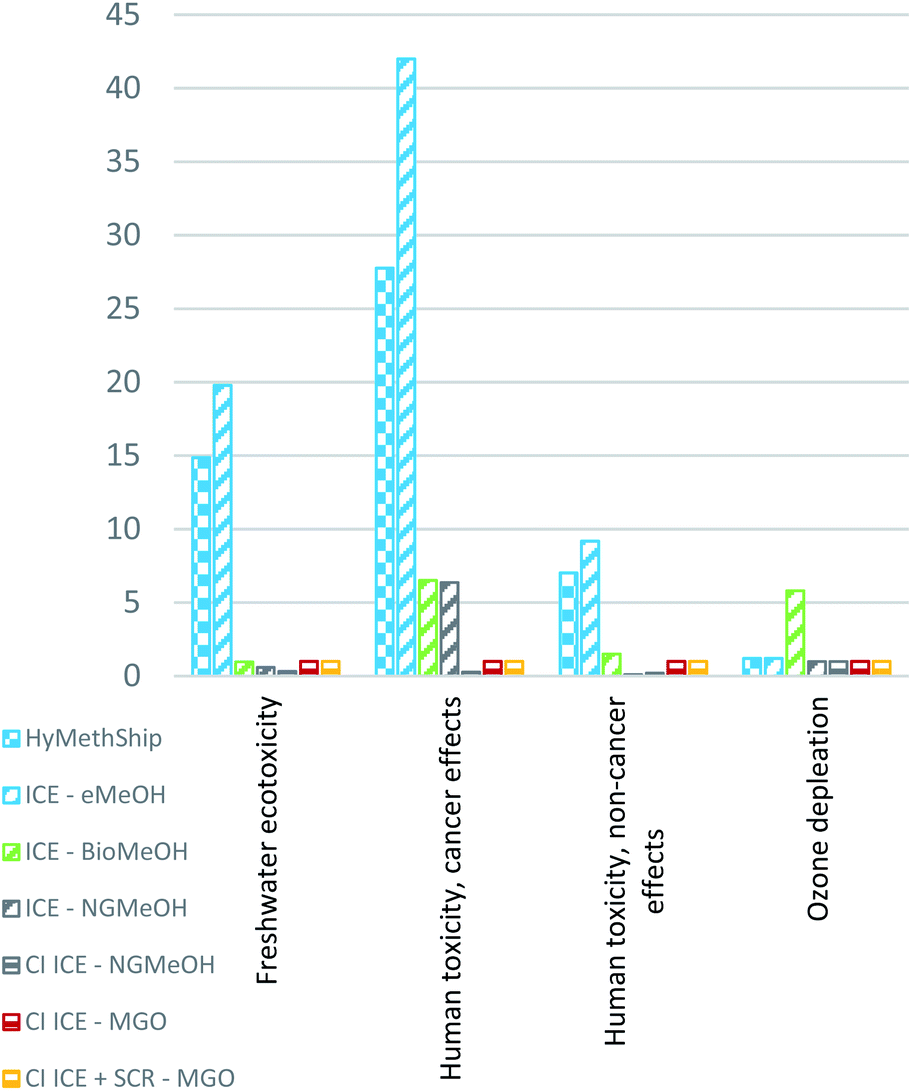 | ||
| Fig. 7 Life cycle assessment results for freshwater ecotoxicity, human toxicity cancer effects, human toxicity non-cancer effects, ozone depletion. Results normalized per CI ICE using MGO and presented per round trip between Gothenburg and Kiel on a RoPax vessel. The y-axel indicates the same values for both sides of the graph, where 1 = CI ICE–MGO. | ||
The three impact categories where the HyMethShip concept contributes to more than five times that of ICE using MGO are “human toxicity, cancer effects”, “human toxicity, non-cancer effects” and “freshwater ecotoxicity”. The main influencing emissions are only accounted for in the background data set, and as the BioMeOH and fossil fuel concept require less electricity per unit fuel produced they are unlikely to influence these pathways. Today's state of the art technology for renewable electricity requires more building materials, such as steel, per produced energy unit compared to oil or nuclear options. This additional material requirements appears to be the main emissions source driving these results. All concepts have a similar magnitude of impact if no background data is incorporated in the results.
In five impact categories (Acidification, Eutrophication, Ozone depletion, Particulate matter, and Terrestrial eutrophication) the bio-methanol based concept has a higher impact than the electro-methanol and fossil-methanol counterparts (see Fig. 8). The eMeOH and NGMeOH concepts shows a similar level of impacts in these categories. Most of the emissions related to the impact categories occurs in the combustion phases (which are equal for all fuel pathways), but for the eMeOH and NGMeOH no other significant emission sources can be found in other parts of the fuel life cycle. For BioMeOH additional emissions hotspots can be identified: the main influencing emission on ozone depletion is N2O from the biomass cultivation, which only occurs in BioMeOH production For the other four categories the ICE–BioMeOH concept is influenced by the electricity grid mix used in the biogenic methanol production. The European electricity mix contains fossil-based energy, which contributes significantly to acidification, PM and eutrophication.68 The BioMeOH production is assumed to be located across Europe due to production constrains whereas eMeOH can be produced at the harbor, due to land use requirements for biogenic methanol production. These results are in line with earlier work on biofuels in the shipping sector.13,101 Between 5 and 16% of the total environmental impact for the ICE–BioMeOH concept in the acidification, marine eutrophication and particulate matter categories originate from cultivation and treatment processes.
 | ||
| Fig. 8 Impact on acidification, eutrophication, ozone depletion, particulate matter, and terrestrial eutrophication from the HyMethShip and SI ICE concepts. Presented per round trip between Gothenburg and Kiel on a RoPax vessel. Normalized per impact from CI ICE propelled with MGO. | ||
5.3. Sensitivity analysis
Some of the technologies included in the LCA are under rapid development or are expected to be optimized further in the coming years.102Fig. 9 shows that besides the wind power-based scenario and nuclear scenario all electricity generators fall out as the worst option in one or more of the impact categories and the most beneficial option varies between impact categories. This is in line with results from previous studies on electro-fuels.53,57–61 No direct comparison of how large this reduction is can be done, as the degree of reduction depends on the system boundaries of the assessment.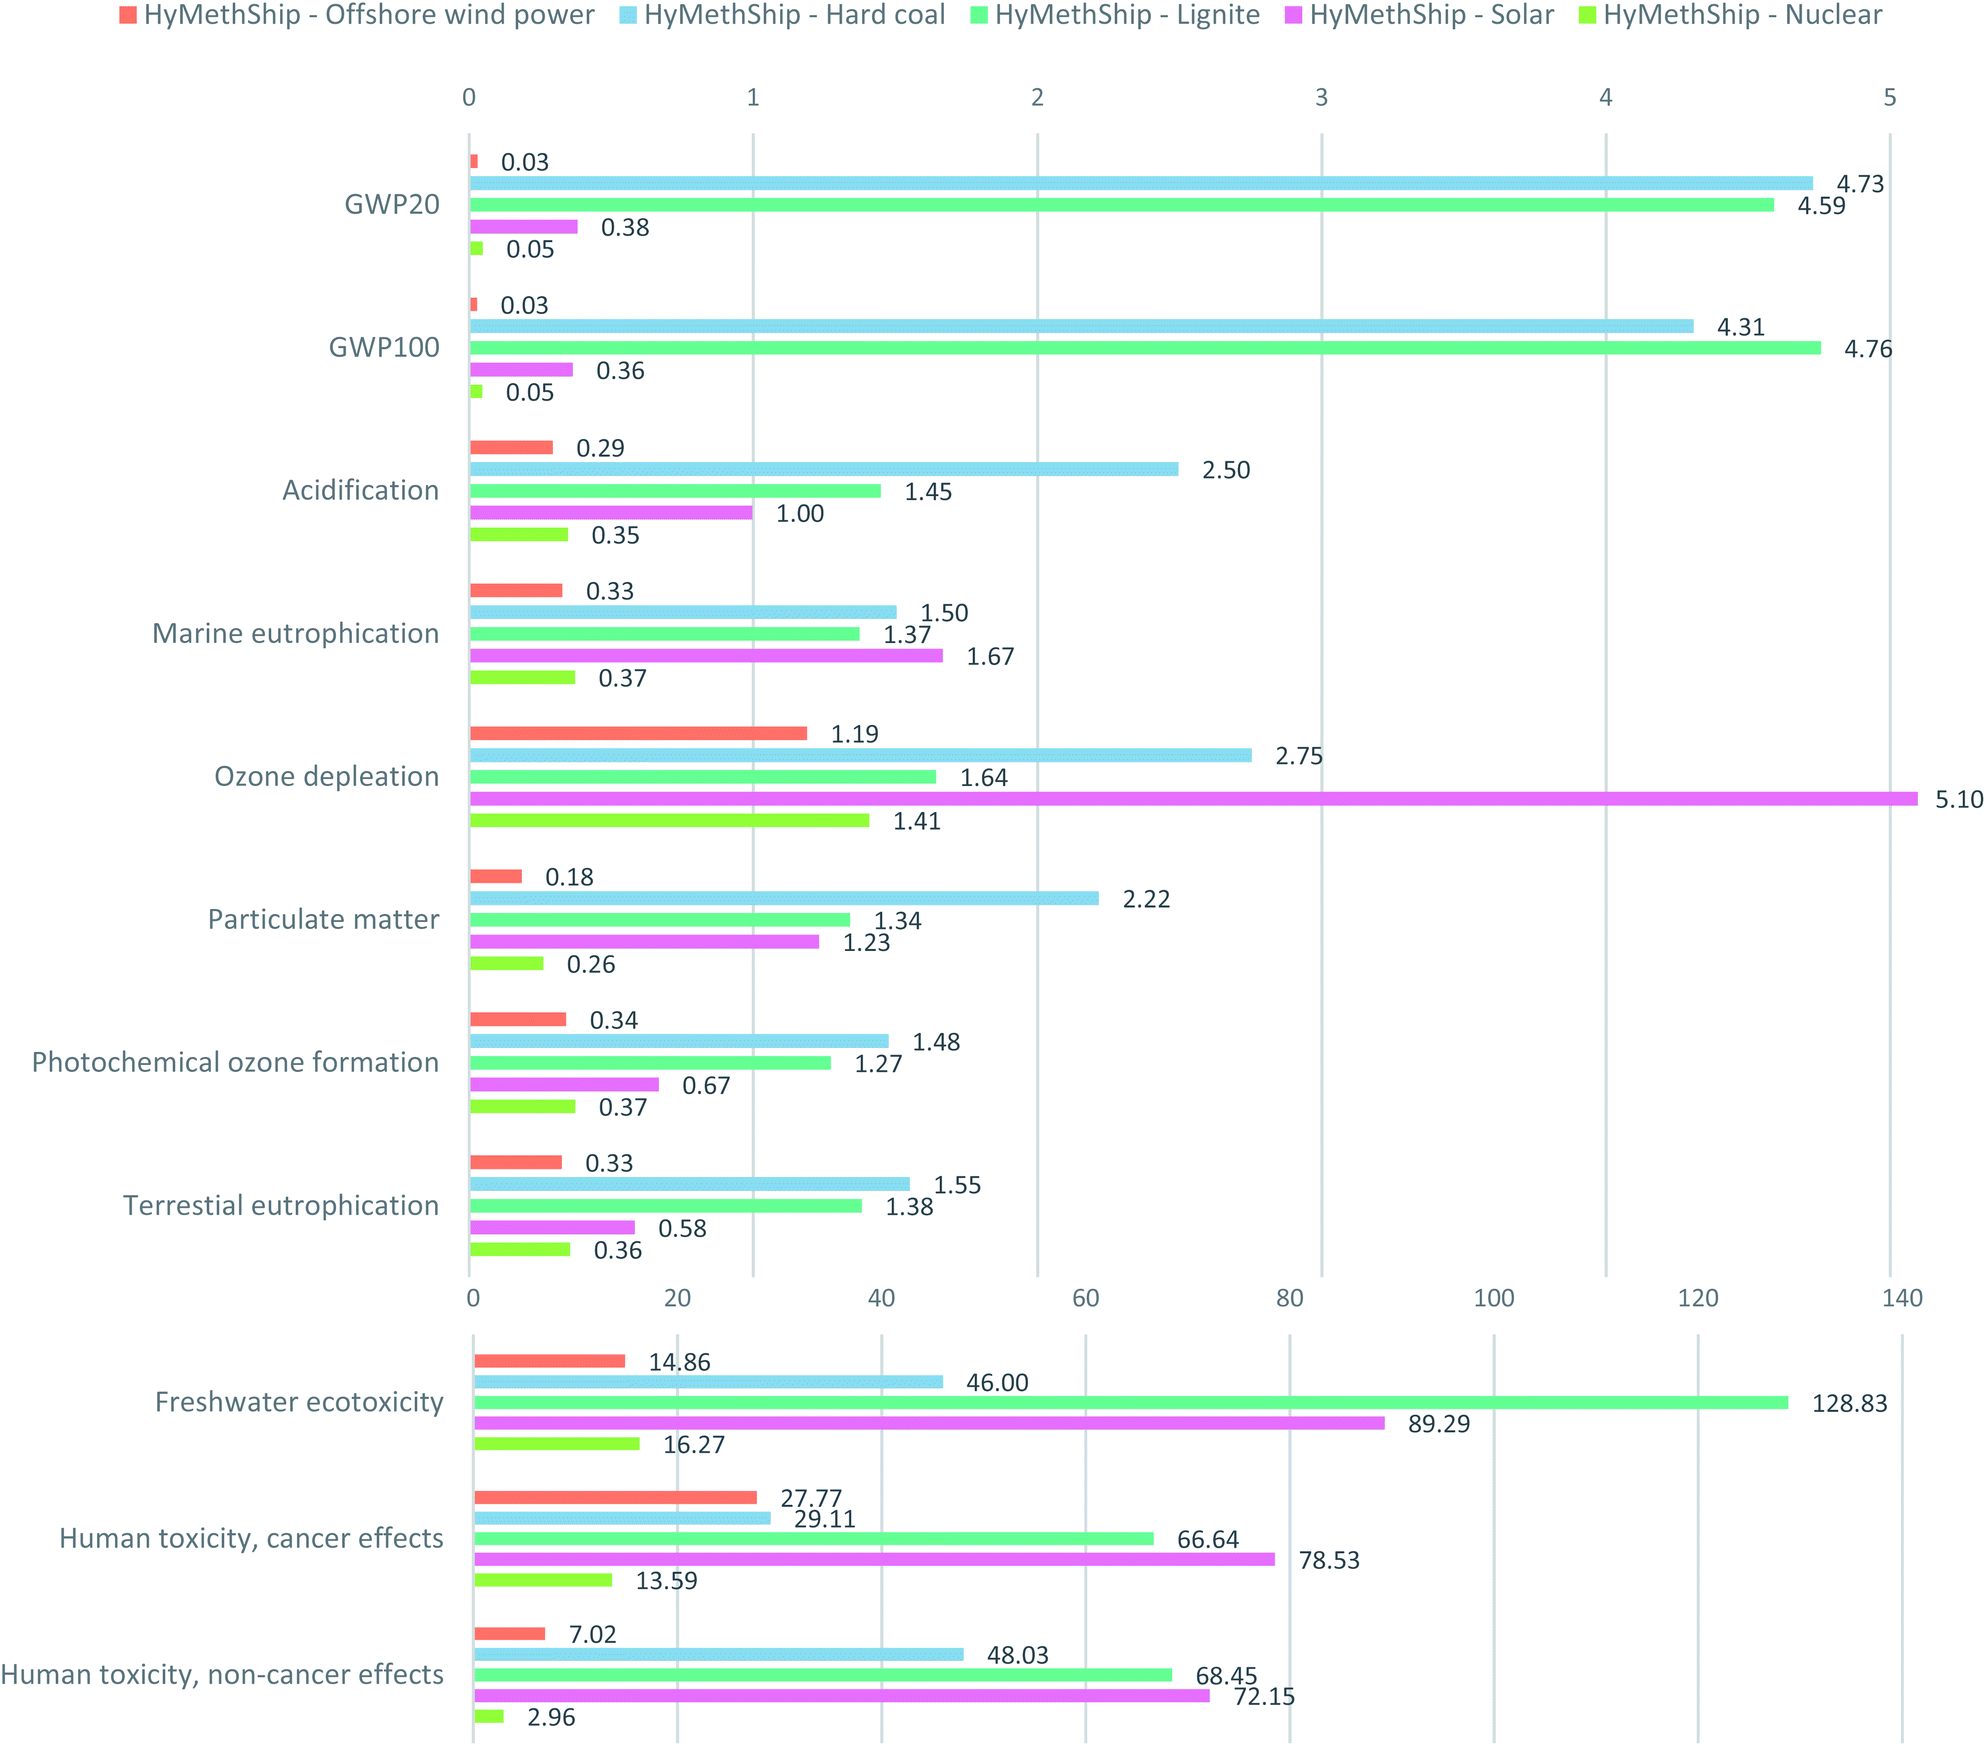 | ||
| Fig. 9 Sensitivity analysis of applying various electricity sources in the electro-methanol production. Presented per round trip between Gothenburg and Kiel on a RoPax vessel using the HyMethShip concept. Results normalized per impact from CI ICE propelled with MGO. Data from NEEDs data set based on today's technologies. | ||
The results of the Monte Carlo simulation (2) show that the uncertainties of the parameters presented in Table 4 has an impact on all impact categories (for full results see Fig. S3 in the ESI†). However, the results do not change the relationship between todays fossil fuel option and the HyMethShip case in any of them. The results of sensitivity analysis (3) show a lower impact from using the HyMethShip system regardless of the initial raw material used for fuel production. This indicate that the onboard carbon capture system as such is beneficial rather than in combination with electro-methanol. When further known metal emissions from combusting MGO in an engine (4) are included in the LCI the results the toxicity impact increases. For human toxicity, non-cancerous effects the difference between the CI ICE-MGO concept and the HyMethShip concept is reduced significantly (see Fig. S10 in the ESI†) and for the freshwater ecotoxicity the relationship between the categories changes, but the same impact is not seen for the human toxicity caner effects. This indicates that the indicated trade-off might be relevant also when more emissions are included. Currently no available data on metal content of eMeOH, BioMeOH, and NGMeOH was found in the scientific literature and emissions to air of metals from the exhaust gas etc. could therefore not be included in this study.
6. Discussion
The results of this paper indicate that using the “Hydrogen-Methanol Ship propulsion system with onboard pre-combustion carbon capture” concept on a RoPax vessel might lead to lower greenhouse gas emissions, acidification, particulate matter impacts, marine and terrestrial eutrophication, and photochemical ozone depletion compared to today's conventional propulsion technologies. However, the work presented here is a prospective LCA based on a technology in its early design phase. The HyMethShip concept is in an early stage of its development and technical decisions on design and functionality are still being made. The results therefore include large uncertainties and one purpose of the work is to inform the developers about important processes and other interest of the potential implications of the technology.In development processes decisions are consciously taken on how to design the technology.103 Initially few choices have been made and a lot of design freedom remains, however as the technology matures fewer decisions can be changed without stepping back in the design process.104 This duality creates a scenario where information required to perform a full LCA is available at later stages in the design process, while decisions made early could be optimized for higher environmental performance if information on what would affect this were available.52 The study was therefor designed to inform on early decision-making, and whether the concept is of further interest to the maritime community. This initial assessment shows that there is potential for the system to be competitive regarding environmental performance compared to ICE options and gives an insight to which design measure that could improve this further. One such conclusion is the impact of NOx emissions from the H2 combustion in the ICE. Health impacts from NOx and particulates (soot) have been in focus in discussion on health impacts from shipping.32 Achieving low NOx emissions leads to lower overall impact on a system level in several impact categories and the amount of emitted NOx is in part a result of the engine design. The high impact from NOx on particulate matter is in line with results presented by Deutz et al.,53 however, they assessed diesel options in the land vehicle fleet. Marine engines have overall higher emissions of NOx than engines used in other transport modes.
The limited life cycle inventory data is a limitation of this study. If more data on emissions from the life cycle are included the robustness of the study would increase. However, emission measurements are often limited due to time and cost restrictions. We have chosen to include categories where we find that the emissions data available can give an indication of the impact from the scenarios. The data used in this assessment is based on state of the art for emission measurements from engines and the scope is mainly limited based on emissions measured at the tail pipe. This leads to most robust results in some impact categories, such as climate change, but less certain results for toxicity. Including all emissions affecting all impact categories could change the results presented in this study, but this not currently possible due to limited access to data.
We have in this assessment shown that the HyMethShip concept could lead to lower impact on particulate matter, but the results also indicate that human toxicity impacts might increase as a trade-off. However, as the characterization factors for metals are considered highly uncertain105 this is not fully established. To investigate the impact on toxicity further the scope of the study should be broadened to also include infrastructure as toxic material are potentially used in several steps in the electro-fuel production, such as the electrolyzer,106 and development of more robust characterization factors is likely needed.
If the HyMethShip technology is used at a large scale some further issues arise. It might not be sustainable to build electro-methanol production plants in every harbor, but this could decrease the dependency on oil and the local product might have geopolitical benefits in some regions. The technology also has a limited range of operations, as the energy density of the fuel is lower than today's MGO and HFO. However, this limitation is not as strict as for other alternative technologies such as battery electric propulsion. Carbon sources should not be a limiting factor if HyMethShip circular carbon loop concept is used. The increased electricity need might become a technical issue as well as have high spatial requirements, but the effect of this will depend on each production site. We have not in this LCA identified any increased impact on the environment if the HyMethShip concept where to be used at an extensive scale besides additional emissions from construction of new power plants, but other alternative technologies might be preferable.
To decarbonize the shipping industry radical technology shifts are likely required,17 and the HyMethShip concept is not the only emerging maritime propulsion technology. Electrification mitigates energy losses from conversion from electricity to fuel and from fuel to engine power, and emissions from the combustion phase are bypassed entirely by technologies such as hydrogen fuel cells. As this paper aims at assessing if HyMethShip could lower the emission levels compared to established technologies, comparisons with future technologies are outside the current scope. However, as we conclude that the HyMethShip concept could lead to lower emissions, further research comparing the concept to other emerging technologies is of interest. However, this comparison should include a broader scope of emissions, include infrastructure and manufacturing of the vessel, and assess several impact categories as there might be trade-offs between health and environmental impacts.
7. Conclusions
The results show that use of the onboard carbon capture concept HyMethShip has the potential to reduce environmental impacts. The HyMethShip concept can, under the conditions established in this study, lead to reduced acidification by 92%, climate change (GWP20, GWP100) by 98%, marine eutrophication by 93%, particulate matter by 88%, photochemical ozone formation by 92%, and terrestrial eutrophication by 90% compared to ICE using marine gas oil, as well as reductions compared to ICEs using methanol. Low NOx emissions from the ICE and use of renewable energy is important factors to reach lowered impacts. Minimizing leakage of methanol to the environment is also relevant, as well as efficient processes in the fuel production.All investigated toxicity impact categories show relatively high impact from the HyMethShip concept. This is due to emissions from electricity used in the fuel production. We need more detailed information on emissions of metals and other toxic substances to show if this is the case over the full life cycle. This data is currently lacking in the literature. The electricity sources in the fuel production is shown to impact the result for all impact categories investigated.
Author contributions
Elin Malmgren, writing – original draft, methodology, formal analysis. Selma Brynolf, conceptualization, funding acquisition, writing – review & editing; Erik Fridell, writing – review & editing, supervision; Maria Grahn, writing – review & editing, supervision; Karin Andersson, conceptualization, funding acquisition.Conflicts of interest
There are no conflicts to declare.Acknowledgements
The Life Cycle Assessment was carried out in the frame of the research project HyMethShip. We acknowledge the funding provided by the European Union's Horizon 2020 research and innovation program under grant agreement no. 768945.Notes and references
- M. Stopford, Maritime economics, Routledge, Abingdon, Oxon, 3rd edn, 2009 Search PubMed.
- UNCTAD, Review of maritime transport, United Nations, 300 East 42nd Street, New York, New York 10017, United States of America, 2018 Search PubMed.
- W. P. Smith, J. P. Jalkanen, B. Anderson, J. J. Corbett, J. Faber, S. Hanayama, E. O'Keeffe, S. Parker, L. Johansson, L. Aldous, C. Raucci, M. Traut, S. Ettinger, D. Nelissen, D. S. Lee, S. Ng, A. Agrawal, J. J. Winebrake, M. Hoen, S. Chesworth and A. Pandey, Third IMO GHG Study 2014, International maritime organization (IMO), London, UK, 2015 Search PubMed.
- N. Olmer, B. Comer, B. Roy, X. Mao and D. Rutherford, Greenhouse gas emissions from global shipping, 2013–2015, International Council on Clean Transportation, Washington, USA, 2017 Search PubMed.
- K. Andersson, F. Baldi, S. Brynolf, J. F. Lindgren, L. Granhag and E. Svensson, in Shipping and the environment, ed. K. Andersson, S. Brynolf, J. F. Lindgren and M. Wilewska-Bien, Springer-Verlag, Berlin Heidelberg, 2016, vol. 11, ch. 1, pp. 3–27 Search PubMed.
- K. Capaldo, J. J. Corbett, P. Kasibhatla, P. Fischbeck and S. N. Pandis, Nature, 1999, 400, 743–746 CrossRef CAS.
- O. Endresen, E. Sorgard, J. K. Sundet, S. B. Dalsoren, I. S. A. Isaksen, T. F. Berglen and G. Gravir, J. Geophys. Res.: Atmos., 2003, 108, 4560 CrossRef.
- V. Eyring, H. W. Kohler, J. van Aardenne and A. Lauer, J. Geophys. Res.: Atmos., 2005, 110, D17306 CrossRef.
- M. G. Lawrence and P. J. Crutzen, Nature, 1999, 402, 167–170 CrossRef CAS.
- D. R. Turner, I. M. Hassellov, E. Ytreberg and A. Rutgersson, Elementa: Science of the Anthropocene, 2017, 5, 45 Search PubMed.
- O. Endresen, E. Sorgard, H. L. Behrens, P. O. Brett and I. S. A. Isaksen, J. Geophys. Res.: Atmos., 2007, 112, D12301 CrossRef.
- Ø. Buhaug, J. J. Corbett, Ø. Endresen, V. Eyring, J. Faber, S. Hanayama, D. S. Lee, D. Lee, H. Lindstad, A. Z. Markowska, A. Mjelde, D. Nelissen, J. Nilsen, C. Pålsson, J. J. Winebrake, W. Wu and K. Yoshida, Second IMO GHG Study 2009, International Maritime Organization (IMO), London, UK, 2009 Search PubMed.
- S. Brynolf, E. Fridell and K. Andersson, J. Cleaner Prod., 2014, 74, 86–95 CrossRef CAS.
- M. Taljegard, S. Brynolf, M. Grahn, K. Andersson and H. Johnson, Environ. Sci. Technol., 2014, 48, 12986–12993 CrossRef CAS PubMed.
- S. Horvath, M. Fasihi and C. Breyer, Energy Convers. Manage., 2018, 164, 230–241 CrossRef.
- J. J. Faber, S. Hanayama, S. Zhang, P. Pereda, B. Comer, E. Hauerhof, W. Schim van der Loeff , T. Smith, Y. Zhang, H. Kosaka, M.i Adachi, J.-M. Bonello, C. Galbraith, Z. Gong, K. Hirata, D. Hummels, A. Kleijn, D. S. Lee, Y. Liu, A. Lucchesi, X. Mao, E. Muraoka, L. Osipova, H. Qian, D. Rutherford, S. Suárez de la Fuente, H. Yuan, C. Velandia Perico, L. Wu, D. Sun, D.-H- Yoo and H. Xi, Fourth IMO GHG Study, CE Delft, Delft, 2020 Search PubMed.
- P. Balcombe, J. Brierley, C. Lewis, L. Skatvedt, J. Speirs, A. Hawkes and I. Staffell, Energy Convers. Manage., 2019, 182, 72–88 CrossRef CAS.
- H. H. Ross and O. Schinas, Ocean Eng., 2019, 190, 106403 CrossRef.
- Z. Wan, A. el Makhloufi, Y. Chen and J. Y. Tang, Mar. Pollut. Bull., 2018, 126, 428–435 CrossRef CAS PubMed.
- A. Accetta, M. C. Di Piazza, G. La Tona, M. Luna and M. Pucci, 2018 Ieee International Conference on Electrical Systems for Aircraft, Railway, Ship Propulsion and Road Vehicles & International Transportation Electrification Conference (Esars-Itec), 2018 Search PubMed.
- S. Gharbi, C. Zaoui, H. Bouaicha, S. Nejim and H. Dallagi, 2018 International Conference on Advanced Systems and Electrical Technologies (Ic_Aset), 2017, pp. 241–248 Search PubMed.
- J. Y. Zhu, L. Chen, L. J. Xia and B. Wang, Energy, 2019, 177, 247–261 CrossRef.
- R. A. Evrin and I. Dincer, Int. J. Hydrogen Energy, 2019, 44, 6919–6928 CrossRef CAS.
- C. Ghenai, M. Bettayeb, B. Brdjanin and A. K. Hamid, Case Studies in Thermal Engineering, 2019, 14, 100497 CrossRef.
- S. Jafarzadeh and I. Schjolberg, Proceedings of the Asme 36th International Conference on Ocean, Offshore and Arctic Engineering, 2017, 2017, vol. 10 Search PubMed.
- G. Roh, H. Kim, H. Jeon and K. Yoon, Journal of Marine Science and Engineering, 2019, 7, 230 CrossRef.
- H. A. Daggash, C. F. Patzschke, C. F. Heuberger, L. Zhu, K. Hellgardt, P. S. Fennell, A. N. Bhave, A. Bardow and N. Mac Dowell, Sustainable Energy Fuels, 2018, 2, 1153–1169 RSC.
- J. Gibbins and H. Chalmers, Energy Policy, 2008, 36, 4317–4322 CrossRef.
- B. Maher, Glob Policy, 2018, 9, 102–106 CrossRef.
- N. R. Ammar, Transportation Research Part D Transport and Environment, 2019, 69, 66–76 CrossRef.
- R. Radonja, D. Bebic and D. Glujic, Promet-Zagreb, 2019, 31, 321–327 CrossRef.
- M. Sofiev, J. J. Winebrake, L. Johansson, E. W. Carr, M. Prank, J. Soares, J. Vira, R. Kouznetsov, J. P. Jalkanen and J. J. Corbett, Nat. Commun., 2018, 9, 406 CrossRef PubMed.
- S. Brynolf, M. Taljegard, M. Grahn and J. Hansson, Renewable Sustainable Energy Rev., 2018, 81, 1887–1905 CrossRef.
- F. Baldi, A. Azzi and F. Marechal, Comput.-Aided Chem. Eng., 2019, 46, 1747–1752 CAS.
- I. J. S. Veldhuis, R. N. Richardson and H. B. J. Stone, Int. J. Hydrogen Energy, 2007, 32(13), 2553–2566 CrossRef CAS.
- F. Ballini, A. I. Olcer, J. Brandt and D. Neumann, Ocean Eng, 2017, 146, 477–485 CrossRef.
- M. Bentin, S. Kotzur, M. Schlaak, D. Zastrau and D. Freye, International Journal of Maritime Engineering, 2018, 160, 1–10 Search PubMed.
- G. Clodic, A. Babarit and J. C. Gilloteaux, Proceedings of the Asme 1st Internnational Oddshore Wind Technical Conference, 2018, 2019 Search PubMed.
- A. Lele and K. V. S. Rao, Ieee International Conference on Emerging Technological Trends in Computing, Communications and Electrical Engineering (Icett), 2016 Search PubMed.
- G. Rutkowski, Transnav, 2016, 10, 627–632 Search PubMed.
- S. Frigo and R. Gentili, Int J Hydrogen Energ, 2013, 38, 1607–1615 CrossRef CAS.
- K. Hacatoglu, M. A. Rosen and I. Dincer, Int J Hydrogen Energ, 2012, 37, 9933–9940 CrossRef CAS.
- Y. Bicer and I. Dincer, Int J Hydrogen Energ, 2018, 43, 4583–4596 CrossRef CAS.
- F. Dawood, M. Anda and G. M. Shafiullah, Int J Hydrogen Energ, 2020, 45, 3847–3869 CrossRef CAS.
- M. Svanberg, J. Ellis, J. Lundgren and I. Landalv, Renewable Sustainable Energy Rev., 2018, 94, 1217–1228 CrossRef CAS.
- G. A. Olah, A. Goeppert and G. K. Surya Prakash, Beyond oil and gas: The Methanol Economy, WILEY-VCH Verlag GmbH & Co, Weinheim, 2nd edn, 2012 Search PubMed.
- J. Ellis and K. Tanneberger, Study on the use of ethyl and methyl alcohol as alternative fuels in shipping, 2015 Search PubMed.
- N. Wermutha, J. Zelenkaa, P. Moeyaertb, A. Aulc, M. Borgh, Presented in part at the Transport Research Arena 2020, Helsinki, Finland, conference cancelled, 2020 Search PubMed.
- H. Baumann and A.-M. Tillman, The hitch hiker's guide to LCA, Studentlitteratur, Lund, 2004 Search PubMed.
- M. A. Curran, B. W. Vigon, D. A. Tolle, B. W. Cornaby, H. C. Latham, C. L. Harrison, T. L. Boguski, R. G. Hunt and J. D. Sellers, Life-cycle assessment: Inventory guidelines and principles, Report EPA/600/R-92/245, Environmental Protection Agency, Cincinnati, Ohio, USA, 1993 Search PubMed.
- G. Finnveden, M. Z. Hauschild, T. Ekvall, J. Guinee, R. Heijungs, S. Hellweg, A. Koehler, D. Pennington and S. Suh, J. Environ. Manage., 2009, 91, 1–21 CrossRef PubMed.
- R. Arvidsson, A. M. Tillman, B. A. Sanden, M. Janssen, A. Nordelof, D. Kushnir and S. Molander, J. Ind. Ecol., 2018, 22, 1286–1294 CrossRef CAS.
- S. Deutz, D. Bongartz, B. Heuser, A. Kätelhön, L. Schulze Langenhorst, A. Omari, M. Walters, J. Klankermayer, W. Leitner, A. Mitsos, S. Pischinger and A. Bardow, Energy Environ. Sci., 2018, 11, 331–343 RSC.
- K. Tschiggerl, C. Sledz and M. Topic, Energy, 2018, 160, 1091–1100 CrossRef.
- X. Zhang, C. Bauer, C. L. Mutel and K. Volkart, Appl. Energy, 2017, 190, 326–338 CrossRef CAS.
- P. Biernacki, T. Röther, W. Paul, P. Werner and S. Steinigeweg, J. Cleaner Prod., 2018, 191, 87–98 CrossRef CAS.
- J. Artz, T. E. Muller, K. Thenert, J. Kleinekorte, R. Meys, A. Sternberg, A. Bardow and W. Leitner, Chem. Rev., 2018, 118, 434–504 CrossRef CAS PubMed.
- R. Cuéllar-Franca, P. García-Gutiérrez, I. Dimitriou, R. H. Elder, R. W. K. Allen and A. Azapagic, Appl. Energy, 2019, 253, 113560 CrossRef.
- C. Fernández-Dacosta, L. Shen, W. Schakel, A. Ramirez and G. J. Kramer, Appl. Energy, 2019, 236, 590–606 CrossRef.
- M. Kim, K. Kim, T.-h. Kim and J. Kim, Chem. Eng. Res. Des., 2019, 147, 200–213 CrossRef CAS.
- S. McDonagh, P. Deane, K. Rajendran and J. D. Murphy, Appl. Energy, 2019, 247, 716–730 CrossRef.
- S. Bengtsson, K. Andersson and E. Fridell, Proc. IME M J. Eng. Marit. Environ., 2011, 225, 97–110 Search PubMed.
- I. I. O. f. Standardization, Journal, 2006.
- N. von der Assen, J. Jung and A. Bardow, Energ Environ Sci, 2013, 6, 2721–2734 RSC.
- L. J. Muller, A. Katelhon, M. Bachmann, A. Zimmermann, A. Sternberg and A. Bardow, Front Energy Res, 2020, 8, 15 CrossRef.
- A. B. Heinrich, Int. J. Life Cycle Assess., 2010, 15, 524–525 CrossRef.
- MEPC, Journal, 2014.
- ELCD, Journal, 2009.
- IPCC, Climate Change 2013: The Physical Science Basis. Contribution of Working Group I to the Fifth Assessment Report of the Intergovernmental Panel on Climate Changes Report 978-1-107-05799-1, Intergovernmental Panel on Climate Change, Cambridge University Press, Cambridge, United Kingdom and New York, NY, USA, 2013 Search PubMed.
- E. Fridell, S. Backstrom and H. Stripple, Transportation Research Part D Transport and Environment, 2019, 69, 346–363 CrossRef.
- V. Eyring, I. S. A. Isaksen, T. Berntsen, W. J. Collins, J. J. Corbett, O. Endresen, R. G. Grainger, J. Moldanova, H. Schlager and D. S. Stevenson, Atmos. Environ., 2010, 44, 4735–4771 CrossRef CAS.
- J. J. Corbett and H. W. Koehler, J. Geophys. Res., 2003, 108(D20) DOI:10.1029/2003JD003751.
- H. Agrawal, W. A. Welch, J. W. Miller and D. R. Cocker, Environ. Sci. Technol., 2008, 42, 7098–7103 CrossRef CAS PubMed.
- R. Heijungs, Int. J. Life Cycle Assess., 2019, 25, 394–402 CrossRef.
- B. A. Sanden and M. Karlstrom, J. Cleaner Prod., 2007, 15, 1469–1481 CrossRef.
- E. S. Sanz-Perez, C. R. Murdock, S. A. Didas and C. W. Jones, Chem. Rev., 2016, 116, 11840–11876 CrossRef CAS PubMed.
- A. Al-Mamoori, A. Krishnamurthy, A. A. Rownaghi and F. Rezaei, Energy Technol., 2017, 5, 834–849 CrossRef.
- E. I. Koytsoumpa, C. Bergins and E. Kakaras, J. Supercrit. Fluids, 2018, 132, 3–16 CrossRef CAS.
- A. A. Kiss, J. J. Pragt, H. J. Vos, G. Bargeman and M. T. de Groot, Chem. Eng. J., 2016, 284, 260–269 CrossRef CAS.
- C. van der Giesen, R. Kleijn and G. J. Kramer, Environ. Sci. Technol., 2014, 48, 7111–7121 CrossRef CAS PubMed.
- I. Staffell, D. Scamman, A. V. Abad, P. Balcombe, P. E. Dodds, P. Ekins, N. Shah and K. R. Ward, Energy Environ. Sci., 2019, 12, 463–491 RSC.
- M. Berglund and P. Borjesson, Biomass Bioenergy, 2006, 30, 254–266 CrossRef.
- CPM, SPINE LCI dataset: Production of methanol using energy forest, accessed 01-17, 2020.
- R. T. Bhandari, A. Clemens and P. Zapp, J. Cleaner Prod., 2014, 151–163 CrossRef CAS.
- M. Fasihi, O. Efimova and C. Breyer, J. Cleaner Prod., 2019, 224, 957–980 CrossRef CAS.
- R.-M. Rytter, L. Rytter and L. Högbom, Biomass Bioenergy, 2015, 83, 483–492 CrossRef.
- D. Cooper and T. Gustafsson, Methodology for calculating emissions from ships: 2. Emission factors for 2004 reporting, SMHI Swedish Meteorological and Hydrological Institute, Folkborgsvägen, Norrköping, Sweden, 2004, vol. 1, p. 76 Search PubMed.
- J. J. Corbett, H. F. Wang and J. J. Winebrake, Transportation Research Part D Transport and Environment, 2009, 14, 593–598 CrossRef.
- F. Baldi, F. Ahlgren, T. V. Nguyen, M. Thern and K. Andersson, Energies, 2018, 11, 2508 CrossRef.
- A. A. Safaei, H. Ghassemi and M. Ghiasi, Cogent Eng., 2019, 6, 012027 Search PubMed.
- J. P. Jalkanen, L. Johansson and J. Kukkonen, Atmos. Chem. Phys., 2016, 16, 71–84 CrossRef CAS.
- L. Goldsworthy and B. Goldsworthy, Environ. Modell. Softw., 2015, 63, 45–60 CrossRef.
- K. Andersson and H. Winnes, P I Mech Eng M-J Eng, 2011, 225, 33–42 Search PubMed.
- NEEDs, Journal, 2009.
- E. Fridell, H. Salberg and K. Salo, J. Mar. Sci. Appl., 2020 DOI:10.1007/s11804-020-00150-6.
- B. Comer, N. Olmer, X. Mao, B. Roy and D. Rutherford, Black carbon emission and fuel use in global shipping 2015, International Council on Clean Transportation, 1225 Street NW, Suite 900, Washington DC 20005, USA, 2017 Search PubMed.
- P. Molander, Field test 2 - Environmental performance, methanol engine, SSPA Sweden, Göteborg, 2017 Search PubMed.
- J. Hedberg, K. Fransson, S. Prideaux, S. Roos, C. Jonsson and I. O. Wallinder, Sustainability-Basel, 2019, 11 DOI:10.1002/14356007.a16_465.pub2.
- E. Fiedler, G. Grossman, D. Burkhard Kersebohn, G. Weiss and C. Witte, Ullman's Encyclopedia of Industrial Chemistry, Wiley-VCH, Weinheim, 2011 Search PubMed.
- A. Repo, K. Eyvindson, P. Halme and M. Mönkkönen, Can. J. For. Res., 2020, 50, 1184–1193 CrossRef.
- J. A. Ryste, M. Wold and S. Terje, Comparison of Alternative Marine Fuels, Report 2019-0567, Rev. 3, DNV GL AS Maritime Environment Advisory, Høvik, Norway, 2019 Search PubMed.
- P. A. Ostergaard, N. Duic, Y. Noorollahi, H. Mikulcic and S. Kalogirou, Renewable Energy, 2020, 146, 2430–2437 CrossRef.
- B. A. Sanden and K. M. Hillman, Resour. Policy, 2011, 40, 403–414 CrossRef.
- G. C. Unruh, Energy Policy, 2000, 28, 817–830 CrossRef.
- S. Gerbinet, F. Van Stappen, S. Belboom, E. Pezennec and A. Leonard, Mater. Tech., 2019, 107, 110 CrossRef CAS.
- D. E. Hall, J. Electrochem. Soc., 1985, 132, C41–C48 CrossRef.
- I. Ridjan, B. V. Mathiesen and D. Connolly, J. Cleaner Prod., 2016, 112, 3709–3720 CrossRef CAS.
- L. K. Rihko-Struckmann, A. Peschel, R. Hanke-Rauschenbach and K. Sundmacher, Ind. Eng. Chem. Res., 2010, 49, 11073–11078 CrossRef CAS.
Footnotes |
| † Electronic supplementary information (ESI) available. See DOI: 10.1039/d1se00105a |
| ‡ The definition of electro-fuels varies in the literature and can sometimes be referred to as synthetic fuels, power-to-gas/liquids/fuels or e-fuels.33,57,80,107,108 In this work electro-fuels are defined as any synthetic hydrocarbons produced from CO2 and water using electricity as the primary energy source. |
| § Note that during the methanol operation phase/phases no CO2 can be captured by the system. |
| This journal is © The Royal Society of Chemistry 2021 |