 Open Access Article
Creative Commons Attribution 3.0 Unported Licence
Zinc oxide-modified mordenite as an effective catalyst for the dehydrogenation of (bio)ethanol to acetaldehyde†
Samuel J.
Raynes
 and
Russell A.
Taylor
 *
*
Department of Chemistry, Durham University, South Road, Durham DH1 3LE, UK. E-mail: russell.taylor@durham.ac.uk
First published on 15th March 2021
Abstract
The direct transformation of ethanol to acetaldehyde is an important step in the cascade conversion of bioethanol to higher value chemicals and for the development of sustainable fuels. Herein, zinc oxide supported on alkali cation-exchanged mordenite (ZnO/M–MOR) prepared by a simple wetness impregnation method, is shown to be a selective and stable catalyst for the direct dehydrogenation of ethanol to acetaldehyde at 400 °C under continuous flow conditions. Through variation of the ZnO loading and the zeolite counter-cation (Na, K, Rb, Cs), an optimum catalyst material was identified, ZnO/Rb–MOR loaded at 3.5 wt% Zn. Acetaldehyde productivity (normalised to Zn) could be increased by over 80% and ethylene selectivity reduced to 0.9% through simple variation of the extra-framework alkali cation. Very low ethylene production leads to low levels of carbonaceous deposits and therefore minimal deactivation at short time on stream (<5 h). Detailed analysis of the optimized system reveals excellent selectivity and stability beyond 120 h time on stream, resulting in an average acetaldehyde productivity of 16 mmol gcat−1 h−1 and overall acetaldehyde selectivity of 90% whilst operating at an ethanol conversion level of 40%. Additionally, the use of a zeolite support is shown to greatly improving the usage efficiency of Zn atoms by virtue of an acetaldehyde productivity increase from 20 to 48 mmol mmolZn−1 h−1 for unsupported and supported ZnO, respectively. The new catalyst system shows that ZnO can be tuned to give very low ethylene selectivity and extended lifetimes in ethanol dehydrogenation to acetaldehyde which has not previously been reported.
1. Introduction
Bioethanol, a common biofuel, is currently produced on a large scale (28 billion gallons in 2018) by fermentation of biomass (such as corn and sugarcane) with production predominantly localized in the USA and Brazil.1 In the USA, bioethanol is produced in excess and added to inventory as demands for fuel blending and exports have already largely been met.2 The direct transformation of bioethanol into (bio)acetaldehyde and beyond could therefore prove to be a more sustainable route to many higher-value chemicals, one which utilizes an available and renewable carbon feedstock. Further, the direct transformation of bioethanol to acetaldehyde and beyond may be of industrial interest owing to its potential profitability.3Fig. 1 outlines potential routes to higher value products following production of (bio)acetaldehyde from (bio)ethanol, namely the synthesis of nbutanol4 (Guerbet reaction) and butadiene5 (Lebedev reaction), both via the aldol condensation,6,7 the synthesis of pyridine via acrolein with addition of ammonia (Chichibabin reaction),8 and the synthesis of pentaerythritol by reaction with formaldehyde.9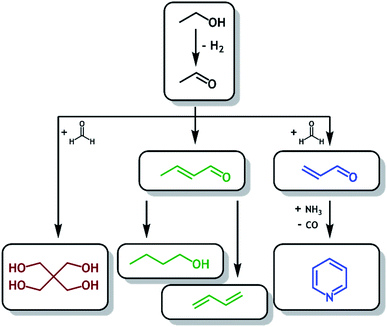 | ||
Fig. 1 Schematic routes to higher value products available following production of (bio)acetaldehyde from (bio)ethanol, such as pentaerythritol ( ), butanol and butadiene ( ), butanol and butadiene ( ) and pyridine ( ) and pyridine ( ). ). | ||
Acetaldehyde is a versatile platform chemical that can be utilized in a variety of ways to manufacture higher value chemicals. Currently, the vast majority of acetaldehyde produced industrially is formed via the oxidation of ethylene by the Wacker process which utilizes a homogeneous PdCl2/CuCl2 catalyst system.10 The process operates under moderate conditions giving 95% acetaldehyde yield for the two-stage process at 110 °C and 10 bar, although it requires substantial infrastructure investment and predominantly utilizes carbon sources that are typically produced from non-renewable and non-sustainable feedstocks.10–12 As the global market for acetaldehyde is predicted to grow to around USD 1.80 billion by 2022, meeting the demand through increased investment in expensive infrastructure and non-renewable carbon is undesirable.13,14
Current research into the transformation of ethanol to acetaldehyde is typically practiced by two distinct methods: partial oxidation of ethanol resulting in formation of acetaldehyde and water (eqn (1A)) and direct dehydrogenation of ethanol resulting in the formation of acetaldehyde and hydrogen (eqn (1B)).10
| (A) CH3CH2OH (l) + ½O2 (g) → CH3CHO (l) + H2O (l) |
| ΔrH0 = −204.8 kJ mol−1 |
| ΔrG0 = −182.4 kJ mol−1 |
| (B) CH3CH2OH (l) → CH3CHO (l) + H2 (g) |
| ΔrH0 = +81.0 kJ mol−1 |
| ΔrG0 = +54.8 kJ mol−1 |
Partial oxidation is an exothermic process and produces one equivalent of water as a by-product for each acetaldehyde equivalent. Owing to this, whilst lower reaction temperatures are typically utilized, an energy penalty is often incurred to separate the resultant water from the acetaldehyde product and unconverted ethanol if purified acetaldehyde or feed recycling are desired. One previous industrially practiced ethanol partial oxidation process, the Veba-Chemie process, operated at elevated temperature (500–650 °C) and utilized an elemental silver catalyst resulting in acetaldehyde yields of up to 99% at ethanol conversion values of 50–70%, although requiring the use of fractional distillation to purify the product stream.10,15 Academic research into ethanol partial oxidation typically focusses on the use of supported precious metals such as Pt,16,17 Pd,18 and especially Au,19–24 at lower operating temperatures of around 200 °C. However, supported precious metal catalysts may often suffer from short lifetimes due to sintering, requiring frequent regeneration.25 Further, precious metal catalysts are often seen as undesirable owing to their dwindling reserves and long-term unsustainability.
The direct dehydrogenation of ethanol is an endothermic process and is typically conducted at increased reaction temperatures when compared to the partial oxidation process. The reaction, however, produces a stoichiometric amount of hydrogen gas as a desirable and easily separated by-product that can readily be fed into the hydrogen economy, reducing reliance on the steam reforming and water–gas shift reactions for hydrogen production. Additionally, further conversion of acetaldehyde to higher-value products may require the use of hydrogen in subsequent reaction steps that can be “borrowed” from this initial dehydrogenation (such as nbutanol by the Guerbet mechanism).26 Due to the co-production of hydrogen, direct dehydrogenation of ethanol was preferred over partial oxidation in the early part of the 20th century. However, the need for frequent regeneration of the ethanol dehydrogenation catalysts (typically supported Cu based systems) pushed the partial oxidation method to be the preferred method for the production of acetaldehyde from ethanol.10 Many current systems for direct dehydrogenation of ethanol typically focus around the use of supported metal nanoparticles and metal oxides, with related emerging technologies seeking to prevent sintering and deactivation of such supported systems.27–31 In particular, zeolite and porous silica materials have become an area of considerable interest as favourable supports for metal species owing to their ability to stabilize metal ions and direct metal cluster size.24,32–36 One such example is the direct production of acetaldehyde from ethanol over Fe-exchanged mordenite (Fe–MOR) zeolites prepared by both solution-state and solid-state ion-exchange methods.36 In this report, acetaldehyde was formed with 7–25% selectivity over Fe–MOR materials at reaction temperatures between 200 to 400 °C. Notably, an acetaldehyde selectivity of 79% was reported at a reaction temperature of 100 °C over an Fe–MOR catalyst prepared by solid-sate ion-exchange, albeit at very low ethanol conversion values (0.72%). Additionally, some d-block metal-free zeolite systems have been realized as ethanol dehydrogenation catalysts.15,37 Specifically, the effect of alkaline metal activation on zeolite ultra-stable Y (USY) in the dehydrogenation of ethanol to acetaldehyde has been studied.15,38 Reaction of ethanol at 450 °C over USY treated with Na, K, Rb or Cs hydroxide demonstrated that treatment with NaOH was optimal in terms of both ethanol conversion and acetaldehyde selectivity, whilst retaining catalyst crystallinity.15
Previous unpublished work within our group has shown that the MOR framework has potential to improve the selectivity to acetaldehyde from ethanol by reducing the range of side-products in comparison to MFI and BEA frameworks, under similar reaction conditions. Hence, in this study, we have screened a large library of metal oxide species supported on sodium-form mordenite (Na–MOR) for the direct dehydrogenation of ethanol to acetaldehyde at 400 °C. Following the initial screening of metal oxides, ZnO was identified as a promising candidate to be supported on MOR. Although unsupported ZnO has been recognized as an ethanol dehydrogenation catalyst for close to a century,39–42 the benefits of a tuneable zeolite support are herein shown to be significant. Hence, we explored the effect of varying the ZnO loading and zeolite counter-cation to arrive at the optimum catalytic material in this study, ZnO/Rb–MOR-(7) with a nominal zinc content of 3.5 wt%. Variation of the zeolite counter-cation is shown to be able to enhance the acetaldehyde productivity (normalised to Zn) and minimise ethylene selectivity. Additionally, ZnO (3.5)/Rb–MOR-(7) was subjected to a long-term stability test and is shown to give reproducible performance combined with steady acetaldehyde production over 120 hours time on stream (TOS). We believe that such a catalyst may offer a robust and efficient alternative for (bio)acetaldehyde production which utilises a renewable and available carbon source.
2. Experimental
2.1. Preparation of materials
Metal modified mordenites (MxOy/Na–MOR) were prepared by a wetness impregnation of Na–MOR, (nominal Si/Al = 7, kindly donated by Clariant) with the respective metal nitrate or metal chloride solution. A calculated amount of the metal precursor (1–10 wt% by metal) was dissolved in distilled water (4 mL) before the zeolite powder (1 g) was added. The resulting suspension was then mixed thoroughly overnight. The sample was brought to dryness under reduced pressure and constant agitation, followed by further drying at 80 °C overnight and subsequent calcination at 550 °C for 5 hours using a 5 °C min−1 ramp rate under static air in a muffle furnace. K–MOR, Rb–MOR and Cs–MOR were prepared by an ion-exchange process in which the zeolite powder (1 g) was contacted with 0.3 M KNO3, RbNO3 and CsNO3 solutions respectively (100 mL ×5) in centrifuge tubes under mechanical agitation (tube roller). Each contact had a duration of approximately 1 hour. Subsequently, the materials were washed with deionized water (100 mL ×3) in a similar fashion. Centrifugation at 4500 rpm for 5.5 minutes was used to separate the zeolite powder from the exchange and washing media. Materials were then dried overnight at 80 °C and calcined at 550 °C for 5 hours using a 5 °C min−1 ramp rate under static air. Metal salts were sourced as follows and used without further purification: KNO3 (99+%, Acros Organics), RbNO3 (99.5%, Sigma Aldrich), CsNO3 (99.8%, Alfa Aesar), Zn(NO3)2·6H2O (98%, Acros Organics), Co(NO3)2·6H2O (99%, Acros Organics), Fe(NO3)3·9H2O (99%, Acros Organics), Mn(NO3)2·4H2O (97.5%, Acros Organics), CrCl3·6H2O (96%, Aldrich), AgNO3 (GPR reagent grade, BDH Chemicals), Mg(NO3)2·6H2O (ACS reagent grade, Alfa Aesar), Ga(NO3)3·H2O (99.9%, Alfa Aesar), RuCl3·H2O (95+%, Sigma Aldrich), Cu(NO3)2·3H2O (99%, Acros Organics), Pd(NO3)2·H2O (37–42% Pd basis, Fisher Scientific UK), Ni(NO3)2 (97+%, Aldrich).2.2. Characterisation of materials
Metal loadings were determined by ICP-OES analysis using a Jobin Yvon Horiba Ultima 2 instrument, with the following setup: radial torch, sequential monochromator, cyclonic spray chamber and concentric nebulizer. Zeolite materials were initially subjected to digestion in concentrated hydrofluoric acid, allowed to evaporate at 150 °C and subsequently re-dissolved in a known volume of nitric acid in order to perform ICP-OES measurements. Metal loadings determined by ED-XRF spectroscopy were acquired using a Panalytical Epsilon 1 ED-XRF spectrometer. Powder X-ray diffraction (pXRD) diffractograms were collected on a Bruker D8 Advance X-ray diffractometer with Cu Kα radiation (λ = 1.54184 Å) using a step of 0.02° over a range of 2θ = 5–70°. A knife edge was utilized for low angle scattering. pXRD samples were sieved to <177 μm (80 mesh), mounted onto either glass or silicon (9 1 1) slide holders by adhesion with petroleum jelly and rotated during data acquisition. Solid-state 27Al NMR spectra were acquired on a Varian VNMRS spectrometer operating at 104.198 MHz with a spinning rate of approx. 14 kHz. Spectra were obtained using direct excitation with a recycle delay of 0.2 s over 10![[thin space (1/6-em)]](https://www.rsc.org/images/entities/char_2009.gif) 000 scans. Spectra were referenced to an external standard of 1 M aq. Al(NO3)3 solution which was used as a primary reference (δAl = 0 ppm). Scanning Electron Microscopy (SEM) was performed on a FEI Helios Nanolab SEM operated at 5 kV. The zeolite powders were suspended in isopropyl alcohol by ultrasonic treatment for 5 min. Samples were deposited onto a silicon (1 0 0) wafer (Agar Scientific, wafer thickness: 460–530 μm, polished) and coated with 20 nm of gold using a Cressington sputter coater 108 Auto. Scanning electron microscopy-energy dispersive X-ray spectroscopy (SEM-EDS) mapping was performed on a Zeiss Sigma 300 VP SEM operated at 15 kV. The zeolite powders were first set into epoxy resin before being mechanically ground down by several micrometers and the surfaces diamond polished. Care was taken to ensure that zeolite particles were not released from the resin during the polishing process and the absence of holes was verified by microscope analysis. As the particles were randomly suspended in the resin, the grinding and polishing steps revealed inner areas of the samples.
000 scans. Spectra were referenced to an external standard of 1 M aq. Al(NO3)3 solution which was used as a primary reference (δAl = 0 ppm). Scanning Electron Microscopy (SEM) was performed on a FEI Helios Nanolab SEM operated at 5 kV. The zeolite powders were suspended in isopropyl alcohol by ultrasonic treatment for 5 min. Samples were deposited onto a silicon (1 0 0) wafer (Agar Scientific, wafer thickness: 460–530 μm, polished) and coated with 20 nm of gold using a Cressington sputter coater 108 Auto. Scanning electron microscopy-energy dispersive X-ray spectroscopy (SEM-EDS) mapping was performed on a Zeiss Sigma 300 VP SEM operated at 15 kV. The zeolite powders were first set into epoxy resin before being mechanically ground down by several micrometers and the surfaces diamond polished. Care was taken to ensure that zeolite particles were not released from the resin during the polishing process and the absence of holes was verified by microscope analysis. As the particles were randomly suspended in the resin, the grinding and polishing steps revealed inner areas of the samples.
2.3. Catalytic testing under flow conditions
Reactions under flow conditions were performed using a HEL FlowCAT flow reactor feeding ethanol (absolute, 99.8%, Fisher Scientific UK) via an Eldex Optos 1 HPLC pump. All catalysts were prepared for catalysis by first pressing at 10 tons for 30 s in an Apollo Scientific XRF die equipped with 32 mm KBX-320 pellets using a Specac hydraulic press. The pressed catalysts were then sieved between 40 to 60 mesh (420–250 μm). Catalyst beds were packed into a stainless-steel reactor with a 4 mm internal diameter and consisted of a 1.6 g SiC (technical grade, approx. 80 grit, Fisher Scientific UK) pre-bed, followed by 0.300 g of the desired catalyst diluted with 1.4 g SiC and a 2.0 g SiC post-bed. All catalysts were pre-treated first at 150 °C for 1 hour then at 400 °C for 30 minutes under flowing He or N2 (40 mL min−1) before being adjusted to the desired reaction temperature (200–400 °C). The ramping rate for each stage was 10 °C min−1. Once the desired reaction temperature was reached, the system was further purged with He or N2 for 30 minutes before ethanol flow (0.171–0.330 mmol min−1) was started, feeding via the HPLC pump. On-line product analysis was performed by GC-MS-BID (Shimadzu GC-2010 Plus) equipped with BPX90 (SGE Analytical) or RTX-VMS (Thames Restek) columns for mass spectrometry (MS) detection and a ShinCarbon ST (Thames Restek) column for barrier ionization discharge (BID) detection, further details are contained within the ESI.† In all cases, time on stream (TOS) is defined as the time since ethanol flow commenced. Ethanol conversion, carbon balance, selectivity, yield and effluent composition were calculated as shown in the ESI† using mmol min−1 of carbon as input values. A list of quantitatively calibrated compounds that were factored into calculation for each GC column is additionally provided in the ESI.† It is noted that an oscillatory and lower than expected carbon balance is reported in some experiments and is discussed in the ESI.†3. Results and discussion
3.1. Screening of a library of metal oxide species supported on Na–MOR-(7)
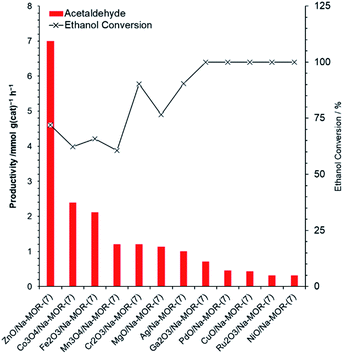
A library of metal oxide impregnated mordenite materials, MxOy/Na–MOR-(7), were prepared by a wetness impregnation method with a targeted metal loading of 3.0 wt% by metal atom. Resultant elemental compositions of the materials, as measured by ICP-OES, can be seen in Table S1.† The MxOy/Na–MOR-(7) materials were screened for ethanol conversion to acetaldehyde under continuous flow conditions at 400 °C. Acetaldehyde productivities normalized by catalyst mass (Fig. 2) and molar metal content (Fig. S2†) both show ZnO/Na–MOR-(7) to be superior in terms of acetaldehyde productivity to all other supported metal oxide species tested under these reaction conditions. ZnO/Na–MOR-(7) produced acetaldehyde as the major reaction product with ethylene as a minor product alongside low-intensity traces of diethyl ether and 1,3-butadiene. Most of the other metal oxide species predominantly produced ethylene as the major product as a result of preferential ethanol dehydration (Table S2†). The major products produced from ethanol conversion over NiO/Na–MOR-(7) and PdO/Na–MOR-(7) were CH4 and CO suggesting that acetaldehyde was formed initially but subsequently underwent rapid decarbonylation by the catalysts, a reaction observed for several homogenous Ni and Pd catalysts,43,44 alongside supported Pd clusters.27 At TOS <0.5 h an induction period in acetaldehyde productivity is observed for some of the catalysts (ZnO/Na–MOR-(7), Co3O4/Na–MOR-(7) and Fe2O3/Na–MOR-(7)), during which period ethylene is the major product (Table S2 and Fig. S3†).3.2. Stability of the ZnO/Na–MOR-(7) system
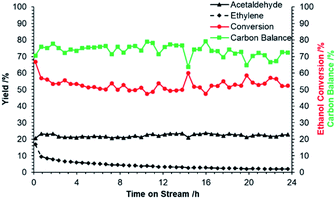
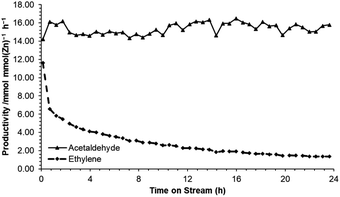
Following identification of ZnO/Na–MOR-(7) as a promising candidate for ethanol dehydrogenation, several further investigations were undertaken into long-term catalyst stability and the effect of varying ZnO loading. Initially, reaction of ethanol over ZnO/Na–MOR-(7) was monitored over a period of 24 h TOS at an ethanol flow rate of 0.171 mmol min−1. As shown in Fig. 3, ethanol conversion and carbon balance remain relatively constant at ∼50% and ∼70% respectively throughout the 24 hour runtime, implicating the longer-term stability of the catalyst. Additionally, it is observed that whilst the yield of acetaldehyde remains steady with increasing time on stream (23%), the yield of ethylene is seen to decrease rapidly and substantially from around 15% to 3%. Plotting the productivities of acetaldehyde and ethylene over time (Fig. 4) confirms this observation to be ascribed to a substantial and rapid decrease in ethylene productivity whilst acetaldehyde productivity remains constant. The cause of this decrease in ethylene productivity and resultant induction period is currently under investigation but is predicted to be the result of deactivation of an acidic or basic site inherent to either the zeolite material or ZnO particles. Low-intensity traces of diethyl ether and 1,3-butadiene were also observed in the product effluent. Hydrogen resulting from direct dehydrogenation was also detected (Fig. S1†), but not quantified.As production of anhydrous (99.8%) ethanol by azeotropic distillation is an energy intensive process, it is more desirable to feed ethanol of a lower grade in order to avoid this inefficient process. In order to assess the ability of ZnO/Na–MOR-(7) to operate with more dilute, aqueous ethanol feeds, compositions of 95% and 50% ethanol were also fed over the catalyst at 400 °C. In each case, the liquid flow rate was kept constant (0.01 mL min−1) which resulted in ethanol molar flow rates of 0.171 mmol min−1, 0.162 mmol min−1 and 0.086 mmol min−1 for anhydrous (99.8%), 95% and 50% compositions respectively. Fig. S4† shows the acetaldehyde productivity and ethanol conversion of ZnO/Na–MOR-(7) for each feed composition. Therein it is observed that the highest acetaldehyde productivity (8.0 mmol gcat−1 h−1) is observed when 95% ethanol is fed over the catalyst. Additionally, previous literature investigation of the effect of water on ethanol conversion over ZnO supports this observation, suggesting a higher extent of inhibition for ethanol dehydration in comparison to dehydrogenation.40 This is a significant benefit as 95% ethanol is a typical composition obtained following traditional fractional distillation of bio-derived ethanol and does not require the use of azeotropic distillation with entraining agents such as benzene.45
3.3. Effect of varying the ZnO loading of ZnO/Na–MOR-(7) on acetaldehyde selectivity
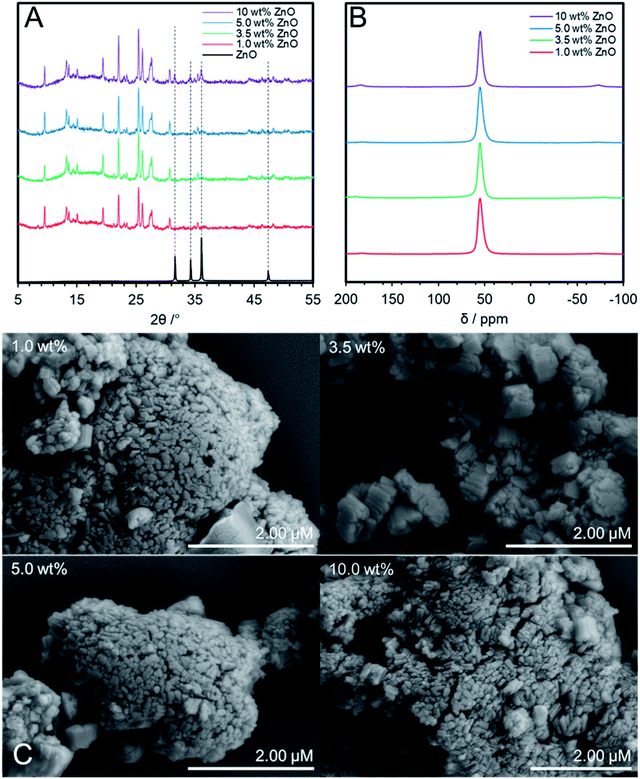
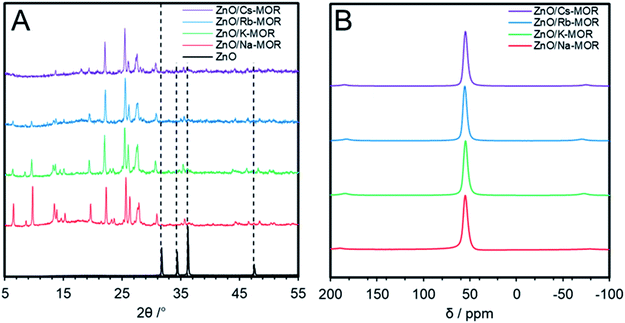
Having identified ZnO/Na–MOR-(7) as a stable and productive catalyst, optimisation of the system was undertaken with a priority of increasing acetaldehyde selectivity. During optimisation, the flow rate of ethanol during reactions was increased from 0.171 to 0.330 mmol min−1 to achieve a higher gas hourly space velocity (GHSV) and further differentiate catalyst performance at lower ethanol conversion levels. Initially, the effect of varying ZnO loading on catalytic performance was investigated. ZnO/Na–MOR-(7) catalysts were prepared by wetness impregnation with a targeted loading of 1.0, 3.5, 5.0 and 10 wt% by Zn. Elemental compositions of catalysts are detailed in Table 1, with further elemental details shown in Table S3.† In order to confirm framework retention, pXRD analysis of the variously loaded ZnO/Na–MOR-(7) materials was undertaken. As can be seen in Fig. 5A, all samples successfully retain a MOR framework type following the impregnation and calcination treatment. Additionally, it is observed that the sample loaded to 10.0 wt% Zn exhibits pXRD reflections concordant with ZnO, suggesting ZnO clusters of sufficient size to produce a pXRD response are present within this material. Fig. 5B shows the solid-state 27Al NMR spectra of each ZnO/Na–MOR-(7) material and confirms that aluminium exists solely in tetrahedral framework positions (δAl ≈ 60 ppm) therefore ruling out any effect of extra-framework alumina on catalysis.46 Further, SEM imaging of the four catalyst variations did not show evidence of any change in catalyst morphology or large ZnO clusters on the surface of the catalyst crystals (Fig. 5C). In order to further assess Zn distribution within the materials, a sample of each material was set into resin before being mechanically ground down and diamond polished and subject to SEM-EDS analysis. This preparation resulted in exposure of the crystal interiors and allowed assessment of elemental distribution within the zeolite crystals. Elemental mapping of Zn within the prepared samples showed a largely homogenous distribution throughout the newly exposed surfaces of the materials with few ZnO nanoparticles present. Those ZnO particles which were present were largest and more frequently observed for samples with higher Zn loadings (Fig. S5–S8†).| Material | Nominal Zn loading/wt% | Measured Zn loading/wt% | Na/Al ratio |
|---|---|---|---|
| Na–MOR-(7) | 0.00 | 0.00 | 1.01 |
| ZnO/Na–MOR-(7)-1.0% | 1.00 | 0.98 | 0.90 |
| ZnO/Na–MOR-(7)-3.5% | 3.50 | 3.22 | 0.90 |
| ZnO/Na–MOR-(7)-5.0% | 5.00 | 4.80 | 0.88 |
| ZnO/Na–MOR-(7)-10% | 10.00 | 9.79 | 0.91 |
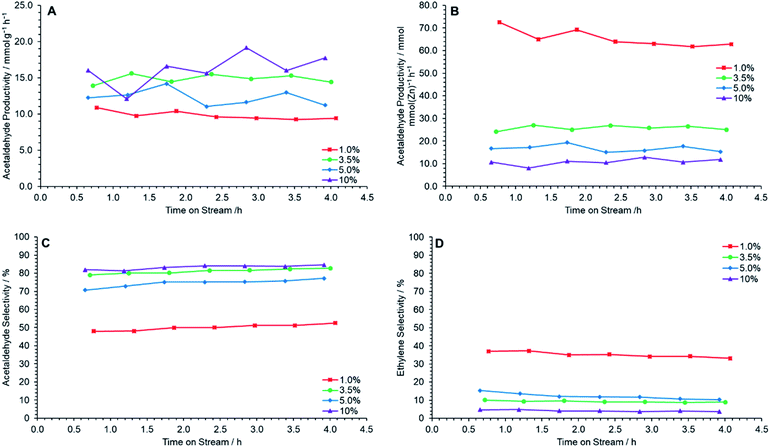
The prepared catalysts were each tested for ethanol dehydrogenation to acetaldehyde at 400 °C for 4 h TOS. Fig. 6A shows that a maximum acetaldehyde productivity is observed at 10 wt% ZnO loading, followed by 3.5 wt% Zn loading, when normalized by catalyst mass. The molar productivity of acetaldehyde per mole of ZnO, however, decreases with increased ZnO loading, suggesting that the catalytic efficiency of ZnO clusters decreases with increasing ZnO loading (Fig. 6B). This is most likely resultant from the increasing size and frequency of large ZnO clusters in higher loaded samples leading to proportionally fewer available active sites. Fig. 6D shows that ethylene selectivity decreases with increasing ZnO loading. Combined, these effects lead to the observation of a maximum acetaldehyde selectivity for ZnO/Na–MOR-(7)-10%, with ZnO/Na–MOR-(7)-3.5% performing at near identical levels (Fig. 6C). Overall, these observations show ZnO/Na–MOR-(7)-3.5% to be optimal, balancing lower metal loading and high molar productivity with low ethylene selectivity. All catalysts maintained an ethanol conversion value of around 30–50% (Fig. S9A†) at an ethanol flow rate of 0.330 mmol min−1. Additionally, a carbon balance of 80+% was observed for all reactions (Fig. S9B†). The yield of acetaldehyde was observed to be highest for ZnO/Na–MOR-(7)-3.5% and ZnO/Na–MOR-(7)-10.0% (Fig. S9C†). Further, elemental microanalysis of the spent catalyst charges showed the final C wt% value of the materials following reaction decreased with increasing ZnO loading from 5.12 wt% for ZnO/Na–MOR-(7)-1.0% to 3.02 wt% for ZnO/Na–MOR-(7)-10% (Table S4†). This trend correlates with a decreasing ethylene selectivity (Fig. 6D) for more highly loaded samples and suggests that coke deposition is likely the result of ethylene formation and subsequent aromatization as described elsewhere in the literature.47–49
3.4. Effect of varying zeolite counter-cation on acetaldehyde selectivity
In an attempt to further optimize the performance of zinc oxide impregnated mordenites in ethanol dehydrogenation, the effect of the zeolite counter-cation was investigated. The parent zeolite, Na–MOR-(7), was first exchanged to completion with metal nitrate solutions of K+, Rb+ and Cs+ before wetness impregnation with Zn(NO3)2·6H2O and subsequent calcination to afford ZnO/M–MOR-(7) with a targeted 3.5 wt% Zn where M = K, Rb, or Cs. Table 2 shows the relevant elemental ratios and compositions for ZnO/M–MOR-(7) materials; further elemental compositions of the materials obtained by ICP-OES can be seen in Table S5.† Whilst both K+ and Rb+ forms were seen to undergo complete ion-exchange, the Cs+ exchange level was not seen to rise above 79% despite further and repeated exchange treatments. It is noted that full exchange of other large pore zeolites (BEA and FAU) with Cs+ cations is often not observed, with many literature examples showing a maximum Cs+ exchange level of around 80%.50–54Fig. 7 shows the pXRD patterns (A) and 27Al solid-state NMR spectra (B) for ZnO/M–MOR-(7) materials (where M = Na, K, Rb, or Cs) indicating successful retention of both an MFI structure and tetrahedral aluminium sites following catalyst preparation, however, the low angle reflections (2θ < 15°) within Fig. 7A are decreased in intensity for ZnO/Rb–MOR-(7) and ZnO/Cs–MOR-(7). It is noted that, whilst reduced crystallinity of ZnO/Rb–MOR-(7) and ZnO/Cs–MOR-(7) cannot be ruled out, changing zeolite counter cations may have an effect on pXRD peak intensities as they are strongly determined by the electron density distribution within the zeolite unit cell. Previous publications suggest that low angle reflections are the ones most strongly affected by non-framework species in zeolites55,56 and similar observations have also been reported in the literature.57,58| Material | Zn/wt% | Na/Al | K/Al | Rb/Al | Cs/Al |
|---|---|---|---|---|---|
| ZnO/Na–MOR-(7) | 3.71 | 1.08 | n.d. | n.d. | n.d. |
| ZnO/K–MOR-(7) | 2.62 | 0.00 | 0.97 | 0.00 | 0.00 |
| ZnO/Rb–MOR-(7) | 3.12 | 0.00 | 0.00 | 1.00 | 0.00 |
| ZnO/Cs–MOR-(7) | 3.09 | 0.00 | 0.00 | 0.00 | 0.79 |
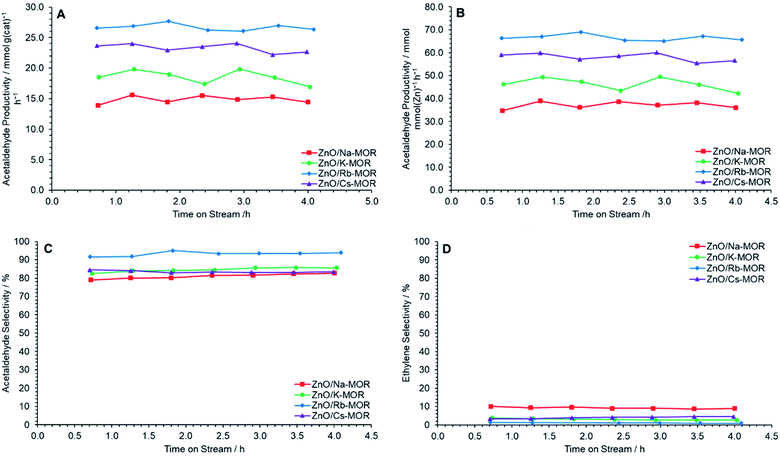
Fig. 8 shows relevant productivity and selectivity data during the conversion of ethanol to acetaldehyde over ZnO/M–MOR-(7) (M = Na, K, Rb, or Cs) materials at 400 °C for 4 h TOS. It is observed that the zeolite extra-framework cation has a significant effect on acetaldehyde productivity, with a general improvement in performance as follows: Rb+ > Cs+ > K+ > Na+. It is noted, however, that the incomplete exchange of Cs+ ions may have resulted in lower activity than if complete exchange were achieved for ZnO/Cs–MOR-(7). Fig. 8A and B show that ZnO/Rb–MOR-(7) exhibits superior acetaldehyde productivity when normalized by both mass and ZnO molar content with average values of approximately 27 mmol gcat−1 h−1 and 67 mmol mmolZnO−1 h−1 respectively. Additionally, the selectivity to ethylene, a major side product originating from ethanol dehydration is observed to be lowest for ZnO/Rb–MOR-(7) at approximately 1% (Fig. 8D). As a result, the selectivity to acetaldehyde for ZnO/Rb–MOR-(7) is shown to be superior to the other tested materials with acetaldehyde accounting for around 95% of detected carbon containing products (Fig. 8C). Ethanol conversion for all reactions was around 30–50% at an ethanol flow rate of 0.330 mmol min−1 (Fig. S10A†). The carbon balance for all reactions was maintained at around 90% (on average) for all catalysts (Fig. S10B†). Very small amounts of additional carbon-containing products were detected (CO, CO2, CH4) but not quantified and therefore the missing carbon balance is partly attributed to these products and visible carbonaceous deposits. Coking values for spent catalysts as determined by CHN microanalysis are given in Table S6,† as previously observed for ZnO/Na–MOR-(7) materials, carbon coking is generally seen to decrease with decreasing ethylene selectivity.
3.5. Performance analysis of the optimized ZnO/Rb–MOR-(7) system
Upon identification of ZnO (3.5)/Rb–MOR-(7) as the optimum catalyst composition, both reproducibility studies and a long-term stability test were undertaken to assess reliability and performance over extended time scales. Fig. S11† shows the effluent composition (A), acetaldehyde yield (B), acetaldehyde productivity (C), ethanol conversion (D) and carbon balance (E) following reaction of ethanol over ZnO (3.5)/Rb–MOR-(7) at 400 °C for 4 h TOS. The results shown are averaged over three repeat experiments with error bars denoting one standard deviation in each co-ordinate. Good reproducibility is observed across all metrics for 50% ethanol conversion (Fig. S11D†) at an ethanol flow rate of 0.300 mmol min−1. Fig. S11C† shows that the yield of acetaldehyde remains around 25%, with detected minor products including ethylene, ethane and trace amounts of diethyl ether. Fig. S11E† demonstrates that the average carbon balance is maintained above 80% across all replications, consistent with some coke deposition and possibly small contributions from non-calibrated carbon-containing species.Fig. 9 shows cumulative acetaldehyde production and acetaldehyde selectivity following reaction of ethanol at 400 °C for 120 h TOS over ZnO (3.5)/Rb–MOR-(7) at an ethanol flow rate of 0.330 mmol min−1. Notably, throughout the course of reaction, a selectivity for acetaldehyde is maintained above 90% (Fig. 9B). Following an initial decrease in acetaldehyde productivity (Fig. S12†), a steady acetaldehyde productivity of around 16 mmol g−1 h−1 is achieved for the remaining 120 h TOS. Crucially, only a low level of deactivation is observed throughout the 120 h TOS, suggesting a long and stable catalyst lifetime. Additionally, Fig. S13† demonstrates that an initial ethanol conversion of 40% and acetaldehyde yield of 25% are achieved with minor deactivation observed towards 120 h TOS. A carbon balance of around 90% was maintained throughout the course of the reaction.
In order to assess catalyst condition following reaction with ethanol for 120 h TOS, pXRD analysis, 27Al solid-state NMR spectroscopy and CHN microanalysis were undertaken. Fig. S14† shows the resulting pXRD diffractograms (A) and solid-state 27Al spectra (B) for the fresh and spent catalysts indicating retention of both a MOR type framework and aluminium atoms exclusively in tetrahedral framework positions. Following reaction, the spent catalyst charge was found to possess a carbon content of 4.67 wt% by CHN microanalysis, very similar to 4 h TOS (3.52 wt%) (Table S7†). Fig. S15† demonstrates that ethylene productivity decreases significantly from 0.73 mmol g−1 h −1 within the first two hours of reaction before levelling off to around 0.2 mmol g−1 h −1 for the remaining reaction duration. This observation adds further credibility to the hypothesis that ethylene productivity (and subsequent aromatisation) is almost solely responsible for coke deposition within this system and typically occurs within the initial two hours of reaction. We propose that through catalyst optimisation, ethylene productivity has become negligible, and deactivation through the formation of carbonaceous deposits is minimised, leading to the extended catalyst lifetime observed. Further, we predict that catalyst activity may extend significantly beyond 120 h TOS, therefore further increasing industrial applicability.
3.6. Effect of zeolite support on acetaldehyde productivity
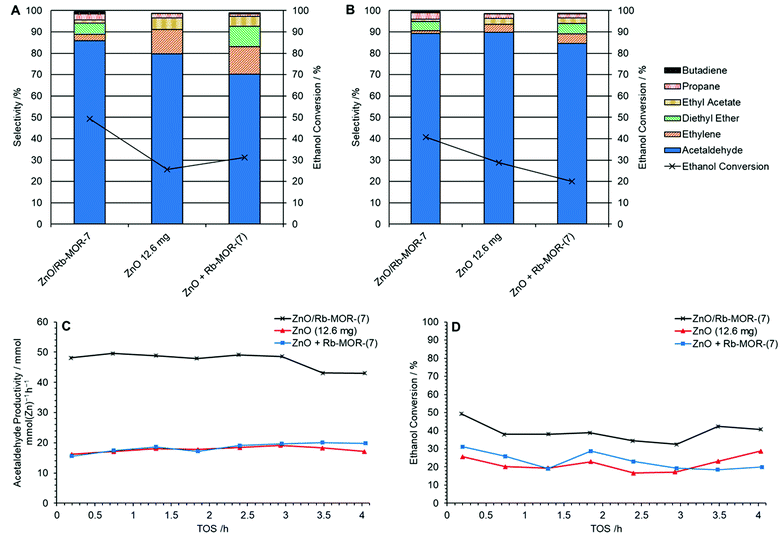
Unsupported ZnO has been previously reported in the existing literature to be an efficient catalyst for the dehydrogenation of ethanol,39–42 typically achieving acetaldehyde selectivities of around 70% in a temperature range of 350–400 °C.40,59 The major side product of ethanol reaction over ZnO is reported to be ethylene (approximately 20–30%) with minor traces of acetone and other oxidation products. Varying catalyst pre-treatment between oxidative and inert conditions, and at different temperatures, has been shown to result in differing ethylene selectivities (38–28%) indicating the importance of the surface properties of the catalyst to the performance.59 In addition to this finding, Morales et al. have reported very high acetaldehyde selectivities (88–94%) and low ethylene selectivities (1–7%) at 350 °C (6 h TOS) for a series of synthetic ZnO materials where the morphological properties of the resultant crystalline material varied, exposing different ZnO facets to different degrees.60 In addition, ZnO supported on silica (ZnO/SiO2, 0.5 Zn wt%) has been shown to give 7.5% ethylene selectivity whilst achieving 62% acetaldehyde selectivity at 360 °C (10 h TOS).61 Some of the data reported in the preceding publications is given in Table S7.† It is clear that due to the differing test conditions, direct comparison is challenging. However, none of the aforementioned materials were tested beyond 10 h TOS and therefore long-term performance has not been established. In addition, whilst the data reported by Morales et al. show very good selectivities, the materials give lower calculated acetaldehyde productivities per unit zinc than those previously described in this contribution (e.g. 22.3 mmol mmolZn−1 h−1 for sample ZnO–E3) showing that supporting ZnO on mordenite results in better productivity and better selectivity than the materials reported by Morales et al.60The role of the newly introduced zeolite support, Rb–MOR, was assessed in-house by means of comparison between supported and unsupported ZnO alongside a physical mixture of ZnO and the zeolite support. In this investigation, the molar Zn content of each catalyst was kept constant as shown in Table 3. Fig. 10 shows the selectivities to major products at 0.2 h (A) and 4.0 h (B) TOS for ZnO/Rb–MOR-(7), ZnO and a physical mixture of ZnO and Rb–MOR-(7). Acetaldehyde productivity per unit Zn and ethanol conversion levels are shown in Fig. 10C and D. Fig. 10B demonstrates that each catalyst achieves similar acetaldehyde selectivities of over 80% after 4 h TOS with supported ZnO/Rb–MOR-(7) achieving the highest selectivity of 89%. Fig. 10C, however, shows the significant effect of the zeolite support in increasing acetaldehyde productivity per unit Zn. As would be expected, both unsupported ZnO (12.6 mg) and physically mixed ZnO + Rb–MOR-(7) achieve similar acetaldehyde productivities of around 20 mmol mmolZn−1 h−1, similar to that reported by Morales et al.60 Supported ZnO/Rb–MOR-(7), however, is able to achieve an acetaldehyde productivity of around 48 mmol mmZn−1 h−1 marking nearly a 150% increase of productivity per unit Zn when compared to the unsupported materials. This increased acetaldehyde productivity is most likely attributed to improved Zn dispersion (as discussed in Section 3.3) and a resultant higher availability of active sites. The increased productivity is also due to an almost doubled ethanol conversion of around 35–40% for ZnO/Rb–MOR-(7) in comparison to around 20–25% for ZnO (12.6 mg) and ZnO + Rb–MOR-(7). In all cases, carbon balance was maintained above 80% (Fig. S16†). This result is significant as it suggests that, when correctly modified, zeolite supports are able to improve the catalytic efficiency of metal oxide materials hence allowing more effective use of diminishing metal reserves. Although zinc is not commonly regarded as a physically scarce metal, its supplies are predicted to decline within the coming century with a resultant increase in price and decrease in quality as likely outcomes.62 Hence, awareness of how to best utilise Zn in the most sustainable manner is important, especially if applied to potential large scale industrial processes, such as the transformation of (bio)ethanol to acetaldehyde. The origin of the enhanced productivity of ZnO supported on mordenite, as well as understanding the striking influence of the extra-framework cation, will be investigated further.
| Sample | Catalyst mass/mg | Zn wt% | Zn content/mmol |
|---|---|---|---|
| ZnO/Rb–MOR-(7) | 300 | 3.39 | 0.156 |
| ZnO + Rb–MOR-(7) | 12.6 + 300 | 81.4 | 0.157 |
| ZnO | 12.6 | 81.4 | 0.157 |
3.7. Comparison to state of the art systems
In all, we have shown that ZnO (3.5)/Rb–MOR-(7) presents several advantages in comparison to other contemporary systems reported for the production of acetaldehyde from ethanol in the current literature. Primarily, ZnO (3.5)/Rb–MOR-(7) is recognised as a true direct dehydrogenation catalyst owing to the lack of O2 co-feed required in order to produce acetaldehyde. In this regard, whilst operating at 673 K, ZnO (3.5)/Rb–MOR-(7) was able to achieve a 25% acetaldehyde yield based upon carbon fed (Fig. S13†) in comparison to the 10–15% yield reported for NaUSY-0.1 at the same temperature.15 As a result of O2 independence, it is highlighted that reaction of ethanol over ZnO (3.5)/Rb–MOR-(7) additionally results in formation of hydrogen as an added-value by-product. Further, ZnO (3.5)/Rb–MOR-(7) possesses a long catalyst lifetime with a low level of observed deactivation following 120 h TOS. From our analysis, we conclude that these observations are resultant from a largely homogenous distribution of ZnO nanoparticles distributed within the zeolite micropore network that are resistant to sintering and other forms of deactivation. This long lifetime presents a considerable improvement in comparison to many contemporary catalysts that use Cu as a dehydrogenation catalyst which suffer from significant deactivation as a result of sintering within as little as 2 h TOS.63 Other supported Cu systems, such as Cu–ZnAl2O4 also suffer from deactivation, although at slightly extended timescales (5–10 h).64 It must be noted, however, that some modern preparation methods may lead to Cu based systems with comparable stabilities to ZnO (3.5)/Rb–MOR-(7) reported herein, e.g. a Cu–BEA with a stable lifetime of 100 h,32 and a highly dispersed Cu/SiO2 prepared by ammonia evaporation with a lifetime of 500 h.65 Additionally, copper on calcium silicate catalysts have been reported to exhibit a remarkably stable acetaldehyde production, however the longest recorded reaction duration was 20 h.66 Finally, ZnO (3.5)/Rb–MOR-(7) may present a desirable alternative to commercial copper chromite catalysts (e.g. BASF Cu-1234-1/16-3F67 and BASF 0203T66) for the synthesis of acetaldehyde from ethanol. The desire to switch from chromium containing catalysts is due to growing concern that, although active copper chromite catalysts contain Cr3+, their production and disposal on an industrial scale may risk production of toxic Cr6+.664. Conclusions
In conclusion, we have shown that ZnO impregnated MOR materials are efficient and selective catalysts for the direct dehydrogenation reaction of ethanol to form acetaldehyde at 400 °C under continuous flow conditions. ZnO/MOR catalysts may be optimized by increased ZnO loading and exchange of alkali counter-cation, with ZnO/Rb–MOR-(7) loaded at 3.5 wt% Zn being identified as the optimum catalyst material under the experimental conditions. Significantly, two key catalytic parameters showed a striking dependence on the alkali extra-framework cation of the mordenite zeolite. Acetaldehyde productivity (per unit zinc) was shown to nearly double and ethylene selectivity decreased from 9 to 0.9% (at 4 h TOS) on changing the extra-framework cation from Na to Rb. ZnO (3.5)/Rb–MOR-(7) is also shown to possess a long and desirable catalyst lifetime of 120+ h when operating at 40% ethanol conversion, resulting in an acetaldehyde selectivity of 90% and an initial acetaldehyde yield of 25%. Further, the use of a zeolite support is shown to greatly improve the usage efficiency of Zn atoms by virtue of an acetaldehyde productivity increase from 20 to 48 mmol mmolZn−1 h−1 for unsupported and supported ZnO, respectively. The combination of very low ethylene selectivity, high acetaldehyde selectivity and long catalyst lifetime is commercially desirable and, combined with facile and scalable catalyst preparation, makes ZnO/MOR materials interesting candidates for sustainable fuels and chemicals production from (bio)ethanol.Author contributions
S. J. Raynes: conceptualization, methodology, investigation, formal analysis, data curation, writing – original draft, review & editing. R. A. Taylor: conceptualization, methodology, writing – review & editing, supervision, funding acquisition.Conflicts of interest
The authors report no declarations of interest.Acknowledgements
The authors would like to acknowledge Dr Emily Unsworth of Durham University for collection of elemental microanalysis (CHN) and ICP-OES data. The authors would further like to thank Miss Irene Mazzei of Durham University for acquisition of SEM images and Dr Diana Talia Alvarez Ruiz of Durham University for preparation and acquisition of SEM-EDS maps. S. R. thanks the EPSRC and Durham University for generous financial support for his PhD studentship. R. T. thanks the EPSRC for generous funding of an EPSRC Manufacturing Fellowship (grant number EP/R01213X/1).References
- Annual World Fuel Ethanol Production, https://ethanolrfa.org/statistics/annual-ethanol-production/, (accessed 28/01/2020) Search PubMed.
- U.S. fuel ethanol production continues to grow in 2017, https://www.eia.gov/todayinenergy/detail.php?id=32152, (accessed 08/01/18) Search PubMed.
- R. A. Dagle, A. D. Winkelman, K. K. Ramasamy, V. Lebarbier Dagle and R. S. Weber, Ind. Eng. Chem. Res., 2020, 59, 4843–4853 CrossRef CAS.
- M. Guerbet, C. R. Acad. Sci., 1899, 128, 511 Search PubMed.
- S. V. Lebedev, Zh. Obshch. Khim., 1933, 3, 698 CAS.
- H. Aitchison, R. L. Wingad and D. F. Wass, ACS Catal., 2016, 6, 7125–7132 CrossRef CAS.
- E. V. Makshina, M. Dusselier, W. Janssens, J. Degreve, P. A. Jacobs and B. F. Sels, Chem. Soc. Rev., 2014, 43, 7917–7953 RSC.
- A. Y. Chichibábin, J. Prakt. Chem., 1924, 107, 122–128 CrossRef.
- B. Tollens and P. Wigand, Justus Liebigs Ann. Chem., 1891, 265, 316–340 CrossRef CAS.
- M. Eckert, G. Fleischmann, R. Jira, H. M. Bolt and K. Golka, in Ullmann's Encyclopedia of Industrial Chemistry, 2006, DOI:10.1002/14356007.a01_031.pub2.
- J. Bierhals, in Ullmann's Encyclopedia of Industrial Chemistry, 2001, DOI:10.1002/14356007.a05_203.
- H. Zimmermann and R. Walzl, in Ullmann's Encyclopedia of Industrial Chemistry, 2009, DOI:10.1002/14356007.a10_045.pub3.
- Acetaldehyde Market by Process (Wacker Process, Oxidation of Ethanol, Dehydrogenation of Ethanol), Derivative (Pyridine & Pyridine Bases, Pentaerythritol), Application (Food & Beverage, Chemicals, Paints & Coatings), and Region - Global Forecast to 2022, https://www.marketsandmarkets.com/Market-Reports/acetaldehyde-market-113225129.html?gclid=CjwKCAjw9vn4BRBaEiwAh0muDFXFtvmo_XxtxX3_cfMiR4GsRR61R3RrC-NFOJJ1zY6WbTRhXZGRwRoC9ZcQAvD_BwE, (accessed 27/07/20) Search PubMed.
- O. Rosales-Calderon and V. Arantes, Biotechnol. Biofuels, 2019, 12, 240 CrossRef PubMed.
- G. M. Lari, K. Desai, C. Mondelli and J. Pérez-Ramírez, Catal. Sci. Technol., 2016, 6, 2706–2714 RSC.
- J. J. Murcia, M. C. Hidalgo, J. A. Navío, V. Vaiano, P. Ciambelli and D. Sannino, Catal. Today, 2012, 196, 101–109 CrossRef CAS.
- L. V. Mattos and F. B. Noronha, J. Catal., 2005, 233, 453–463 CrossRef CAS.
- B.-S. Jiang, R. Chang and Y.-C. Lin, Ind. Eng. Chem. Res., 2013, 52, 37–42 CAS.
- J. Mielby, J. O. Abildstrøm, F. Wang, T. Kasama, C. Weidenthaler and S. Kegnæs, Angew. Chem., 2014, 126, 12721–12724 CrossRef.
- E. Behravesh, N. Kumar, Q. Balme, J. Roine, J. Salonen, A. Schukarev, J.-P. Mikkola, M. Peurla, A. Aho, K. Eränen, D. Y. Murzin and T. Salmi, J. Catal., 2017, 353, 223–238 CrossRef CAS.
- E. A. Redina, A. A. Greish, I. V. Mishin, G. I. Kapustin, O. P. Tkachenko, O. A. Kirichenko and L. M. Kustov, Catal. Today, 2015, 241, 246–254 CrossRef CAS.
- V. I. Sobolev, K. Y. Koltunov, O. A. Simakova, A.-R. Leino and D. Y. Murzin, Appl. Catal., A, 2012, 433–434, 88–95 CrossRef CAS.
- T. Takei, N. Iguchi and M. Haruta, New J. Chem., 2011, 35, 2227–2233 RSC.
- Y. Guan and E. J. M. Hensen, Appl. Catal., A, 2009, 361, 49–56 CrossRef CAS.
- T. W. Hansen, A. T. DeLaRiva, S. R. Challa and A. K. Datye, Acc. Chem. Res., 2013, 46, 1720–1730 CrossRef CAS PubMed.
- A. Corma, J. Navas and M. J. Sabater, Chem. Rev., 2018, 118, 1410–1459 CrossRef CAS PubMed.
- M. Ouyang, S. Cao, S. Yang, M. Li and M. Flytzani-Stephanopoulos, Ind. Eng. Chem. Res., 2020, 59, 2648–2656 CrossRef CAS.
- S. Hanukovich, A. Dang and P. Christopher, ACS Catal., 2019, 9, 3537–3550 CrossRef CAS.
- C. Wang, G. Garbarino, L. F. Allard, F. Wilson, G. Busca and M. Flytzani-Stephanopoulos, ACS Catal., 2016, 6, 210–218 CrossRef CAS.
- G. Garbarino, P. Riani, M. Villa García, E. Finocchio, V. Sanchez Escribano and G. Busca, Catal. Today, 2019, 354, 167–175 CrossRef.
- M. Almohalla, E. Gallegos-Suárez, A. Arcoya, J. Álvarez-Rodríguez, I. Rodríguez-Ramos and A. Guerrero-Ruiz, Appl. Catal., A, 2017, 535, 61–68 CrossRef CAS.
- D. Yu, W. Dai, G. Wu, N. Guan and L. Li, Chin. J. Catal., 2019, 40, 1375–1384 CrossRef CAS.
- S. Tsuruya, M. Tsukamoto, M. Watanabe and M. Masai, J. Catal., 1985, 93, 303–311 CrossRef CAS.
- Y. Injongkol, T. Maihom, S. Choomwattana, B. Boekfa and J. Limtrakul, RSC Adv., 2017, 7, 38052–38058 RSC.
- V. Markova, G. Rugg, A. Govindasamy, A. Genest and N. Rösch, J. Phys. Chem. C, 2018, 122, 2783–2795 CrossRef CAS.
- M. M. Mohamed, J. Mol. Catal. A: Chem., 2003, 200, 301–313 CrossRef CAS.
- X. Bo-Qing, C. Tian-Xi and L. Song, React. Kinet. Catal. Lett., 1993, 49, 223–228 CrossRef.
- T. C. Keller, K. Desai, S. Mitchell and J. Perez-Ramirez, ACS Catal., 2015, 5, 5388–5396 CrossRef CAS.
- W. A. Lazier and H. Adkins, J. Am. Chem. Soc., 1925, 47, 1719–1722 CrossRef CAS.
- M. M. Rahman, S. D. Davidson, J. M. Sun and Y. Wang, Top. Catal., 2016, 59, 37–45 CrossRef.
- C. Drouilly, J. M. Krafft, F. Averseng, H. Lauron-Pernot, D. Bazer-Bachi, C. Chizallet, V. Lecocq and G. Costentin, Appl. Catal., A, 2013, 453, 121–129 CrossRef CAS.
- J. M. Vohs and M. A. Barteau, Surf. Sci., 1989, 221, 590–608 CrossRef CAS.
- A. Modak, A. Deb, T. Patra, S. Rana, S. Maity and D. Maiti, Chem. Commun., 2012, 48, 4253–4255 RSC.
- K. Ding, S. Xu, R. Alotaibi, K. Paudel, E. W. Reinheimer and J. Weatherly, J. Org. Chem., 2017, 82, 4924–4929 CrossRef CAS PubMed.
- N. Kosaric, Z. Duvnjak, A. Farkas, H. Sahm, S. Bringer-Meyer, O. Goebel and D. Mayer, in Ullmann's Encyclopedia of Industrial Chemistry, 2011, pp. 1–72, DOI:10.1002/14356007.a09_587.pub2.
- J. B. Nagy, Z. Gabelica, G. Debras, E. G. Derouane, J.-P. Gilson and P. A. Jacobs, Zeolites, 1984, 4, 133–139 CrossRef CAS.
- V. R. Choudhary and S. D. Sansare, Appl. Catal., 1984, 10, 147–153 CrossRef CAS.
- E. A. Uslamin, H. Saito, N. Kosinov, E. Pidko, Y. Sekine and E. J. M. Hensen, Catal. Sci. Technol., 2020, 10, 2774–2785 RSC.
- A. Devaraj, M. Vijayakumar, J. Bao, M. F. Guo, M. A. Derewinski, Z. Xu, M. J. Gray, S. Prodinger and K. K. Ramasamy, Sci. Rep., 2016, 6, 37586 CrossRef CAS PubMed.
- P. Norby, F. I. Poshni, A. F. Gualtieri, J. C. Hanson and C. P. Grey, J. Phys. Chem. B, 1998, 102, 839–856 CrossRef CAS.
- M. Hunger, U. Schenk, B. Burger and J. Weitkamp, Angew. Chem., 1997, 36, 2504–2506 CrossRef CAS.
- H. Liu and C. P. Grey, Microporous Mesoporous Mater., 2002, 53, 109–120 CrossRef CAS.
- C. Bisio, P. Massiani, K. Fajerwerg, L. Sordelli, L. Stievano, E. R. Silva, S. Coluccia and G. Martra, Microporous Mesoporous Mater., 2006, 90, 175–187 CrossRef CAS.
- H. L. Tidahy, S. Siffert, J. F. Lamonier, R. Cousin, E. A. Zhilinskaya, A. Aboukaïs, B. L. Su, X. Canet, G. De Weireld, M. Frère, J. M. Giraudon and G. Leclercq, Appl. Catal., B, 2007, 70, 377–383 CrossRef CAS.
- H. Robson, Verified synthesis of zeolitic materials, Gulf Professional Publishing, 2001 Search PubMed.
- C. Baerlocher and L. B. McCusker, in Studies in Surface Science and Catalysis, ed. J. C. Jansen, M. Stöcker, H. G. Karge and J. Weitkamp, Elsevier, 1994, vol. 85, pp. 391–428 Search PubMed.
- H. V. Doan, K. M. Leung, V. P. Ting and A. Sartbaeva, CrystEngComm, 2021, 23, 857–863 RSC.
- O. Halevi, T.-Y. Chen, P. S. Lee, S. Magdassi and J. A. Hriljac, RSC Adv., 2020, 10, 5766–5776 RSC.
- C. Drouilly, J. M. Krafft, F. Averseng, H. Lauron-Pernot, D. Bazer-Bachi, C. Chizallet, V. Lecocq and G. Costentin, Appl. Catal., A, 2013, 453, 121–129 CrossRef CAS.
- M. V. Morales, E. Asedegbega-Nieto, A. Iglesias-Juez, I. Rodríguez-Ramos and A. Guerrero-Ruiz, ChemSusChem, 2015, 8, 2223–2230 CrossRef CAS PubMed.
- T. De Baerdemaeker, M. Feyen, U. Müller, B. Yilmaz, F.-S. Xiao, W. Zhang, T. Yokoi, X. Bao, H. Gies and D. E. De Vos, ACS Catal., 2015, 5, 3393–3397 CrossRef CAS.
- H. U. Sverdrup, A. H. Olafsdottir and K. V. Ragnarsdottir, Resour., Conserv. Recycl., 2019, 4, 100007 Search PubMed.
- Y.-J. Tu and Y.-W. Chen, Ind. Eng. Chem. Res., 2001, 40, 5889–5893 CrossRef CAS.
- G. Pampararo, G. Garbarino, P. Riani, M. Villa García, V. Sánchez Escribano and G. Busca, Appl. Catal., A, 2020, 602, 117710 CrossRef CAS.
- H. Zhang, H.-R. Tan, S. Jaenicke and G.-K. Chuah, J. Catal., 2020, 389, 19–28 CrossRef CAS.
- A. Segawa, A. Nakashima, R. Nojima, N. Yoshida and M. Okamoto, Ind. Eng. Chem. Res., 2018, 57, 11852–11857 CrossRef CAS.
- E. Santacesaria, G. Carotenuto, R. Tesser and M. Di Serio, Chem. Eng. J., 2012, 179, 209–220 CrossRef CAS.
Footnote |
| † Electronic supplementary information (ESI) available. See DOI: 10.1039/d1se00091h |
| This journal is © The Royal Society of Chemistry 2021 |

