 Open Access Article
How to exploit different endocytosis pathways to allow selective delivery of anticancer drugs to cancer cells over healthy cells†
Vu Thanh
Cong
a,
Richard D.
Tilley
 a,
George
Sharbeen
 b,
Phoebe A.
Phillips
 b,
Katharina
Gaus‡
c and
J. Justin
Gooding
 *a
*a
aSchool of Chemistry, Australian of NanoMedicine and ARC Centre of Excellence in Convergent Bio-Nano Science and Technology, University of New South Wales, Sydney, 2052 Australia. E-mail: justin.gooding@unsw.edu.au
bPancreatic Cancer Translational Research Group, School of Medical Sciences, Lowy Cancer Research Centre, University of New South Wales, Sydney, 2052 Australia
cEMBL Australia Node in Single Molecule Science and ARC Centre of Excellence in Advanced Molecular Imaging, University of New South Wales, Sydney, 2052 Australia
First published on 18th November 2021
Abstract
It was recently shown that it is possible to exploit the nanoparticle shape to selectively target endocytosis pathways found in cancer and not healthy cells. It is important to understand and compare the endocytosis pathways of nanoparticles in both cancer and healthy cells to restrict the healthy cells from taking up anticancer drugs to help reduce the side effects for patients. Here, the clathrin-mediated endocytosis inhibitor, hydroxychloroquine, and the anticancer drug, doxorubicin, are loaded into the same mesoporous silica nanorods. The use of nanorods was found to restrict the uptake by healthy cells but allowed cancer cells to take up the nanorods via the macropinocytosis pathway. Furthermore, it is shown that the nanorods can selectively deliver doxorubicin to the nucleus of breast cancer cells and to the cytoplasm of pancreatic cancer cells. The dual-drug-loaded nanorods were able to selectively kill the breast cancer cells in the presence of healthy breast cells. This study opens exciting possibilities of targeting cancer cells based on the material shape rather than targeting antibodies.
Introduction
Understanding the endocytosis pathways of nanoparticles helps to improve targeting strategies and potentially the efficiency and safety in therapeutic applications.1,2 Understanding the differences in the available endocytosis pathways for nanoparticles in cancer and healthy cells shows that if nanoparticles can be designed to be taken up only by macropinocytosis pathway (a consequence of oncogenic alterations of cancer cells), then this pathway could be targeted to the cancer cells.3 Understanding which endocytosis pathways are available to cancer cells and to healthy cells can be exploited to design nanoparticles that are selectively taken up by the cancer cells over the healthy cells.3 This strategy is in contrast to the more common approach of first synthesising the nanoparticles and then studying which uptake pathway they employed to allow the nanoparticles to enter the cells in question. In general, each endocytosis pathway has an upper size limit for nanoparticles to be internalised.4 For example, clathrin-mediated endocytosis has an upper size limit of ∼120 nm. Therefore, if the nanoparticles are bigger than the upper size limit of clathrin-mediated endocytosis, these nanoparticles are unlikely to be taken up by the clathrin-mediated endocytosis pathway.4,5 Macropinocytosis is one of the hallmarks of cancer cells while most healthy cells are non-macropinocytic.6–8 It has been found that a specific shape of nanoparticles can show a preference for the macropinocytosis pathways of cancer cells.9 For instance, we3 and others10 have shown that mesoporous silica nanorods with a size of ∼180 nm × 60 nm were found to be taken up in larger quantities via the macropinocytosis pathway compared to the short or long nanorods and nanospheres. Importantly, these studies were performed without any drug delivery. Furthermore, the macropinocytosis pathway has recently attracted attention as a strategy to achieve nuclear drug delivery.7,11–17 It is suggested that macropinocytosis leads to a high rate of endosomal and lysosomal escape,18,19 so vital for effective drug delivery to a cell.20 Combining these two concepts, developing drug loaded nanoparticles that only enter cells by endocytosis could be a means of not only targeting cancer cells over healthy cells but also used to direct where in the cells drugs are released. In the present study we show how the nanorods can be used to deliver anticancer drugs to the nucleus of cancer cells to selectively kill the cancer cells in the presence of healthy breast cells, which has not been previously reported.Endocytosis chemical inhibitors are widely used to study the uptake pathway of nanoparticles.5 Cells are typically pre-treated with the inhibitor before adding nanoparticles. Then the uptake of nanoparticles into inhibitor-treated cells is compared to that of non-inhibitor-treated cells. For example, if hydroxychloroquine-treated cells take up fewer nanoparticles in comparison to non-inhibitor-treated cells, it means clathrin-mediated endocytosis is involved in the uptake. Hydroxychloroquine reduces the expression of phosphatidylinositol binding clathrin assembly protein, one of the three most abundant proteins in clathrin-coated pits,21 to downregulate clathrin-mediated endocytosis.5 The clathrin-mediated endocytosis pathway is common in both cancer and healthy cells.22 Recently the clathrin-mediated endocytosis inhibitor hydroxychloroquine was recommended to be repurposed for nanomedicine research to increase the therapeutic index.23–27 For example, hydroxychloroquine loaded inside hollow mesoporous silica nanoparticles significantly enhances the therapeutic efficacy of radiation therapy by effectively inhibiting the radiation-induced autophagy of cancer cells.28 Furthermore, hydroxychloroquine-conjugated gold nanoparticles can improve endosomal escape and increase siRNA guide strand distribution to the RNA induced silencing complex, which is a crucial obstacle to the potency of siRNA.29 Hydroxychloroquine is currently being clinically used as an autophagy inhibitor in the treatment of cancers.30 And the combination of hydroxychloroquine and doxorubicin is also in clinical trials for lymphoma treatment.31
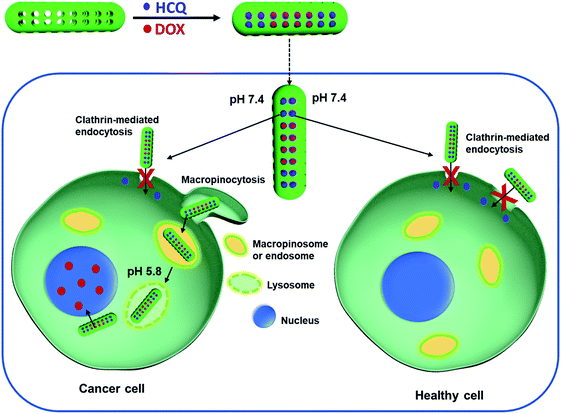
The purpose of this paper is to show how mesoporous silica nanorods, with a size of ∼180 nm × 68 nm, can be used to target the macropinocytosis uptake pathway of cancer cells for drug delivery. Co-loading of hydroxychloroquine (HCQ) and doxorubicin (DOX) allowed the delivery of DOX to the nucleus of cancer cells (Fig. 1), and selectively kill the breast cancer cells over healthy breast cells in a co-culture of cancer and healthy breast cells. In contrast, the same nanoparticles were shown to preferentially deliver DOX to pancreatic cancer cells over healthy pancreatic cells, but with the pancreatic cancer cells, the drug was preferentially delivered to the cytoplasm and not the nucleus, revealing different behaviours of different cancer cell types.
Results and discussion
Hydroxychloroquine and doxorubicin-loaded mesoporous silica nanorods
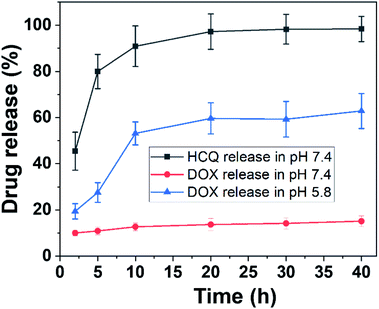
Mesoporous silica nanorods were prepared using a tetraethyl orthosilicate (TEOS)-based sol–gel process as described previously.3 The synthesis relies on the hydrolysis of TEOS to form silica oligomers with the condensation of silica oligomers around a surfactant template cetyltrimethylammonium bromide (CTAB), to obtain the final mesoporous structure.9 The size of the nanorods was determined by transmission electron microscopy and the data of the length and width of nanorods were extracted using ImageJ. The size of the nanorods was ∼180 nm in length and 68 nm in width (Fig. S1, ESI†). The surface of the nanorods was modified with polyacrylic acid (PAA) to limit the aggregation of the nanorods in biological media and to control the release of the drug at acidic pH. The nanorods were labelled with Cy5.5 to determine the cellular uptake into the cells and compare to the site of drug release later.Doxorubicin (DOX) and/or hydroxychloroquine (HCQ) were loaded into mesoporous silica nanorods. To achieve this, HCQ (0.3 mg) or DOX (0.1 mg) was dissolved in 1 mL of phosphate-buffered saline (PBS), pH 7.4. The UV-vis absorbance of DOX and HCQ in PBS buffer is shown in Fig. S2.† Then 0.5 mL of pure water containing 5 mg of nanorods was added to the drug solution and stirred for 48 h at 25 °C. The concentration of HCQ and DOX before loading into the nanorods was 0.46 mM and 0.123 mM, respectively. For dual-drug loading, 0.15 mg of HCQ and 0.05 g of DOX were used. To determine the amount of drugs loaded into the nanorods, the UV-vis absorbance of HCQ and DOX solutions before and after loading into the nanorods was measured by using a UV-vis spectrophotometer for absorption at 342 nm for HCQ and 480 nm for DOX (Fig. S3†). The amount of HCQ loaded in nanorods was calculated to be 0.023 mg in 5 mg of nanorods to obtain a loading efficiency of 4.6% (wt/wt). The amount of DOX loaded into the nanorods was calculated to be 0.094 mg in 5 mg of nanorods to obtain a loading efficiency of 18.8% (wt/wt). The concentration of HCQ and DOX in the nanorods was therefore 0.035 mM and 0.116 mM, respectively (Table S1 and Fig. S3, ESI†). The lower loading efficiency of HCQ compared with that of DOX was attributed to the charge interaction between the positively charged DOX and the negative charge of PAA-modified silica. HCQ in contrast is believed to enter the pore spaces of the mesoporous silica mainly via passive diffusion. The drug-loaded Cy5.5 nanorods are referred to as HCQ-NR-Cy5.5, DOX-NR-Cy5.5, or HCQ & DOX-NR-Cy5.5 depending on their payload. All drug-loaded nanorods were kept in 1 mL of PBS buffer, pH 7.4 (Fig. S2†). The UV-vis absorbance spectra of DOX-, HCQ-, and HCQ & DOX-loaded nanorods are shown in Fig. S2h.† The UV-vis absorbance spectra of NR-Cy5.5 show a characteristic absorption peak at 683 nm corresponding to Cy5.5. With HCQ-NR-Cy5.5, there is an additional band at 342 nm corresponding to HCQ and with HCQ-DOX-NR-Cy5.5, a further absorption peak at 480 is observed corresponding to DOX. The release profile of HCQ and DOX was obtained in PBS buffer, pH 7.4 and 5.8 (Fig. 2). For the release experiments, 2 mL of the supernatant was taken periodically from the suspension followed by centrifugation (9000 rpm, 5 min) and measured by using a UV-vis spectrophotometer for absorption at 342 nm for HCQ and 480 nm for DOX. HCQ was released faster than DOX even at pH 7.4 (Fig. 2). It can be seen that ∼80% of HCQ was released after 5 h and the release was completed after 20 h. The release profile of HCQ is consistent with the release rate from a previous report.28 As the purpose of HCQ is to inhibit the uptake of nanorods into healthy cells, the fast release of HCQ at pH 7.4 is beneficial for this work. The release profiles of DOX from nanorods at pH 7.4 were <15% after 40 h incubation, whereas the release rate of DOX at pH 5.8, a pH often associated with the environment of endosomes or lysosomes in cancer cells, was 65% after 40 h (Fig. 2). The release profile of DOX is consistent with our previous work32 and the work by others.33 Here, DOX-NR-Cy5.5 is expected to be taken by the cells and DOX is released inside cellular organelles such as endosomes or lysosomes where the pH is more acidic.
The selection of DOX-NR-Cy5.5 for targeting the nucleus of the breast cancer cells over pancreatic cancer cells
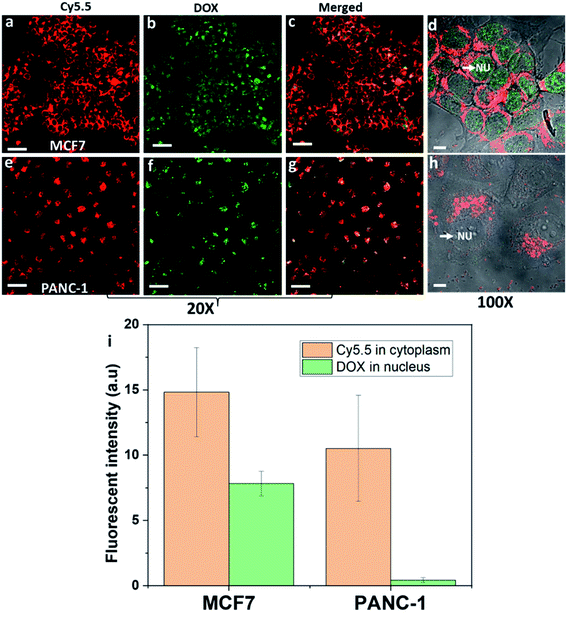
DOX inhibits topoisomerase II of cancer cells to prevent cells from replicating. This requires DOX to be delivered to the nucleus of cancer cells.34 The amount of DOX delivered to the nucleus of cancer cells was assessed from the fluorescence intensity after exposing DOX-NR-Cy5.5 to the breast cancer MCF7 cells or pancreatic cancer PANC-1 cells (Fig. 3). What is evident from Fig. 3 is DOX is delivered to the nucleus in both cell types but there is significantly more DOX delivered to the nucleus of MCF7 cells compared with that of the PANC-1 cells. This is despite the fact that, from Fig. 3a and d, it can be seen that the nanorods are located adjacent to the nucleus of MCF7 cells but do not cross the nuclear envelope. With the PANC-1 cells, the nanorods do not appear to encircle the nucleus to the same extent and are often located only on one side of the nucleus (Fig. 3e and h). Based on previous work, we have compared the endocytosis pathways of nanorods in MCF7 and PANC-1 cells and found that both MCF7 and PANC-1 cells used clathrin-mediated endocytosis and macropinocytosis as the major uptake pathways.3 Here, we exploit our previous findings for drug delivery and selective targeting of cancer cells over healthy cells. We compared breast cancer cells with pancreatic cancer cells with the purpose of showing that the intracellular fate of the nanoparticle drug delivery system is also dependent on cancer cell types. Both breast cancer MCF7 cells and pancreatic cancer PANC-1 cells are macropinocytic cells;8,35 however, the intracellular trafficking of nanoparticles into these two cancer cell types is quite different. As shown in Fig. 3 different cancer cell types from different tumour tissues could lead to significant differences in intracellular trafficking, localization of nanoparticles in cells, and the release sites of drugs in the cells. Therefore, understanding the intracellular trafficking of the nanoparticle drug delivery system for a specific cancer type is very important to choose the right drug.The reasons for differences in drug delivery locations between the two cell types using nanorods are complicated. We have compared the effect of other shapes of nanoparticles on the endocytosis and the reason the nanorods could selectively deliver doxorubicin to the nucleus of breast cancer cells could be explained. Previously, we found that the nanorods can escape the lysosomes and locate adjacent to the nucleus of MCF7.3 We also use nanospheres with a similar size to compare with the nanorods. The nanospheres are either 190 nm in diameter or 56 nm in diameter to approximately match the length and the width of nanorod dimensions. When 190 nm nanospheres were incubated with MCF7, the fluorescence was hard to detect in the cytoplasm above the background. Increasing the concentration of the 190 nm nanospheres ten times did not result in an increase of nanospheres entering the cells. And the MCF7 cells were observed to exhibit a strong preference for the uptake of nanorods over the nanospheres (56 nm). The fluorescence intensity of nanorods in MCF7 cells was about four times higher than that of nanospheres (56 nm) in MCF7 cells.
A common feature of clathrin-mediated endocytosis and macropinocytosis pathways is that the majority of cargo they internalize is trafficked through lysosomes.3,5 It has been reported that nanoparticles are internalised into intracellular compartments (endosomes or lysosomes) with high heterogeneity within and between different tumour types and cancer cell types.36 In particular, the accumulation of binary ratiometric reporter nanospheres in six animal tumour models including breast and pancreatic tumour types, and the endocytosis kinetics of these nanoparticles in the breast and pancreatic cancer cells were highly heterogeneous.36 Furthermore, differences in the endosomal compartments between cell types exist which may also result in differences in the protein corona formed around the nanoparticles. Again this may change the endosomal escape properties of nanoparticles.37 What's more, the endosomal and lysosomal escape varies between different cancer cell types37,38 and the ability of the endosomal and lysosomal escape of nanoparticles is believed to be dependent on the position and the size of endosomes and lysosomes within the cell.39–41 Lysosomes located near the cell membrane were found to be less acidic than the lysosomes located near the nucleus.39 Note that pH plays a major role in the proton sponge hypothesis, and low pH could have a significant impact on helping the nanoparticles escape the intracellular compartments.41 Therefore, it is far from trivial to determine which of these variables or a combination of them is responsible for the difference in the distribution of the nanorods in MCF7 and PANC-1 cells, or the site of DOX release, of endocytosed DOX-NR-cy5.5 in the two cell types (Fig. 3b and f). What is clear is that the fluorescence intensity of nanorod-Cy5.5 in the cytoplasm of the MCF7 cells was ∼1.4 times greater than that in PANC-1 cells. Even more importantly, the fluorescence intensity of DOX in the nucleus of MCF7 cells was ∼18.3 times greater than that of the DOX in the nucleus of PANC-1 cells (Fig. 3i). These results indicate that the nanorods preferentially delivered doxorubicin to the nucleus of breast cancer cells compared to pancreatic cancer cells. Our results indicate that the intracellular trafficking must be taken into consideration for drug delivery into each specific cell type.
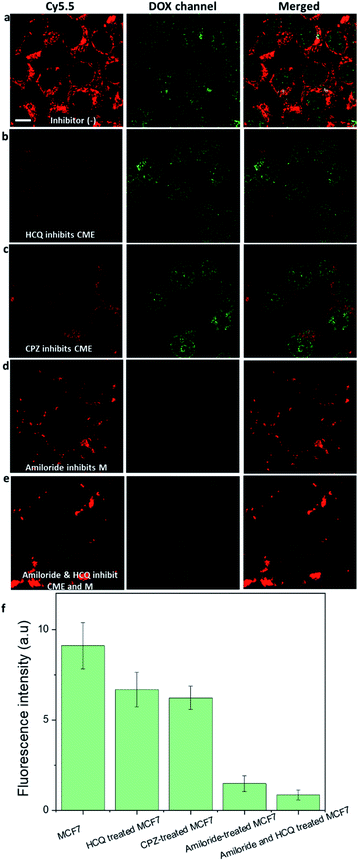
We further confirmed that macropinocytosis was the dominant pathway by which DOX-NR-Cy5.5 entered the MCF-7 cells by treating the cells with endocytosis inhibitors before adding DOX-NR-Cy5.5 (Fig. 4). The nanoparticle uptake was compared via the amount of DOX in the nucleus of the cells. It is apparent that the clathrin-mediated endocytosis inhibitors (hydroxychloroquine and chlorpromazine) and macropinocytosis inhibitor (amiloride) decrease the uptake of DOX-NR-Cy5.5 in the MCF7 cells. The clathrin-mediated endocytosis inhibitors (hydroxychloroquine and chlorpromazine) reduced the amount of DOX in the nucleus of the cancer cells by about 20% (Fig. 4b, c and f). In contrast, the macropinocytosis inhibitor (amiloride) reduced the amount of DOX in the nucleus by about 75% (Fig. 4d and f). It is apparent from these results that macropinocytosis largely contributes to the delivery of DOX into the nucleus compared to the clathrin-mediated endocytosis pathway. Our observation is consistent with other reports.18,19 For example, siRNA-loaded lipid nanoparticles were found to enter the cancer cells via macropinocytosis and clathrin-mediated endocytosis, and macropinocytosis provided a major contribution to gene silencing activity (up to 60%) while clathrin-mediated endocytosis resulted in ∼10% of gene silencing.18 Designing nanostructures to induce macropinocytosis uptake in cancer cells has been utilised in vitro18 and in vivo.14 For example, Chen et al. developed a biologically inspired lipoprotein-biomimetic nanostructure to induce cancer cells to ‘drink drugs’ via the macropinocytosis pathway and deliver drugs to the nucleus of the cancer cells.11,12In vivo, the accumulation of albumin bound drug nanoparticulates into the tumour was found to therapeutically improve by enhancing the macropinocytosis uptake of cancer cells.14
HCQ-loaded nanorods can restrict the uptake of nanorods into healthy cells
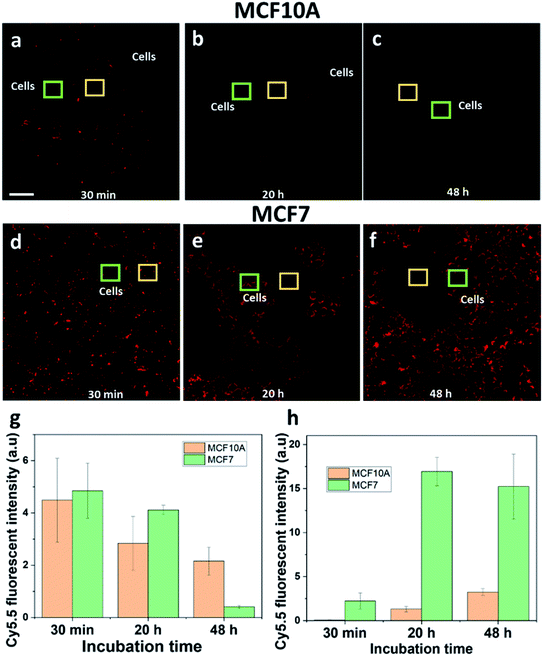
Healthy breast epithelial MCF10A cells were used as a non-cancer cell model to compare with MCF7 cells on the uptake of HCQ-NR-Cy5.5. It was hypothesised that when HCQ-NR-Cy5.5 was exposed to the cells, HCQ would be released and restrict the MCF10A cells from taking nanorods but allow the MCF7 cells to take the nanorods via the macropinocytosis pathway. To clarify this, we compared the extracellular and intracellular fluorescence intensity of NR-Cy5.5 in MCF10A and MCF7 cells at 30 min, 20 h, and 48 h of incubation after exposure. At 30 min after exposure, the extracellular fluorescence intensity of nanorod-Cy5.5 was higher than the intracellular fluorescence intensity of nanorod-Cy5.5 in both MCF7 and MCF10A cells (Fig. 5a and d). At 20 h after exposure, it was evident that with the MCF7 cells, the intracellular fluorescence intensity of nanorod-Cy5.5 was higher than the extracellular fluorescence intensity of nanorod-Cy5.5 (Fig. 5e) whilst with the MCF10A cell sample, the extracellular fluorescence intensity of nanorod-Cy5.5 was higher (Fig. 5b and S4†). At 48 h after exposure, the extracellular fluorescence intensity of nanorod-Cy5.5 was hardly detected for the MCF7 cells (Fig. 5f) and the amount of nanorods in MCF10A cells was significantly lower than the amount of nanorods in MCF7 cells (Fig. 5g and h). Taken together, these results show that HCQ can restrict the uptake of nanorods into MCF10A cells. Note that the inhibition by HCQ can have time-dependent effects on the inhibitor.42 In this system the release of HCQ from nanorods was completed after 20 h (Fig. 2d). It is hypothesized that after 20 h of incubation, the effects of HCQ on the MCF10A cells were reduced.Comparison of the uptake of HCQ & DOX-loaded mesoporous silica nanorods by cancer and healthy cells
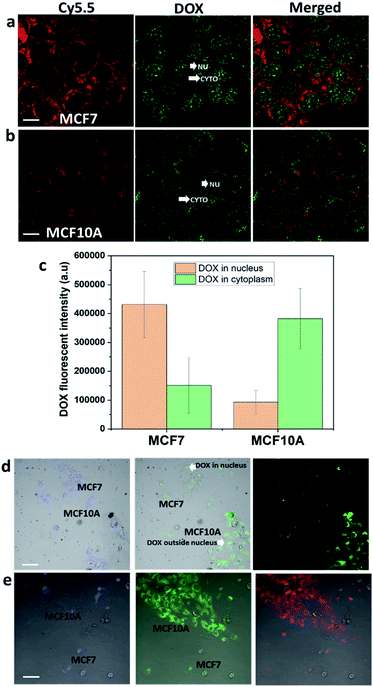
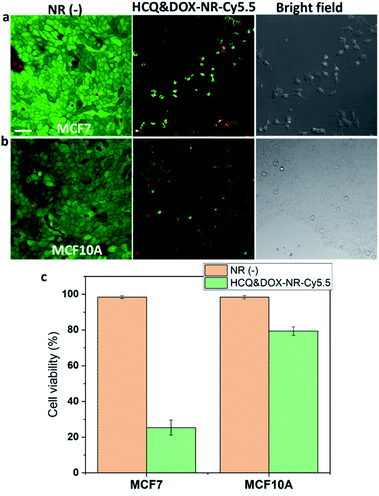
Next, HCQ and DOX were loaded into nanorods to selectively kill the breast cancer cells over the breast healthy cells. As mentioned above, DOX is most effective if delivered to the nucleus of cancer cells. It can be seen in Fig. 6a–c that more DOX was found in the nucleus of MCF7 than in the nucleus of MCF10A cells. To see whether HCQ & DOX-NR-Cy5.5 can selectively kill the MCF7 cells over MCF10A cells, a mixture of MCF7 and MCF10A cells in a co-culture system (Fig. 6d and e) was prepared. The MCF7 cells were stained with cell tracker violet. It was observed that DOX travels into the nucleus of MCF7 cells in the co-culture and hinders the MCF7 cells from spreading, leading to their death after 72 h. HCQ & DOX-NR-Cy5.5 do not cause significant toxicity in MCF10A cells. Details of the cytotoxicity are presented in Fig. 7.HCQ & DOX-NR-Cy5.5 stop the cancer cells from spreading. Cytotoxicity experiments were performed according to the literature.43Fig. 7a shows that the cancer MCF7 cells cannot spread nor divide after 72 h incubation. In contrast, MCF10A cells can grow and proliferate (Fig. 7b). The HCQ & DOX-NR-Cy5.5 can selectively kill ∼80% of the cancer cells (Fig. 7c). Overall, these results demonstrate how HCQ & DOX-NR-Cy5.5 can selectively target the cancer cells while exhibiting only marginal cytotoxicity towards healthy cells.
Practical applications of HCQ & DOX-NRs
The HCQ & DOX-NRs are specifically designed for injectable local drug delivery at the tumor site for in vivo delivery, and particularly designed to target the cancer cells located within the tumor. Injectable local drug delivery at the tumor site is one of the solutions for low delivery efficiency problems of nanomedicines and could prevent cancer recurrence after surgical therapy.44–47 As such the rapid release of HCQ prior to the release of DOX is advantageous to suppress the clathrin mediate endocytosis before the therapeutic nanoparticles are taken into the cells by macropinocytosis. For future practical applications, HCQ & DOX-NRs are suggested to be injected into the tumours such as breast tumors in animal models.Our HCQ & DOX-NRs are recommended to target the cancer cells located within the tumor where many drug delivery systems are unable to reach. This is because the cancer cells located in the core of the tumor were found to perform the highest levels of macropinocytosis uptake.15,48 Further study on using HCQ & DOX-NRs to target macropinocytic cancers at the core of the tumor will be needed.
Conclusion
We developed a simply designed nanoparticle drug-delivery vehicle that can transport the maximum amount of drugs into the nucleus of the cancer cells and is less harmful to healthy cells. Here we used mesoporous silica nanorods in combination with the FDA-approved drugs-hydroxychloroquine and doxorubicin. Our study is a promising approach for targeting cancer cells over healthy cells. Our findings of co-loading hydroxychloroquine and doxorubicin into mesoporous silica nanorods offer two new functions, restricting the uptake of anticancer drugs into healthy cells, and allow the delivery of anticancer drugs to the nucleus of cancer cells. This contributes to reducing the side effects of anticancer drugs and maximising the chemotherapy effects in the future.Method
Synthesis of mesoporous silica nanorods
The nanorods were prepared according to the literature.49 Briefly, 0.45 g of CTAB was dissolved in 110 mL of deionized water and stirred for 30 min before adding 1.7 mL of ammonium hydroxide. The mixture was kept stirring for another hour, and then 940 μL of TEOS was added to the solution. The reaction mixture was kept stirring for 1 h at room temperature. The nanorods were centrifuged and washed with 70% ethanol three times. The nanorods were kept in 50 mL of 70% ethanol. To remove CTAB on the surfaces of the mesoporous silica, 5 mL of HCl (35%) was added to the nanorod solution and stirred for 48 h. Finally, the nanorods were kept in 10 mL of 100% ethanol for further use.Surface modification
Polymer functionalization of mesoporous silica nanorods (PAA-nanorods) was conducted according to the literature.32 Mesoporous silica nanorods were transferred to 100% ethanol by centrifugation and redispersion in ethanol. Then, 1 mL of the nanoparticle solution (5 mg mL−1) was added to a mixture of 1 mL of APTES and 50 mL of ethanol. The mixture was vigorously stirred for 10 h. The obtained amine-modified nanorods (nanorod-NH2) were centrifuged and cleaned with ethanol, and kept in water. Conjugation of polyacrylic acid (PAA) with nanorod-NH2: 50 mg of PAA was dissolved in 5 mL of deionized water and sonicated for 30 min. At the same time, a mixture of 200 mg of NHS and 30 mg of EDC was dissolved in 5 mL of 10× PBS buffer. The carboxyl group of PAA was activated by adding the PAA solution to the EDC/NHS mixture for 30 min. Then the nanorod-NH2 were added to the PAA mixture and was left to react for 1 h. Finally, the PAA-mesoporous silica nanorods were centrifuged and washed with water three times.Fluorescence-labelled nanoparticles: the polyacrylic acid conjugated nanorods were labelled with Cy5.5-hydrazine via crosslinking with amine groups on the fluorescent dyes and carboxyl groups on the polyacrylic acid. The EDC coupling reaction conditions were the same as those used for the conjugation of polyacrylic acid.
Drug(s)-loading into mesoporous silica nanorods
Hydroxychloroquine (HCQ) sulphate was loaded according to ref. 28. Briefly, 0.3 mg of HCQ was dissolved in 1.5 mL PBS buffer at pH 7.4 containing 5 mg of nanorod-Cy5.5 and stirred for 48 h at 25 °C. Then, the final product was washed with PBS buffer, pH 7.4. HCQ-loaded nanorod-Cy5.5 (HCQ-NR-Cy5.5) was stored in PBS buffer, pH 7.4.Doxorubicin (DOX) hydrochloride was loaded according to ref. 50. Briefly 0.1 mg of DOX was dissolved in 1.5 mL PBS buffer, pH 7.4, containing 5 mg of nanorod-Cy5.5 and stirred for 48 h at 25 °C. Then, the final product was washed with PBS buffer, pH 7.4. DOX-loaded nanorod-Cy5.5 (HCQ-NR-Cy5.5) was stored in PBS buffer, pH 7.4.
HCQ and DOX were co-loaded into nanorods through the following steps. 0.15 mg of HCQ and 0.05 mg of DOX were dissolved in 1.5 mL PBS buffer, pH 7.4, containing 5 mg of nanorod-Cy5.5 and stirred for 48 h at 25 °C. Then, the final product was washed with PBS buffer, pH 7.4. HCQ and DOX-loaded nanorod-Cy5.5 (HCQ & DOX-NR-Cy5.5) was stored in PBS buffer, pH 7.4.
The measurement of drug loading efficiency
The measurements were conducted according to ref. 33.To determine the amount of drugs loaded into the nanorods, the UV-vis absorbance of HCQ and DOX solutions before and after loading into the nanorods was measured by using a UV-vis spectrophotometer for absorption at 342 nm for HCQ and 480 nm for DOX.
Stimulated drug release
Drug release studies were conducted according to ref. 32. Drug-loaded nanorods prepared above were dispersed in 20 mL of PBS buffer, pH 5.8 and pH 7.4. Subsequently, 2 mL of the supernatant was taken periodically from the suspension at 25 °C followed by centrifugation (9000 rpm, 5 min).Measurement of drug release
The release of drugs from the nanorods to PBS buffer at pH 7.4 and 5.8 was determined by using a UV-vis spectrophotometer for absorption at 342 nm for HCQ and 480 nm for DOX.Cell preparation
MCF-7 cells (confirmed to be mycoplasma negative) were grown in high glucose DMEM (Dulbecco's Modified Eagle's medium) medium from Invitrogen, supplemented with 10% fetal bovine serum, 5 mL of Pen-Strep and HEPES at 37 °C and in 5% CO2. MCF-10A cells (confirmed to be mycoplasma negative) were grown in HuMEC ready medium, which contains HuMEC basal serum free medium, HuMEC supplement, and bovine pituitary extract from Invitrogen at 37 °C, and in 5% CO2. PANC-1 cells (confirmed to be mycoplasma negative) were grown in DMEM medium containing 10% fetal bovine serum and L-glutamine (2 mM) as previously described.51 For live imaging, the MCF-7 or MCF-10A cells were plated 24 h before experiments onto 35 mm glass-bottomed dishes (No. 1 0.17 mm thickness). The passage number of MCF10A and MCF7 cells in the experiments was always smaller than 20 and 30, respectively. Antibiotics were applied in media of both MCF10A and MCF7.The microscopy measurements were performed on a Zeiss LSM780 Quasar laser scanning microscope. Cy5.5 was excited with the 633 nm emission line of a helium-neon laser. The cells were incubated under the conditions of 37 °C with 5% CO2 during line scan acquisition. For visualizing the Cy5.5-modified nanorod, Cy5.5 was measured sequentially in the ∼730 nm emission range.
| Component | Data |
|---|---|
| Materials characterization | |
| Synthesis | See the Methods section |
| Composition | Silica |
| Size | 180 × 68 nm |
| Shape | Rod |
| Zeta potential | −31.4 mV |
| Labelling | Cy5.5 |
| Targeting | Passively targeted |
![[thin space (1/6-em)]](https://www.rsc.org/images/entities/char_2009.gif) |
|
| Biological characterization | |
| Cell seeding | See the Methods section |
| Cell line authentication | MCF7, MCF10A, and PANC-1 |
| Passage number | MCF7 < 30, MCF10A < 20, and PANC-1 < 30 |
| Mycoplasma testing | Yes |
| Background signal | per cell |
![[thin space (1/6-em)]](https://www.rsc.org/images/entities/char_2009.gif) |
|
| Experimental protocol details | |
| Culture dimensions | mL |
| Administered dose | 0.2 g mL−1 |
| Imaging details | See the Methods section |
| Signal of cells | Signal per time point |
| Data analysis | See the methods section |
Nanoparticle characterization and cell preparation followed the MIRIBEL guidelines (Table 1).52
Author contributions
J. J. G and K. G conceived the idea and supervised the research. V. T. C and J. J. G designed the study and developed the project. V. T. C performed the experiments. V. T. C, R. D. T, and J. J. G analyzed the data. P. A. P and G. S provided input to the experimental design with pancreatic cancer cells. V. T. C, and J. J. G wrote the paper with all authors reviewing the manuscript and providing feedback on the manuscript.Conflicts of interest
There are no conflicts to declare.Acknowledgements
J. J. G acknowledges funding from the ARC Centre of Excellence in Convergent Bio-Nano Science and Technology (CE140100036), the National Health and Medical Research Council Project grant (GNT11662385) and the NHMRC Investigator grant (APP1196648). We also acknowledge funding from the NHMRC (Ideas Grant, APP2002707, P. A. P, G. S.; Project grant, APP1144108, P. A. P) and the Cancer-Institute NSW (CDF, CDF181166, G. S.). V. T. C acknowledges the staff from the biomedical imaging facility (BMIF, UNSW), and electron microscope unit (EMU, UNSW) for their kind support.References
- M. Sousa de Almeida, E. Susnik, B. Drasler, P. Taladriz-Blanco, A. Petri-Fink and B. Rothen-Rutishauser, Chem. Soc. Rev., 2021, 50, 5397–5434 RSC.
- W. Wang, K. Gaus, R. D. Tilley and J. J. Gooding, Mater. Horiz., 2019, 6, 1538–1547 RSC.
- V. T. Cong, W. Wang, R. D. Tilley, G. Sharbeen, P. A. Phillips, K. Gaus and J. J. Gooding, Adv. Funct. Mater., 2021, 31, 2007880 CrossRef CAS.
- C. Kinnear, T. L. Moore, L. Rodriguez-Lorenzo, B. Rothen-Rutishauser and A. Petri-Fink, Chem. Rev., 2017, 117, 11476–11521 CrossRef CAS PubMed.
- J. J. Rennick, A. P. R. Johnston and R. G. Parton, Nat. Nanotechnol., 2021, 16, 266–276 CrossRef CAS PubMed.
- W. Yao, J. L. Rose, W. Wang, S. Seth, H. Jiang, A. Taguchi, J. Liu, L. Yan, A. Kapoor, P. Hou, Z. Chen, Q. Wang, L. Nezi, Z. Xu, J. Yao, B. Hu, P. F. Pettazzoni, I. L. Ho, N. Feng, V. Ramamoorthy, S. Jiang, P. Deng, G. J. Ma, P. Den, Z. Tan, S. X. Zhang, H. Wang, Y. A. Wang, A. K. Deem, J. B. Fleming, A. Carugo, T. P. Heffernan, A. Maitra, A. Viale, H. Ying, S. Hanash, R. A. DePinho and G. F. Draetta, Nature, 2019, 568, 410–414 CrossRef CAS PubMed.
- C. Commisso, S. M. Davidson, R. G. Soydaner-Azeloglu, S. J. Parker, J. J. Kamphorst, S. Hackett, E. Grabocka, M. Nofal, J. A. Drebin, C. B. Thompson, J. D. Rabinowitz, C. M. Metallo, M. G. Vander Heiden and D. Bar-Sagi, Nature, 2013, 497, 633–637 CrossRef CAS PubMed.
- V. Jayashankar and A. L. Edinger, Nat. Commun., 2020, 11, 1121 CrossRef PubMed.
- V. T. Cong, K. Gaus, R. D. Tilley and J. J. Gooding, Expert Opin. Drug Delivery, 2018, 15, 881–892 CrossRef CAS PubMed.
- H. Meng, S. Yang, Z. Li, T. Xia, J. Chen, Z. Ji, H. Zhang, X. Wang, S. Lin, C. Huang, Z. H. Zhou, J. I. Zink and A. E. Nel, ACS Nano, 2011, 5, 4434–4447 CrossRef CAS PubMed.
- G. Jiang, H. Chen, J. Huang, Q. Song, Y. Chen, X. Gu, Z. Jiang, Y. Huang, Y. Lin, J. Feng, J. Jiang, Y. Bao, G. Zheng, J. Chen, H. Chen and X. Gao, Adv. Sci., 2020, 7, 1903290 CrossRef CAS PubMed.
- J. L. Huang, G. Jiang, Q. X. Song, X. Gu, M. Hu, X. L. Wang, H. H. Song, L. P. Chen, Y. Y. Lin, D. Jiang, J. Chen, J. F. Feng, Y. M. Qiu, J. Y. Jiang, X. G. Jiang, H. Z. Chen and X. L. Gao, Nat. Commun., 2017, 8, 15144 CrossRef PubMed.
- A. S. Desai, M. R. Hunter and A. N. Kapustin, Philos. Trans. R. Soc., B, 2019, 374, 20180156 CrossRef CAS PubMed.
- R. Li, T. S. C. Ng, S. J. Wang, M. Prytyskach, C. B. Rodell, H. Mikula, R. H. Kohler, M. A. Garlin, D. A. Lauffenburger, S. Parangi, D. M. Dinulescu, N. Bardeesy, R. Weissleder and M. A. Miller, Nat. Nanotechnol., 2021, 16, 830–839 CrossRef CAS PubMed.
- J. L. Stow, Y. Hung and A. A. Wall, Curr. Opin. Cell Biol., 2020, 65, 131–140 CrossRef CAS PubMed.
- J. V. V. Arafiles, H. Hirose, M. Akishiba, S. Tsuji, M. Imanishi and S. Futaki, Bioconjugate Chem., 2020, 31, 547–553 CrossRef CAS PubMed.
- L. Li, W. S. Xi, Q. Su, Y. Li, G. H. Yan, Y. Liu, H. Wang and A. Cao, Small, 2019, 15, e1901687 CrossRef PubMed.
- J. Gilleron, W. Querbes, A. Zeigerer, A. Borodovsky, G. Marsico, U. Schubert, K. Manygoats, S. Seifert, C. Andree, M. Stoter, H. Epstein-Barash, L. Zhang, V. Koteliansky, K. Fitzgerald, E. Fava, M. Bickle, Y. Kalaidzidis, A. Akinc, M. Maier and M. Zerial, Nat. Biotechnol., 2013, 31, 638–646 CrossRef CAS PubMed.
- G. Sahay, W. Querbes, C. Alabi, A. Eltoukhy, S. Sarkar, C. Zurenko, E. Karagiannis, K. Love, D. Chen, R. Zoncu, Y. Buganim, A. Schroeder, R. Langer and D. G. Anderson, Nat. Biotechnol., 2013, 31, 653–658 CrossRef CAS PubMed.
- H. Du Rietz, H. Hedlund, S. Wilhelmson, P. Nordenfelt and A. Wittrup, Nat. Commun., 2020, 11, 1809 CrossRef CAS PubMed.
- T. Y. Hu, M. Frieman and J. Wolfram, Nat. Nanotechnol., 2020, 15, 247–249 CrossRef CAS PubMed.
- M. Kaksonen and A. Roux, Nat. Rev. Mol. Cell Biol., 2018, 19, 313–326 CrossRef CAS PubMed.
- Y. Wang, K. Shi, L. Zhang, G. Hu, J. Wan, J. Tang, S. Yin, J. Duan, M. Qin, N. Wang, D. Xie, X. Gao, H. Gao, Z. Zhang and Q. He, Autophagy, 2016, 12, 949–962 CrossRef CAS PubMed.
- S. Naghipour, M. Ghodousi, S. Rahsepar and S. Elyasi, Expert Rev. Anti-Infect. Ther., 2020, 18, 1119–1133 CrossRef CAS PubMed.
- D. M. Stevens, R. M. Crist and S. T. Stern, Molecules, 2021, 26, 175 CrossRef CAS PubMed.
- J. Pelt, S. Busatto, M. Ferrari, E. A. Thompson, K. Mody and J. Wolfram, Pharmacol. Ther., 2018, 191, 43–49 CrossRef CAS PubMed.
- J. Wolfram, S. Nizzero, H. Liu, F. Li, G. Zhang, Z. Li, H. Shen, E. Blanco and M. Ferrari, Sci. Rep., 2017, 7, 13738 CrossRef PubMed.
- Y. Li, M. H. Cho, S. S. Lee, D. E. Lee, H. Cheong and Y. Choi, J. Controlled Release, 2020, 325, 100–110 CrossRef CAS PubMed.
- F. Perche, Y. Yi, L. Hespel, P. Mi, A. Dirisala, H. Cabral, K. Miyata and K. Kataoka, Biomaterials, 2016, 90, 62–71 CrossRef CAS PubMed.
- R. Xu, Z. Ji, C. Xu and J. Zhu, Medicine, 2018, 97, e12912 CrossRef CAS PubMed.
- R. A. Barnard, L. A. Wittenburg, R. K. Amaravadi, D. L. Gustafson, A. Thorburn and D. H. Thamm, Autophagy, 2014, 10, 1415–1425 CrossRef CAS PubMed.
- X. Chen, A. H. Soeriyadi, X. Lu, S. M. Sagnella, M. Kavallaris and J. J. Gooding, Adv. Funct. Mater., 2014, 24, 6999–7006 CrossRef CAS.
- Y. You, L. He, B. Ma and T. Chen, Adv. Funct. Mater., 2017, 27, 1703313 CrossRef.
- M. J. Mitchell, M. M. Billingsley, R. M. Haley, M. E. Wechsler, N. A. Peppas and R. Langer, Nat. Rev. Drug Discovery, 2021, 20, 101–124 CrossRef CAS PubMed.
- P. M. Thu, Z. G. Zheng, Y. P. Zhou, Y. Y. Wang, X. Zhang, D. Jing, H. M. Cheng, J. Li, P. Li and X. Xu, Eur. J. Pharmacol., 2019, 850, 23–34 CrossRef CAS PubMed.
- Q. Yin, A. Pan, B. Chen, Z. Wang, M. Tang, Y. Yan, Y. Wang, H. Xia, W. Chen, H. Du, M. Chen, C. Fu, Y. Wang, X. Yuan, Z. Lu, Q. Zhang and Y. Wang, Nat. Commun., 2021, 12, 2385 CrossRef CAS PubMed.
- M. J. Munson, G. O'Driscoll, A. M. Silva, E. Lazaro-Ibanez, A. Gallud, J. T. Wilson, A. Collen, E. K. Esbjorner and A. Sabirsh, Commun. Biol., 2021, 4, 211 CrossRef CAS PubMed.
- M. P. Dobay, A. Schmidt, E. Mendoza, T. Bein and J. O. Radler, Nano Lett., 2013, 13, 1047–1052 CrossRef CAS PubMed.
- D. E. Johnson, P. Ostrowski, V. Jaumouille and S. Grinstein, J. Cell Biol., 2016, 212, 677–692 CrossRef CAS PubMed.
- J. Pu, C. M. Guardia, T. Keren-Kaplan and J. S. Bonifacino, J. Cell Sci., 2016, 129, 4329–4339 CAS.
- L. M. P. Vermeulen, T. Brans, S. K. Samal, P. Dubruel, J. Demeester, S. C. De Smedt, K. Remaut and K. Braeckmans, ACS Nano, 2018, 12, 2332–2345 CrossRef CAS PubMed.
- L. Sasso, L. Purdie, A. Grabowska, A. T. Jones and C. Alexander, J. Interdiscip. Nanomed., 2018, 3, 67–81 CrossRef CAS.
- M. Borkowska, M. Siek, D. V. Kolygina, Y. I. Sobolev, S. Lach, S. Kumar, Y. K. Cho, K. Kandere-Grzybowska and B. A. Grzybowski, Nat. Nanotechnol., 2020, 15, 331–341 CrossRef CAS PubMed.
- Y. Qi, H. Min, A. Mujeeb, Y. Zhang, X. Han, X. Zhao, G. J. Anderson, Y. Zhao and G. Nie, ACS Appl. Mater. Interfaces, 2018, 10, 6972–6981 CrossRef CAS PubMed.
- B. Wang, J. Wang, J. Shao, P. H. J. Kouwer, E. M. Bronkhorst, J. A. Jansen, X. F. Walboomers and F. Yang, J. Controlled Release, 2020, 324, 134–145 CrossRef CAS PubMed.
- C. Deng, Q. Zhang, M. Jia, J. Zhao, X. Sun, T. Gong and Z. Zhang, Adv. Sci., 2019, 6, 1801868 CrossRef PubMed.
- S. G. Antimisiaris, A. Marazioti, M. Kannavou, E. Natsaridis, F. Gkartziou, G. Kogkos and S. Mourtas, Adv. Drug Delivery Rev., 2021, 174, 53–86 CrossRef CAS PubMed.
- S. W. Lee, Y. Zhang, M. Jung, N. Cruz, B. Alas and C. Commisso, Dev. Cell, 2019, 50, 381–392 CrossRef CAS PubMed.
- N. Zheng, J. Li, C. Xu, L. Xu, S. Li and L. Xu, Artif. Cells, Nanomed., Biotechnol., 2018, 46, 1132–1140 CrossRef CAS PubMed.
- L. Yuan, Q. Tang, D. Yang, J. Z. Zhang, F. Zhang and J. Hu, J. Phys. Chem. C, 2011, 115, 9926–9932 CrossRef CAS.
- G. Sharbeen, J. A. McCarroll, A. Akerman, C. Kopecky, J. Youkhana, J. Kokkinos, J. Holst, C. Boyer, M. Erkan, D. Goldstein, P. Timpson, T. R. Cox, B. A. Pereira, J. L. Chitty, S. K. Fey, A. K. Najumudeen, A. D. Campbell, O. J. Sansom, R. M. C. Ignacio, S. Naim, J. Liu, N. Russia, J. Lee, A. Chou, A. Johns, A. J. Gill, E. Gonzales-Aloy, V. Gebski, Y. F. Guan, M. Pajic, N. Turner, M. V. Apte, T. P. Davis, J. P. Morton, K. S. Haghighi, J. Kasparian, B. J. McLean, Y. F. Setargew, P. A. Phillips and I. Australian Pancreatic Cancer Genome, Cancer Res., 2021, 81, 3461–3479 CrossRef CAS PubMed.
- M. Faria, M. Bjornmalm, K. J. Thurecht, S. J. Kent, R. G. Parton, M. Kavallaris, A. P. R. Johnston, J. J. Gooding, S. R. Corrie, B. J. Boyd, P. Thordarson, A. K. Whittaker, M. M. Stevens, C. A. Prestidge, C. J. H. Porter, W. J. Parak, T. P. Davis, E. J. Crampin and F. Caruso, Nat. Nanotechnol., 2018, 13, 777–785 CrossRef CAS PubMed.
Footnotes |
| † Electronic supplementary information (ESI) available. See DOI: 10.1039/d1sc04656j |
| ‡ Deceased. |
| This journal is © The Royal Society of Chemistry 2021 |

