
 Open Access Article
 This Open Access Article is licensed under a Creative Commons Attribution-Non Commercial 3.0 Unported Licence
Stress response decay with aging visualized using a dual-channel logic-based fluorescent probe†
Jingye
Tian‡
 a,
Donglei
Shi‡
b,
Yanhui
Zhang‡
a,
Xiaokang
Li
b,
Xinming
Li
b,
Hao
Teng
a,
Tony D.
James
c,
Jian
Li
*b and
Yuan
Guo
*a
a,
Donglei
Shi‡
b,
Yanhui
Zhang‡
a,
Xiaokang
Li
b,
Xinming
Li
b,
Hao
Teng
a,
Tony D.
James
c,
Jian
Li
*b and
Yuan
Guo
*a
aKey Laboratory of Synthetic and Natural Functional Molecule of the Ministry of Education, College of Chemistry and Materials Science, Northwest University, Xi'an, 710127, China. E-mail: guoyuan@nwu.edu.cn
bState Key Laboratory of Bioreactor Engineering, Frontiers Science Center for Materiobiology and Dynamic Chemistry, School of Pharmacy, East China University of Science and Technology, 130 Mei Long Road, Shanghai, 200237, China. E-mail: jianli@ecust.edu.cn
cDepartment of Chemistry, University of Bath, Bath, BA2 7AY, UK
First published on 17th September 2021
Abstract
Diagnosing aging for preventative intervention generally relies on the tracking of aging biomarkers in the resting state. However, the static marker levels are insufficient to fully evaluate aging, particularly given that the stress response capacity (SRC) decay is currently viewed as a critical feature of aging. Therefore, we have developed a dual-channel fluorescent probe ROKS capable of the logic-based visualization of thiophenol (stressor) and HOCl (thiophenol-activated stress response product) in vivo, which provides a new strategy from the time dimension to precisely assess the SRC of individuals under stress using the dual-channel fluorescence ratio. Using ROKS we observed that the SRC of live cells decayed with senescence, and that a higher SRC was found for young vs. aged Caenorhabditis elegans. As such, our study offers a promising strategy for the fluorescence-guided diagnosis of aging and paves the way for accurate evaluation of the efficacy of anti-aging drugs.
Introduction
The progressive accumulation of senescent cells in tissues is believed to accelerate aging, which is the most serious risk factor for diseases in later life including osteoarthritis,1,2 atherosclerosis3,4 and cancer,5,6 hence detecting and quantifying this phenotype accurately is essential for understanding and improving preventive interventions for age-related diseases. Increased expression of some proteins, such as lysosomal β-galactosidase (β-gal),7,8 p16,9,10 p21,11,12 IL-6,13 γ-H2AX,14–16 macroH2A,17,18 phosphorylated p38 MAPK,19 Smurf2,20 or PGM21 as biomarkers have been used to define cellular senescence. While most research directed towards the detection of senescence and diagnosis of aging has focused on the levels of senescence-associated biomarkers in the resting state.22–25 Recent research suggests that the decay of redox-stress response capacity (SRC) is a substantive characteristic of senescence and young individuals exhibit an enhanced ability to generate reactive oxygen species (ROS).26 Despite the wide application of probes for senescence-associated biomarkers,27–31 to our knowledge, there is no report describing an optical probe for visualizing the stress process by tracking the stressor and related stress product in order to dynamically evaluate aging.Thiophenol (PhSH), a highly toxic chemical pollutant, has been shown in trace amounts to induce cellular oxidative stress by increasing the level of endogenous hypochlorous acid (HOCl, a ROS).32 Therefore, PhSH can be considered as a stressor and the generated HOCl as the stress product. Based on the above observations, tools capable of sequentially and logically identifying PhSH and HOCl are essential to help monitor the evolution of stress and assess the stress response capacity (SRC) in order to provide a precise evaluation of aging. So far, a variety of small-molecule based fluorescent probes for PhSH33–38 or HOCl39–46 have been successfully developed. While probes for the detection of these two analytes can be simply used together, the reliability of the results would be significantly reduced, due to signal cross-talk and the lack of intercalibration between the two probes.47 Conversely, a single dual-channel probe capable of the logic-based sensing of PhSH and HOCl could quantify the stress products generated during stimulation by a stressor in complex biological systems, which is essential for the visualization of the PhSH-induced oxidative stress process in order to facilitate the dynamic evaluation and precise diagnosis of aging.
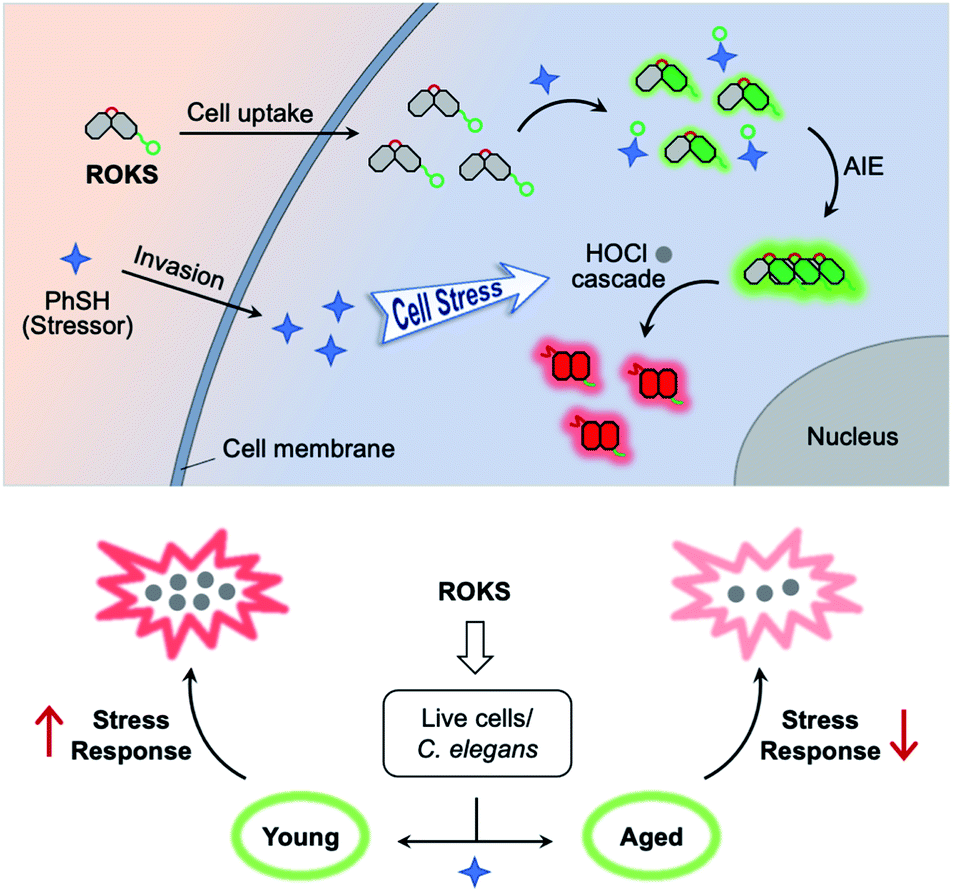
To address the above issues, we developed a sequentially activated and logic-based dual-channel fluorescent probe ROKS, which can be used for the sequential and logic-based detection of PhSH and HOCl during PhSH-induced oxidative stress in vivo. ROKS emits almost no fluorescence due to the strong donor photoinduced electron transfer (d-PeT) effect from its masking group, i.e., dinitrophenyl group. This group, which is also the recognition unit, can be selectively removed by PhSH, resulting in the accumulation of the green fluorophore ROCL which exhibits both excited-state intramolecular proton transfer (ESIPT) and aggregation-induced emission (AIE). The spiroring-closed structure of ROCL can be further oxidized and hydrolyzed by HOCl to the spiroring-open structure, which leads to extended conjugation resulting in a ratiometric signal change in fluorescence from green to red. Importantly, the dual-channel fluorescence ratio (IRed/IGreen) can be used to accurately assess the SRC of different individuals as it reflects the ratio of stress product to stressor. As such, the dynamic and accurate visual evaluation of aging in live cells and Caenorhabditis elegans (C. elegans) was successfully achieved by comparing the SRC (IRed/IGreen) using ROKS (Fig. 1).
 | ||
| Fig. 1 Schematic representation of working principle of ROKS in the dynamic evaluation of aging. | ||
Results and discussion
Design, synthesis, and characterization of the probe ROKS and control compounds ROCZ, ROZ and ROE
The synthesis starts with modification of the fluorophore ROB based on a hybrid of rhodol and 2-(2′-hydroxyphenyl) benzothiazole (HBT). For our purpose, the rhodol-HBT skeleton has favorable characteristics: it contains a phenolic hydroxy group on which a 2,4-dinitrophenyl can be installed as the PhSH-targeting and quenching group, its spironolactone moiety can be easily modified to a spirocyclic hydrazide as the HOCl-sensitive group, and most notably, it displays rhodol-emitting red fluorescence when present in the ring-open form, while the HBT-emitting green fluorescence is observed when present as the spirocyclic form. Therefore, our non-fluorescent ROKS with PhSH–HOCl logic-based recognition function was developed based on ROB using the green fluorophore ROCL sensitive to HOCl. Then, the spirocyclic hydrazide moiety of ROCL was modified to generate the spirocyclic acylhydrazone with acetone to provide the ring-locked control compound ROCZ insensitive to HOCl. While a 2,4-dinitrobenzyl group incorporated at the phenolic hydroxyl position of ROCZ to give another control compound ROZ which is ring-locked but sensitive to PhSH. Furthermore, an ethyl was introduced into the phenolic hydroxyl position of ROCL to construct a control compound ROE sensitive to HOCl but not to PhSH.The detailed synthetic routes for ROB, ROCL, ROKS, ROCZ, ROZ and ROE are given in Fig. 2A. The structures of the above compounds were characterized by NMR, HRMS and IR, and their absolute configurations were all confirmed by X-ray crystallography. The photophysical properties and spectra of all the above compounds are given in Fig. 2B and S1,† respectively. Interestingly, the solid powders of compounds ROCL and ROCZ exhibited intense yellow-green fluorescence with high fluorescence quantum yield (Φf = 0.513 for ROCL and Φf = 0.647 for ROCZ) (Fig. 3B and S12†), indicating that both of them exhibit AIE. Furthermore, the fluorescence emission behavior of ROCL and ROCZ in a mixed system of DMF/H2O over a wide range of water fractions was investigated (Fig. S2†). The fluorescence intensity of ROCL and ROCZ remains high at 470 nm in pure DMF and decreases rapidly with increasing water percentage from 0 to 70%. Then, when the water fraction was above 80%, an obvious emission peak appeared at 534 nm which is consistent with AIE. In addition, the observed dual emission phenomenon in a mixed system is a distinct feature of ESIPT.
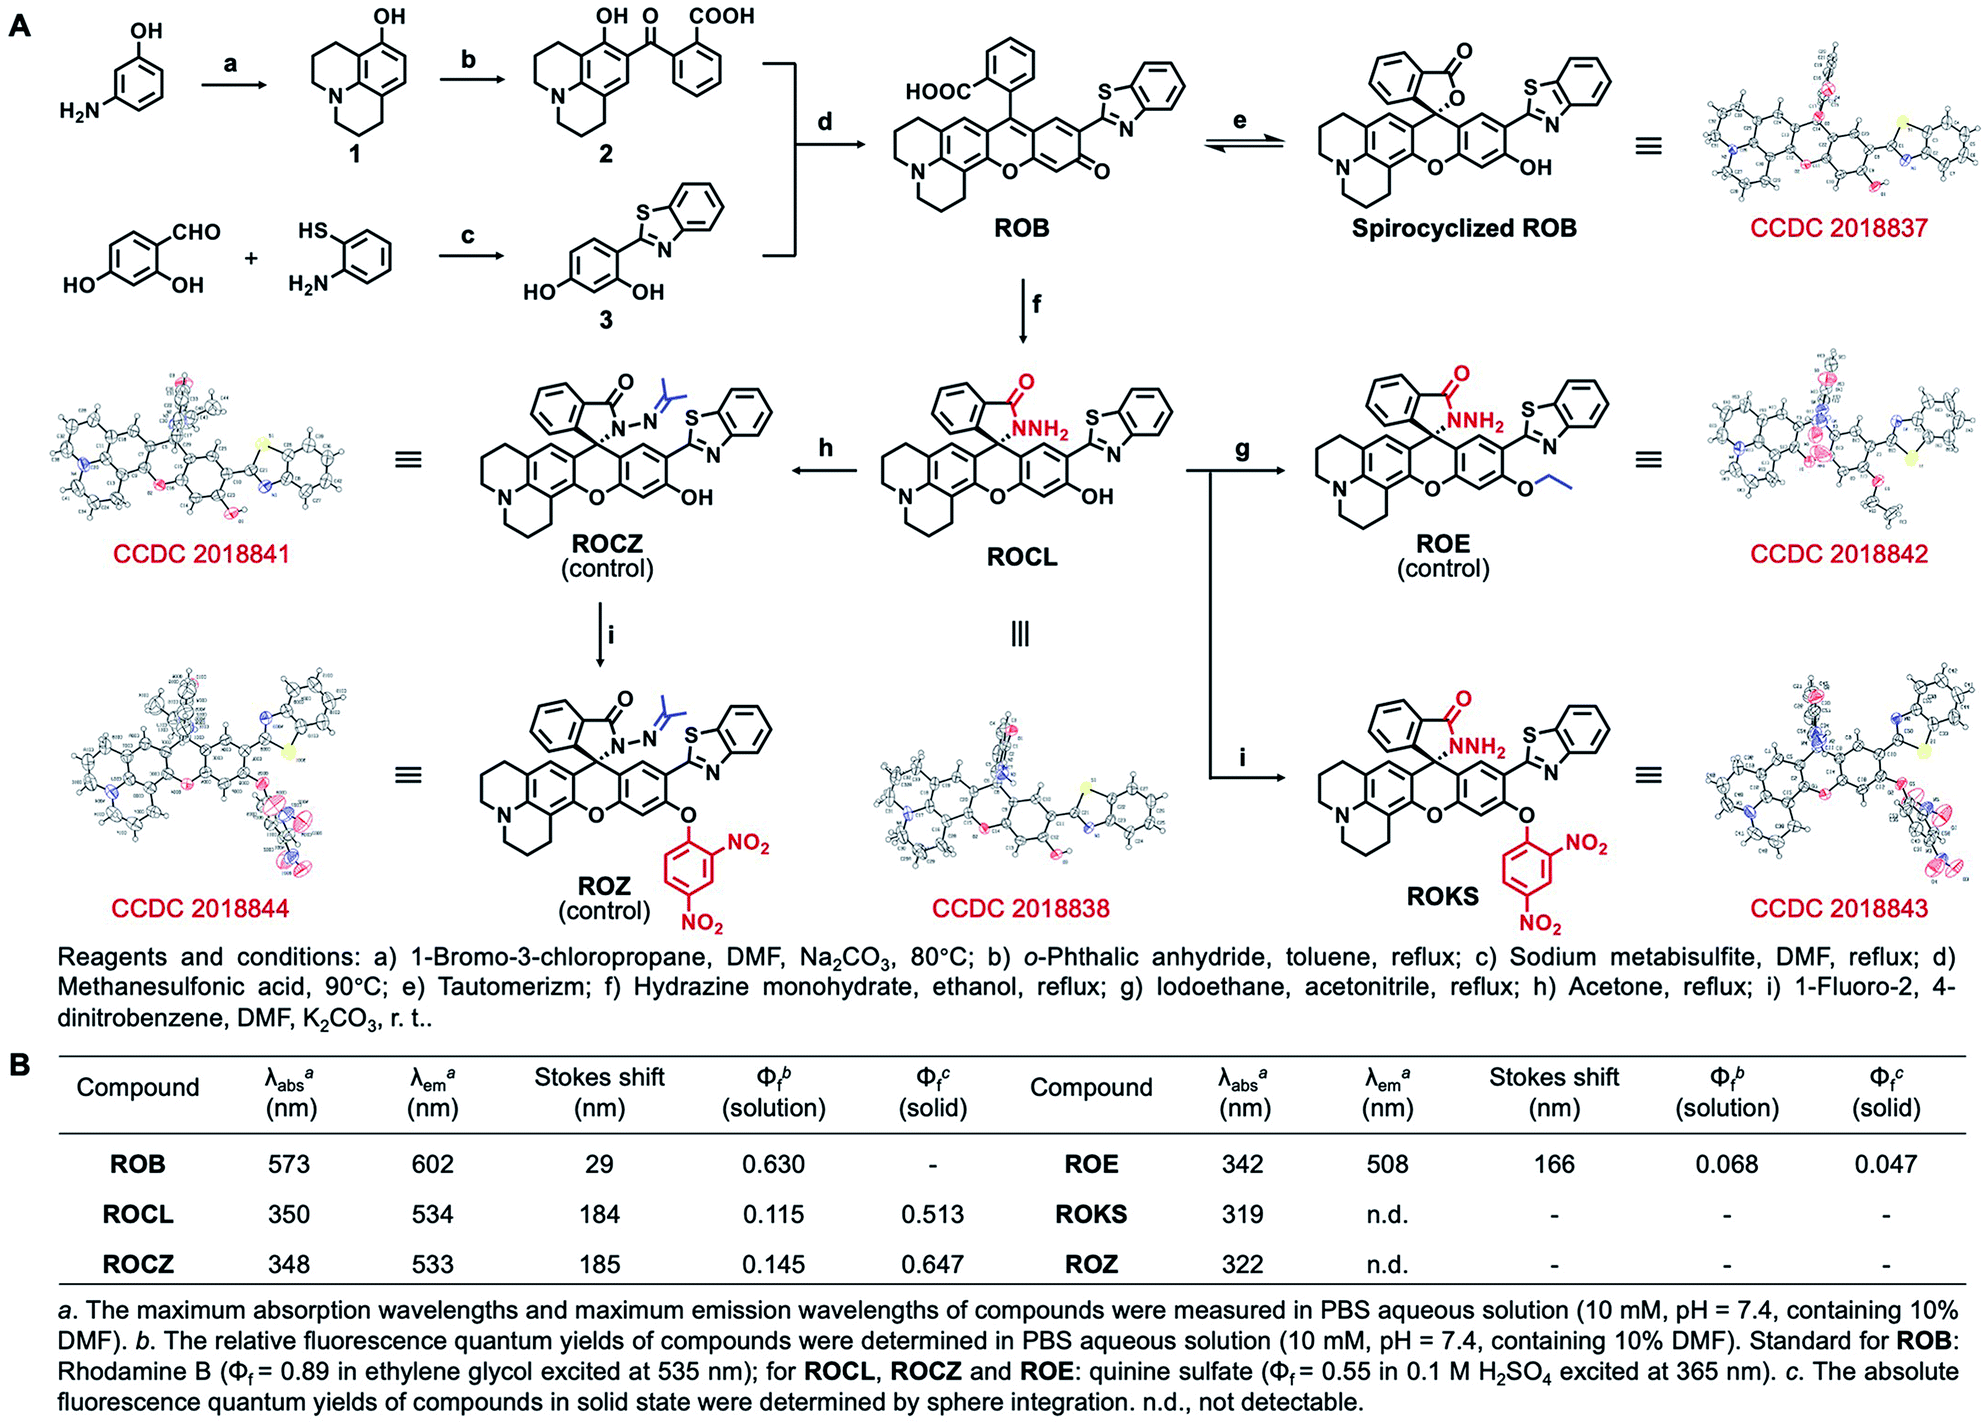 | ||
| Fig. 2 (A) Synthesis of compounds. (B) Photochemical properties of ROB, ROE, ROCL, ROKS, ROCZ and ROZ. | ||
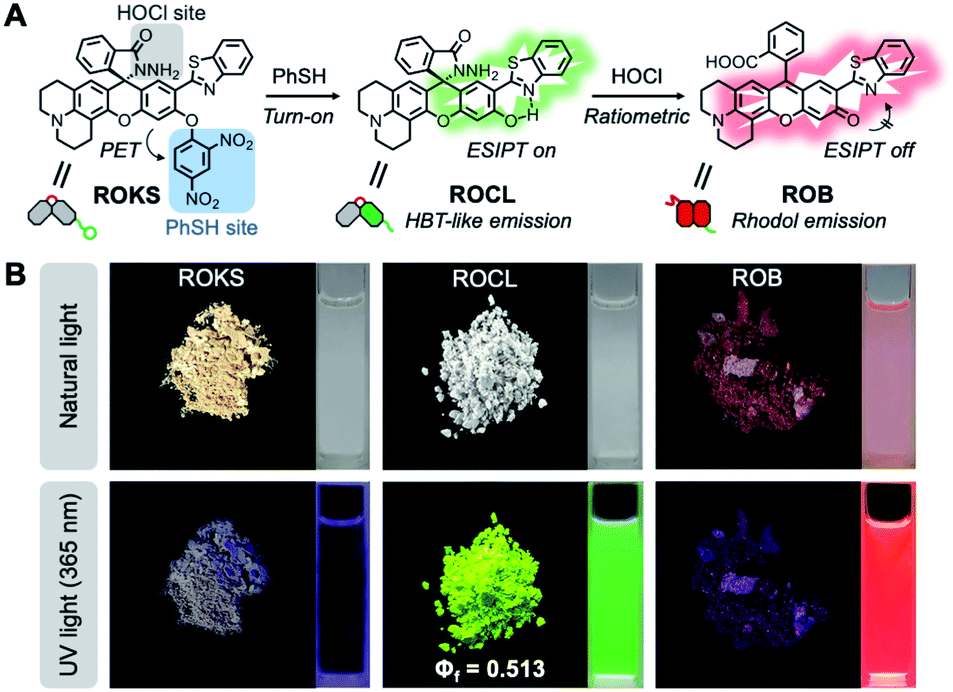 | ||
| Fig. 3 (A) Our dual-channel fluorescent probe ROKS for sequential and logical identification of PhSH and HOCl, and its reaction scheme. (B) Photographs of ROKS, ROCL and ROB in the solid state and PBS buffer solution (10 mM, pH = 7.4, containing 10% DMF) under natural light and UV light of 365 nm, respectively. | ||
Verifying the capability of the probe ROKS for sequential and logical identification of PhSH and HOCl in vitro
We then evaluated whether ROKS could achieve the logic-based sensing of PhSH and HOCl. The free probe initially exhibited no fluorescence, but an appreciable new emission peak at 534 nm was observed after reaction with PhSH (Fig. 4A). With the subsequent introduction of HOCl, the 534 nm emission peak disappeared accompanied by the appearance of a strong emission band at 602 nm (Fig. 4A). It should be noted that ROKS was inert to up to 100 μM of HOCl (Fig. 4C). ROKS remains silent after interacting with HOCl but not PhSH, as expected for a logic-based probe. The above results indicate that the logical recognition functions of ROKS are working as designed. In addition, the photostability of ROKS for the logical detection of PhSH and HOCl was evaluated. The results indicated that the fluorescence intensity of the detection system remained stable under continuous irradiation over 1 h (Fig. S3†), suggesting that ROKS possesses excellent photostability and is suitable for long-term imaging.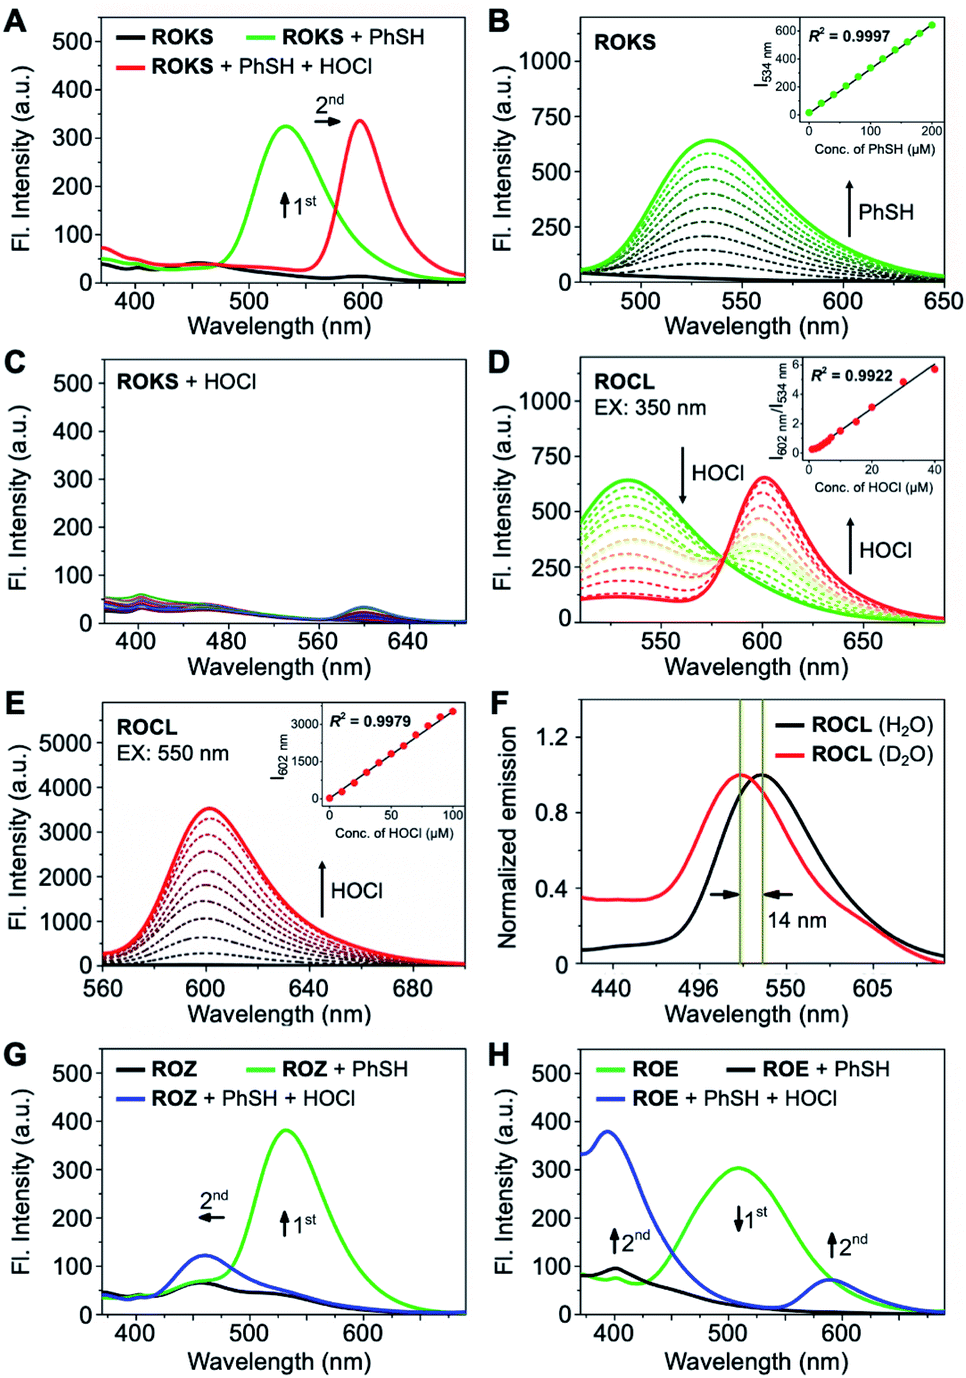 | ||
| Fig. 4 (A) Fluorescence spectra of ROKS (10 μM), the mixture of ROKS (10 μM) with PhSH (100 μM) and the mixture of ROKS (10 μM) with PhSH (100 μM) and HOCl (200 μM) in PBS buffer solution (10 mM, pH = 7.4, containing 10% DMF), λex = 350 nm. (B) Fluorescence spectra of ROKS (10 μM) upon addition of PhSH (0–200 μM), λex = 350 nm. Inset: the linear relationship between fluorescence intensity (I534 nm) and PhSH concentration. (C) Fluorescence spectra of ROKS (10 μM) upon addition of HOCl (0–100 μM), λex = 350 nm. (D) Fluorescence spectra of ROCL (10 μM) upon addition of HOCl (0–40 μM), λex = 350 nm. Inset: the linear relationship between fluorescence intensity ratio (I602 nm/I534 nm) and HOCl concentration. (E) Fluorescence spectra of ROCL (10 μM) upon addition of HOCl (0–100 μM), λex = 550 nm. Inset: the linear relationship between fluorescence intensity (I602 nm) and HOCl concentration. (F) Normalized emission spectra of ROCL (10 μM) in H2O and D2O, λex = 350 nm. (G) Fluorescence spectra of ROZ (10 μM), the mixture of ROZ (10 μM) with PhSH (100 μM) and the mixture of ROZ (10 μM) with PhSH (100 μM) and HOCl (200 μM) in PBS buffer solution (10 mM, pH = 7.4, containing 10% DMF), λex = 350 nm. (H) Fluorescence spectra of ROE (10 μM), the mixture of ROE (10 μM) with PhSH (100 μM) and the mixture of ROE (10 μM) with PhSH (100 μM) and HOCl (200 μM) in PBS buffer solution (10 mM, pH = 7.4, containing 10% DMF), λex = 350 nm. Slit widths: 2.5 nm/5.0 nm. | ||
Subsequently, the fluorescence spectra of the control compounds ROZ and ROE towards PhSH and HOCl were evaluated, respectively. There was no fluorescence for ROZ itself. However, after the addition of PhSH, an emission peak at 533 nm appeared. Similarly, when HOCl was added to the system, the emission peak at 533 nm disappeared and a weak emission peak appeared near 460 nm (Fig. 4G). For ROE, the obvious emission peak at 508 nm disappeared upon the addition of PhSH. While, with the introduction of HOCl, there was an obvious emission peak near 400 nm, and a weak emission peak was observed at 580 nm (Fig. 4H). The above results confirm the orthogonality of the two specific recognition groups triggered by PhSH and HOCl which will ensure the excellent logic-based detection capability of ROKS.
Spectroscopic response of the probe ROKS to PhSH and ROCL (the reaction product of ROKS with PhSH) to HOCl
The proposed sensing mechanism of ROKS for the logic-based sensing of PhSH and HOCl is given in Fig. 3A. ROKS exhibits no fluorescence because of the d-PeT process. To confirm the d-PeT-based quenching mechanism of ROKS, HOMO and LUMO energy levels of 1,3-dinitrobenzene and ROCL were determined using density functional theory (Table S1†). The LUMO energy level of 1,3-dinitrobenzene (−1.22 eV) was located between the HOMO and LUMO of ROCL (−5.10 eV, 1.10 eV) (Fig. S4†). This result indicates that the electrons in the LUMO level of ROCL tend to be accepted by the LUMO level of 1,3-dinitrobenzene rather than their own HOMO level, thus leading to fluorescence quenching in a d-PeT process. After treatment with PhSH, the 2,4-dinitrophenyl group of ROKS was removed through nucleophilic aromatic substitution, forming ROCL and turning-on the green fluorescence, which was ascribed to ESIPT. With subsequent addition of HOCl, the spirocyclic hydrazide of ROCL was opened to generate ROB which exhibits π–π* transitions for the xanthene conjugate, resulting in a ratiometric response from green to red. In order to demonstrate the probe mechanism, spectral analysis was performed. As shown in Fig. S5,† the normalized fluorescence emission and absorption spectra of ROCL almost overlap with that of a mixture of ROKS and PhSH, confirming that the reaction product of ROKS with PhSH is ROCL, while, the normalized fluorescence and absorption spectra of ROB almost overlap with a mixed solution of ROCL and HOCl (Fig. S5†), confirming that the reaction product of ROCL with HOCl is ROB. Subsequently, the HRMS titration experiments were performed to further confirm the proposed sensing mechanism (Fig. S6†). With the addition of PhSH to the ROKS solution, the signal peak at m/z 725.1780 corresponding to the [ROKS + H]+ disappeared and a new signal peak appeared at m/z 581.1688, which belongs to [ROCL + Na]+. In addition, after the introduction of HOCl into a ROCL solution, a new peak appeared at m/z 545.1590, which could be assigned to [ROB + H]+. Therefore, the fluorescence sensing mechanism proposed in Fig. 3A was verified. In addition, the emission spectra of ROCL exhibited a blueshift of 14 nm in D2O compared to H2O (Fig. 4F), indicating the existence of intramolecular hydrogen bonds in ROCL, which supports the ESIPT process with ROCL.Next, the absorption titration experiments of ROKS with PhSH were performed. The probe ROKS exhibited a maximum absorption at 319 nm (Fig. S7A†). However, after addition of PhSH to ROKS, the absorption maxima of ROKS shifted to 350 nm (Fig. S7A†). We also evaluated the concentration-dependent changes of ROKS towards PhSH using fluorescence spectra. ROKS exhibited negligible fluorescence due to d-PeT (Fig. 4B). However, upon the addition of the PhSH, a marked turn-on fluorescence signal at 534 nm was observed. The fluorescence intensity at 534 nm displayed a good linear correlation (R2 = 0.9997) towards PhSH concentrations (0–200 μM) and the limit of detection (LOD) was determined to be 84 nM. In addition, the reaction kinetics of ROKS to PhSH exhibited an enhancement of fluorescence intensity at 534 nm after the addition of PhSH and reached a maximum within 11 min (Fig. S8A†). Subsequently, absorption titrations with ROCL (the reaction product of ROKS with PhSH) towards HOCl were investigated. As shown in Fig. S7B,† an absorption maximum of ROCL at around 350 nm was observed in the absence of HOCl and the absorption maximum of ROCL was red-shifted from 350 to 573 nm in the presence of HOCl (Fig. S7B†). Upon the addition of HOCl (0–40 μM), the emission peak at 534 nm significantly decreased, accompanied with an increase of an emission peak at 602 nm (Fig. 4D). The ratiometric fluorescence intensity ratio (I602 nm/I534 nm) against HOCl concentrations exhibited an excellent linear relationship (R2 = 0.9922) and the LOD was determined to be 5 nM (Fig. 4D). Considering the application of biological imaging, the fluorescence response of ROCL to different concentrations of HOCl was repeated with an excitation wavelength of 550 nm. After the addition of HOCl, ROCL exhibited a 190-fold fluorescence enhancement at 602 nm with excellent linear correlation (R2 = 0.9979) (Fig. 4E). We also evaluated the reaction kinetics between ROCL and HOCl and the results exhibited that ROCL reacts with HOCl completely within 26 s (Fig. S8B†). These results indicated that ROKS could be used for quantitative determination of PhSH and HOCl, respectively.
The pH-dependent fluorescent responses of ROKS towards PhSH and ROCL towards HOCl were evaluated, respectively. It was found that ROKS and ROCL were stable at over a pH range of from 3–11 (Fig. S9†). Better still, ROKS exhibited a good response to PhSH at pH ranging from 6 to 9 and ROCL displayed a good response to HOCl over a pH range from 5 to 8 (Fig. S9†). We then carried out individually selectivity studies for ROKS and ROCL. As shown in Fig. S10A,† after the addition of different analytes, ROKS exhibits a significant fluorescence enhancement in the presence of PhSH, whereas other analytes did not induce any apparent fluorescence changes. Notably, the biothiols (Cys, GSH and Hcy) with similar chemical properties hardly caused changes in the fluorescence signals even if the reaction time was extended to 2 h, indicating the excellent capability of ROKS to discriminate PhSH from biothiols. In addition, the fluorescence of ROCL did not change significantly in the presence of other analytes apart from HOCl (Fig. S10B†). Concomitantly, competition assays of ROKS and ROCL were carried out and the results indicated that there was no change in the fluorescence intensities with the coexistence of other interfering species (Fig. S10†). All the above results clearly indicated that ROKS exhibits high specificity and with no interference in complex environments, which will facilitate the logic-based detection of PhSH and HOCl under physiological conditions.
Verifying the capability of the probe ROKS for sequential and logical identification of PhSH and HOCl in cells
Encouraged by the results of the in vitro analyses experiments, we then evaluated the feasibility of using ROKS for the logic-based sensing of PhSH and HOCl in live cells. Prior to cell imaging, the cytotoxicity of ROKS and ROCL (the reaction product of ROKS with PhSH) were investigated using a standard CCK-8 assay and the results indicated negligible cytotoxicity of the two compounds at concentrations from 0–50 μM (Fig. S11†). We then examined the feasibility of the ROCL to detect endogenous HOCl. It is well known the lipopolysaccharide (LPS) can stimulate cells to produce ROS including HOCl.48–50 It can be seen from Fig. S13,† without LPS stimulation, HepG2 cells stained by ROCL exhibited negligible fluorescence in the red channel. However, with prolonged LPS treatment time, the fluorescence intensity of HepG2 cells incubated with ROCL displayed a time-dependent enhancement in the red channel (Fig. 5A and C). To eliminate interference from other ROS, the imaging of endogenous HOCl was investigated using ROCL in HepG2 cells stimulated using zymosan, a selective HOCl generating agent.51 Consistent with the imaging results of LPS-stimulated cells, a time-dependent fluorescence increase was observed in the red channel for zymosan-stimulated cells (Fig. S14†). The above results indicated that ROCL can selectively detect endogenous HOCl. Subsequently, the ring-locked control compound ROCZ was used to image endogenous HOCl in LPS-stimulated HepG2 cells. As expected, no significant fluorescence intensity change was observed in the red channel (Fig. S15†), which confirms that the spirocyclic hydrazide was the recognition site of HOCl. To confirm the feasibility of PhSH as a chemical stressor, ROCL was then used to detect endogenous HOCl in PhSH-stimulated HepG2 cells. As shown in Fig. 5B and D, the time-dependent fluorescence enhancement in the red channel was observed upon treatment with PhSH, indicating that PhSH could indeed stimulate the cells to produce endogenous HOCl. Next, we used the control compound ROZ without HOCl-sensing group to verify the reliability of the 2,4-dinitrophenyl moiety as a sensing group for PhSH. As shown in the Fig. 5E–G, the fluorescence intensity in green channel was enhanced and that in red channel exhibited no obvious change after adding PhSH, proving that the 2,4-dinitrophenyl group was sensitive to PhSH. Furthermore, we used fixed HepG2 cells without stress response to observe the logic-based response of ROKS to the two analytes. These cells incubated with ROKS displayed weak fluorescence in the green channel and negligible fluorescence in the red channel (Fig. S16†). With the addition of PhSH an obvious fluorescence enhancement was observed in the green channel, and there was no significant change in the red channel (Fig. S16†). While, with the further addition of HOCl, the fluorescence signal in the red channel increased significantly, accompanied by a decrease of fluorescence signal in the green channel (Fig. S16†), which is consistent with the results presented in Fig. 4A. All the above results confirm the validity of our design strategy for ROKS using a rational combination of PhSH and HOCl recognition sites. Where ROKS is capable of the sequential and logical detection of PhSH (stressor) and HOCl (stress product).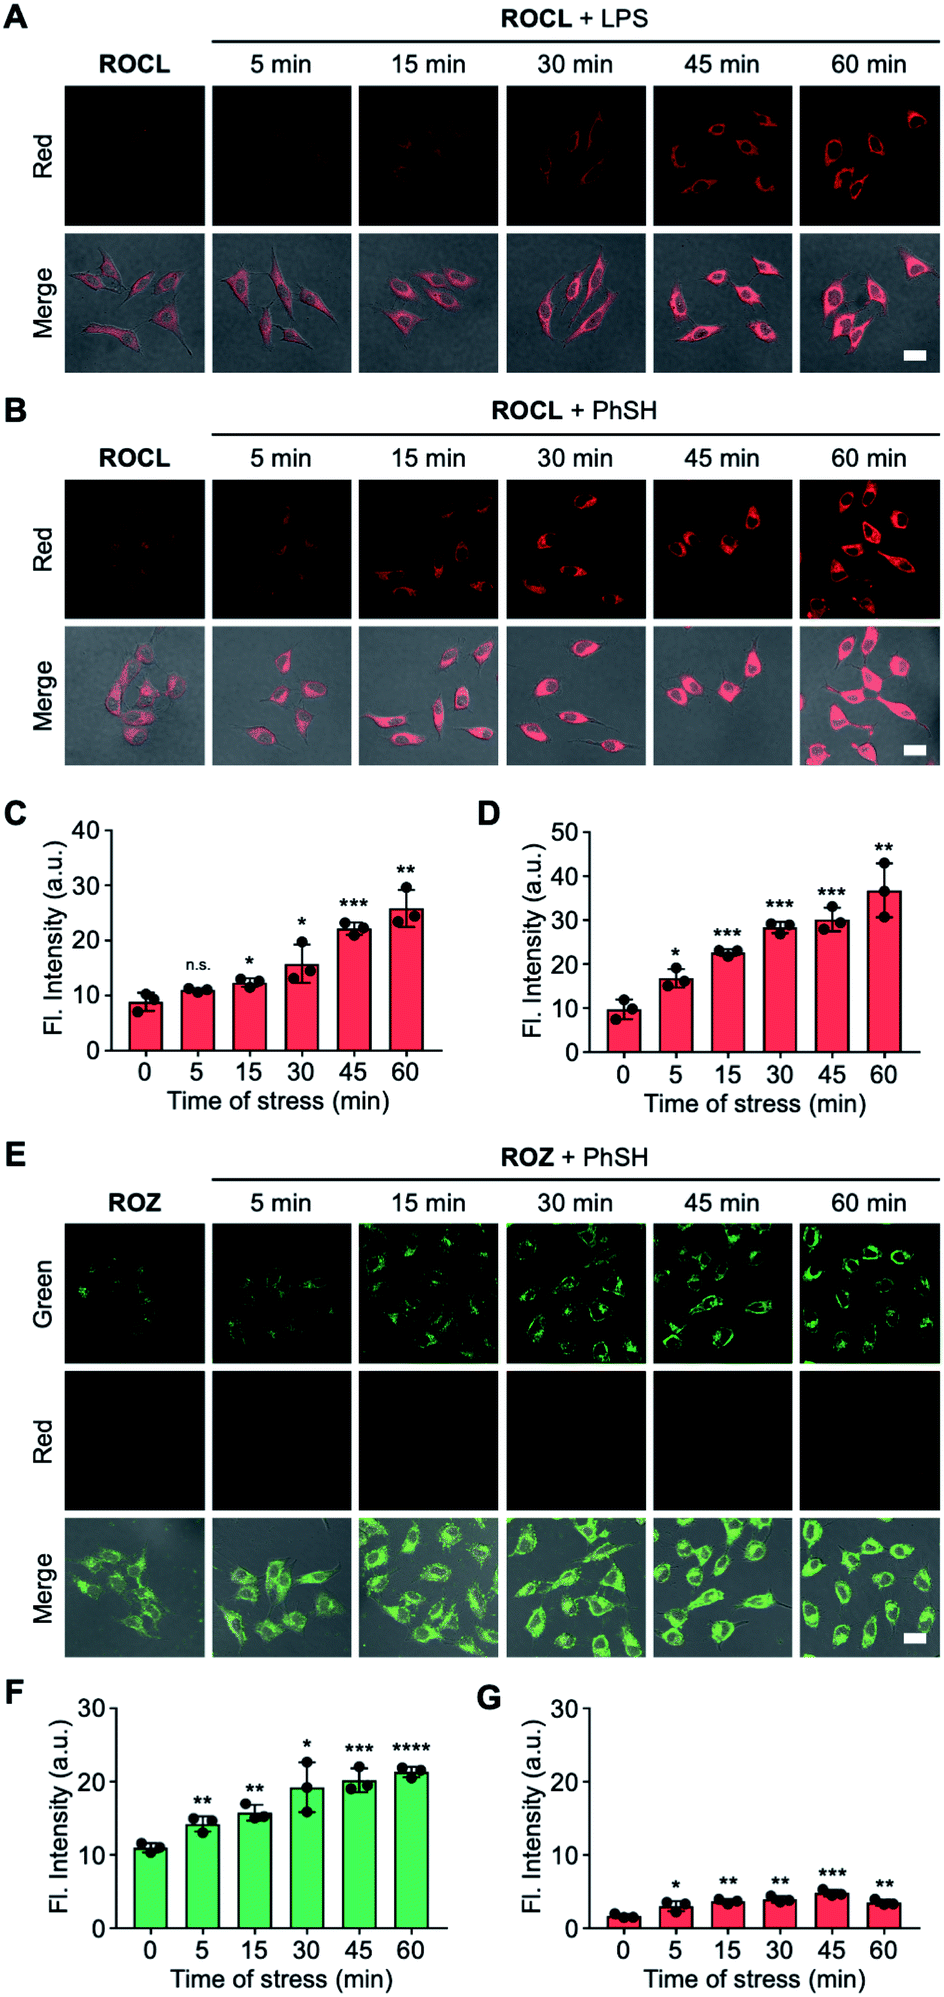 | ||
| Fig. 5 (A) Representative confocal fluorescence images from HepG2 cells treated with ROCL (30 μM, 30 min) and then stimulated with LPS (1 μg mL−1) for different times (0, 5, 15, 30, 45 and 60 min). (B) Representative confocal fluorescence images from HepG2 cells incubated with ROCL (30 μM, 30 min) and then stimulated with PhSH (10 μM) for different times (0, 5, 15, 30, 45 and 60 min). (C) Average fluorescence intensity in the red channel from parallel images including (A). (D) Average fluorescence intensity in the red channel from parallel images including (B). (E) Representative confocal fluorescence images from HepG2 cells stained with ROZ (30 μM, 30 min) and then stimulated with PhSH (40 μM) for different times (0, 5, 15, 30, 45 and 60 min). (F and G) Average fluorescence intensity in the green channel (F) and red channel (G) from parallel images including (E). Scale bar: 25 μm. Green channel for PhSH: λex = 488 nm, λem = 500–550 nm; red channel for HOCl: λex = 561 nm, λem = 570–620 nm. Error bars are represented as the standard deviation (±S. D.) with n = 3. The number of dots represents that of samples. Significant differences (n. s., not significant, *P < 0.05, **P < 0.01, ***P < 0.001, ****P < 0.0001) are analyzed with two-sided Student's t-test. | ||
Dynamically tracking senescence of cells by the SRC-based strategy
Then, SRC was evaluated using the dual-channel fluorescent probe ROKS with young cells and senescent cells. XL413, an effective DNA-replication kinase inhibitor,52 was used to induce senescence selectively in liver cancer cells including HepG2 cells. Thus, HepG2 cells (passage 8, P8) and XL413-treated HepG2 cells (passage 30, P30) were selected as the young cell model and the senescent cell model, respectively. The X-gal assay, a common method for detecting the senescence marker SA-β-gal,53 was used to confirm the senescence state of the HepG2 cells treated with XL413 (Fig. 6K). Meanwhile, to further verify the senescence state, the overexpression of another senescence marker γ-H2AX was verified using XL413-treated HepG2 cells and a western blot assay (Fig. 6E). Under the stimulation of PhSH, HepG2 cells treated with or without XL413 for different times were imaged after staining with ROKS. It can be seen from Fig. 6A–D and E–G, HepG2 cells (P8) and XL413-treated HepG2 cells (P30) exhibited a time-dependent change in the green channel and the red channel, indicating that the HOCl accumulation levels are different between young cells and senescent cells when stimulated with PhSH, which indicates that cells at different stages of senescence exhibit different SRC. To compare the SRC in more detail, the dual-channel fluorescence ratio (IRed/IGreen) was used to accurately quantify the SRC of different individuals since it reflects the ratio of stress product (HOCl) to stressor (PhSH). From Fig. 6J, without adding PhSH, the fluorescence ratio (IRed/IGreen) in HepG2 cells (P30) treated with XL413 for 5 days is the highest, while that in HepG2 cells (P8) is the lowest, which indicates that the accumulated level of HOCl in senescent cells is higher than that in young cells in the resting state. However, with an increase of PhSH stimulation time, the fluorescence ratio (IRed/IGreen) in HepG2 cells (P30) treated with XL413 for 3 days or 5 days decreased slowly, but that in HepG2 cells (P8) increased rapidly within 15 min and then leveled off. The above results confirmed that the SRC of young cells is higher than that in senescent cells under the stimulation of a stressor and that SRC is reduced with the progression of senescence.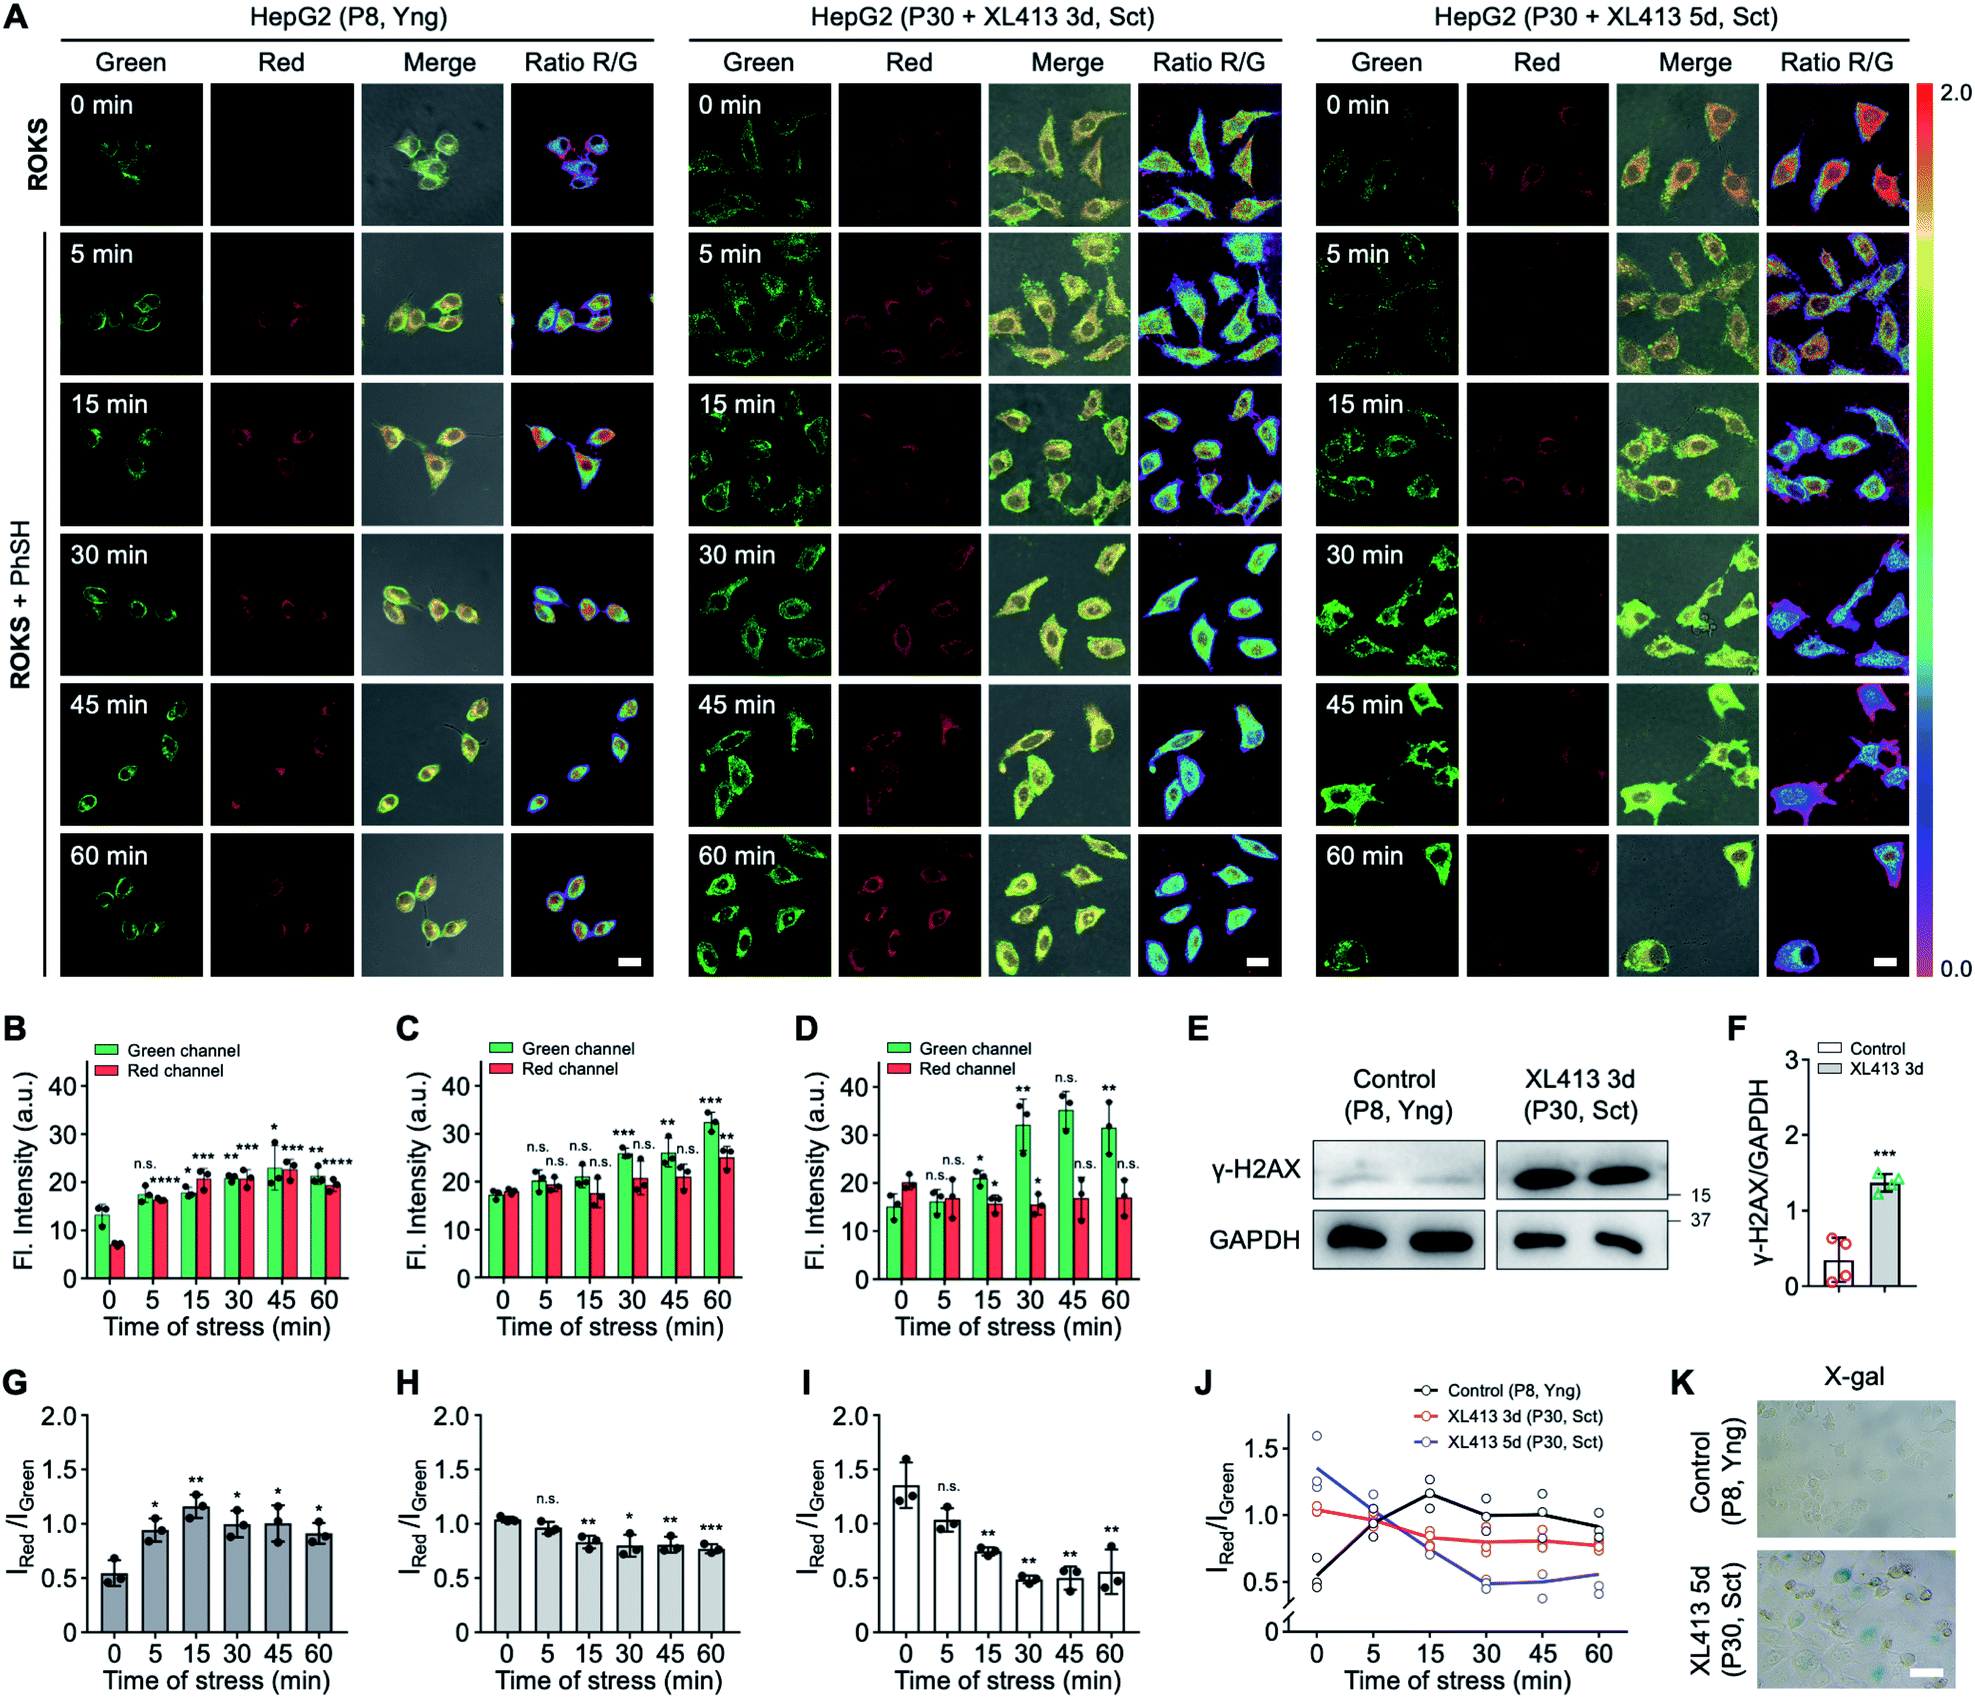 | ||
| Fig. 6 (A) Representative confocal fluorescence images from young (Yng) HepG2 cells at passage 8 (P8) and senescent (Sct) HepG2 cells at passage 30 (P30) induced by XL413 (5 μM) for different times (3 days and 5 days), both of which were treated with ROKS (30 μM, 10 min) and subsequently stimulated with PhSH (40 μM) for different times (0, 5, 15, 30, 45 and 60 min), respectively. Scale bar: 25 μm. (B–D) Average fluorescence intensity in the green channel and red channel from parallel images including (A) for P8 HepG2 cells (B) and P30 HepG2 cells treated with XL413 for 3 days (C) or 5 days (D). Error bars represent the standard deviation (±S. D.) with n = 3. (E) Western blotting analysis of γ-H2AX. Relative molecular mass of proteins (kDa) is displayed on the right. GAPDH was chosen as an internal reference. Quantification is shown in (F). Error bars represent the standard deviation (±S. D.) with n = 4. (G–I) Average intensity ratios (IRed/IGreen) from parallel images including (A) for P8 HepG2 cells (G) and P30 HepG2 cells treated with XL413 for 3 days (H) or 5 days (I). Error bars represent the standard deviation (±S. D.) with n = 3. (J) A clear summary of (G), (H) and (I). (K) A conventional X-gal staining assay for SA-β-gal expression of P8 HepG2 cells and P30 HepG2 cells incubated with XL413 for 5 days, scale bar: 50 μm. Green channel for PhSH: λex = 488 nm, λem = 500–550 nm; red channel for HOCl: λex = 561 nm, λem = 570–620 nm. The number of dots represents that of samples. Significant differences (n. s., not significant, *P < 0.05, **P < 0.01, ***P < 0.001, ****P < 0.0001) are analyzed with two-sided Student's t-test. | ||
Dynamically tracking aging of C. elegans by the SRC-based strategy
C. elegans are widely employed as a model organism in the study of aging and longevity due to relatively short lifespan (ca. 2 weeks) and more than 65% of the genes are related to those of humans.54,55 After synchronous culture, 6 day-old C. elegans are considered young, while 12 day-old C. elegans are considered aged. We assessed the SRC of the C. elegans using our dual channel ROKS probe (Fig. 7). As shown in Fig. 7, without the addition of PhSH, the fluorescence intensity ratio (IRed/IGreen) of 12 day-old C. elegans is higher than that of 6 day-old C. elegans, indicating that the accumulation of HOCl in young was higher than that in aged C. elegans in the resting state. However, upon the addition of PhSH, the fluorescence intensity ratio (IRed/IGreen) of the young C. elegans (6 day-old) increased gradually within 45 min and then stabilized, while that of aged C. elegans (12 day-old) decreased rapidly within 15 min and then reached a stable level (Fig. 7). These results illustrated that young C. elegans have higher SRC than aged C. elegans under stimulation with a stressor and that SRC decreases with aging.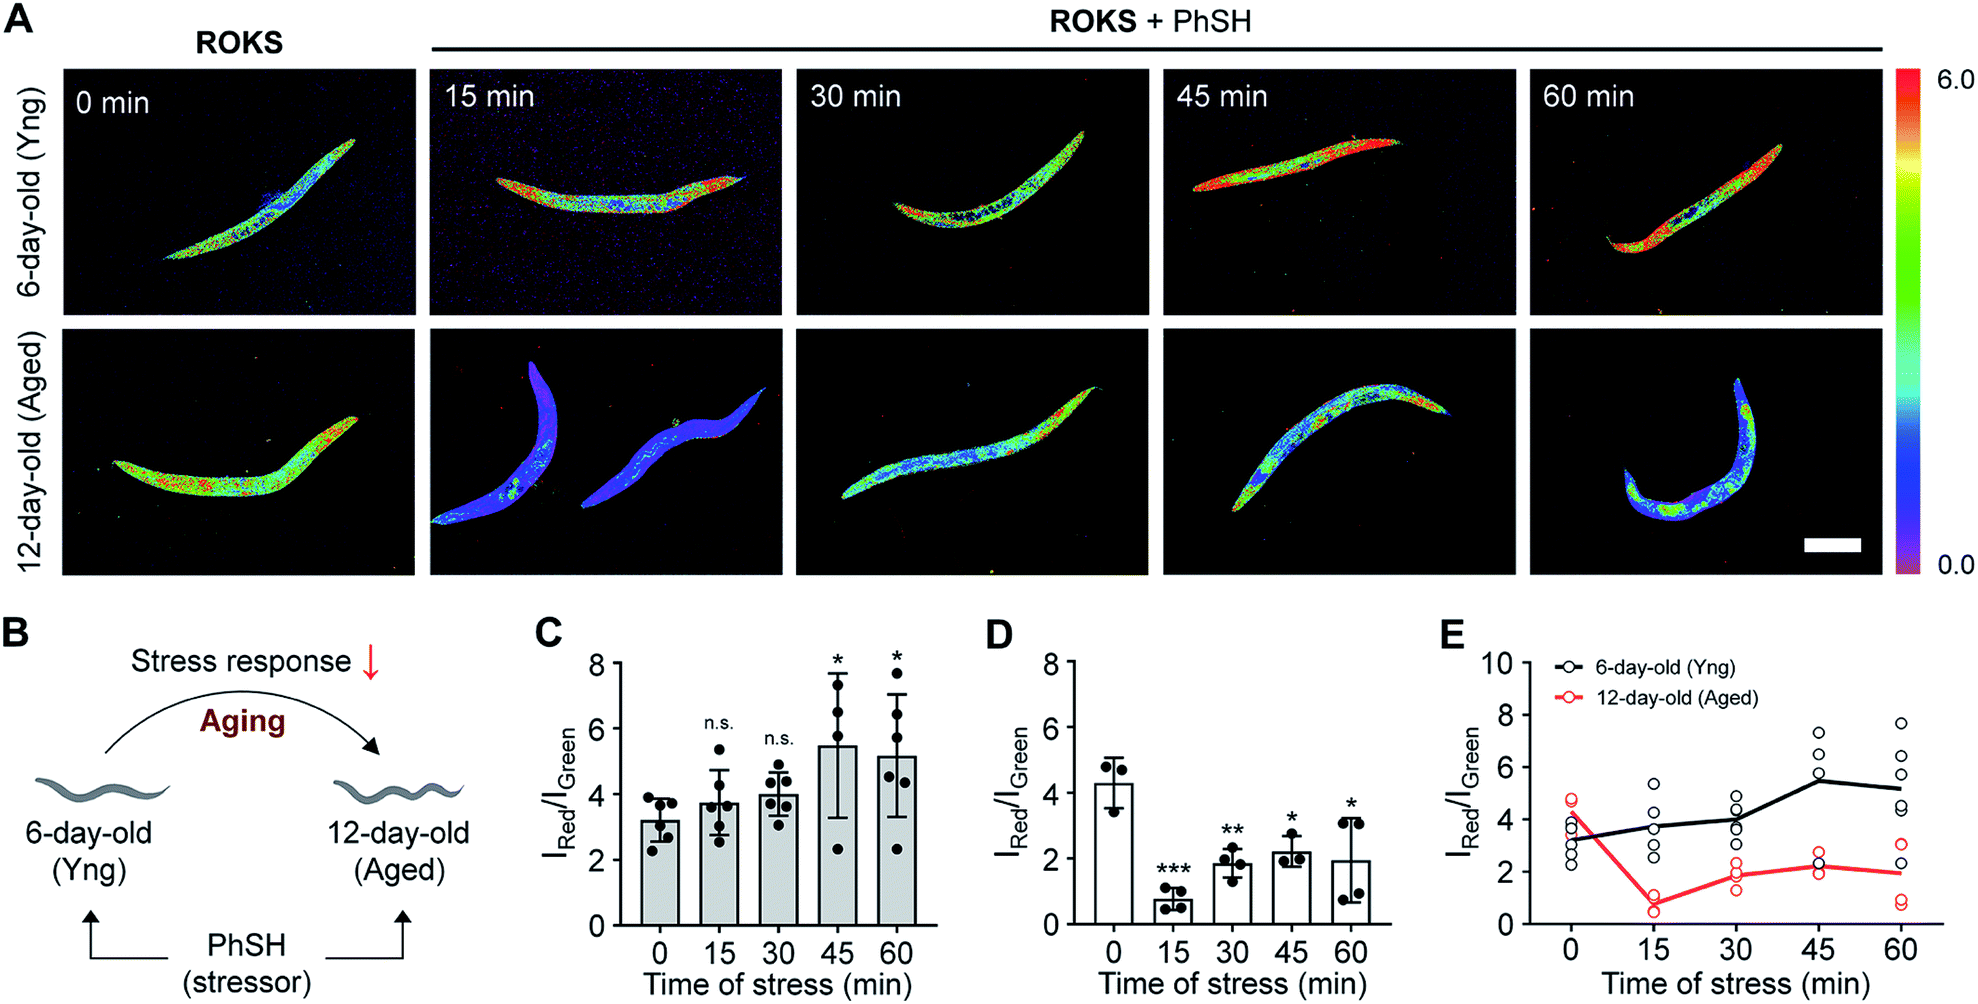 | ||
| Fig. 7 (A) Representative ratio images of young (Yng) C. elegans (6 day-old) and aged C. elegans (12 day-old), both of which were stained with ROKS (30 μM, 60 min) and then stimulated with PhSH (3 μM) for different times (0, 15, 30, 45 and 60 min), respectively. (B) Schematic representation of the variations of stress response in C. elegans with age. (C and D) Average intensity ratios (IRed/IGreen) from parallel images including (A) for 6 day-old C. elegans (C) and 12 day-old C. elegans (D). (E) A clear summary of (C) and (D). Error bars represent the standard deviation (±S. D.). Scale bar: 250 μm. The number of dots represents that of samples. Significant differences (n. s., not significant, *P < 0.05, **P < 0.01, ***P < 0.001) are analyzed with two-sided Student's t-test. | ||
Conclusions
While optical probes for monitoring the resting state of aging exist, appropriate optical probes that provide a dynamic evaluation of aging are unknown. For this reason, we developed a strategy based on the logic-based detection of stressor and stress product to construct a probe for the precise dynamic tracking of aging through the assessment of the SRC of individuals. Therefore, the first SRC fluorescent probe ROKS was developed. ROKS consists of two reactive sites which can logically detect PhSH, a confirmed chemical stressor, and HOCl, the PhSH-activated stress response product in vivo. ROKS exhibits different fluorescence responses: an obvious turn-on green fluorescence signal toward PhSH (LOD = 84 nM) and a subsequent green-to-red ratiometric response to HOCl (LOD = 5 nM). The ratio of the dual-channel fluorescence intensities (I602 nm/I534 nm) was then used to assess the SRC of individuals in a dynamic state of stress for the precise tracking of aging. Using ROKS the decay of SRC within live cells and C. elegans as a function of aging was evaluated, which provided a promising dynamic strategy to track aging. Overall, our SRC-based strategy is unprecedented and will be particularly useful to evaluate the precise progress of aging from a dynamic perspective.Data availability
All experimental supporting data are provided in the ESI.†Author contributions
J. T. and H. T. carried out the synthetic work. J. T. and Y. Z. carried out the spectroscopic measurements and cell imaging experiments. D. S. carried out the C. elegans imaging experiments. X. L. and X. L. (Xinming Li) carried out the cytotoxicity test. Y. G., J. L., J. T., D. S., Y. Z. and T. D. J. wrote and revised the manuscript. Y. G. and J. L. supervised the research. Y. G. conceived and designed the project.Conflicts of interest
The authors declare that they have no competing financial interests.Acknowledgements
We gratefully appreciate the financial support from the National Natural Science Foundation of China (21977082 and 22037002), the Natural Science Basic Research Plan for Distinguished Young Scholars in Shaanxi Province of China (2020JC-38) and the Technology Plan Project of Xi'an (GXYD18.1). T. D. J. wishes to thank the Royal Society for a Wolfson Research Merit Award. Y. G. thanks the University of Orleans in France for the invited professor position.Notes and references
- J. M. van Deursen, Nature, 2014, 509, 439–446 CrossRef CAS PubMed.
- O. H. Jeon, C. Kim, R. M. Laberge, M. Demaria, S. Rathod, A. P. Vasserot, J. W. Chung, D. H. Kim, Y. Poon, N. David, D. J. Baker, J. M. van Deursen, J. Campisi and J. H. Elisseeff, Nat. Med., 2017, 23, 775–781 CrossRef CAS PubMed.
- S. H. He and N. E. Sharpless, Cell, 2017, 169, 1000–1011 CrossRef CAS PubMed.
- C. Amor, J. Feucht, J. Leibold, Y. J. Ho, C. Y. Zhu, D. Alonso-Curbelo, J. Mansilla-Soto, J. A. Boyer, X. Li, T. Giavridis, A. Kulick, S. Houlihan, E. Peerschke, S. L. Friedman, V. Ponomarev, A. Piersigilli, M. Sadelain and S. W. Lowe, Nature, 2020, 583, 127–132 CrossRef CAS PubMed.
- B. G. Childs, M. Durik, D. J. Baker and J. M. van Deursen, Nat. Med., 2015, 21, 1424–1435 CrossRef CAS PubMed.
- A. S. Wang and O. Dreesen, Front. Genet., 2018, 9, 247 CrossRef PubMed.
- G. P. Dimri, X. H. Lee, G. Basile, M. Acosta, G. Scott, C. Roskelley, E. E. Medrano, M. Linskens, I. Rubelj, O. Pereira-Smith, M. Peacocke and J. Campisi, Proc. Natl. Acad. Sci. U. S. A., 1995, 92, 9363–9367 CrossRef CAS PubMed.
- B. Y. Lee, J. A. Han, J. S. Im, A. Morrone, K. Johung, E. C. Goodwin, W. J. Kleijer, D. Dimaio and E. S. Hwang, Aging Cell, 2006, 5, 187–195 CrossRef CAS PubMed.
- G. R. Guo, S. Watterson, S. D. Zhang, A. Bjourson, V. McGilligan, A. Peace and T. S. Rai, Ageing Res. Rev., 2021, 69, 101363–101374 CrossRef PubMed.
- D. Kusumoto, T. Seki, H. Sawada, A. Kunitomi, T. Katsuki, M. Kimura, S. Ito, J. Komuro, H. Hashimoto, K. Fukuda and S. Yuasa, Nat. Commun., 2021, 12, 257 CrossRef CAS PubMed.
- M. Althubiti, L. Lezina, S. Carrera, R. Jukes-Jones, S. M. Giblett, A. Antonov, N. Barlev, G. S. Saldanha, C. A. Pritchard, K. Cain and S. Macip, Cell Death Dis., 2014, 5, e1528 CrossRef CAS PubMed.
- B. Lozano-Torres, A. Estepa-Fernández, M. Rovira, M. Orzáez, M. Serrano, R. Martínez-Máñez and F. Sancenón, Nat. Rev. Chem., 2019, 3, 426–441 CrossRef CAS.
- J. K. Kiecolt-Glaser, K. J. Preacher, R. C. MacCallum, C. Atkinson, W. B. Malarkey and B. Glaser, Proc. Natl. Acad. Sci. U. S. A., 2003, 100, 9090–9095 CrossRef CAS PubMed.
- O. A. Sedelnikova, I. Horikawa, D. B. Zimonjic, N. C. Popescu, W. M. Bonner and J. C. Barrett, Nat. Cell Biol., 2004, 6, 168–170 CrossRef CAS PubMed.
- U. Herbig, M. Ferreira, L. Condel, D. Carey and J. M. Sedivy, Science, 2006, 311, 1257 CrossRef CAS PubMed.
- C. F. Wang, D. Jurk, M. Maddick, G. Nelson, C. Martin-Ruiz and T. V. Zglinicki, Aging Cell, 2009, 8, 311–323 CrossRef CAS PubMed.
- R. G. Zhang, M. V. Poustovoitov, X. F. Ye, H. A. Santos, W. Chen, S. M. Daganzo, J. P. Erzberger, I. G. Serebriiskii, A. A. Canutescu, R. L. Dunbrack, J. R. Pehrson, J. M. Berger, P. D. Kaufman and P. D. Adams, Dev. Cell, 2005, 8, 19–30 CrossRef CAS PubMed.
- J. C. Sporn, G. Kustatscher, T. Hothorn, M. Collado, M. Serrano, T. Muley, P. Schnabel and A. G. Ladurner, Oncogene, 2009, 28, 3423–3428 CrossRef CAS PubMed.
- Y. Suh, Mech. Ageing Dev., 2001, 122, 1797–1811 CrossRef CAS PubMed.
- H. Zhang and S. N. Cohen, Genes Dev., 2004, 18, 3028–3040 CrossRef CAS PubMed.
- H. Kondoh, M. E. Lleonart, J. Gil, J. Wang, P. Degan, G. Peters, D. Martinez, A. Carnero and D. Brach, Cancer Res., 2005, 65, 177–185 CAS.
- R. Wang, Z. Yu, B. Sunchu, J. Shoaf, I. Dang, S. Zhao, K. Caples, L. Bradley, L. M. Beaver, E. Ho, C. V. Löhr and V. I. Perez, Aging Cell, 2017, 16, 564–574 CrossRef CAS PubMed.
- D. S. Leeman, K. Hebestreit, T. Ruetz, A. E. Webb, A. McKay, E. A. Pollina, B. W. Dulken, X. A. Zhao, B. W. Yeo, T. T. Ho, S. Mahmoudi, K. Devarajan, E. Passegué, T. A. Rando, J. Frydman and A. Brunet, Science, 2018, 359, 1277–1283 CrossRef CAS PubMed.
- A. B. Adewoye, D. Tampakis, A. Fullenzi and A. Stolzing, Biogerontology, 2020, 21, 773–786 CrossRef CAS PubMed.
- Y. Johmura, T. Yamanaka, S. Omori, T. W. Wang, Y. Sugiura, M. Matsumoto, N. Suzuki, S. Kumamoto, K. Yamaguchi, S. Hatakeyama, T. Takami, R. Yamaguchi, E. Shimizu, K. Ikeda, N. Okahashi, R. Mikawa, M. Suematsu, M. Arita, M. Sugimoto, K. I. Nakayama, Y. Furukawa, S. Imoto and M. Nakanishi, Science, 2021, 371, 265–270 CrossRef CAS PubMed.
- J. Meng, Z. Y. Lv, X. H. Qiao, X. P. Li, Y. Z. Li, Y. Y. Zhang and C. Chen, Redox Biol., 2017, 11, 365–374 CrossRef CAS PubMed.
- H. W. Lee, C. H. Heo, D. Sen, H. O. Byun, I. H. Kwak, G. Yoon and H. M. Kim, Anal. Chem., 2014, 86, 10001–10005 CrossRef CAS PubMed.
- B. Lozano-Torres, I. Galiana, M. Rovira, E. Garrido, S. Chaib, A. Bernardos, D. Muñoz-Espín, M. Serrano, R. Martínez-Máñez and F. Sancenón, J. Am. Chem. Soc., 2017, 139, 8808–8811 CrossRef CAS PubMed.
- X. K. Li, W. J. Qiu, J. W. Li, X. Chen, Y. L. Hu, Y. Gao, D. L. Shi, X. M. Li, H. L. Lin, Z. L. Hu, G. Q. Dong, C. Q. Sheng, B. Jiang, C. L. Xia, C. Y. Kim, Y. Guo and J. Li, Chem. Sci., 2020, 11, 7292–7301 RSC.
- X. Z. Chai, H. H. Han, A. C. Sedgwick, N. Li, Y. Zang, T. D. James, J. J. Zhang, X. L. Hu, Y. Yu, Y. Li, Y. Wang, J. Li, X. P. He and H. Tian, J. Am. Chem. Soc., 2020, 142, 18005–18013 CrossRef CAS PubMed.
- Y. Gao, Y. L. Hu, Q. M. Liu, X. K. Li, X. M. Li, C. Y. Kim, T. D. James, J. Li, X. Chen and Y. Guo, Angew. Chem., Int. Ed., 2021, 60, 10756–10765 CrossRef CAS PubMed.
- Q. M. Liu, A. Y. Li, X. K. Li, B. Li, Y. H. Zhang, J. Li and Y. Guo, Sens. Actuators, B, 2019, 283, 820–830 CrossRef CAS.
- W. Jiang, Q. Q. Fu, H. Y. Fan, J. Ho and W. Wang, Angew. Chem., Int. Ed., 2007, 46, 8445–8448 CrossRef CAS PubMed.
- Q. Sun, S. H. Yang, W. Lei, W. C. Yang and G. F. Yang, Anal. Chem., 2016, 88, 2266–2272 CrossRef CAS PubMed.
- Y. K. Yue, F. J. Huo, Y. B. Zhang, J. B. Chao, R. Martínez-Máñez and C. X. Yin, Anal. Chem., 2016, 88, 10499–10503 CrossRef CAS PubMed.
- L. Xiong, J. Ma, Y. Huang, Z. H. Wang and Z. Y. Lu, ACS Sens., 2017, 2, 599–605 CrossRef CAS PubMed.
- Y. Q. Hao, Q. Y. Yin, Y. T. Zhang, M. T. Xu and S. Chen, Molecules, 2019, 24, 3716 CrossRef CAS PubMed.
- T. Xu, S. J. Zhao, X. L. Wu, L. T. Zeng and M. H. Lan, ACS Sustainable Chem. Eng., 2020, 8, 6413–6421 CrossRef CAS.
- L. Yuan, L. Wang, B. K. Agrawalla, S. J. Park, H. Zhu, B. Sivaraman, J. J. Peng, Q. H. Xu and Y. T. Chang, J. Am. Chem. Soc., 2015, 137, 5930–5938 CrossRef CAS PubMed.
- L. Wu, I. Wu, C. C. DuFort, M. A. Carlson, X. Wu, L. Chen, C. T. Kuo, Y. L. Qin, J. B. Yu, S. R. Hingorani and D. T. Chiu, J. Am. Chem. Soc., 2017, 139, 6911–6918 CrossRef CAS PubMed.
- Y. L. Pak, S. J. Park, D. Wu, B. Cheon, H. M. Kim, J. Bouffard and J. Yoon, Angew. Chem., Int. Ed., 2018, 57, 1567–1571 CrossRef CAS PubMed.
- P. Wei, L. Y. Liu, Y. Wen, G. L. Zhao, F. F. Xue, W. Yuan, R. H. Li, Y. P. Zhong, M. F. Zhang and T. Yi, Angew. Chem., Int. Ed., 2019, 58, 4547–4551 CrossRef CAS PubMed.
- D. L. Shi, S. Q. Chen, B. Dong, Y. H. Zhang, C. Q. Sheng, T. D. James and Y. Guo, Chem. Sci., 2019, 10, 3715–3722 RSC.
- Y. H. Zhang, H. Teng, Y. Gao, M. W. Afzal, J. Y. Tian, X. Chen, H. Y. Tang, T. D. James and Y. Guo, Chin. Chem. Lett., 2020, 31, 2917–2920 CrossRef CAS.
- A. H. Ashoka, F. Ali, R. Tiwari, R. Kumari, S. K. Pramanik and A. Das, ACS Omega, 2020, 5, 1730–1742 CrossRef CAS PubMed.
- L. Y. Liu, L. P. Jiang, W. Yuan, Z. K. Liu, D. Y. Liu, P. Wei, X. Y. Zhang and T. Yi, ACS Sens., 2020, 5, 2457–2466 CrossRef CAS PubMed.
- W. Chen, A. Pacheco, Y. Takano, J. J. Day, K. Hanaoka and M. Xian, Angew. Chem., Int. Ed., 2016, 55, 9993–9996 CrossRef CAS PubMed.
- X. F. Zhang, W. Y. Zhao, B. Li, W. Q. Li, C. X. Zhang, X. C. Hou, J. Jiang and Y. Z. Dong, Chem. Sci., 2018, 9, 8207–8212 RSC.
- J. S. Lan, L. Liu, R. F. Zeng, Y. H. Qin, Y. Liu, X. Y. Jiang, A. Aihemaiti, Y. Ding, T. Zhang and R. J. Y. Ho, Chem. Commun., 2020, 56, 1219–1222 RSC.
- H. Teng, J. Y. Tian, D. H. Sun, M. X. Xiu, Y. H. Zhang, X. Y. Qiang, H. Y. Tang and Y. Guo, Sens. Actuators, B, 2020, 319, 128288 CrossRef CAS.
- S. Thekkan, M. S. Jani, C. Cui, K. Dan, G. L. Zhou, L. Becker and Y. Krishnan, Nat. Chem. Biol., 2018, 15, 1165–1172 CrossRef PubMed.
- C. Wang, S. Vegna, H. Jin, B. Benedict, C. Lieftink, C. Ramirez, R. L. Oliveira, B. Morris, J. Gadiot, W. Wang, A. D. Chatinier, L. Wang, D. Gao, B. Evers, G. Jin, Z. Xue, A. Schepers, F. Jochems, A. M. Sanchez, S. Mainardi, H. T. Riele, R. L. Beijersbergen, W. Qin, L. Akkari and R. Bernards, Nature, 2019, 574, 268–272 CrossRef CAS PubMed.
- F. Debacq-Chainiaux, J. D. Erusalimsky, J. Campisi and O. Toussaint, Nat. Protoc., 2009, 4, 1798–1806 CrossRef CAS PubMed.
- E. L. L. Sonnhammer and R. Durbin, Genomics, 1997, 46, 200–216 CrossRef CAS PubMed.
- P. Y. Shen, Y. R. Yue and Y. Park, Crit. Rev. Food Sci. Nutr., 2016, 58, 741–754 CrossRef PubMed.
Footnotes |
| † Electronic supplementary information (ESI) available: Experimental section, additional figures, synthetic procedures, and original spectra of compounds. CCDC 2018837, 2018838 and 2018841–2018844. For ESI and crystallographic data in CIF or other electronic format see DOI: 10.1039/d1sc04162b |
| ‡ These authors contributed equally to this work. |
| This journal is © The Royal Society of Chemistry 2021 |