
 Open Access Article
 This Open Access Article is licensed under a Creative Commons Attribution-Non Commercial 3.0 Unported Licence
IR linewidth and intensity amplifications of nitrile vibrations report nuclear-electronic couplings and associated structural heterogeneity in radical anions†
Juchao
Yan
 a,
Reid W.
Wilson
b,
Jason T.
Buck
b,
David C.
Grills
c,
Eric W.
Reinheimer
d and
Tomoyasu
Mani
*b
a,
Reid W.
Wilson
b,
Jason T.
Buck
b,
David C.
Grills
c,
Eric W.
Reinheimer
d and
Tomoyasu
Mani
*b
aDepartment of Physical Sciences, Eastern New Mexico University, Portales, NM 88130, USA
bDepartment of Chemistry, University of Connecticut, Storrs, CT 06269-3060, USA. E-mail: tomoyasu.mani@uconn.edu
cChemistry Division, Brookhaven National Laboratory, Upton, NY 11973-5000, USA
dRigaku Americas Corporation, 9009 New Trails Drive, The Woodlands, TX 77381, USA
First published on 17th August 2021
Abstract
Conjugated molecular chains have the potential to act as “molecular wires” that can be employed in a variety of technologies, including catalysis, molecular electronics, and quantum information technologies. Their successful application relies on a detailed understanding of the factors governing the electronic energy landscape and the dynamics of electrons in such molecules. We can gain insights into the energetics and dynamics of charges in conjugated molecules using time-resolved infrared (TRIR) detection combined with pulse radiolysis. Nitrile ν(C![[triple bond, length as m-dash]](https://www.rsc.org/images/entities/char_e002.gif) N) bands can act as IR probes for charges, based on IR frequency shifts, because of their exquisite sensitivity to the degree of electron delocalization and induced electric field. Here, we show that the IR intensity and linewidth can also provide unique and complementary information on the nature of charges. Quantifications of IR intensity and linewidth in a series of nitrile-functionalized oligophenylenes reveal that the CN vibration is coupled to the nuclear and electronic structural changes, which become more prominent when an excess charge is present. We synthesized a new series of ladder-type oligophenylenes that possess planar aromatic structures, as revealed by X-ray crystallography. Using these, we demonstrate that CN vibrations can report charge fluctuations associated with nuclear movements, namely those driven by motions of flexible dihedral angles. This happens only when a charge has room to fluctuate in space.
N) bands can act as IR probes for charges, based on IR frequency shifts, because of their exquisite sensitivity to the degree of electron delocalization and induced electric field. Here, we show that the IR intensity and linewidth can also provide unique and complementary information on the nature of charges. Quantifications of IR intensity and linewidth in a series of nitrile-functionalized oligophenylenes reveal that the CN vibration is coupled to the nuclear and electronic structural changes, which become more prominent when an excess charge is present. We synthesized a new series of ladder-type oligophenylenes that possess planar aromatic structures, as revealed by X-ray crystallography. Using these, we demonstrate that CN vibrations can report charge fluctuations associated with nuclear movements, namely those driven by motions of flexible dihedral angles. This happens only when a charge has room to fluctuate in space.
Introduction
Spatial delocalization of spin-charges is a critical factor in controlling their energies and dynamics. Inter- and intramolecular charge delocalization, and its effect on electron transfer reactions in simple π-conjugated molecules and assemblies, is widely studied because of its importance in the performance of organic electronics1 and quantum information science.2Vibrational spectroscopy provides a superb sensitivity to the local molecular and surrounding environment.3,4 In particular, time-resolved infrared (TRIR) spectroscopy, including multidimensional analogs, has become a powerful technique for interrogating the properties of charges and excited states of molecules in the condensed phase.5–9 Among the vibrational signatures, the IR absorptions of well-defined nitrile (CN) and carbonyl (C![[double bond, length as m-dash]](https://www.rsc.org/images/entities/char_e001.gif) O) groups in neutral molecules are widely adopted as an IR probe, largely based on the vibrational Stark effect (VSE),3,10 to quantitatively measure electric fields in a variety of systems,11–13 in order to determine structure–function relationships. Most IR probes (or sensors) take advantage of the localized nature of IR absorption and the IR frequency shifts that occur in response to the parameters of interest (e.g., structural changes, solvation, and other noncovalent interactions surrounding the localized probes).
O) groups in neutral molecules are widely adopted as an IR probe, largely based on the vibrational Stark effect (VSE),3,10 to quantitatively measure electric fields in a variety of systems,11–13 in order to determine structure–function relationships. Most IR probes (or sensors) take advantage of the localized nature of IR absorption and the IR frequency shifts that occur in response to the parameters of interest (e.g., structural changes, solvation, and other noncovalent interactions surrounding the localized probes).
Nitrile vibrations have proved to be an excellent IR probe to study excess electrons (i.e., radical anions) in nitrile-substituted molecules, since their frequencies exhibit exquisite sensitivity to the degree of electron localization,14,15 as well as to the induced electric field through the VSE.16,17 Using the powerful technique of pulse radiolysis18 coupled with TRIR spectroscopy (PR-TRIR),19,20 which enables the rapid generation and IR detection of radical anions free from the effects of ion pairing (even in low polarity solvents),16 some of the authors have exploited ν(CN) IR shifts to study the nature of charges in radical anions, such as intermolecular delocalization,15 the effect of electron push-pulling,21 and in photogenerated charge separated states.22
While frequency shifts are often used as a parameter of the aforementioned IR probes for both neutrals and charged species, there are two other quantifiable parameters of an IR absorption band: extinction coefficient (ε) and linewidth, often measured by the full-width at half-maximum (FWHM).
The combination of the two roughly provides the integrated intensity. Early studies by Juchnovski and co-workers extensively examined neutral nitrile-functionalized molecules, elucidating a correlation of IR frequencies and integrated intensities with Hammett-type substituent constants.23–25 While their results showed that the integrated intensities could be more sensitive to structural changes than the frequencies alone, the extinction coefficients and linewidths often receive less attention.
Mid-IR bands are generally quite weak, and those with ε > 200 M−1 cm−1 are typically considered to be very strong. However, there are special cases where intensified IR bands are observed. For example, metal complexes with polar groups such as CO, in which metal coordination increases the dipole moment, exhibit ν(CO) bands with ε ∼ 1–3 × 10⁴ M−1 cm−1.26,27 Intense IR bands are also observed for the charges in conjugated polymer films,28–32 and in mixed-valence coordination complexes,33 often being referred to as vibrational absorption by “IR active” molecular vibrations (IRAV). While the IRAV bands in polymer films have rarely been quantified, one of us previously showed that the extinction coefficients of CC and C–H vibrations reach up to 5 × 10⁴ M−1 cm−1 in radical anions and cations of oligo- and polyfluorenes.34 Similar huge IR bands were observed in porphyrin oligomer radical cations.35 The origin of these IR enhancements is attributed to two processes: coupling between charge distribution and vibrational motion (large dipole derivatives), or mixing between low-lying electronic and vibrational transitions.34 Such significant enhancements were not previously reported for CN vibrations, and it is not clear if the absorption of a “localized” CN vibration can be similarly enhanced in charged species. The other parameter, linewidth, is also rarely quantified. However, our previous work14 suggested that IR linewidth may be sensitive to nuclear and accompanying electronic fluctuations present in molecules, specifically the motions of flexible dihedral angles.
Both the IR amplification mechanisms and a possible IR linewidth response to nuclear motion mean that vibrational and electronic dynamics are intimately related. A growing body of evidence also shows that one can perturb the pathways and efficiency of charge transfer reactions by selective excitation of vibrational modes with IR light.36–39 However, we require a more detailed understanding of such interactions to be able to modulate them synthetically so that we can control chemical reactions through vibrational perturbation.36
Here, we have measured the extinction coefficients and linewidths of the ν(CN) band of the radical anions and neutral forms of a series of nitrile-functionalized oligophenylenes (Chart 1). While the ν(CN) band is still a “localized” vibration, the data on IR linewidths and intensities show that the CN vibration is coupled to the nuclear and electronic structural changes. This coupling is more prominent in the charged species and is reflected by changes in the IR intensities and linewidths. We observed a clear enhancement of ν(CN) absorption, with one of them exhibiting the most intense ν(CN) band reported to date. Ladder-type oligomers and polymers contain backbones that consist of fused rings with adjacent rings having two or more atoms in common.40 Using nitrile-functionalized ladder-type oligophenylenes, we have unambiguously demonstrated that the nitrile vibration's linewidth can report on nuclear and electronic fluctuations associated with the movement of flexible dihedral angles only when a charge has room to move in space. The present findings support the picture that charges in conjugated chains are dynamic, undergoing changes of charge density driven by molecular vibrations.34,35 Our work also sets up the foundation to use linewidth and intensity information, in addition to the IR frequency shifts, as parameters of IR probes for charges.
 | ||
| Chart 1 Molecular structures of nitrile-functionalized aryl compounds used in this work. aThe abbreviated names are listed next to the molecules and are used throughout the paper. Bonds with flexible dihedral angles are coloured red. | ||
Experimental
General information
All solvents and reagents used were obtained from standard commercial sources and used as received unless otherwise noted. Silica gel (Sigma-Aldrich, pore size 60 Å, 70–230 mesh) was used for column chromatography. FTIR spectra were recorded on a Thermo Nicolet Nexus 670 FTIR spectrometer at Brookhaven National Laboratory (BNL) or a JASCO FT/IR-6100 at the University of Connecticut (UConn) using a cell equipped with CaF2 windows. 1H and 13C NMR spectra were recorded with a Bruker Avance III spectrometer operating at 400.16 and 100.62 MHz, respectively at BNL and UConn or with a Bruker Avance spectrometer operating at 300.14 and 75.47 MHz at UConn.Molecular synthesis
The synthesis and characterization of F1CN, F2CN, and F3CN are reported previously.14,16 4-Cyano-4′-hexylbiphenyl (6CB) and 4-cyano-4′-pentylterphenyl (5CT) were purchased from a commercially available source and used without further purification. The synthetic schemes of mono nitrile-functionalized ladder-type oligophenylenes (L3PCN, L4PCN, and (L3P)2CN) are shown in Scheme S1.† In short, we used Pd-catalyzed reactions to construct ladder-type oligophenylenes.41,42 While tandem reactions did not proceed to completion, as previously pointed out,42,43 individual Suzuki–Miyaura couplings and the ring closures were successful. Following mono-bromination of oligophenylenes, we performed the Rosenmund–von Braun reaction to convert aryl bromide to afford the corresponding aryl nitrile with decent yields. The detailed procedures and characterizations of new compounds are described in ESI.†Electrochemistry
Cyclic voltammetry (CV) measurements were conducted with a 600E Electrochemical Analyzer/Workstation (CH Instruments) in a standard three-electrode cell consisting of a 3 mm glassy carbon disk working electrode, a platinum wire counter electrode, and a pseudo Ag reference electrode in dimethylformamide (DMF) solution with 0.1 M tetrabutylammonium hexafluorophosphate (TBA+PF6−) electrolyte. Data were processed and analyzed using CHI600e Software. Potentials are reported vs. Fc+/0, with ferrocene being added before the measurements. We assume in this work that the half wave-potentials (E1/2) we measure by CV are good approximations of the formal reduction potentials (E°′).44Pulse radiolysis
Pulse radiolysis experiments were performed at the Laser Electron Accelerator Facility (LEAF) at BNL. For UV-vis-NIR transient absorption detection, the experiments were performed as described before,18 using a quartz cell with a pathlength of 0.5 cm. Extinction coefficients are determined relative to the absorption band of biphenyl radical anion in THF (ε = 12![[thin space (1/6-em)]](https://www.rsc.org/images/entities/char_2009.gif) 500 M−1 cm−1 at 630 nm).45 For TRIR detection, a detailed description of the experimental setup is given elsewhere.20 A home-built, airtight IR solution flow cell was used (1.10 mm pathlength), with 0.35 mm thick CaF2 windows. A continuous wave external-cavity quantum cascade laser (Model 21047-MHF, Daylight Solutions, Inc.) was used as the IR probe source. The time resolution is limited to ∼40 ns in the current setup. Samples were dissolved in either DMF or tetrahydrofuran (THF), with a molecular concentration of 2.5–20 mM, and purged with argon. In some TRIR measurements, we observed baseline absorptions that amount to ∼10% of the peak absorptions. These baseline absorptions were subtracted from the reported spectra of the anions. The source of these absorptions might be the solvents or minor products of solutes after radiolysis.
500 M−1 cm−1 at 630 nm).45 For TRIR detection, a detailed description of the experimental setup is given elsewhere.20 A home-built, airtight IR solution flow cell was used (1.10 mm pathlength), with 0.35 mm thick CaF2 windows. A continuous wave external-cavity quantum cascade laser (Model 21047-MHF, Daylight Solutions, Inc.) was used as the IR probe source. The time resolution is limited to ∼40 ns in the current setup. Samples were dissolved in either DMF or tetrahydrofuran (THF), with a molecular concentration of 2.5–20 mM, and purged with argon. In some TRIR measurements, we observed baseline absorptions that amount to ∼10% of the peak absorptions. These baseline absorptions were subtracted from the reported spectra of the anions. The source of these absorptions might be the solvents or minor products of solutes after radiolysis.
X-ray crystallography
Data collections on colorless crystals of L3P and L3PCN were first undertaken by securing single crystals of both having dimensions of 0.12 × 0.10 × 0.07 mm and 0.02 × 0.01 × 0.01 mm, respectively to Mitegen mounts using Paratone oil. Crystals of L3P had their data collected using a Synergy-S single crystal X-ray diffractometer equipped with a HyPix-6000HE hybrid photon counting (HPC) detector. Lastly, single crystals of L3PCN had their data collected using a Rigaku Oxford Diffraction Synergy Custom single crystal X-ray diffractometer equipped with a HyPix-6000HE HPC detector. Reflection data for all crystals were collected at 100 K using microfocused Cu Kα1 radiation (=1.54184 Å). Data collection strategies to ensure completeness and desired redundancy were determined using CrysAlisPro.46 Data processing for all samples was done using CrysAlisPro and included a numerical absorption correction on L3P and a multi-scan absorption correction on L3PCN applied using the SCALE3 ABSPACK scaling algorithm.47 All structures were solved via intrinsic phasing methods using ShelXT48 and subjected to a least-squares refinement with ShelXL49 within the Olex2 graphical user interface.50 The final structural refinement included anisotropic temperature factors on all constituent non-hydrogen atoms. Hydrogen atoms were attached via the riding model at calculated positions using suitable HFIX commands. Space groups were verified by PLATON.51Computations
Computations were carried out with Gaussian 16.52 The geometries were optimized with the LC-ωPBE53–55 functional in density functional theory (DFT) calculations. We used ω = 0.1 bohr−1. The 6-31G(d) basis set was used. All calculations on radical anions were spin-unrestricted. All hexyl groups in the fluorene moiety were replaced by ethyl groups. The geometry optimizations were performed without symmetry constraints. Frequency calculations were performed at the optimized geometries without anharmonicity corrections unless otherwise noted. Reported frequencies are not scaled.Results
Nitrile vibrations
The nitrile ν(CN) bands of the neutral species are observed in the characteristic region of 2220–2230 cm−1 in THF with varying ε and FWHM (Table 1). A similar trend was observed in DMF, as shown in Table S1.† The FTIR spectra in THF are reported in Fig. S1.† The frequencies of the neutrals (νneutral) are only slightly affected by the structure of the molecule: the π-ring extension moves νneutral to lower frequencies (Fig. S1†), likely due to the increase in electron donating capability. As a general trend, we observe a sharper and more intense band in the neutral species when we elongate conjugation and remove flexible dihedral angles (Table 1 and Fig. 1a). Amazingly, among the series of neutrals, the ν(CN) extinction coefficient reaches a high of ∼720 M−1 cm−1 for (L3P)2CN. This is one of the most intense ν(CN) vibrations of any neutral nitrile-substituted species,24 and it is even comparable to that of the radical anion of PhCN (∼770 M−1 cm−1). Upon reduction using pulse radiolysis, we observed nitrile ν(CN) bands that were shifted to lower frequencies in a similar manner to that observed previously.3,15,20,21 The radical anions discussed here are free from ion pairing with counter ions that are known to induce significant shifts because of the Stark effect.16,56,57 The extinction coefficients of the ν(CN) stretches of the radical anions were determined from the relative intensities of the radical anion band and the negative neutral bleach band in the TRIR spectra, using the measured extinction coefficient of the neutral species. Smaller bleach peaks make the uncertainty (∼20%) larger in the determination of extinction coefficients for the radical anions compared to those for the neutral species. ε of ν(CN) of the radical anion of (L3P)2CN reaches ∼104 M−1 cm−1, which is more than ten times larger than that of the neutral species (Fig. 1b). To the best of our knowledge, this is the strongest nitrile absorption band measured to date.
N) of neutral and anionic forms of mononitrile-functionalized aryl compounds in THF
| Name | Number of phenyl rings | Number of dihedral angles | Neutral | Anion | Δνc (cm−1) | ||||
|---|---|---|---|---|---|---|---|---|---|
| ν (cm−1) | FWHMa (cm−1) | ε (M−1 cm−1) | ν (cm−1) | FWHMa (cm−1) | ε (M−1 cm−1) | ||||
| a FWHM = full width at half maximum. The values reported here are obtained from fits of the bands to a Voigt function. b Uncertainties are ±20%. c Δν = νanion − νneutral. | |||||||||
| PhCN | 1 | 0 | 2229 | 6.5 | 190 | 2077 | 10.8 | 770 | −152 |
| 6CB | 2 | 1 | 2227 | 5.6 | 280 | 2114 | 11.7 | 1570 | −113 |
| F1CN | 2 | 0 | 2224 | 5.0 | 410 | 2110 | 12.1 | 1640 | −114 |
| 5CT | 3 | 2 | 2227 | 6.2 | 280 | 2132 | 14.9 | 5050 | −95.9 |
| L3PCN | 3 | 0 | 2223 | 4.8 | 540 | 2126 | 15.3 | 5260 | −96.7 |
| F2CN | 4 | 1 | 2224 | 4.9 | 490 | 2138 | 24.1 | 5440 | −86.0 |
| L4PCN | 4 | 0 | 2223 | 4.8 | 620 | 2136 | 19.4 | 9460 | −87.2 |
| F3CN | 6 | 2 | 2224 | 5.1 | 580 | 2143 | 27.0 | 8410 | −81.0 |
| (L3P)2CN | 6 | 1 | 2223 | 4.8 | 720 | 2140 | 23.7 | 9950 | −83.0 |
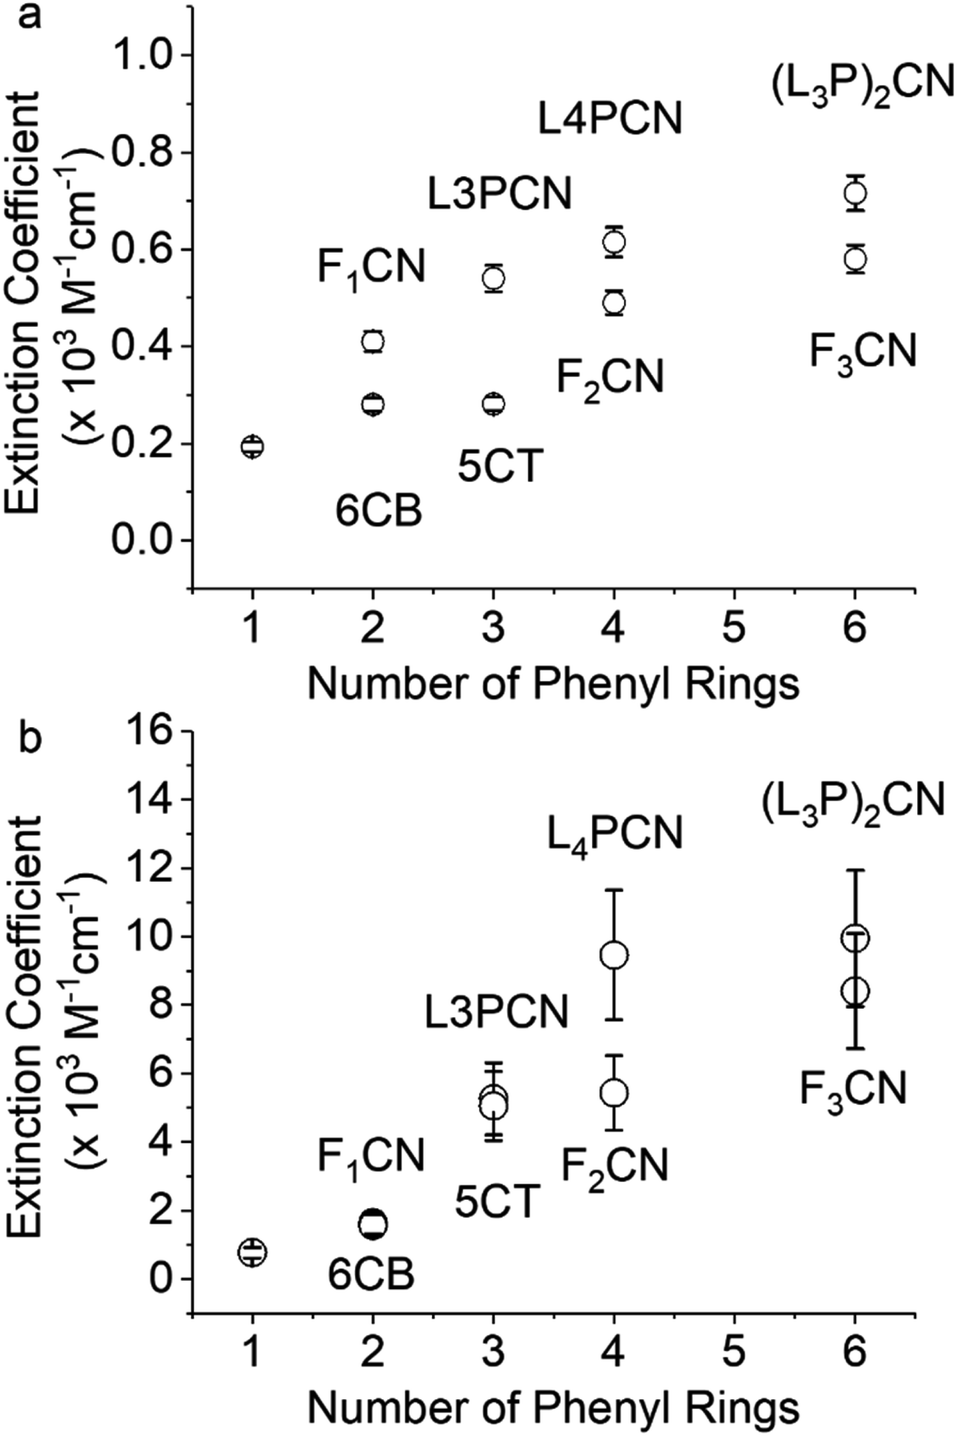 | ||
| Fig. 1 Extinction coefficients of (a) neutral species and (b) radical anions in THF. | ||
The FWHMs, i.e., linewidths, of the ν(CN) bands were taken from peak fits of the bands to a Voigt function. IR shifts, Δν(CN), are defined as νanion − νneutral. The linewidths of νanion are generally larger than those of νneutral. The experimental IR data for the neutral and radical anionic species in THF are reported in Table 1, along with the structural information. Due to the larger background noise in the neutral regions of the ν(CN) band, we did not determine the extinction coefficients in DMF and therefore only Δν(CN) values are reported in Table 2 and the frequencies and FWHMs are reported in Table S1 (ESI†).
| Name | E°′ (V vs. Fc+/0) | Δνb (cm−1) |
|---|---|---|
| a Measured with 0.1 M TBA+PF6−. Uncertainties are ±0.01 V. b Δν = νanion − νneutral. They are experimentally determined values. c Value taken from ref. 58. Measured in acetonitrile with 0.1 M TBA+BF4− and converted to Fc+/0 using 0.403 V vs. SCE.59 | ||
| PhCN | −2.83c | −154.9 |
| F1CN | −2.50 | −121.8 |
| L3PCN | −2.43 | −106.0 |
| F2CN | −2.38 | −97.4 |
| L4PCN | −2.40 | −98.1 |
| F3CN | −2.36 | −93.6 |
| (L3P)2CN | −2.38 | −96.2 |
Reduction potentials
We measured the reduction potentials of the molecules in DMF (0.1 M TBA+PF6−) by cyclic voltammetry (see Table 2).The nitrile-functionalized oligophenylenes exhibit less negative reduction potentials for the first reduction compared to their corresponding non-functionalized counterparts because of the electron accepting nature of the nitrile functional group.
Crystal structures
We obtained the X-ray crystal structures of L3P and L3PCN. The structures clearly show the planarity of the π-conjugated plane (see Fig. 2 for L3PCN). In crystal packings, the hexyl chains prevent the aromatic cores from π-stacking. The packing of L3P is similar to that reported earlier.60 More details of the crystal structures are discussed in ESI Section B.†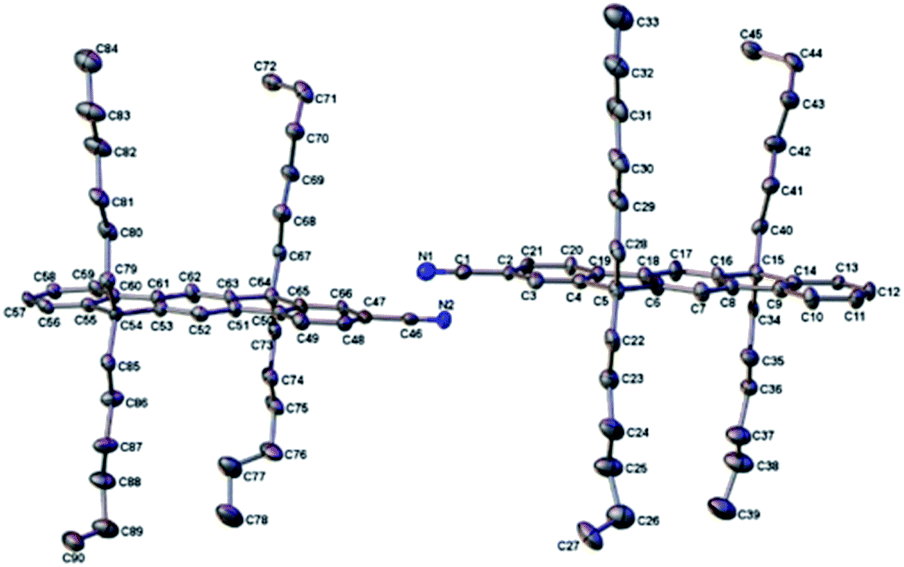 | ||
| Fig. 2 Anisotropic displacement ellipsoid plots of L3PCN with ellipsoids set to the 50% probability level. Hydrogen atoms have been removed for the sake of clarity. | ||
Computational study
We performed DFT calculations to computationally investigate the ν(CN) frequencies and IR intensities for our series of nitrile-functionalized aryl compounds. The values at geometry optimized structures and other select geometries are reported in Table S2 (ESI†). We used a long-range corrected functional LC-ωPBE (ω = 0.1 bohr−1), which was shown to reproduce the electronic properties of oligofluorenes and their derivatives.14,61,62 The computational study qualitatively predicts general trends of νneutral, νanion, and Δν as well as the IR intensities of radical anions. While the current set of calculations with the limited number of conformations could not provide quantitative data on the linewidth to compare with the experimental data, they can still provide useful insights into the relations between nuclear and electronic structures.
Discussion
We will describe the molecular systems through IR information, complemented by other more “conventional” measures. By doing so, we aim to (1) highlight how vibrations can illuminate subtle but critical information on the molecular systems, and (2) show the intimate relations between vibrational and electronic dynamics. While the primary focus is on radical anions, we will also discuss neutral species.IR shifts
IR frequency is the most easily quantifiable parameter, especially for IR probes that are usually spectrally distinct. We previously showed that IR shifts, Δν(CN), can be a good measure of the delocalization of excess electrons in nitrile-functionalized molecules, i.e., a less negative Δν indicates a more delocalized charge.14 Those measured in THF and DMF here indicate that an electron becomes more localized in ladder-type oligophenylenes compared to non-ladder-types when they have the same number of phenyl rings (e.g., L4PCN vs. F2CN, Tables 1 and 2). We had expected the opposite trend because of the increase in planarity of the aromatic rings in the ladder-type systems, as indicated by the crystal structure (Fig. 2). While we could not obtain the crystal structures of L4PCN and (L3P)2CN, we expect that they also exhibit a similar planarity.
Another more conventional measure of electron delocalization is the reduction potential; in a series of homologous molecules, a more negative reduction potential indicates more localized electrons.61 The reduction potentials of the ladder-type oligophenylenes are slightly more negative than those of the oligofluorenes; e.g., a 20 mV difference between L4PCN and F2CN and between (L3P)2CN and F3CN. This counter-intuitive observation agrees with the IR shifts data. The reduction potential data can be rationalized based on the positional entropy that arises because the charge can reside in various positions, proposed by Miller and co-workers.62 The positional entropy increases with physical length beyond the delocalization length due to the possible occupation sites of the charge. Our previous study found that the delocalization of an electron is close to the physical size of F2CN, but its distribution is heavily skewed toward the nitrile.14 This means that an electron has room to move in the nitrile-functionalized polyphenylenes when the number of phenyl rings is ≥4. Our results indicate that the positional entropies are larger in F2CN and F3CN compared to their ladder-type analogues. We therefore argue that the source of the increased positional entropy is related to simple movements of dihedral angles (φ). We will further support this notion in the IR data presented below.
IR linewidths
The linewidth of the IR absorption band is influenced broadly by two mechanisms; one is a dynamic process intrinsic to the molecular system, termed homogeneous broadening, and the other is due to static effects, termed inhomogeneous broadening or an ensemble averaging effect. | ||
| Fig. 3 Comparisons of νanion in THF. (a) TRIR spectra of L3PCN˙− and 5CT˙−. (b) TRIR spectra of L4PCN˙− and F2CN˙−. These were all recorded ∼100 ns after pulse radiolysis of solutions of the neutrals. The spectra are normalized to highlight the difference in the linewidths. | ||
The two main sources of the aforementioned heterogeneous broadening are identified as follows. One is the movement of dihedral angles, which increases the conformations available for radical anions to adopt, and hence the charge can reside in more possible sites. This is only true when a charge has the physical room to fluctuate, i.e., the “delocalization length” is shorter than the molecular size. This increase in available conformations also explains the increased positional entropy contribution observed in the reduction potentials (see Section IR shifts). Such movements of dihedral angles are present for the neutral species, but evidently, their effects on the IR linewidths are negligible.
DFT calculations revealed an interesting picture to support our experimental observations. Consistent with the general picture that an excess charge “flattens” conjugated molecules,61,71 the dihedral angle in radical anions is smaller than that in the corresponding neutral species and it depends on the degree of electron delocalization (Table S3†). Scanning the potential energy surface along the dihedral angles shows that the conformations with smaller dihedral angles are more energetically accessible than those with larger dihedral angles (see Fig. S3† for F2CN˙−). While the charge becomes localized when we have a large or “bad”43 dihedral angle in the φ = 50–125° range because of the electron-accepting nature of the nitrile vibration, the computational results indicate their contributions to the overall populations are small in the current systems. Therefore, nuclear fluctuations associated with dihedral angle movements, when present, favor those conformations with smaller dihedral angles and therefore charges can be more delocalized. The physical lengths are slightly longer for the oligofluorenes with dihedral angles because hyperconjugation shortens the C–C bond length, e.g., d(F2CN) > d(L4PCN) (Fig. S4†). Consequently, when the molecules become flat, charges can be spread out over a larger distance than in ladder-type oligophenylenes, resulting in the observed blue-shift of the ν(CN) nitrile absorption band. To support this, DFT calculations on F2CN˙− show that the nitrile vibration does blue shift by ∼6 cm−1, on going from the optimized structure (φ ∼ 24°) to a completely flat structure (φ ∼ 0°). More conformations with smaller dihedral angles lead to heterogeneous broadening of the IR linewidth toward higher wavenumbers (blue-shift). These seemingly small contributions of the presence of dihedral angles are significant enough to result in the counterintuitive picture that a charge is more “delocalized” in oligofluorenes compared to in ladder-type oligophenylenes. IR amplifications also contribute to more intense absorptions at higher wavenumbers (see Section IR amplifications).
While the existence of flexible dihedral angles explains the difference in the longer molecules, this alone cannot explain the general trend of larger linewidths for νanion compared to νneutral in the current series. We previously observed that the linewidths of the neutral and radical anion are about the same for 9-cyanonanthracene (9-AntCN); FWHM ∼5–6 cm−1 in THF.14 This shows that the linewidths of such small molecules are likely limited by homogeneous broadening. Surprisingly, the linewidth of ν(CN) in a smaller molecule, PhCN˙− (∼10 cm−1) is about two times larger than that of 9-AntCN˙− (∼5.2 cm−1) and about the same as the radical anion of 1-cyanonapthalene (1-NapCN, ∼10 cm−1). This comparison shows that ν(CN) in PhCN˙− is clearly affected by heterogeneous broadening. The difference between these two molecules and the current series of polyphenylenes, including PhCN, is that an electron is delocalized in the same direction as the transition dipole moment of the nitrile vibration for the current series of linear oligophenylenes. This difference results in a different degree of coupling between an electron movement and the nitrile vibration. A stronger coupling in the linear oligophenylenes leads to more conformations available for radical anions, and hence we observe a significantly larger linewidth. A smaller linewidth for the larger 9-AntCN˙− compared to the smaller 1-NapCN˙− is likely due to the symmetric nature of charge delocalization in 9-AntCN˙−.
In a similar manner to the neutral case, the larger linewidth of the radical anions observed in DMF is likely caused by heterogeneous broadening. However, a clarification of this solvent-dependent change will require the measurement of vibrational relaxation time, which is an area of further investigation.
IR amplifications
We now turn our attention to the extinction coefficients. We observed clear amplifications of the ν(CN) band in the neutral forms and radical anions of longer oligophenylenes (Fig. 1). The origin of IR intensity amplifications can be attributed to two processes: (1) coupling between the redistribution of charges and vibrational motion, and (2) mixing between a low-lying electronic transition and a vibrational transition (vibronic coupling).35
O vibration observed by Barrow where he correlated the IR intensity with resonance energy or delocalization energy.72 Binev et al., also observed enhanced intensities of ν(CN) bands in the benzonitrile derivatives with anionic substituents.23 Nafie and co-workers suggested that we can qualitatively understand this enhancement in terms of electronic polarizability.73 Indeed, in the current series of molecules, we observed a correlation between the total intensity of the IR band and the computationally determined polarizability. There is also a correlation to some degree with the permanent dipole moment (Fig. S5†). The correlation with polarizability is likely due to the asymmetric nature of charge distribution in the nitrile-functionalized oligophenylenes; one nitrile group is attached to the end of a linear π-conjugated chain, acting as an electron accepting group. A larger asymmetry is the origin of the large polarizability and dipole moment. While we do not have an excess charge in the neutral species, we argue that the observed IR enhancement is through effective coupling between redistribution of this asymmetric charge and vibrational motion in a similar manner to the case of radical anions described below. This is also supported by the fact that removing flexible dihedral angles results in larger ε (e.g., F2CN vs. L4PCN). The movement of flexible dihedral angles induces charge distribution (see Section IR linewidths). DFT calculations also predict the same trend but to a lesser extent than the experimental values, showing that the intensity becomes large at a flat conformation (φ ∼ 0°) (Table S1†). Scanning the potential energy surfaces along the dihedral angle in the neutrals shows that the energy barrier to smaller dihedral angles becomes bigger in neutrals while the energy barrier for “bad” dihedral angles becomes smaller in neutrals (Fig. S3† for F2CN). Consequently, we have less population with smaller dihedral angles, and therefore smaller ε for non-ladder-types. In contrast to the extinction coefficients, the frequency itself stays almost constant. These observations illustrate that the ν(CN) band is coupled to the nuclear and electronic structural changes even in the neutral species, which is not clear if we only look at the frequency.
N) band is more prominent in the radical anion species (Fig. 1b and Table 1). While we have not measured the other vibrational modes, we can compare the nitrile-functionalized oligophenylenes with the non-functionalized oligophenylenes reported previously. For example, ε of ν(CN) in 5CT˙− is 5050 M−1 cm−1, higher than the most intense band in the radical anion of p-terphenyl reported by Sakamoto et al. (ε = 3430 M−1 cm−1 at 1491 cm−1, CC stretching along the molecular axis).74 Similarly, ε of ν(CN) in F2CN˙− is higher than the most intense band reported for F2˙−.34 Interestingly, ε of ν(CN) in F3CN˙− and (L3P)2CN˙− are lower than the most intense band in F3˙− (ε ∼ 2 × 10⁴ M−1 cm−1 at 1540 cm−1).34
Substantial dipole derivatives arise when charge distributions evolve in response to vibrations,75,76 and these can become significant for charges in polymers such as polyacetylene (IRAV bands).77,78 This mechanism is primarily responsible for the gigantic IR bands observed for asymmetric C–H rocking and CC stretching along the axis of the molecules in oligo- and polyfluorenes.34 The nuclear displacements associated with these modes produce net displacement of the charge, resulting in large dipole derivatives. Similarly, our results show that the nuclear displacement associated with the nitrile vibrational mode can induce significant displacement of the charge. This is illustrated in Fig. 4, which displays the Kohn–Sham singly occupied molecular orbital (SOMO) computed for (L3P)2CN˙−. Compression or stretching to the classical turning points of the nitrile vibration moves the charge away from or closer to ν(CN), respectively. These motions result in a significant change in the magnitude of the dipole moment. The key difference from the previous work is that the nitrile is located at the end of the molecules, instead of the middle of the molecules like CC and CC stretching modes.34,35 Our results suggest an interesting possibility that one may be able to vibrationally excite a nitrile located at the end of a molecule in order to alter the movements of spin-charges in a similar manner to exciting bridge vibrations.36–39
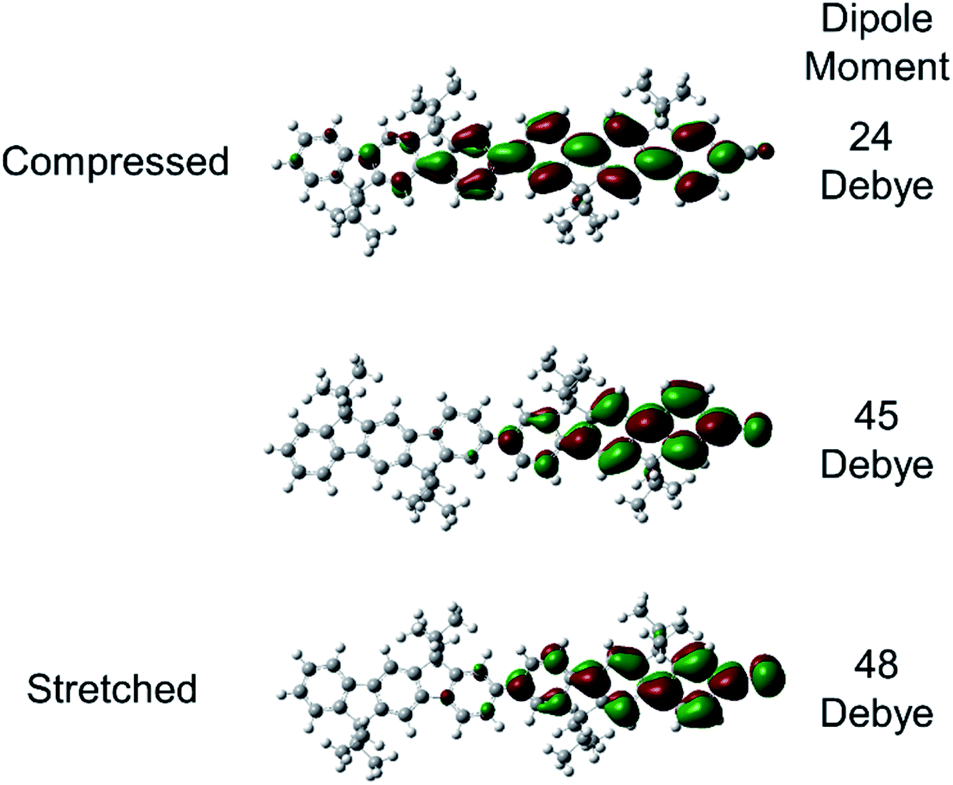 | ||
| Fig. 4 Charge shifts in response to vibrational displacement. Kohn–Sham SOMO orbitals calculated at LC-ωPBE (ω = 0.1 bohr−1 in PCM for THF)/6-31G(d) in (L3P)2CN˙−. The middle is the SOMO of optimized (L3P)2CN˙−. The top and the bottom are the SOMOs from single-point calculations on structures compressed and stretched to the classical turning points of the nitrile vibration. The computed magnitude of the dipole moment for each state is listed. | ||
The other mechanism of enhancement is vibronic coupling. Nafie has expressed the enhancement factor (LLe) of the transition dipole moment of an IR band at a frequency, ωa due to vibronic coupling to each low-energy electronic transition (ω0eg) by the following equation:79
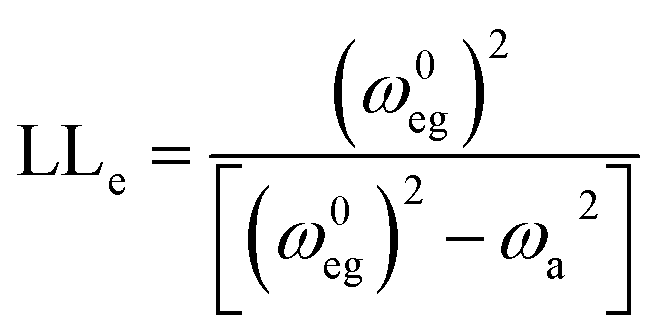 | (1) |
The amplification of dipole derivatives is small (LLe ∼ 1) when all electronic transitions lie much higher than the vibrational excitation (ω0eg ≫ ωa). The lowest electronic transitions (P1 band) of the radical anions of these oligophenylenes are in the red to NIR region. We measured the absorption spectra of L3PCN˙− and L4PCN˙− in THF (Fig. S6†), and those of F2CN˙− and F3CN˙− are previously reported.14 In particular, the P1 bands of L4PCN˙− and F3CN˙− are at ∼0.95 eV or 7690 cm−1 and ∼0.83 eV or 6670 cm−1, respectively. These transitions are a couple of times higher in energy than that of the ν(CN) bands at ωa ∼ 2100–2200 cm−1. Therefore, we expect that the contribution to the IR amplification from mixing with the electronic transition is small. Yet, the energy of the P1 band becomes smaller for a more delocalized electron,61 and the amplification through vibronic couplings will be greater at the delocalized geometries whose ν(CN) are at higher frequencies, which can contribute to the broader absorption on the blue side of the spectra (see Section IR linewidths).
Conclusions
We have demonstrated with a series of nitrile-functionalized aryl compounds that the nitrile vibration is strongly coupled to the nuclear and electronic dynamics, and that this coupling is more prominent in the charged (anionic) forms of the molecules. This coupling manifests itself largely in two ways. One is to induce a large dipole derivative, resulting in an amplification of the ν(CN) IR bands, consistent with the theory of Nafie79 and previous experimental observations.34,35 The other is to induce a wider array of conformational populations available for the charges to reside in, resulting in heterogeneous broadening of the linewidths of the IR absorption band. The heterogeneous broadening also stems from the presence of flexible dihedral angles. Using a new series of nitrile-functionalized ladder-type oligophenylenes whose planarity was confirmed by X-ray crystal structures, we showed that removing the flexible dihedral angles sharpens the ν(CN) IR band. Therefore, we have unambiguously demonstrated that the IR linewidth can report on structural and accompanying electronic fluctuations, proving our earlier speculation.14 In addition to IR shifts14,80 and IR intensities,34,35 our current work adds another quantifiable dimension, IR linewidth, to the use of IR probes for studying charges and excitons.
Data availability
The crystal structures have been uploaded as CIF files. Experimental data are provided in the manuscript and the ESI.†Author contributions
T. M. designed and directed the project. J. Y., R. W. W., and J. T. B. performed the synthesis. E. W. R. performed the X-ray crystallographic data collection and analysis. J. Y., R. W. W., D. C. G., and T. M. characterized the molecular systems with the spectroscopic studies. T. M. performed the quantum chemical calculations. T. M. wrote the manuscript with support from J. Y. and D. C. G.Conflicts of interest
There are no conflicts to declare.Acknowledgements
Synthetic work by J. Y. at BNL was supported by the Department of Energy (DOE), Office of Science, Office of Workforce Development for Teachers and Scientists (WDTS) under the Visiting Faculty Program in 2016, 2017, 2018 as well as by the Louis Stokes Alliances for Minority Participation (LSAMP) program by the National Science Foundation in 2019. T. M. is grateful for startup funds from the University of Connecticut. Use of the LEAF facility of the BNL Accelerator Center for Energy Research, the computer cluster at the Center for Functional Nanomaterials, and all of D. C. G.'s work was supported by the U.S. DOE, Office of Science, Office of Basic Energy Sciences, Division of Chemical Sciences, Geosciences & Biosciences under contract no. DE-SC0012704. R. W. W.'s work at BNL was supported by the U. S. DOE, Office of Science, Office of WDTS under the Science Undergraduate Laboratory Internships (SULI) program. BNL Laboratory Directed Research and Development (LDRD) (project numbers 18-056 and 19-015) also supported the synthesis and characterization of the molecules and T. M.'s extended visits to BNL.Notes and references
- T. M. Clarke and J. R. Durrant, Chem. Rev., 2010, 110, 6736–6767 CrossRef CAS PubMed.
- M. R. Wasielewski, M. D. E. Forbes, N. L. Frank, K. Kowalski, G. D. Scholes, J. Yuen-Zhou, M. A. Baldo, D. E. Freedman, R. H. Goldsmith, T. Goodson, M. L. Kirk, J. K. McCusker, J. P. Ogilvie, D. A. Shultz, S. Stoll and K. B. Whaley, Nat. Rev. Chem., 2020, 4, 490–504 CrossRef CAS.
- S. D. Fried and S. G. Boxer, Acc. Chem. Res., 2015, 48, 998–1006 CrossRef CAS PubMed.
- C. R. Baiz, B. Błasiak, J. Bredenbeck, M. Cho, J.-H. Choi, S. A. Corcelli, A. G. Dijkstra, C.-J. Feng, S. Garrett-Roe, N.-H. Ge, M. W. D. Hanson-Heine, J. D. Hirst, T. L. C. Jansen, K. Kwac, K. J. Kubarych, C. H. Londergan, H. Maekawa, M. Reppert, S. Saito, S. Roy, J. L. Skinner, G. Stock, J. E. Straub, M. C. Thielges, K. Tominaga, A. Tokmakoff, H. Torii, L. Wang, L. J. Webb and M. T. Zanni, Chem. Rev., 2020, 120, 7152–7218 CrossRef CAS PubMed.
- J. M. Butler, M. W. George, J. R. Schoonover, D. M. Dattelbaum and T. J. Meyer, Coord. Chem. Rev., 2007, 251, 492–514 CrossRef CAS.
- J. B. Asbury, in Ultrafast Infrared Vibrational Spectroscopy, ed. M. D. Fayer, CRC Press, Boca Raton, 1st edn, 2013, ch. 8, pp. 239–267 Search PubMed.
- A. Vlček, H. Kvapilová, M. Towrie and S. Záliš, Acc. Chem. Res., 2015, 48, 868–876 CrossRef.
- B. Dereka, M. Koch and E. Vauthey, Acc. Chem. Res., 2017, 50, 426–434 CrossRef CAS PubMed.
- K. T. Munson, E. R. Kennehan and J. B. Asbury, J. Mater. Chem. C, 2019, 7, 5889–5909 RSC.
- S. G. Boxer, J. Phys. Chem. B, 2009, 113, 2972–2983 CrossRef CAS PubMed.
- S. D. Fried, S. Bagchi and S. G. Boxer, Science, 2014, 346, 1510–1514 CrossRef CAS PubMed.
- B. Błasiak, C. H. Londergan, L. J. Webb and M. Cho, Acc. Chem. Res., 2017, 50, 968–976 CrossRef PubMed.
- J. Z. Olson, S. H. Schneider, P. K. Johansson, T. S. Luk and C. W. Schlenker, J. Phys. Chem. C, 2019, 123, 11484–11492 CrossRef CAS.
- T. Mani, D. C. Grills, M. D. Newton and J. R. Miller, J. Am. Chem. Soc., 2015, 137, 10979–10991 CrossRef CAS PubMed.
- T. Mani and D. C. Grills, J. Phys. Chem. B, 2017, 121, 7327–7335 CrossRef CAS PubMed.
- T. Mani, D. C. Grills and J. R. Miller, J. Am. Chem. Soc., 2015, 137, 1136–1140 CrossRef CAS PubMed.
- J. Hack, D. C. Grills, J. R. Miller and T. Mani, J. Phys. Chem. B, 2016, 120, 1149–1157 CrossRef CAS PubMed.
- J. F. Wishart, A. R. Cook and J. R. Miller, Rev. Sci. Instrum., 2004, 75, 4359–4366 CrossRef CAS.
- D. C. Grills, A. R. Cook, E. Fujita, M. W. George, J. M. Preses and J. F. Wishart, Appl. Spectrosc., 2010, 64, 563–570 CrossRef CAS PubMed.
- D. C. Grills, J. A. Farrington, B. H. Layne, J. M. Preses, H. J. Bernstein and J. F. Wishart, Rev. Sci. Instrum., 2015, 86, 044102 CrossRef PubMed.
- A. M. Boudreau, R. W. Wilson, M. Yang, D. C. Grills and T. Mani, J. Phys. Chem. B, 2020, 124, 1543–1549 CrossRef CAS PubMed.
- T. Mani and D. C. Grills, J. Phys. Chem. A, 2018, 122, 7293–7300 CrossRef CAS PubMed.
- I. G. Binev, R. B. Kuzmanova, J. Kaneti and I. N. Juchnovski, J. Chem. Soc., Perkin Trans. 2, 1982, 1533–1536 RSC.
- I. Juchnovski, R. Kuzmanova, J. Tsenov, J. Kaneti and I. Binev, Z. Naturforsch., B: Anorg. Chem., Org. Chem., 1978, 33, 557–563 CrossRef.
- I. N. Juchnovski and I. G. Binev, Tetrahedron, 1977, 33, 2993–2995 CrossRef CAS.
- E. W. Abel and I. S. Butler, Trans. Faraday Soc., 1967, 63, 45–55 RSC.
- I. M. Baibich, A. M. English and I. S. Butler, Organometallics, 1984, 3, 1786–1789 CrossRef CAS.
- D. Moses, A. Dogariu and A. J. Heeger, Chem. Phys. Lett., 2000, 316, 356–360 CrossRef CAS.
- H. Neugebauer, S. Srinivasan, S. Tasch, G. Leising and N. S. Sariciftci, Electrochemically and photo-induced infrared bands in PPV: a comparative study, SPIE, 1997 Search PubMed.
- H. Neugebauer, J. Electroanal. Chem., 2004, 563, 153–159 CrossRef CAS.
- S. Kahmann, M. A. Loi and C. J. Brabec, J. Mater. Chem. C, 2018, 6, 6008–6013 RSC.
- J. Yin, Z. Wang, D. Fazzi, Z. Shen and C. Soci, J. Phys. Chem. C, 2016, 120, 1994–2001 CrossRef CAS.
- C. H. Londergan, J. C. Salsman, S. Ronco and C. P. Kubiak, Inorg. Chem., 2003, 42, 926–928 CrossRef CAS PubMed.
- M. Zamadar, S. Asaoka, D. C. Grills and J. R. Miller, Nat. Commun., 2013, 4, 2818 CrossRef.
- W. J. Kendrick, M. Jirásek, M. D. Peeks, G. M. Greetham, I. V. Sazanovich, P. M. Donaldson, M. Towrie, A. W. Parker and H. L. Anderson, Chem. Sci., 2020, 11, 2112–2120 RSC.
- M. Delor, I. V. Sazanovich, M. Towrie and J. A. Weinstein, Acc. Chem. Res., 2015, 48, 1131–1139 CrossRef CAS PubMed.
- M. Delor, T. Keane, P. A. Scattergood, I. V. Sazanovich, G. M. Greetham, M. Towrie, A. J. H. M. Meijer and J. A. Weinstein, Nat. Chem., 2015, 7, 689–695 CrossRef CAS PubMed.
- M. Delor, P. A. Scattergood, I. V. Sazanovich, A. W. Parker, G. M. Greetham, A. J. H. M. Meijer, M. Towrie and J. A. Weinstein, Science, 2014, 346, 1492–1495 CrossRef CAS PubMed.
- Z. W. Lin, C. M. Lawrence, D. Q. Xiao, V. V. Kireev, S. S. Skourtis, J. L. Sessler, D. N. Beratan and I. V. Rubtsov, J. Am. Chem. Soc., 2009, 131, 18060–18062 CrossRef CAS PubMed.
- Y. C. Teo, H. W. H. Lai and Y. Xia, Chem.–Eur. J., 2017, 23, 14101–14112 CrossRef CAS.
- T.-P. Liu, C.-H. Xing and Q.-S. Hu, Angew. Chem., Int. Ed., 2010, 49, 2909–2912 CrossRef CAS PubMed.
- C.-C. Hsiao, Y.-K. Lin, C.-J. Liu, T.-C. Wu and Y.-T. Wu, Adv. Synth. Catal., 2010, 352, 3267–3274 CrossRef CAS.
- T. Mani and J. R. Miller, J. Phys. Chem. A, 2014, 118, 9451–9459 CrossRef CAS PubMed.
- A. J. Bard and L. R. Faulkner, Electrochemical Methods: Fundamentals and Applications, Wiley, 2nd edn, 2001 Search PubMed.
- J. Jagur-Grodzinski, M. Feld, S. L. Yang and M. Szwarc, J. Phys. Chem., 1965, 69, 628–635 CrossRef CAS.
- CrysAlisPro, Rigaku Oxford Diffraction, 2019, version 171.140.167a Search PubMed.
- SCALE3 ABSPACK, A Rigaku Oxford Diffraction program for Absorption Corrections, Rigaku Oxford Diffraction, 2017 Search PubMed.
- G. Sheldrick, Acta Crystallogr., Sect. A: Found. Adv., 2015, 71, 3–8 CrossRef PubMed.
- G. Sheldrick, Acta Crystallogr., Sect. C: Struct. Chem., 2015, 71, 3–8 Search PubMed.
- O. V. Dolomanov, L. J. Bourhis, R. J. Gildea, J. A. K. Howard and H. Puschmann, J. Appl. Crystallogr., 2009, 42, 339–341 CrossRef CAS.
- A. Spek, Acta Crystallogr., Sect. D: Struct. Biol., 2009, 65, 148–155 CrossRef CAS.
- M. J. Frisch, G. W. Trucks, H. B. Schlegel, G. E. Scuseria, M. A. Robb, J. R. Cheeseman, G. Scalmani, V. Barone, G. A. Petersson, H. Nakatsuji, X. Li, M. Caricato, A. V. Marenich, J. Bloino, B. G. Janesko, R. Gomperts, B. Mennucci, H. P. Hratchian, J. V. Ortiz, A. F. Izmaylov, J. L. Sonnenberg, D. Williams-Young, F. Ding, F. Lipparini, F. Egidi, J. Goings, B. Peng, A. Petrone, T. Henderson, D. Ranasinghe, V. G. Zakrzewski, J. Gao, N. Rega, G. Zheng, W. Liang, M. Hada, M. Ehara, K. Toyota, R. Fukuda, J. Hasegawa, M. Ishida, T. Nakajima, Y. Honda, O. Kitao, H. Nakai, T. Vreven, K. Throssell, J. A. Montgomery Jr, J. E. Peralta, F. Ogliaro, M. J. Bearpark, J. J. Heyd, E. N. Brothers, K. N. Kudin, V. N. Staroverov, T. A. Keith, R. Kobayashi, J. Normand, K. Raghavachari, A. P. Rendell, J. C. Burant, S. S. Iyengar, J. Tomasi, M. Cossi, J. M. Millam, M. Klene, C. Adamo, R. Cammi, J. W. Ochterski, R. L. Martin, K. Morokuma, O. Farkas, J. B. Foresman, and D. J. Fox, Gaussian 16 Revision B.01, Gaussian, Inc., Wallingford CT, 2016 Search PubMed.
- O. A. Vydrov, J. Heyd, A. V. Krukau and G. E. Scuseria, J. Chem. Phys., 2006, 125, 074106 CrossRef.
- O. A. Vydrov and G. E. Scuseria, J. Chem. Phys., 2006, 125, 234109 CrossRef PubMed.
- O. A. Vydrov, G. E. Scuseria and J. P. Perdew, J. Chem. Phys., 2007, 126, 154109 CrossRef.
- I. N. Juchnovski and I. G. Binev, J. Mol. Struct., 1971, 7, 490–494 CrossRef.
- I. N. Juchnovski and I. G. Binev, Chem. Phys. Lett., 1971, 12, 40–43 CrossRef.
- S. Farid, J. P. Dinnocenzo, P. B. Merkel, R. H. Young, D. Shukla and G. Guirado, J. Am. Chem. Soc., 2011, 133, 11580–11587 CrossRef CAS PubMed.
- A. Paul, R. Borrelli, H. Bouyanfif, S. Gottis and F. Sauvage, ACS Omega, 2019, 4, 14780–14789 CrossRef CAS PubMed.
- M. Hempe and M. Reggelin, RSC Adv., 2017, 7, 47183–47189 RSC.
- L. Zaikowski, P. Kaur, C. Gelfond, E. Selvaggio, S. Asaoka, Q. Wu, H.-C. Chen, N. Takeda, A. R. Cook, A. Yang, J. Rosanelli and J. R. Miller, J. Am. Chem. Soc., 2012, 134, 10852–10863 CrossRef CAS PubMed.
- H. C. Chen, P. Sreearunothai, A. R. Cook, S. Asaoka, Q. Wu and J. R. Miller, J. Phys. Chem. C, 2017, 121, 5959–5967 CrossRef CAS.
- Z. Getahun, C.-Y. Huang, T. Wang, B. De León, W. F. DeGrado and F. Gai, J. Am. Chem. Soc., 2003, 125, 405–411 CrossRef CAS PubMed.
- M. G. Maienschein-Cline and C. H. Londergan, J. Phys. Chem. A, 2007, 111, 10020–10025 CrossRef CAS PubMed.
- N. M. Levinson, S. D. Fried and S. G. Boxer, J. Phys. Chem. B, 2012, 116, 10470–10476 CrossRef CAS PubMed.
- H. J. Bakker, P. C. M. Planken and A. Lagendijk, Nature, 1990, 347, 745–747 CrossRef CAS.
- K.-H. Park, J. Jeon, Y. Park, S. Lee, H.-J. Kwon, C. Joo, S. Park, H. Han and M. Cho, J. Phys. Chem. Lett., 2013, 4, 2105–2110 CrossRef CAS.
- L. J. G. W. van Wilderen, D. Kern-Michler, H. M. Muller-Werkmeister and J. Bredenbeck, Phys. Chem. Chem. Phys., 2014, 16, 19643–19653 RSC.
- W. Zhang, B. N. Markiewicz, R. S. Doerksen, I. I. I. A. B. Smith and F. Gai, Phys. Chem. Chem. Phys., 2016, 18, 7027–7034 RSC.
- J. Ma, I. M. Pazos and F. Gai, Proc. Natl. Acad. Sci. U. S. A., 2014, 111, 8476–8481 CrossRef CAS PubMed.
- S. Fratiloiu, F. C. Grozema, Y. Koizumi, S. Seki, A. Saeki, S. Tagawa, S. P. Dudek and L. D. A. Siebbeles, J. Phys. Chem. B, 2006, 110, 5984–5993 CrossRef CAS PubMed.
- G. M. Barrow, J. Chem. Phys., 1953, 21, 2008–2011 CrossRef CAS.
- W. L. Peticolas, L. Nafie, P. Stein and B. Fanconi, J. Chem. Phys., 1970, 52, 1576–1584 CrossRef CAS.
- A. Sakamoto, T. Harada and N. Tonegawa, J. Phys. Chem. A, 2008, 112, 1180–1187 CrossRef CAS.
- M. J. Rice, Phys. Rev. Lett., 1976, 37, 36–39 CrossRef CAS.
- M. J. Rice, C. B. Duke and N. O. Lipari, Solid State Commun., 1975, 17, 1089–1093 CrossRef CAS.
- S. Etemad, A. Pron, A. J. Heeger, A. G. MacDiarmid, E. J. Mele and M. J. Rice, Phys. Rev. B: Condens. Matter Mater. Phys., 1981, 23, 5137–5141 CrossRef CAS.
- E. J. Mele and M. J. Rice, Phys. Rev. Lett., 1980, 45, 926–929 CrossRef CAS.
- L. A. Nafie, J. Phys. Chem. A, 2004, 108, 7222–7231 CrossRef CAS.
- I. V. Rubtsov, Y. K. Kang, N. P. Redmore, R. M. Allen, J. R. Zheng, D. N. Beratan and M. J. Therien, J. Am. Chem. Soc., 2004, 126, 5022–5023 CrossRef CAS PubMed.
Footnote |
| † Electronic supplementary information (ESI) available: Synthetic details, characterization of new compounds, details of X-ray crystallographic data, Scheme S1, Fig. S1–S6, Tables S1–S3, additional references, and NMR spectra. CCDC 209702 and 209703. For ESI and crystallographic data in CIF or other electronic format see DOI: 10.1039/d1sc03455c |
| This journal is © The Royal Society of Chemistry 2021 |