 Open Access Article
A ratiometric photoelectrochemical microsensor based on a small-molecule organic semiconductor for reliable in vivo analysis†
Yunhui
Xiang
a,
Yao
Kong
b,
Wenqi
Feng
a,
Xiaoxue
Ye
*b and
Zhihong
Liu
 *a
*a
aCollege of Chemistry and Molecular Sciences, Wuhan University, Wuhan 430072, China. E-mail: zhhliu@whu.edu.cn
bCollege of Chemistry and Chemical Engineering, Hubei University, Wuhan 430062, China. E-mail: yexxchem@hubu.edu.cn
First published on 1st September 2021
Abstract
Photoelectrochemical (PEC) sensing has been developing quickly in recent years, while its in vivo application is still in the infancy. The complexity of biological environments poses a high challenge to the specificity and reliability of PEC sensing. We herein proposed the concept of small-molecule organic semiconductor (SMOS)-based ratiometric PEC sensing making use of the structural flexibility as well as readily tunable energy band of SMOS. Xanthene skeleton-based CyOH was prepared as a photoactive molecule, and its absorption band and corresponding PEC output can be modulated by an intramolecular charge transfer process. As such, the target mediated shift of absorption offered the opportunity to construct a ratiometric PEC sensor. A proof-of-concept probe CyOThiols was synthesized and assembled on a Ti wire electrode (TiWE) to prepare a highly selective microsensor for thiols. Under two monochromatic laser excitation (808 nm and 750 nm), CyOThiols/TiWE offered a ratiometric signal (j808/j750), which exhibited pronounced capacity to offset the disturbance of environmental factors, guaranteeing its reliability for application in vivo. The ratiometric PEC sensor achieved the observation of bio-thiol release induced by cytotoxic edema and fluctuations of thiols in drug-induced epilepsy in living rat brains.
Introduction
Abnormal concentration fluctuations of neurotransmitters, neuromodulators and other signalling molecules are closely associated with many brain-related physiological and pathological events.1 Thus, monitoring the dynamics of extracellular neurochemicals in vivo can provide direct insight into the molecular basis of brain function. There has been ever increasing interest in the development of reliable and effective analytical protocols for in situ monitoring of neurochemicals. In vivo electrochemical (EC) analysis is a promising tool for such tasks due to the merits of high spatial–temporal resolution and favorable sensitivity. A variety of EC microsensors have been rationally designed in the last few decades for monitoring extracellular neurochemicals employing their inherent physicochemical properties in the brain.2As an important new branch of EC analysis, photoelectrochemical (PEC) assay has undergone rapid development in recent years and shown its prospect for in vivo research.3 Instead of exerting an external bias to trigger an electrochemical readout as traditional EC assays do, a local potential at the photoelectrode surface is generated by applying light excitation to photoactive materials in PEC sensing, which provides higher biocompatibility and a reduced background signal as compared to conventional EC assays.3a,4 Nonetheless, its application for in vivo analysis has rarely been reported, since it is facing two major challenges, namely specificity and reliability in complex biological environments.5 To address the concern of specificity, we recently proposed a fluorescence resonance energy transfer (FRET) modulated PEC sensing strategy.6 The introduction of chemical recognition towards a target and modulation of the electrochemical readout by an optical process enabled the specific detection of diverse analytes (both electroactive and electrochemically non-active) in live animals. So far, however, there has been no solution to ensure the reliability and accuracy of PEC sensing in vivo. Because of the high sensitivity, the photocurrent response is prone to be impacted by instrumental or environmental factors. For example, the co-existing reductive substances like ascorbic acid (AA), dopamine (DA), 5-hydroxytryptophane (5-HT) and so forth in the physiological environment are likely to lead to false positive or false negative results.3a This is decided by the principle of PEC sensing, which relies on a hole (or electron) trapping agent for signal outputting.
As well documented, ratiometric signal output has strong anti-interference capability and presents much higher reliability in complex environments.7 The ratiometric signal has been widely employed in optical probes but is seldomly seen in PEC sensing.8 Very few ratiometric PEC sensors were fabricated by using two photoactive materials or two photoelectrodes, which, however, still remains uncertain because it is hard to offset the systematic error between the two electrodes or two photoactive materials.9 Besides, the rather complicated photoelectrode modification process is unfavourable for the reproducibility of assay. Hence, it would be ideal to construct a ratiometric PEC sensor using a single photoactive material with a single photoelectrode. Unfortunately, the energy level and chemical structure of photoactive materials (mostly inorganic semiconductors) are hard to tune by the target recognition process, which makes it nearly impossible to output two self-calibrated signals before and after the response to targets.10
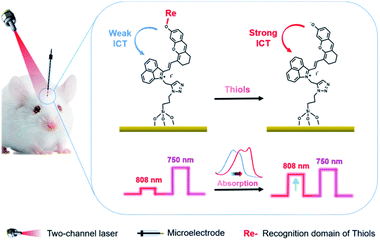
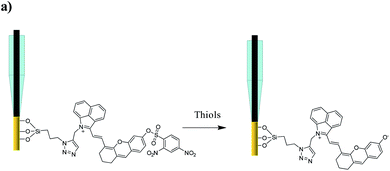
A small-molecule organic semiconductor (SMOS) is another kind of photoactive material with wide application in photovoltaic fields.11 As a structurally flexible small molecule, it is not hard to modulate the HOMO–LUMO energy-level difference through regulating the electron-pushing (or pulling) capacity of an electron donor (or acceptor) or the length of the conjugate chain of the molecule.12 Such a readily tunable band gap gives us a hint that we might be able to adjust the energy-level difference of a SMOS upon its response towards a specific target (typically a chemical reaction) via a rational structural design. The change of the energy-level difference will possibly cause the variation of its optical absorption, thus offering the opportunity to generate two PEC output signals at two optical channels.12b Inspired by this, we herein put forward the concept of a SMOS-based ratiometric PEC sensor. To facilitate its use in the living body, which requires a large penetration depth of light, a SMOS based on the xanthene skeleton by introducing 1-propyne-2-methyl-benz[c,d]indolium salt (named CyOH) absorbing in the NIR region was prepared as the photoactive molecule. By substituting the hydrogen of –OH with different electron-donating or withdrawing groups, the structure–activity relationship of SMOSs was looked into. Thereafter, as a proof of concept, we constructed a wavelength-resolved ratiometric PEC microsensor (named CyOThiols) through the incorporation of a recognition group for thiols at the –OH position (Scheme 1). The NIR-light driven PEC sensor was utilized to monitor the levels of thiols in live rat brains. The fluctuations of thiols in the process of cytotoxic edema and drug-induced epilepsy in rat brains were evaluated. The SMOS here acted as both the photoactive material and the carrier of recognition units. To the best of our knowledge, this is the first SMOS-based ratiometric PEC sensor, which not only achieved self-calibrated measurement but also simplified the configuration of the photoelectrode, significantly improving the reliability of in vivo sensing.
Results and discussion
Design and photophysical properties of SMOSs
Typically, an electron donor (D)–π–electron acceptor (A) type dipolar structure is beneficial to the intramolecular charge transfer (ICT) process so as to red-shift the absorption band of an organic dye. Herein, 1-propyne-2-methyl-benz[c,d]indolium salt was selected as an electron acceptor, in which benz[c,d]indolium salt acts as a strong electron-pulling end. 6-Hydroxyl-2,3-dihydro-1H-xanthene-4-carbaldehyde with a large conjugated plane was used as the conjugate skeleton. The hydroxyl group at the 6-position was designed as the electron-pushing end and utilized to regulate the optical absorption and the photoelectrochemical properties, since, as known, the electron-pushing/pulling effect of –OH can be flexibly switched between the modification and release of this group.12b The two motifs, i.e., 1-propyne-2-methyl-benz[c,d]indolium salt and 6-hydroxyl-2,3-dihydro-1H-xanthene-4-carbaldehyde, were connected through a Knoevenagel reaction to prepare CyOH with a D–π–A structure (Scheme S1c†).12a The terminal acetylene group was designed as a reaction site for the immobilization of the molecules onto the electrode surface via a click reaction. To investigate the structure–activity relationship of SMOSs, we incorporated two representative substituents (methyl and carbethoxy groups) into the hydroxyl position of CyOH, resulting in CyOMe and CyOAc, respectively (Scheme S1†). All the synthesized organic compounds were confirmed by 1H NMR and HRMS (Fig. S1–S6†).As shown in Fig. 1a, CyOH (760 nm) and CyOMe (753 nm) had similar maximum absorption wavelengths, while CyOAc showed the maximum absorption at 734 nm. The obvious blue shift of the absorption band of CyOAc can be attributed to the strong electron-pulling effect of the carbethoxy group, which effectively weakened the electron-donating ability of the oxygen atom and thus reduced the ICT effect.12b To further assess whether the modification/release of the hydroxyl group could alter the ICT effect, the absorption spectra of CyOH were recorded in aqueous buffers with different pH values, where the molecule exists in a protonated or deprotonated form (Scheme S2†). As the pKa of CyOH was calculated to be 6.2 according to the Henderson–Hasselbalch-type mass action equation,13 we selected pH 4.0, 6.0 and 7.4 for tests. As shown in Fig. 1b, the protonated form exhibited a maximum absorption at 753 nm (pH 4.0), and there was a 42 nm red shift of absorption at pH 7.4 (the peak at 795 nm). This is explained by the strong electron-donating ability of the deprotonated hydroxyl group, which enhanced the ICT efficiency. Besides, the absorbance of CyOH at 808 nm (the wavelength of a commonly used commercial laser) kept constant in the physiological pH range (Fig. S7†). The above results suggested the possibility to make CyOH-based sensors by modifying a specific recognition group on –OH, given that the modification weakens the electron-donating ability of the oxygen atom and thus reduces the ICT effect. Once CyORe (Re refers to the recognition domain of the target) specifically reacted with the target to give CyOH, which then further deprotonated at physiological pH, the ICT effect would be remarkably strengthened, and therefore an obvious red shift of the absorption wavelength after the target recognition can be acquired. Therefore, an increased photocurrent under longer-wavelength (808 nm) excitation relative to that under shorter-wavelength (750 nm, set as a built-in reference) excitation after the recognition reaction could be expected. By employing these two distinguished excitation channels, the construction of ratiometric PEC sensors based on a SMOS would become possible.
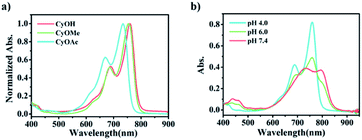 | ||
Fig. 1 Absorption spectra of (a) CyOH, CyOMe and CyOAc in PBS buffer at pH 4.0 and (b) CyOH at pH 4.0, 6.0 and 7.4, respectively (PBS/MeCN = 6![[thin space (1/6-em)]](https://www.rsc.org/images/entities/char_2009.gif) : :![[thin space (1/6-em)]](https://www.rsc.org/images/entities/char_2009.gif) 4). 4). | ||
Theoretical calculations
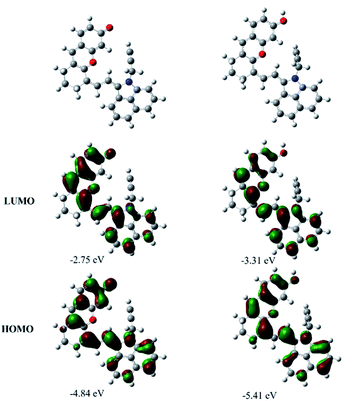
To have a better understanding of the structure–activity relationship of CyOH and its derivatives, density functional theory (DFT) calculations at the B3LYP/6-31G(d,p) level with Grimme's dispersion correction (D3-BJ) in water (PCM solvent model) using the Gaussian 16 program were performed. Orbital composition analysis was performed by using Multiwfn software.14Fig. 2 and S8† show the representative optimized structures and molecular orbital plots (LUMO and HOMO) of the substances including CyO−, CyOH, CyOMe and CyOAc. The HOMO and LUMO were all mainly located on the π-conjugated system of CyO−, CyOH, CyOMe and CyOAc. However, the contributions of O-linked functional groups were different, which were calculated by Mulliken partition and the obtained results are listed in Table S1.† The basic characteristics of a molecule with the ICT effect is that the HOMO is distributed at the electron donor (D) end, and the LUMO is distributed at the electron acceptor (A) end. Therefore, the contribution of substituents to D will lead to the enhancement of the ICT effect, resulting in the increase of electron mobilities in the molecular conjugate system and a narrowed HOMO–LUMO gap. On the macro view, it will eventually cause a redshift in the absorption wavelength. It is shown that the contribution to the HOMO and LUMO increased with the electron-donating ability strengthening, which is consistent with the basic characteristics of the ICT effect. Since the transition of S0 → S1 was mainly contributed by the electron transition from the HOMO to the LUMO, the difference of the contribution (HOMO–LUMO) reflected the level of ICT. That is, the ICT effect was enhanced by the electron-donating ability, resulting in the strongest ICT effect of CyO− and the weakest ICT effect of CyOAc. Comparing the HOMO–LUMO gaps among CyO−, CyOH, CyOMe and CyOAc (Table S2†), it is also found that the gap decreased with the electron-donating ability strengthening. The absorption spectra of these compounds can be explained by the gap variation: the lower the gap, the longer the absorption. Additionally, the variation trend of experimental spectral results was basically in agreement with the theoretical calculations. In a word, DFT calculations proved that the structure–activity relationship of CyOH and its derivatives exhibited the typical characteristics of the ICT effect, i.e. the intensity of ICT decided the shift of the absorption band, which is the physical basis for constructing a ratiometric PEC sensor.Photoelectrochemical properties of SMOSs
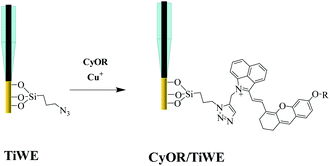
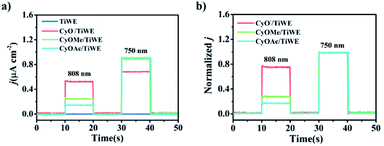
A piece of titanium wire with a diameter of 100 μm was used as the working electrode. To guarantee the stability and reproducibility of modified electrodes, SMOSs were chemically bonded to the surface of the electrode via a process shown in Scheme 2. Briefly, 3-(azidopropyl)triethoxysilane was connected to the hydroxylated Ti wire through a silicon–oxygen bond, and the as-obtained wire was denoted as TiWE. Energy dispersive spectroscopy (EDS) analysis showed increased C and Si contents after this modification step, indicating the successful preparation of TiWE (Fig. S9†). In situ Fourier transform infrared spectroscopy (IS-FTIR) (Fig. S10†) also revealed that there were plenty of azido groups (2105 cm−1) on the surface of TiWE. 1 mm length of TiWE was reserved for the subsequent loading of SMOSs, while the remaining part was encapsulated in a capillary tube (Fig. S11a†). Then, CyOR (R = –H, –Me, –Ac) were separately fixed on the surface of the TiWE electrodes by a Cu-catalyzed click reaction between the terminal acetylene group of CyOR and the azido group of the electrode surface. The scanning electron microscope (SEM) image (Fig. S11b and c†) exhibited a rough surface of TiWE, which is beneficial to increase the effective area for CyOR immobilization and in favourable for interfacial reactions.10,15The effect of different substitution groups at hydroxyl on the photoelectrochemical properties of SMOSs was investigated. As shown in Fig. 3a, all three CyOR molecules produced obvious photocurrent signals under both 808 nm and 750 nm excitation. Further observations of the relationship between photocurrent intensities and the concentration of ascorbic acid (AA), which is a commonly used electron provider for anodic photocurrent measurements, indicated that the photocurrent generation had an obvious dependence on the amount of reductive reactant such as AA (Fig. S12†). According to a previously reported photoelectrochemical mechanism for SMOSs like toluidine blue and methylene blue,4,16 we briefly interpreted the photoelectrochemical reaction of CyOR as shown below, which consists of three consecutive steps: the organic molecule S transformed into its corresponding excited state upon light excitation (eqn (1)), and the reductive reactant (AA) could reduce the excited state to (S*)red (eqn (2)), which may transfer electrons to the electrodes and generate anodic photocurrent (eqn (3)).
 | (1) |
| S* + AA → (S*)red + (AA)ox | (2) |
| (S*)red → S + e− | (3) |
Since CyO− (the deprotonated form of CyOH) had maximal absorption at around 800 nm, its anodic photocurrent intensity was higher than the other two molecules under 808 nm excitation, whereas its photocurrent intensity was lower than the other two under 750 nm excitation. Notably, the ratiometric signal (j808/j750) of CyO−/TiWE was 3.3 times larger than that of CyOMe/TiWE and 4.5 times larger than that of CyOAc/TiWE (Fig. 3b), further implying the rationality of making ratiometric PEC sensors by modifying certain recognition groups on –OH, taking the photocurrent signal under 750 nm excitation as a built-in reference.
Response performance of the ratiometric PEC microsensor for thiols
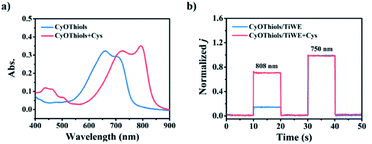
Thiols are thought to play critical roles in various physiological and pathological processes. An abnormal level of thiols in organisms indicates a variety of diseases such as organ damage, neurodegenerative diseases, and slower growth.17 Thus, it is of high interest to monitor total biological thiols in the body. A chemosensor for thiols, CyOThiols, was synthesized by incorporating a recognition domain of thiols (2,4-dinitrobenzenesulfonyl chloride) on the hydroxyl group of CyOH (Scheme S3†). The structure of CyOThiols was confirmed by 1H NMR and HRMS (Fig. S13†). Optical absorption measurements were firstly conducted to verify the response of CyOThiols towards thiols, in which we used cysteine (Cys) to represent thiols since thiols equilibrate with each other in biosystems.17c As demonstrated in Fig. 4a, CyOThiols itself exhibited a strong absorption band at 734 nm, which was similar to that of CyOAc. After reacting with Cys, the absorption peak red-shifted to 795 nm, which was the result of Cys mediated structural transformation from CyOThiols into CyO− (Scheme 3). The reaction was quick and completed in only 2 minutes, and the absorption of the product was stable (Fig. S14†).To fabricate a ratiometric PEC microsensor for thiols, CyOThiols was immobilized on TiWE via the above-mentioned click reaction. Correspondingly, an increased photocurrent signal under 808 nm excitation was obtained in the presence of Cys, when normalized to the photocurrent obtained under 750 nm excitation (Fig. 4b). Due to the involvement of interface mass transfer, the response time of CyOThiols/TiWE to Cys was longish but the reaction still completed within 4 minutes (Fig. S15†). To study the selectivity of the PEC microsensor, various potential interfering species were investigated in parallel under the same conditions. As shown in Fig. S16,† after incubating with those interfering species alone, no obvious photocurrent response was detected, and the co-incubation of the species and Cys didn't cause a significant change of the photocurrent response of Cys, indicating a pronounced specificity of CyOThiols/TiWE towards thiols over the other species. A good linear relationship was established between the ratiometric signal (j808/j750, denoted as r in Fig. S17†) and the logarithm of Cys concentration, log(c) in the ranges of 2.0 to 100 μM: r = 0.194![[thin space (1/6-em)]](https://www.rsc.org/images/entities/char_2009.gif) log(c) + 0.018 (R2 = 0.993) and 100 to 1000 μM: r = 0.441
log(c) + 0.018 (R2 = 0.993) and 100 to 1000 μM: r = 0.441![[thin space (1/6-em)]](https://www.rsc.org/images/entities/char_2009.gif) log(c) − 0.475 (R2 = 0.996), and the limit of detection was calculated to be 0.65 μM, which laid down the foundation for the quantitative detection of the target.
log(c) − 0.475 (R2 = 0.996), and the limit of detection was calculated to be 0.65 μM, which laid down the foundation for the quantitative detection of the target.
The stability, reproducibility and biocompatibility of the microsensor CyOThiols/TiWE were then investigated. Under continuous irradiation with 808 nm and 750 nm lasers for 380 s, the photocurrent signal of CyOThiols/TiWE kept unchanged, which can be attributed to the good photostability of CyOThiols as well as the stable bonding of CyOThiols on the TiWE surface (Fig. S18†). In addition, the standard deviation for 12 microelectrodes tested in the same rat brain was <5.14%, indicating a good reproducibility of the as-prepared photoelectrode (Fig. S19†). Biocompatibility was assessed by propidium iodide and calcein-AM staining of cells incubated on a CyOThiols modified titanium sheet and the infrared thermal imaging of the photothermal effect caused by 750 nm and 808 nm laser irradiation. As illustrated by the fluorescence staining in Fig. S20,† the cells growing on the surface exhibited a very high viability. Meanwhile, the infrared thermal imaging showed that the local temperature of light spots on the rat skull only increased by less than 1 °C after 750 nm and 808 nm laser irradiation for 10 s (Fig. S21†). These results suggested a good biocompatibility of the microsensor and the feasibility of using the microsensor for in vivo analysis.
Capacity of offsetting the environmental disturbance of the ratiometric PEC microsensor
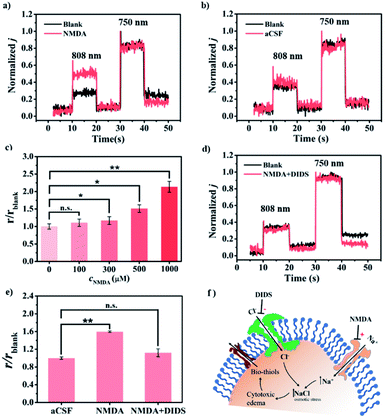
The reliability of sensing strongly relies on the ability of the sensor to offset environmental disturbance to the detection signal, especially in highly complex samples like live bodies. For PEC sensing depending on the reductive reactant as the electron donor, the variation or inhomogeneous distribution of the reactant concentration may cause the distortion of the signal. Besides, the non-specific adsorption of biomolecules on the electrode surface or unidentical intensity/power of excitation light are also major issues challenging the reliability and accuracy of sensing.18 Therefore, the anti-disturbance capacity of the ratiometric PEC sensor CyOThiols/TiWE was evaluated. Firstly, the impact of concentration of the reductive reactant (with AA as a representative) was examined. We tested three batches of samples containing 10, 70 and 500 μM Cys, respectively, all with varying amounts of AA (100–600 μM). As shown in Fig. S22a, c and e,† the absolute intensities of photocurrent were all greatly elevated with the increase of AA concentration. Since our subsequent in vivo analysis in the brain will employ intrinsic AA in the parenchyma, which is liable to fluctuate, the uncertainty of absolute photocurrent intensity at a single wavelength is inevitable. Thanks to the self-calibration of ratiometric measurement, the sensor offered a stable r (j808/j750) value with varying amounts of AA (Fig. S22b, d and f†). As shown in Table S3,† the recovery of Cys determined with the ratiometric mode was in the range of 90–110% in the presence of different concentrations of AA, indicating a good quantification capability of the sensor. Similarly, we also evaluated the influence of the non-specific adsorption of biomacromolecules using BSA as a representative molecule. As presented in Fig. S23a,† the change of BSA concentration had little effect on the ratiometric PEC signals, and the recoveries of Cys were between 91 and 108% for all groups. Fig. S23b† shows the photocurrent signals obtained at one photoelectrode excited for 16 cycles with 808 nm and 750 nm light in the cortex of a normal rat brain. As expected, although the absolute photocurrent intensity decreased by ca. 28% due to the non-specific adsorption of biomacromolecules on CyOThiols/TiWE, there was little variation in the ratiometric signal with a standard deviation of 4.32%. The unidentical intensity/power of excitation light can be caused by factors like the unfixed distance between the light source and the electrode, which is much likely to occur in practical operation. In our system, we used a coaxial optical fiber containing 750 nm and 808 nm beams to make sure the two light sources are located at a same distance (Fig. S24†). Then we tested the influence of the electrode-to-optical fiber distance on the PEC signal. As shown in Fig. S25a,† the distance clearly affected the PEC signals of both light channels, but there was negligible influence on the ratiometric signal at different distances (Fig. S25b†). All the above results and interpretations have revealed the distinct advantage of ratiometric PEC signals over single-wavelength photocurrent output in terms of reliability.In vivo monitoring of thiols in rat brains
Astrocytes providing structural, metabolic, and trophic support for neurons are dynamic cells with unique properties that enable them to respond to small changes in their environment.19 Pathological changes in astrocytes may cause neurological disturbances such as ischemia, seizures, stroke, and spreading depolarization.20 Astrocyte swelling is the leading cause of cerebral edema, and many studies have investigated the changes of ions and neurochemicals during astrocyte edema.20b Increasing evidence has indicated that astrocytes responded to edema status via releasing some other substances into the interstitial fluid.19c,21 However, due to the limitation of the detection technique, the molecular mechanism of astrocyte swelling is still unclear. Hence, we are interested in exploring whether there are thiols released during cerebral edema caused by astrocyte swelling. We firstly investigated the changes of the thiol level in the event of cytotoxic edema in living rat brains. As shown in Fig. 5a, compared with the normal rat brain, an increased ratiometric PEC signal was recorded by CyOThiols/TiWE in the model of astrocyte swelling induced by the glutamate receptor agonist (N-methyl-D-aspartic acid, NMDA).20b To preclude the influence of the injection process, we conducted parallel experiments with artificial cerebrospinal fluid (aCSF) as the control. As shown in Fig. 5b, no obvious increase of the ratiometric PEC signal was recorded with the infusion of aCSF. Besides, our above selectivity assessment (Fig. S16†) has already excluded the influence of NMDA itself on the sensor. It thus can be concluded that the monitored response was caused by thiol release. To further explore the functions of cytotoxic edema in thiol efflux, different concentrations of NMDA (100, 300, 500, and 1000 μM, respectively) were injected into rat brains. As shown in Fig. S26† and 5c, in response to 300, 500, and 1000 μM NMDA, the ratiometric PEC signals (r) were increased to 1.17, 1.51 and 2.13 times higher than that of the control group, respectively. The results demonstrated a clear NMDA concentration-dependent thiol efflux.Encouraged by the above findings, we set out to explore the possible mechanism involved in the thiol release in response to cytotoxic edema. A few earlier studies reported that cytotoxic edema can be efficiently inhibited by 4,4′-diisothiocyanatostilbene-2,2′-disulfonic acid (DIDS), through the inhibition of Cl− flowing into the cell.20b Therefore, DIDS treatment could provide some important mechanistic information associated with the thiol release. As shown in Fig. 5d and e, no perceptible increase of the ratiometric PEC signal was found with the co-injection of 500 μM NMDA and 5 mM DIDS into the rat brain (n = 3), implying a completely diminished release of thiols accompanied by the inhibition of cytotoxic edema. For further validating thiol release induced by NMDA, we exploited NIR-II fluorescence imaging employing CyOThiols as a thiol-specific fluorescent probe (Fig. S27†). As shown in Fig. S28,† clear NMDA-driven fluorescence enhancement was observed, while the fluorescence enhancement can be efficiently inhibited by DIDS. These results of in vivo imaging further proved the mercaptan release during cytotoxic edema. Interestingly, previous studies had elaborately demonstrated that NMDA activation could induce organic anion (e.g. ascorbate) release by inducing uncharted organic anion channel opening.21 In this regard, our finding of cytotoxic edema-dependent thiol efflux may have offered an additional possible mechanism to understand this complicated physiological and pathophysiological molecular event (Fig. 5f).
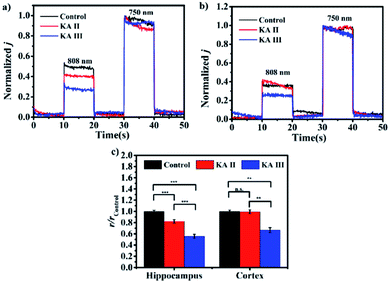
Defining the sensibility of analytes in different brain regions will help to better understand the potential mechanism underlying physiological or pathological events. Here, the as-constructed microsensor was employed to detect the changes of thiols in different brain regions of kainic acid (KA)-induced epilepsy in rat brains.22Fig. 6a and b show the representative normalized photocurrent intensities in the hippocampi and cortexes of three groups (control group, KA II group and KA III group). In comparison to the control group, the r value obtained in the hippocampus was reduced to 82.2% and 55.7% as symptoms of epileptogenesis increased to the Racine II stage and Racine III stage, respectively, suggesting the depletion of thiols with the progress of epileptogenesis. For the cortex, the r value was reduced to 99.4% and 66.6% in the two stages. It is worth noting that the decreasing degree of the observed r value in the hippocampus was significantly greater than that in the cortex, which may suggest higher sensitivity to epilepsy in the hippocampus region. Previous studies revealed a close crosstalk between the oxidative stress and epilepsy and showed that an increase in the levels of oxidizing substances (reactive oxygen, reactive nitrogen and active chlorine) is associated with epilepsy. Hence, the observed reduction in thiol concentration may result from thiol consumption caused by oxidative stress.23
Conclusions
In summary, we have proposed a strategy for constructing a near-infrared light driven ratiometric PEC microsensor based on a small-molecule organic semiconductor. Taking advantage of small molecules, i.e., the high flexibility of the molecular structure and easily adjustable energy gap, the optical absorption of CyOH can be modulated by substituting different groups at the –OH position via an ICT process. By embedding a specific recognition site on–OH, a proof-of-concept probe, CyOThiols, was prepared and covalently bonded to the surface of TiWE to fabricate a microsensor for thiols. The highly specific reaction with thiols caused a red shift of CyOThiols absorption from 734 nm to 795 nm. Under excitation of two monochromatic lasers (808 nm and 750 nm), the microsensor yielded ratiometric photocurrent responses towards thiols, which exhibited good anti-interfering capacity owing to the self-calibration ability of the ratiometric signals. The CyOThiols/TiWE microsensor was applied to monitor thiol fluctuation in rat brains with a model of cerebral edema, which revealed that the NMDA-induced astrocyte swelling resulted in enhanced thiol release. Furthermore, it was utilized to monitor thiols in two regions of rat brains with KA-induced epilepsy. The variation of thiol concentration in the hippocampus differed from that in the cortex, suggesting higher sensitivity to epilepsy in the hippocampus region. The SMOS-based ratiometric PEC sensor resolved the problem of specificity and reliability of PEC sensing in vivo, and moreover, this strategy can be readily extended to diverse analytes by simply changing the recognition site of the probe.Ethical statement
All animal studies were performed according to the Guidelines for the Care and Use of Laboratory Animals of the Chinese Animal Welfare Committee and approved by the Institutional Animal Care and Use Committee, Wuhan University Center for Animal Experiment, Wuhan, China.Data availability
Additional data is available in the ESI.†Author contributions
Y. Xiang and Y. Kong: most of the experiments and writing of the manuscript. W. Feng: DFT calculations and writing of the Theoretical calculations section. X. Ye: supervision of experiments, discussion, and writing of the manuscript. Z. Liu: conceptualization, funding acquisition, and supervision; writing, review, and editing of the manuscript.Conflicts of interest
There are no conflicts to declare.Acknowledgements
This work was supported by the National Natural Science Foundation of China (No. 21906047 and 21625503) and Natural Science Fund for Creative Research Groups of Hubei Province of China (2020CFA035).References
- (a) D. L. Robinson, A. Hermans, A. T. Seipel and R. M. Wightman, Chem. Rev., 2008, 108, 2554–2584 CrossRef CAS PubMed; (b) H. Hou, Y. Jin, H. Wei, W. Ji, Y. Xue, J. Hu, M. Zhang, Y. Jiang and L. Mao, Angew. Chem., Int. Ed., 2020, 59, 18996–19000 CrossRef CAS PubMed; (c) M. Spanos, X. Xie, J. Gras-Najjar, S. C. White and L. A. Sombers, ACS Chem. Neurosci., 2019, 10, 1497–1505 CrossRef CAS PubMed; (d) X. Li, L. Ren, J. Dunevall, D. Ye, H. S. White, M. A. Edwards and A. G. Ewing, ACS Nano, 2018, 12, 3010–3019 CrossRef CAS PubMed; (e) C. J. Meunier and L. A. Sombers, in The Brain Reward System, ed. M. Fakhoury, Springer US, New York, NY, 2021, pp. 93–123 Search PubMed.
- (a) C. N. Hobbs, G. Holzberg, A. S. Min and R. M. Wightman, ACS Chem. Neurosci., 2017, 8, 2512–2521 CrossRef CAS PubMed; (b) N. T. Rodeberg, S. G. Sandberg, J. A. Johnson, P. E. Phillips and R. M. Wightman, ACS Chem. Neurosci., 2017, 8, 221–234 CrossRef CAS PubMed; (c) L. R. Walton, N. G. Boustead, S. Carroll and R. M. Wightman, ACS Chem. Neurosci., 2017, 8, 1598–1608 CrossRef CAS PubMed; (d) C. Zhang, Z. Liu, L. Zhang, A. Zhu, F. Liao, J. Wan, J. Zhou and Y. Tian, Angew. Chem., Int. Ed., 2020, 59, 20499–20507 CrossRef CAS PubMed; (e) F. Zhao, Y. Liu, H. Dong, S. Feng, G. Shi, L. Lin and Y. Tian, Angew. Chem., Int. Ed., 2020, 59, 10426–10430 CrossRef CAS PubMed; (f) A. A. Gomez, T. A. Shnitko, H. M. Barefoot, E. L. Brightbill, L. A. Sombers, S. M. Nicola and D. L. Robinson, ACS Chem. Neurosci., 2019, 10, 1935–1940 CrossRef PubMed.
- (a) J. Shu and D. Tang, Anal. Chem., 2020, 92, 363–377 CrossRef CAS PubMed; (b) Y. Long, C. Kong, D. Li, Y. Li, S. Chowdhury and H. Tian, Small, 2011, 7, 1624–1628 CrossRef CAS PubMed; (c) L. Guo, Z. Li, K. Marcus, S. Navarro, K. Liang, L. Zhou, P. D. Mani, S. J. Florczyk, K. R. Coffey, N. Orlovskaya, Y. H. Sohn and Y. Yang, ACS Sens., 2017, 2, 621–625 CrossRef CAS PubMed; (d) A. Ikeda, M. Nakasu, S. Ogasawara, H. Nakanishi, M. Nakamura and J. Kikuchi, Org. Lett., 2009, 11, 1163–1166 CrossRef CAS PubMed.
- W. W. Zhao, J. J. Xu and H. Y. Chen, Chem. Rev., 2014, 114, 7421–7441 CrossRef CAS PubMed.
- B. Fu and Z. Zhang, Nano Lett., 2019, 19, 9069–9074 CrossRef CAS PubMed.
- Z. Liu, X. Ye, X. Wang, Y. Kong, M. Dai and D. Han, Angew. Chem., Int. Ed., 2021, 60, 11774–11778 CrossRef PubMed.
- H. Jin, Z. Sun, Y. Sun and R. Gui, TrAC, Trends Anal. Chem., 2021, 134, 116–124 CrossRef.
- L. Wu, C. Huang, B. P. Emery, A. C. Sedgwick, S. D. Bull, X.-P. He, H. Tian, J. Yoon, J. L. Sessler and T. D. James, Chem. Soc. Rev., 2020, 49, 5110–5139 RSC.
- (a) Q. Hao, X. Shan, J. Lei, Y. Zang, Q. Yang and H. Ju, Chem. Sci., 2016, 7, 774–780 RSC; (b) Z. Qiu, J. Shu, J. Liu and D. Tang, Anal. Chem., 2019, 91, 1260–1268 CrossRef CAS PubMed.
- H. Wu, H. L. Tan, C. Y. Toe, J. Scott, L. Wang, R. Amal and Y. H. Ng, Adv. Mater., 2020, 32, e1904717 CrossRef PubMed.
- J. M. Cole, G. Pepe, O. K. Al Bahri and C. B. Cooper, Chem. Rev., 2019, 119, 7279–7327 CrossRef CAS PubMed.
- (a) L. Yuan, W. Lin, S. Zhao, W. Gao, B. Chen, L. He and S. Zhu, J. Am. Chem. Soc., 2012, 134, 13510–13523 CrossRef CAS PubMed; (b) J. Li and K. Pu, Chem. Soc. Rev., 2019, 48, 38–71 RSC.
- The pKa was calculated according to the Henderson–Hasselbalch-type mass action equation (log[(Fmax − F)/(F − Fmin)] = pKa − pH) at 780 nm.
- T. Lu and F. Chen, J. Comput. Chem., 2012, 33, 580–592 CrossRef CAS PubMed.
- A. Gómez-A, T. A. Shnitko, H. M. Barefoot, E. L. Brightbill, L. A. Sombers, S. M. Nicola and D. L. Robinson, ACS Chem. Neurosci., 2019, 10, 1935–1940 CrossRef PubMed.
- J. A. Cooper, M. Wu and R. G. Compton, Anal. Chem., 1998, 70, 2922–2927 CrossRef CAS.
- (a) J. D. Majmudar, A. M. Konopko, K. J. Labby, C. T. M. B. Tom, J. E. Crellin, A. Prakash and B. R. Martin, J. Am. Chem. Soc., 2016, 138, 1852–1859 CrossRef CAS PubMed; (b) S. Seshadri, A. Beiser, J. Selhub, P. F. Jacques, I. H. Rosenberg, R. B. D'Agostino, P. W. F. Wilson and P. A. Wolf, N. Engl. J. Med., 2002, 346, 476–483 CrossRef CAS PubMed; (c) Y. Shi and K. S. Carroll, Acc. Chem. Res., 2020, 53, 20–31 CrossRef CAS PubMed; (d) K. Umezawa, M. Yoshida, M. Kamiya, T. Yamasoba and Y. Urano, Nat. Chem., 2016, 9, 279–286 CrossRef.
- (a) J. Sabate Del Rio, O. Y. F. Henry, P. Jolly and D. E. Ingber, Nat. Nanotechnol., 2019, 14, 1143–1149 CrossRef CAS PubMed; (b) Y. Zhang, N. Hao, Z. Zhou, R. Hua, J. Qian, Q. Liu, H. Li and K. Wang, Chem. Commun., 2017, 53, 5810–5813 RSC.
- (a) A. V. Molofsky, R. Krencik, E. M. Ullian, H. H. Tsai, B. Deneen, W. D. Richardson, B. A. Barres and D. H. Rowitch, Genes Dev., 2012, 26, 891–907 CrossRef CAS PubMed; (b) L. E. Clarke and B. A. Barres, Nat. Rev. Neurosci., 2013, 14, 311–321 CrossRef CAS PubMed; (c) I. D. Vainchtein, G. Chin, F. S. Cho, K. W. Kelley, J. G. Miller, E. C. Chien, S. A. Liddelow, P. T. Nguyen, H. Nakao-Inoue, L. C. Dorman, O. Akil, S. Joshita, B. A. Barres, J. T. Paz, A. B. Molofsky and A. V. Molofsky, Science, 2018, 359, 1269–1273 CrossRef CAS PubMed; (d) S. Sheikhbahaei, E. A. Turovsky, P. S. Hosford, A. Hadjihambi, S. M. Theparambil, B. Liu, N. Marina, A. G. Teschemacher, S. Kasparov, J. C. Smith and A. V. Gourine, Nat. Commun., 2018, 9, 370 CrossRef PubMed; (e) H. Mestre, T. Du, A. M. Sweeney, G. Liu, A. J. Samson, W. Peng, K. N. Mortensen, F. F. Staeger, P. A. R. Bork, L. Bashford, E. R. Toro, J. Tithof, D. H. Kelley, J. H. Thomas, P. G. Hjorth, E. A. Martens, R. I. Mehta, O. Solis, P. Blinder, D. Kleinfeld, H. Hirase, Y. Mori and M. Nedergaard, Science, 2020, 367, 1211–1226 CrossRef; (f) J. A. Stogsdill, J. Ramirez, D. Liu, Y. H. Kim, K. T. Baldwin, E. Enustun, T. Ejikeme, R.-R. Ji and C. Eroglu, Nature, 2017, 551, 192–197 CrossRef CAS PubMed.
- (a) J. Glykys, V. Dzhala, K. Egawa, K. T. Kahle, E. Delpire and K. Staley, Trends Neurosci., 2017, 40, 276–294 CrossRef CAS PubMed; (b) R. L. Rungta, H. B. Choi, J. R. Tyson, A. Malik, L. Dissing-Olesen, P. J. C. Lin, S. M. Cain, P. R. Cullis, T. P. Snutch and B. A. MacVicar, Cell, 2015, 161, 610–621 CrossRef CAS PubMed; (c) P. Rivetti di Val Cervo, R. A. Romanov, G. Spigolon, D. Masini, E. Martín-Montañez, E. M. Toledo, G. La Manno, M. Feyder, C. Pifl, Y.-H. Ng, S. P. Sánchez, S. Linnarsson, M. Wernig, T. Harkany, G. Fisone and E. Arenas, Nat. Biotechnol., 2017, 35, 444–452 CrossRef PubMed.
- J. Jin, W. Ji, L. Li, G. Zhao, W. Wu, H. Wei, F. Ma, Y. Jiang and L. Mao, J. Am. Chem. Soc., 2020, 142, 19012–19016 CrossRef CAS PubMed.
- R. J. Racine, Electroencephalogr. Clin. Neurophysiol., 1975, 38, 1–12 CrossRef CAS PubMed.
- K. R. N. Gibson, I. L. Neilson, F. Barrett, T. J. Winterburn, S. Sushma, S. M. MacRury and L. L. Megson, J. Cardiovasc. Pharmacol., 2009, 54, 319–326 CrossRef CAS PubMed.
Footnote |
| † Electronic supplementary information (ESI) available: Text, figures and tables depicting synthetic procedures, detailed experimental procedures, and characterisation data. See DOI: 10.1039/d1sc03069h |
| This journal is © The Royal Society of Chemistry 2021 |

