
 Open Access Article
 This Open Access Article is licensed under a Creative Commons Attribution-Non Commercial 3.0 Unported Licence
A quasi-stable molybdenum sub-oxide with abundant oxygen vacancies that promotes CO2 hydrogenation to methanol†
Yasutaka
Kuwahara
 *abcd,
Takashi
Mihogi
a,
Koji
Hamahara
a,
Kazuki
Kusu
a,
Hisayoshi
Kobayashi
ae and
Hiromi
Yamashita
*abc
*abcd,
Takashi
Mihogi
a,
Koji
Hamahara
a,
Kazuki
Kusu
a,
Hisayoshi
Kobayashi
ae and
Hiromi
Yamashita
*abc
aDivision of Materials and Manufacturing Science, Graduate School of Engineering, Osaka University, 2-1 Yamada-oka, Suita, Osaka 565-0871, Japan. E-mail: kuwahara@mat.eng.osaka-u.ac.jp; yamashita@mat.eng.osaka-u.ac.jp
bInnovative Catalysis Science Division, Institute for Open and Transdisciplinary Research Initiatives (OTRI), Osaka University, 2-1 Yamada-oka, Suita, Osaka 565-0871, Japan
cUnit of Elements Strategy Initiative for Catalysts & Batteries (ESICB), Kyoto University, Katsura, Kyoto 615-8520, Japan
dJST, PRESTO, 4-1-8 Honcho, Kawaguchi, Saitama 332-0012, Japan
eKyoto Institute of Technology, Matsugasaki, Sakyo-ku, Kyoto 606-8585, Japan
First published on 28th June 2021
Abstract
Production of methanol from anthropogenic carbon dioxide (CO2) is a promising chemical process that can alleviate both the environmental burden and the dependence on fossil fuels. In catalytic CO2 hydrogenation to methanol, reduction of CO2 to intermediate species is generally considered to be a crucial step. It is of great significance to design and develop advanced heterogeneous catalysts and to engineer the surface structures to promote CO2-to-methanol conversion. We herein report an oxygen-defective molybdenum sub-oxide coupled with Pt nanoparticles (Pt/HxMoO3−y) which affords high methanol yield with a methanol formation rate of 1.53 mmol g-cat−1 h−1 in liquid-phase CO2 hydrogenation under relatively mild reaction conditions (total 4.0 MPa, 200 °C), outperforming other oxide-supported Pt catalysts in terms of both the yield and selectivity for methanol. Experiments and comprehensive analyses including in situ X-ray absorption fine structure (XAFS), in situ diffuse reflectance infrared Fourier transform (DRIFT) spectroscopy and density functional theory (DFT) calculations reveal that both abundant surface oxygen vacancies (VO) and the redox ability of Mo species in quasi-stable HxMoO3−y confer the catalyst with enhanced adsorption and activation capability to subsequently transform CO2 to methanol. Moreover, the Pt NPs act as H2 dissociation sites to regenerate oxygen vacancies and as hydrogenation sites for the CO intermediate to finally afford methanol. Based on the experimental and computational studies, an oxygen-vacancy-mediated “reverse Mars–van Krevelen (M–vK)” mechanism is proposed. This study affords a new strategy for the design and development of an efficient heterogeneous catalyst for CO2 conversion.
Introduction
The continuous accumulation of anthropogenic CO2 in the atmosphere aggravates global warming. The control and reduction of CO2 emissions have been a worldwide challenge and pressing issue. Carbon capture and storage (CCS) has been deemed as a promising technology to drastically reduce CO2 emissions; however, appropriate carbon capture and utilization (CCU) technology must be developed to further reduce CO2 emissions in a sustainable manner. Catalytic conversion of anthropogenic CO2 into valuable chemicals is regarded as a sustainable and appealing approach to alleviate simultaneously the environmental crisis and energy demands.1–4CO2 is capable of being transformed to several important C1 chemicals such as CO, formic acid, methanol, and methane via hydrogenation.5–9 Among those, methanol (CH3OH) has attracted huge interest from industries and scientific community, because it can be used as a raw material for the production of formalin, acetic acid, olefins, and gasoline, and can be utilized as a fuel molecule for automobiles and fuel cells.10,11 Methanol is currently produced from syngas (CO and H2), generated by a steam reforming process using methane contained in liquefied natural gas (LNG) and petroleum gas (LPG), under extreme operational conditions (T = 240–260 °C, P = 5–10 MPa), in which Cu-based catalysts (e.g. Cu/ZnO/Al2O3) are used as a traditional catalyst.5,6,12,13 Production of methanol from anthropogenic CO2 existing in the atmosphere or being discharged from large stationary sources via hydrogenation using CO2-free H2 produced by renewable energy sources would be a green chemical process that could alleviate both the environmental burden and the dependence on fossil fuels.14,15
Direct methanol synthesis from CO2/H2via gas phase hydrogenation has been implemented industrially using supported Cu catalysts; however, a low equilibrium conversion of CO2 at the operational conditions is seen as a bottleneck limiting large-scale operations. Methanol synthesis from CO2/H2 (CO2 + 3H2 = CH3OH + H2O; ΔH0298 = −49.5 kJ mol−1) is an exothermic reaction, therefore, use of lower temperature and higher pressure conditions are thermodynamically more favorable.5,16 Recently, direct methanol synthesis in the liquid phase at lower temperatures has been studied, primarily because of easy control of the reaction temperature and easy extraction of products from the reaction system, which shifts the reaction equilibrium to the methanol production side.17,18 Although Ru-based homogeneous catalysts are known to function as active catalysts under relatively mild conditions, addition of additive reagents to achieve high reaction rates and problems associated with product separation and catalyst recovery are critical drawbacks.19–22 Alternatively, noble metal nanoparticle (NP) catalysts, such as Pt,23–27 Rh,28,29 and Re30etc. have been studied as heterogeneous catalysts for this reaction. In particular, Pt NPs are indispensable for the promotion of CO2 hydrogenation due to the efficient donation of their d-orbital electrons into the π* antibonding system of CO2. It has been reported that the activity of Pt NP catalysts is enhanced by manipulating the particle shape and the compositions (e.g. alloying with Co)23,24 or by the coupling with proper support material (e.g. MoS2),25 leading to a high methanol yield even at a low temperature of 150 °C.
In catalytic CO2 hydrogenation, activation and cleavage of the stable C![[double bond, length as m-dash]](https://www.rsc.org/images/entities/char_e001.gif) O bond of CO2 to form intermediate species is generally considered to be the crucial step. Previous literatures have reported the importance of an oxygen vacancy (VO) of metal oxides in the activation of CO2.31,32 For example, Bobadilla et al. spectroscopically understood that the oxygen vacancies of TiO2 support of Au/TiO2 catalyst participate in reverse water-gas shift (RWGS) reaction by activating CO2.33 Bhethanabotla and Kuhn et al. demonstrated that oxygen vacancy in La0.75Sr0.25FeO3 perovskite-type oxide efficiently promotes CO2 conversion in RWGS reaction.34 Ge et al. demonstrated that the oxygen vacancy on the In2O3 surface assists CO2 activation and hydrogenation and also stabilizes the key intermediates in CO2 hydrogenation to methanol by using DFT calculation.35 Previous studies demonstrated that oxygen vacancies formed in nonstoichiometric WO3−x and MoO3−x enable the light-assisted extraction of O atoms from CO2 to form methane and CO, respectively.36,37 Thus, the assistance of oxygen vacancies in metal oxide is deemed as an appealing approach to activate molecular CO2 and weaken the CO double bond. However, because VO sites are replenished by the dissociated O atoms during the reaction, the catalytic cycle cannot be realized. Coupling of VO sites and metal particles that simultaneously activate H2 to regenerate VO sites is the key to sustaining a continuous catalytic cycle, which has been demonstrated extensively over oxide-supported metal catalysts.33,38–40 In this regard, our group reported that oxygen-defective molybdenum sub-oxide coupled with Pt NPs (Pt/HxMoO3−y) can function as a reusable catalyst for hydrodeoxygenation of sulfoxide to produce sulfide under mild reaction conditions, in which abundant oxygen vacancies in HxMoO3−y act as the deoxygenation site and Pt NPs act as H2 dissociation sites to continuously supply active H atoms for regenerating the oxygen vacancies.41 It is hypothesized that such a bifunctional catalytic system would be a viable catalyst for realizing simultaneous activation of CO2 and H2 and efficient hydrogenation of CO2 to produce methanol.
O bond of CO2 to form intermediate species is generally considered to be the crucial step. Previous literatures have reported the importance of an oxygen vacancy (VO) of metal oxides in the activation of CO2.31,32 For example, Bobadilla et al. spectroscopically understood that the oxygen vacancies of TiO2 support of Au/TiO2 catalyst participate in reverse water-gas shift (RWGS) reaction by activating CO2.33 Bhethanabotla and Kuhn et al. demonstrated that oxygen vacancy in La0.75Sr0.25FeO3 perovskite-type oxide efficiently promotes CO2 conversion in RWGS reaction.34 Ge et al. demonstrated that the oxygen vacancy on the In2O3 surface assists CO2 activation and hydrogenation and also stabilizes the key intermediates in CO2 hydrogenation to methanol by using DFT calculation.35 Previous studies demonstrated that oxygen vacancies formed in nonstoichiometric WO3−x and MoO3−x enable the light-assisted extraction of O atoms from CO2 to form methane and CO, respectively.36,37 Thus, the assistance of oxygen vacancies in metal oxide is deemed as an appealing approach to activate molecular CO2 and weaken the CO double bond. However, because VO sites are replenished by the dissociated O atoms during the reaction, the catalytic cycle cannot be realized. Coupling of VO sites and metal particles that simultaneously activate H2 to regenerate VO sites is the key to sustaining a continuous catalytic cycle, which has been demonstrated extensively over oxide-supported metal catalysts.33,38–40 In this regard, our group reported that oxygen-defective molybdenum sub-oxide coupled with Pt NPs (Pt/HxMoO3−y) can function as a reusable catalyst for hydrodeoxygenation of sulfoxide to produce sulfide under mild reaction conditions, in which abundant oxygen vacancies in HxMoO3−y act as the deoxygenation site and Pt NPs act as H2 dissociation sites to continuously supply active H atoms for regenerating the oxygen vacancies.41 It is hypothesized that such a bifunctional catalytic system would be a viable catalyst for realizing simultaneous activation of CO2 and H2 and efficient hydrogenation of CO2 to produce methanol.
In the present work, we report that an oxygen-defective molybdenum sub-oxide coupled with Pt NPs (Pt/HxMoO3−y) exhibits high methanol yield with a methanol formation rate of 1.53 mmol g-cat−1 h−1 in liquid-phase CO2 hydrogenation under relatively mild reaction conditions (total 4.0 MPa, 200 °C). In situ XAFS, in situ DRIFT spectroscopy and DFT calculations were employed to investigate the reaction mechanism. The experiments and comprehensive analyses revealed that abundant surface oxygen vacancies and the redox ability of Mo species in quasi-stable HxMoO3−y endowed this catalyst with enhanced adsorption and activation capability to subsequently transform CO2 to form the CO intermediate, and Pt NPs were found to act as H2 dissociation sites to regenerate oxygen vacancies and as hydrogenation sites of CO intermediate to finally afford methanol. This study provides new insights into the design and development of high-performance heterogeneous catalysts for CO2 hydrogenation reactions to produce methanol, which is a key chemical process for realizing CO2 reduction and sustainable methanol production.
Experimental
Synthesis of oxide-supported Pt catalysts
The Pt catalyst supported on α-MoO3 (Pt/MoO3) was prepared by a precipitation method using urea as a precipitant.41 α-MoO3 (1.0 g) was dispersed in 100 mL of distilled water containing 4.5 mL of K2PtCl4 solution (35 mM). To this suspension, 0.2 g of urea as a precipitation reagent was added, followed by vigorous stirring for 6 h at 95 °C to precipitate Pt2+ ions. The obtained slurry was centrifuged, washed with deionized water, and then dried at 100 °C in air overnight to give Pt/MoO3 (unreduced sample). The catalyst used in the hydrogenation process was prepared by reduction of Pt/MoO3 in a glass tube under a flow of H2 (20 mL min−1) for 30 min with a heating rate of 5 °C min−1 to give Pt/HxMoO3−y(T) (T represents the reduction temperature (°C)). The Pt loading was determined to be 1.3 wt% by inductively coupled plasma (ICP) analysis. The Pt/HxMoO3−y(T) catalysts with various Pt contents were prepared in the same manner using different amounts of K2PtCl4 solution.Other oxide-supported Pt catalysts were prepared in the same manner described above except for using different oxides as supports. Pd, Re, Ru and Cu catalysts supported on MoO3 were also prepared in the same manner described above except for using Na2PdCl4, NH4ReO4, RuCl3·nH2O, and Cu(NO3)2·3H2O as the precursors, respectively, instead of K2PtCl4.
Characterization
High-resolution transmission electron microscopy (HR-TEM) images were recorded on a JEOL ARM200F instrument operated at 200 kV accelerating voltage. The sample was dispersed in ethanol by sonication, and the dispersion was dropped onto a Cu grid covered with carbon film in an Ar atmosphere to avoid sample oxidation. Power X-ray diffraction (XRD) patterns were obtained with a Rigaku Ultima IV diffractometer with Cu Kα radiation (λ = 1.54056 Å) operated at 40 kV and 40 mA. X-ray photoelectron spectroscopy (XPS) measurements were performed on a Shimadzu ESCA-3400 photoelectron spectrometer using Mg Kα radiation (1253.6 eV) X-ray source at <10−5 Pa. Samples were introduced to the XPS analysis chamber without exposure to the air to avoid sample oxidation. All binding energies were calibrated with the adventitious carbon (C 1s) peak at 284.5 eV.Mo K-edge and Pt L3-edge XAFS spectra were recorded at the BL01B1 beamline at the SPring-8 facility, Japan Synchrotron Radiation Research Institute (JASRI), Harima, Japan. Si(311) and Si(111) double-crystal monochromators were used for the Mo K-edge and Pt L3-edge XAFS measurements, respectively. For pseudo in situ XAFS measurement, the samples, pretreated in a flow of H2, were sealed in a polyethylene bags without exposure to the air, and subjected to the XAFS measurement at room temperature. For in situ Mo K-edge XAFS measurement, a pelletized unreduced Pt/MoO3 sample (φ 7 mm) was placed in a tailor-made quartz cell (Makuhari Rikagaku Garasu Inc.) equipped with a water-cooling condenser and an electric heater, which was connected to a gas-exchange system. After purging the cell with He, the sample was first reduced at 300 °C under a flow of 20% H2/He (100 mL min−1), kept at 200 °C, and then exposed to 20% CO2/He (100 mL min−1) and 20% H2/He (100 mL min−1) in turn. During these processes, Mo K-edge XAFS spectra were recorded in transmission mode to track the changes of Mo species. The obtained XAFS spectra were normalized by fitting the background absorption coefficient. After a k3-weighting, the extended XAFS (EXAFS) spectra were Fourier-transformed from the k space to the r space across the k range 3.0 < k (Å−1) < 11.0 to obtain the radial distribution functions (RDFs).
Temperature programmed reduction with hydrogen (H2-TPR) was carried out using a BELCATII system (Microtrac-BEL Corp.) equipped with a thermal conductivity (TCD) detector. A sample (ca. 50 mg) mounted in a quartz vessel was pretreated in a flow of Ar (30 mL min−1) at 150 °C for 60 min to remove the physisorbed water, and then cooled to 50 °C. TPR profiles were collected by heating the samples from 50 to 500 °C with a heating rate of 10 °C min−1 under a flow of 5% H2/Ar (50 mL min−1). The effluent gas was passed through a trap containing a molecular sieve MS-4A to remove the produced water to determine the amount of H2 consumed.
Thermogravimetric measurement (TG) was conducted in a flow of either air or N2 to determine the amounts of hydrogen and oxygen vacancies introduced in molybdenum sub-oxide samples, respectively. The weight change curves were obtained on a Rigaku Thermo plus EVO II. Unreduced sample placed in an alumina pan was first reduced in a flow of H2 (100 mL min−1) at designated temperatures (100–400 °C) for 30 min, and then cooled to 50 °C. After switching the flow gas to either air or N2 (100 mL min−1), the temperature was increased from 50 to 450 °C at a heating rate of 10 °C min−1. Based on the weight changes observed under the two different conditions, the stoichiometric compositions of the samples were determined.
In situ DRIFT measurement
DRIFT spectra were measured using a Shimadzu IRSpirit spectrometer, equipped with a triglycine sulfate (TGS) detector at a resolution of 4 cm−1. For in situ DRIFT measurement, unreduced sample was placed in an alumina pan, introduced into a stainless-steel heat chamber (S.T. Japan Inc.) equipped with a water-cooling system and connected to gas cylinders, and prereduced at 300 °C in a flow of H2 (20 mL min−1) for 30 min. After prereduction, the cell was kept at 250 °C and a background spectrum was obtained. Subsequently, 1.0 MPa of CO2 and 1.0 MPa of H2 were successively introduced into the in situ cell, and the DRIFT spectra were recorded every 30 min. Each DRIFT spectrum was obtained by subtracting the background spectrum from each measured spectrum.General procedure for CO2 hydrogenation
In a typical procedure, the as-prepared catalyst (ca. 50 mg) was placed in a glass tube, followed by reduction at 300 °C for 30 min in a flow of H2 (20 min min−1). The glass tube containing the prereduced catalyst (ca. 50 mg) and 1,4-dioxane (15 mL) were placed in a stainless-steel autoclave reactor (volume = 41 mL), purged three times with pure CO2, and pressurized to 1.0 MPa with CO2 and then to 4.0 MPa with H2 (CO2![[thin space (1/6-em)]](https://www.rsc.org/images/entities/char_2009.gif) :H2 = 1:3). The reactor was heated to 200 °C and magnetically stirred (600 rpm) for 20 h. After the reaction, the reaction mixture was cooled to room temperature and depressurized, and the gas products were analyzed using a gas chromatograph (GC; Shimadzu GC-8A) with a 4 m active carbon column equipped with an FID detector and a methanizer (Shimadzu MTN-1). The liquid products were analyzed using GC-FID (column: Zebron ZB-FFAP, 50 m × 0.32 mm) using 1-butanol as an external standard. The TON values were determined by dividing the quantity of CO2 converted by the number of moles of the total quantity of Pt contained in the catalyst. To examine the catalyst reusability, the catalyst was retrieved from the reaction solution by centrifugation (10000 rpm, 5 min), washed with the solvent, and then subjected to next catalytic run.
:H2 = 1:3). The reactor was heated to 200 °C and magnetically stirred (600 rpm) for 20 h. After the reaction, the reaction mixture was cooled to room temperature and depressurized, and the gas products were analyzed using a gas chromatograph (GC; Shimadzu GC-8A) with a 4 m active carbon column equipped with an FID detector and a methanizer (Shimadzu MTN-1). The liquid products were analyzed using GC-FID (column: Zebron ZB-FFAP, 50 m × 0.32 mm) using 1-butanol as an external standard. The TON values were determined by dividing the quantity of CO2 converted by the number of moles of the total quantity of Pt contained in the catalyst. To examine the catalyst reusability, the catalyst was retrieved from the reaction solution by centrifugation (10000 rpm, 5 min), washed with the solvent, and then subjected to next catalytic run.
DFT calculations
All DFT calculations were performed using the CASTEP program in Materials Studio 17.2. The Perdew–Burke–Ernzerhof exchange-correlation function within the generalized gradient approximation (GGA-PBE) with the ultrasoft core potential was employed for geometry optimization, and the double numerical plus d-function (DND) was chosen as the basis set. The electron configurations of the atoms were H: 1s1, C: 2s22p2, O: 2s22p4, Mo: 4s24p64d55s1, Pt: 5d96s1, the plane wave cutoff energy was set to 300 to 340 eV. Considering the layered structure of H0.9MoO3 in Pt/HxMoO3−y, a super cell slab model composed of H32Mo32O96 including one Mo octahedra bilayer was constructed. The lattice parameters for the super cell are b = 15.1776 Å, c = 15.4438 Å, α = γ = 90°, β = 93.727°. The a-axis was taken as the direction of surface normal, and a was set to 30 Å including the vacuum region. For the slab model with a Pt NP, a Pt20 cluster was loaded on the H0.9MoO3 (100) surface to model Pt/HxMoO3−y catalyst.42,43 The bottom MoO6 layer was fixed at the corresponding bulk position, while the top MoO6 layer, the Pt20 cluster and the molecules in the gas phase were allowed to relax during geometry optimizations. The adsorption energy (Eads) was defined as Eads = Etotal − (Esub + Emolecule), where Etotal, Esub, and Emolecule are the total energies of the substrate optimized together with the adsorbate, the free substrate, and the free adsorbate molecule. The activation energy for transition state (TS) was defined as the difference energy between the TS and the local minimum just before the TS.Results and discussion
Liquid-phase CO2 hydrogenation over oxide-supported Pt catalysts
In a preliminary study, liquid-phase CO2 hydrogenation was carried out using Pt NPs catalysts immobilized on various oxide supports (Pt content: ca. 3 wt%) to search for a catalyst that provides a high methanol yield. The CO2 hydrogenation reaction was performed using a stainless autoclave reactor (volume = 41 mL) filled with 4.0 MPa of CO2/H2 gas (CO2:H2 = 1:3) at 200 °C for 20 h using catalyst (50 mg) pretreated with H2 at 300 °C for 30 min (Table 1 and Fig. 1a). The main products observed in this reaction were CO, methanol, and methane. High CO2 conversion rates were attained when easily reducible oxides such as MoO3, V2O5, Nb2O5 and WO3 were used as supports; Pt/HxMoO3−y catalyst provided the highest CO2 conversion (25.0%) with the highest methanol selectivity (SelMeOH = 33%) among the catalysts examined, which corresponded to a 1.53 mmol yield of methanol after 20 h of reaction (methanol production rate = 1.53 mmol g-cat−1 h−1) (entry 1), while Pt/V2O5, Pt/Nb2O5 and Pt/WO3 catalysts gave CO as the main product and methanol was hardly produced (SelMeOH = 5–7%) (entries 2–4). For the Pt/HxMoO3−y catalyst, the turnover number (TON) calculated for CO2 conversion, based on the number of Pt atoms contained in the catalyst, was 1379, and the TON for methanol production was 462, demonstrating that the CO2 hydrogenation reaction occurs in a catalytic manner. Interestingly, Pt supported on MoO2 exhibited a lower CO2 conversion (5.9%) and a lower methanol selectivity (SelMeOH = 4%) compared with Pt/HxMoO3−y under the same conditions (entry 5). Pt catalysts supported on amphoteric oxides, such as Al2O3, TiO2, ZrO2, and CeO2, exhibited low CO2 conversions (entries 6–9) and low methanol selectivities. As the monocomponent counterparts, pristine MoO3 (entry 18), defective HxMoO3−y (prepared by a solvothermal method)44 (entry 17) and Pt/SiO2 catalyst (entry 10) were also examined; however, the CO2 conversions (0.3%, 3.0% and 1.5%, respectively) over these catalysts in 20 h were far below that of the Pt/HxMoO3−y catalyst and the formation of methanol was not observed. It was thus clarified that the nature of the oxide support has a dramatic effect on the catalytic performance of the Pt catalyst in liquid-phase CO2 hydrogenation. In addition, Pd, Re, Ru, and Cu catalysts supported on MoO3 (entries 12–15), which were prepared by a similar method (see Experimental section), and Cu/ZnO catalyst (entry 16; nominal Cu content = 30.0 wt%) traditionally used for gas-phase CO2 hydrogenation reaction showed low catalytic activities and low methanol yields under the conditions adopted in this study. The significantly low catalytic activity observed for the benchmark Cu/ZnO catalyst may be attributed to the use of organic solvent which is unmatched for Cu-based catalyst and a relatively lower operation temperature than that usually employed for Cu-based catalysts. These results indicate that Pt is an indispensable component in the catalytic reaction, and the synergetic effect between Pt and Mo sub-oxide plays a critical role in achieving a high catalytic performance.
| Entry | Catalyst | Metal loadingb [wt%] | CO2 conv. [%] | Selectivity [%] | Total TONc | TON for MeOHc | ||
|---|---|---|---|---|---|---|---|---|
| MeOH | CO | CH4 | ||||||
| a Reaction conditions: catalyst (50 mg), 1,4-dioxane (15 mL), PCO2= 1.0 MPa,PH2 = 3.0 MPa, 200 °C, 20 h. Catalysts were reduced at 300 °C for 30 min in a flow of H2. b Determined by ICP analysis. c TON was calculated on the basis of total active metals contained in the catalysts. d Prepared by the wet impregnation method. e Synthesized by a solvothermal method according to ref. 44. f Nominal content. | ||||||||
| 1 | Pt/HxMoO3−y | 1.3 | 25.0 | 33 | 55 | 12 | 1379 | 462 |
| 2 | Pt/V2O5 | 2.6 | 13.3 | 6 | 83 | 11 | 360 | 22 |
| 3 | Pt/Nb2O5 | 2.2 | 10.3 | 5 | 81 | 14 | 340 | 16 |
| 4 | Pt/WO3 | 2.5 | 5.1 | 7 | 82 | 11 | 148 | 10 |
| 5 | Pt/MoO2 | 1.8 | 5.9 | 4 | 39 | 57 | 231 | 10 |
| 6 | Pt/γ-Al2O3 | 2.6 | 3.9 | 0 | 31 | 69 | 107 | 0 |
| 7 | Pt/TiO2 | 3.2 | 3.6 | 15 | 66 | 19 | 79 | 12 |
| 8 | Pt/ZrO2 | 2.7 | 2.5 | 12 | 39 | 49 | 62 | 8 |
| 9 | Pt/CeO2 | 2.7 | 3.0 | 4 | 86 | 10 | 81 | 3 |
| 10 | Pt/SiO2 | 2.6 | 1.5 | 0 | 39 | 61 | 42 | 0 |
| 11 | Pt/ZnO | 2.8 | 0.6 | 20 | 75 | 5 | 14 | 3 |
| 12 | Pd/MoO3 | 3.0f | 3.2 | 6 | 56 | 38 | 41 | 3 |
| 13 | Re/MoO3 | 3.0f | 2.3 | 5 | 23 | 72 | 51 | 3 |
| 14 | Ru/MoO3 | 3.0f | 0.9 | 37 | 50 | 13 | 12 | 4 |
| 15 | Cu/MoO3d | 3.0f | 1.5 | 0 | 5 | 95 | 11 | 0 |
| 16 | Cu/ZnOd | 30.0f | 0.4 | 19 | 12 | 69 | 9 | 0.3 |
| 17 | HxMoO3−ye | — | 3.0 | 0 | 8 | 92 | — | — |
| 18 | MoO3 | — | 0.3 | 0 | 21 | 79 | — | — |
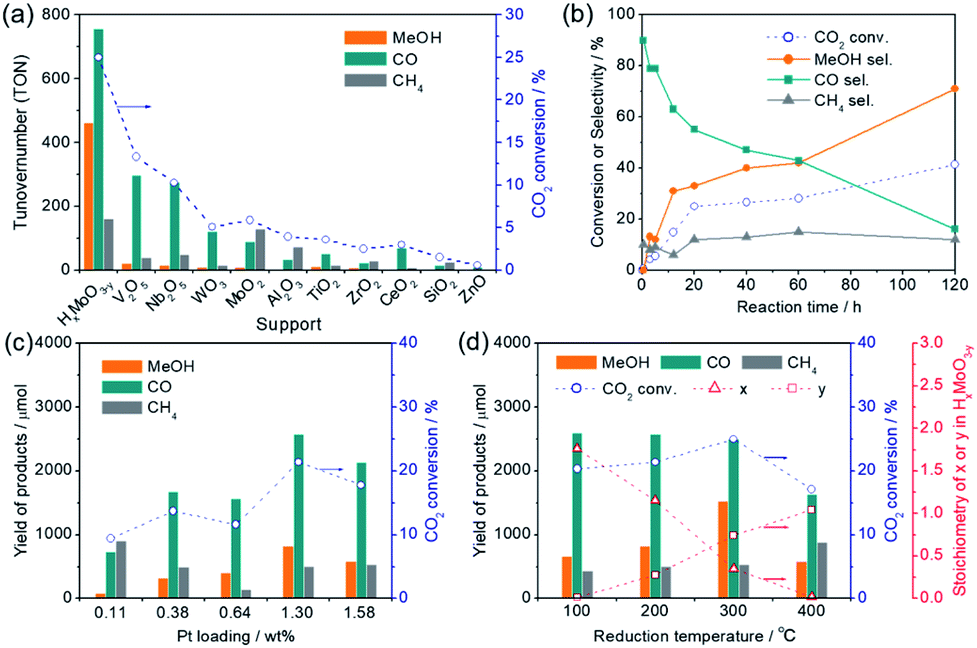 | ||
| Fig. 1 (a) Comparison of catalytic performance of various oxide-supported Pt catalysts in the liquid-phase CO2 hydrogenation reaction (catalysts were all reduced at 300 °C for 30 min in a flow of H2). (b) Time course of the product selectivity and CO2 conversion over Pt/HxMoO3−y(300) catalyst. (c) Effect of Pt loading on catalytic performance for Pt/HxMoO3−y catalyst (catalysts were all reduced at 200 °C for 30 min in a flow of H2). (d) Effect of reduction temperature on catalytic performance for Pt/HxMoO3−y(T) catalyst and the stoichiometry of intercalated H atoms (x) and oxygen vacancies (y) in molybdenum sub-oxide (HxMoO3−y). Reaction conditions: catalyst (50 mg), 1,4-dioxane (15 mL), PCO2 = 1.0 MPa, PH2 = 3.0 MPa, 200 °C, 20 h. | ||
Liquid-phase CO2 hydrogenation over molybdenum oxide-supported Pt catalyst
Fig. 1b shows the time variation of product yields during the reaction on the Pt/HxMoO3−y(300) at 200 °C. CO was rapidly produced as the main product in the initial stage of the reaction and yields of methanol and methane steadily increased over time along with a gradual decrease in the yield of CO. The conversion of CO2 and the selectivity for methanol obtained at 200 °C after 120 h of reaction reached 41.4% and 71%, respectively, which corresponded to a 5.38 mmol yield of methanol (methanol production rate = 0.896 mmol g-cat−1 h−1). The decreased conversion rate of CO2 in the latter stage of reaction may reflect the gradual reduction of CO2/H2 gas pressures inside the reactor. In methanol synthesis from CO2 and H2, (i) the CO formation route and (ii) the HCOO− (formate) formation route are known to be major reaction pathways.6,45,46 Considering the product distribution and the fact that formate was not detected by liquid chromatography in the reaction solution, methanol is likely to be produced via the formation of CO as an intermediate (i.e. RWGS reaction), while a small fraction of CO is transformed irreversibly to methane.Fig. 1c shows the effect of the loading amount of Pt on the catalytic activity. The highest yield and selectivity for methanol formation was achieved when the Pt loading was 1.3 wt%. Although the conversion of CO2 and the yield of methanol tended to increase with increasing Pt loading, they decreased when the Pt loading exceeded 1.5 wt%. Pt L3-edge XAFS analysis (Fig. S1 in ESI†) and Pt 4f XPS spectra (Fig. S2 in ESI†) verified that the Pt species on these catalysts exist as metallic Pt(0) NPs in all cases and the size of the Pt NPs increases with increasing Pt content. The catalytic activity was not directly proportional to the mean surface area of surface-exposed Pt atoms determined by CO pulse measurement (Fig. S3 in ESI†), suggesting that the CO2 hydrogenation is catalyzed not solely on the Pt NPs surface, but at the interface between the Pt NPs and the HxMoO3−y support, and that larger Pt NPs are unfavorable due to a decrease in the number of Pt–HxMoO3−y interfacial sites.
Over the Pt/HxMoO3−y(300) catalyst, almost no product was detected in the absence of CO2 (trace of CH4 may be from carbonaceous species contained in the catalyst) (Table 2, entry 2). In fact, in an isotopic experiment using 13CO2 as a reaction gas instead of 12CO2, a signal at m/z = 33 assigned to 13CH3OH was detected (Fig. S4 in ESI†), confirming that CO2 is the sole carbon source for CO, methanol and methane. More noteworthy is the fact that a substantial amount of CO was produced even in the absence of H2 (entry 3). Considering that such a huge CO evolution was not observed on most of the other supported Pt catalysts (Fig. S5 in ESI†), the oxygen vacancies created on HxMoO3−y possibly functioned as deoxygenation sites to reduce CO2 to CO. Furthermore, introduction of CO (0.1 MPa) instead of CO2 resulted in the formation of substantial amounts of methanol and methane at 200 °C (entry 4), again confirming that methanol as well as methane are produced via hydrogenation of CO as an intermediate over the Pt/HxMoO3−y(300) catalyst.
| Entry | Conditions | CO2 conv. [%] | Yield [μmol] | Total TONb | ||
|---|---|---|---|---|---|---|
| MeOH | CO | CH4 | ||||
| a Reaction conditions: catalyst (Pt/HxMoO3−y(300), 50 mg), 1,4-dioxane (15 mL), 200 °C, 20 h. b TON was calculated on the basis of total Pt atoms contained in the catalyst. | ||||||
| 1 | P CO2 = 1.0 MPa | 25.0 | 1526 | 2501 | 532 | 1379 |
| P H2 = 3.0 MPa | ||||||
| 2 | No CO2 | 0 | 0 | <1 | 66 | — |
| P H2 = 3.0 MPa | ||||||
| 3 | P H2 = 1.0 MPa | 10.9 | 0 | 1541 | 443 | 600 |
| No H2 | ||||||
| 4 | P CO2 = 0.1 MPa | (CO conv.) 57.8 | 371 | — | 684 | 310 |
| P H2 = 3.0 MPa | ||||||
Structural analysis of Pt-loaded molybdenum oxide
The HR-TEM image of the Pt/HxMoO3−y(300) catalyst revealed that the Pt NPs with an average particle size of 2.4 nm are uniformly immobilized on the Mo oxide particles (Fig. 2a).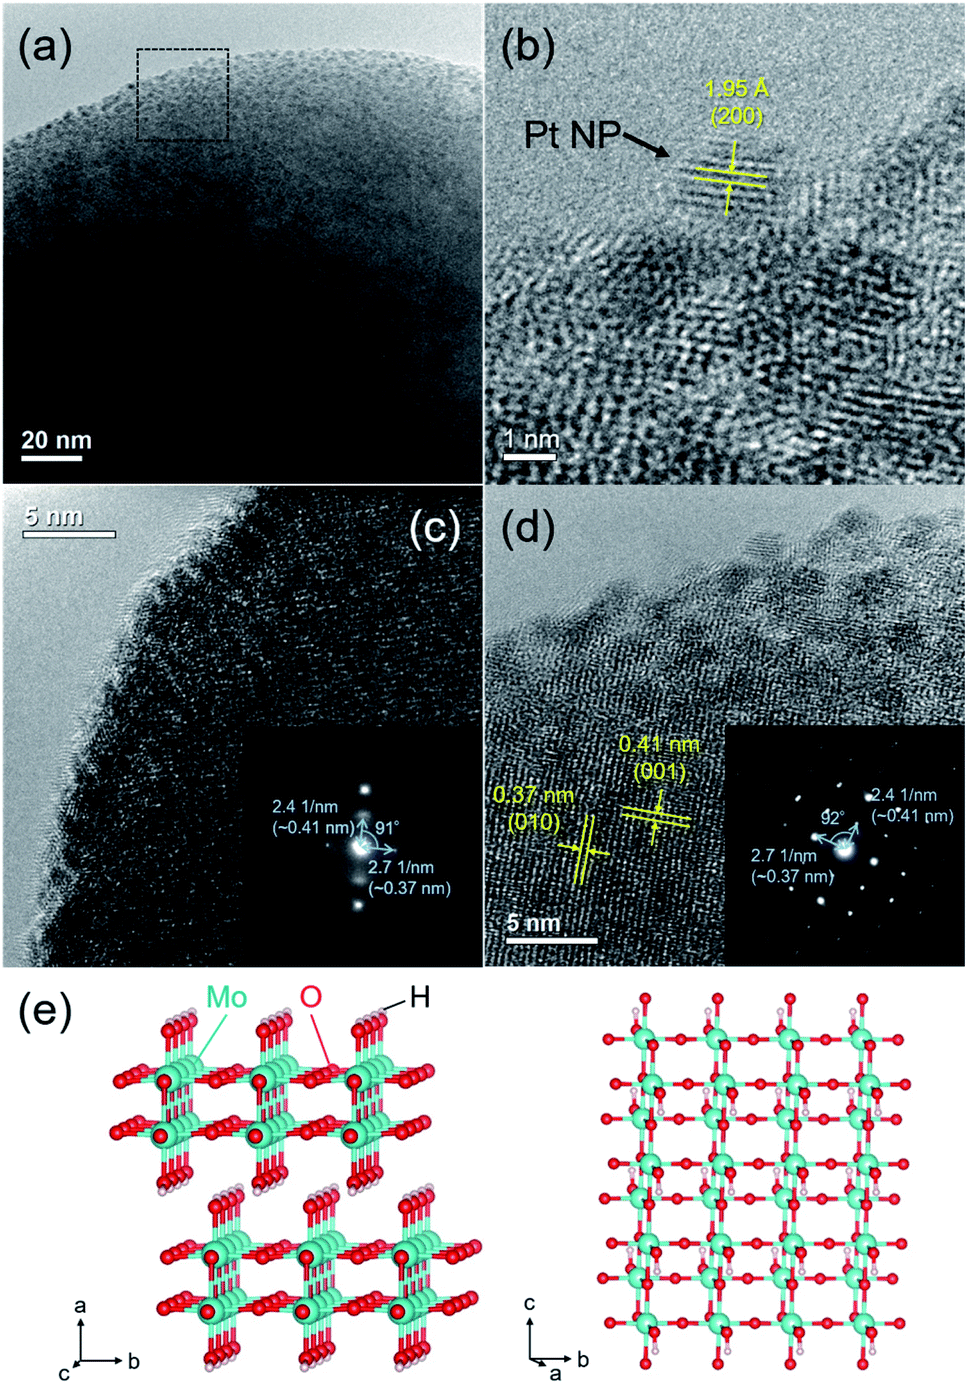 | ||
| Fig. 2 (a) HR-TEM image, (b–d) magnified HR-TEM images (inset shows the corresponding SAED patterns of the Pt/HxMoO3−y(300)) catalyst, and (e) illustrations of the monoclinic H0.9MoO3 crystal structure. | ||
In the enlarged HR-TEM image, the interplanar distance of the Pt NPs was ca. 1.95 Å, matching well the (200) plane of fcc Pt (Fig. 2b). The lattice fringes seen in the Mo oxide particle were not clear, being considerably disconnected or distorted in most cases (Fig. 2c). Only a few diffraction spots were observable in the selected electron diffraction (SAED) pattern (inset in Fig. 2c), indicating a short-range order atomic arrangement, which may be because of the introduction of many defect sites. Meanwhile, some clear lattice fringes were partly observed in some Mo oxide particles (Fig. 2d), which are consistent with the d-spacing of the (001) and (010) planes of the monoclinic H0.9MoO3 phase.47–49 The corresponding SAED pattern exhibited clear spots assignable to the (001) and (010) planes (inset in Fig. 2d). Two interplanar spacings were found to be 0.41 and 0.37 nm with a separation angle of 91–92°, which matched well with the monoclinic structure of the H0.9MoO3 phase with the P21/c space group as shown in Fig. 2e, confirming the existence of crystalline H0.9MoO3 phases in the short-range order.
Interestingly, the catalytic activity of the Pt/HxMoO3−y catalyst varied with the temperature of H2 reduction (Fig. 1d); both the CO2 conversion and the yield of methanol tended to increase with increasing reduction temperature. In particular, the highest CO2 conversion (25%) and methanol selectivity (33%) were attained when the catalyst was reduced at 300 °C. However, a marked drop of catalytic performance (conv. = 17.1%, SelMeOH = 19%) was observed for reduction at 400 °C. H2-TPR is commonly used to help understand the reduction behavior of metal oxides. Fig. 3a compares the H2-TPR profiles of the as-synthesized oxide-supported Pt catalysts. The as-prepared Pt/MoO3 sample gave an intense reduction peak at 136 °C, while such a large H2 consumption was not observed for the other oxide-supported Pt catalysts. The amount of H2 consumed below 200 °C was calculated to be 4.95 mmol-H2 per g-catalyst. The molar ratio of H atoms consumed per mole of Pt atoms contained in the catalyst (H/Pt) was 149 and that used per mole number of Mo atoms (H/Mo) was 1.44, whereas the as-prepared Pt/SiO2 showed a quite low consumption of H2 (H/Pt molar ratio of 2.2). This result indicates that the large H2 consumption on Pt/MoO3 at around 136 °C is not only due to the reduction of the Pt precursor but is attributed to the reduction of the MoO3 support. An additional H2 consumption at around 280 °C may be associated with the formation of oxygen vacancies, as will be discussed later. Importantly, pristine MoO3 exhibited no H2 consumption below 500 °C, indicating that Pt assists in the reduction of the MoO3 support by facilitating the dissociation of molecular H2 (namely, the H-spillover process). Such a high reactivity of intracrystalline oxygen atoms in MoO3 may well be responsible for the high CO2 hydrogenation performance.
To track the crystallographic changes occurring with H2 reduction at the different temperatures, XRD measurements were performed (Fig. 3b). The diffraction patterns of Pt/HxMoO3−y(100) were assigned to orthorhombic α-MoO3 (PDF #5-0508) and monoclinic H0.9MoO3 (PDF #53-1024), while the peaks of unreduced Pt/MoO3 were all indexed to orthorhombic α-MoO3. Pt/HxMoO3−y(200) showed dominant peaks assigned to H0.9MoO3 with decreased diffraction intensities, and Pt/HxMoO3−y(300) exhibited almost no distinct diffractions, indicating a collapse of the H0.9MoO3 phase and a disordered atomic arrangement (the H0.9MoO3 phase may partly exist, as observed by HR-TEM). The orthorhombic α-MoO3 used as a support in this study is composed of edge-sharing MoO6 octahedra bilayers stacked along with [010] due to van der Waals interaction.50,51 As demonstrated in many previous studies, H-spillover occurs on noble metal catalysts supported on reducible metal oxides in the presence of H2, in which molecular H2 is dissociated over the noble metal NPs surface (H2 → 2H+ + 2e−) and thus protons (H+) and free electrons are concurrently injected into the metal oxide matrices.52,53 In the case of the combination of the Pt NPs and α-MoO3, H2 dissociation occurs on the Pt NPs at around 140 °C (as shown in the H2-TPR, see Fig. 3a), and the dissociated H+ atoms are coordinated to the interlayer terminal oxygen atoms to form hydroxyl groups, which yields a class of HxMoO3 materials (0 < x < 2), namely, hydrogen molybdenum bronze,47–49 as depicted in the schematic of Scheme 1. During this H-spillover process, the free electrons are trapped by Mo6+ ions (Mo6+ + e−/2e− → Mo5+/Mo4+), and thus a great number of low-valence Mo species are generated. The relevant intercalation chemistry on α-MoO3 is already well established by earlier studies.41–43,54–57 A further temperature increase to 200–300 °C causes dehydration of HxMoO3 (as shown in the H2-TPR, see Fig. 3a), in which lattice oxygen atoms (mainly bi-bridging oxygen atoms) are easily expelled by the H+ ions (2H+ + 2e− + OO → VO + H2O),58,59 thus resulting in a further greater reduction of HxMoO3 to the quasi-stable HxMoO3−y sub-oxide which has abundant oxygen vacancies. Introduction of massive amounts of oxygen vacancies causes order-disorder transitions in the metal oxide (as illustrated in Scheme 1), which accounts for the significantly decreased diffraction intensities for Pt/HxMoO3−y(200) and Pt/HxMoO3−y(300). As previously reported, the intercalation of H atoms and the introduction of oxygen vacancies into the MoO3 matrix increases the electron density of the entire oxide particle, fills the 4d Mo level, and brings about new energy levels near the conduction band (CB), which consequently leads to the emergence of new absorption bands due to surface plasmon resonance (SPR).41,60–62 This was corroborated by UV-vis-NIR measurement (Fig. S6 in ESI†), in which a strong absorption across the visible to NIR region with an intense SPR peak was observed for the reduced samples, while a limited absorption in the UV region was observed for the unreduced Pt/MoO3 sample. Further increase in the reduction temperature to 400 °C led to the transition to the MoO2 phase, which has a distorted monoclinic rutile structure.
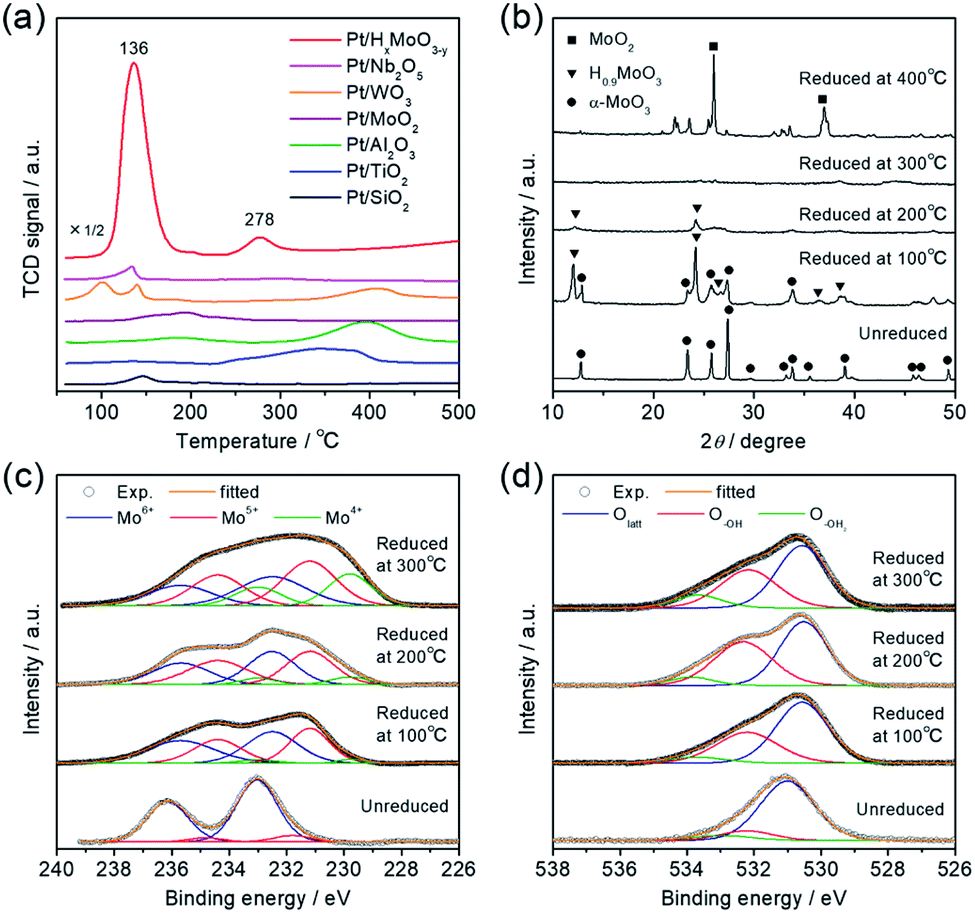 | ||
| Fig. 3 (a) H2-TPR profiles of Pt catalysts supported on various metal oxides. (b) XRD patterns, (c) Mo 3d XPS spectra, and (d) O 1s XPS spectra of unreduced Pt/MoO3 and Pt/HxMoO3−y catalysts reduced with H2 at different temperatures. | ||
 | ||
| Scheme 1 Schematic illustration of the crystallographic changes of Pt/HxMoO3−y upon H2 reduction. | ||
The intercalation of H atoms and the formation of oxygen vacancies within the Mo oxide matrices upon H2 reduction was corroborated by XPS measurement. From the Mo 3d XPS spectrum (Fig. 3c), it was confirmed that low-valence Mo species (Mo5+/Mo4+) were formed after H2 reduction, while Mo6+ species mainly existed before reduction. The concentrations of these low-valence Mo species increased with rise in the reduction temperature. The proportion of these low-valence Mo species was determined as: Mo5+ 42.7%, Mo4+ 3.8% (100 °C reduction) → Mo5+ 47.6%, Mo4+ 8.2% (200 °C reduction) → Mo5+ 42.0%, Mo4+ 23.7% (reduction at 300 °C), suggesting that generation of Mo4+ mainly results from the formation of an oxygen vacancy.63 A similar reduction behavior for Mo species and the introduction of oxygen vacancies were corroborated by inspection of the Mo K-edge X-ray absorption near edge structure (XANES) spectra and the Fourier transforms of extended XAFS (EXAFS) spectra, respectively (see Fig. S7 in ESI; † see also Fig. 5). In the O 1s XPS spectra (Fig. 3d), unreduced Pt/MoO3 exhibited two main peaks which are ascribed to lattice oxygen (Olatt; 530.5 eV) and surface hydroxyl groups (O–OH; 532.3 eV). Note that the samples were introduced to the XPS analysis chamber without exposure to the air, thereby excluding the possibility of adsorbed oxygen species. For the series of Pt/HxMoO3−y samples, the peak for the O–OH species increased in intensity, and additional tailings, assigned to the formation of OH2 groups weakly coordinated to Mo atoms (O–OH2), were observed at the higher binding energy region at about 533.6 eV. The proportion of these hydroxyl species ((O–OH + O−OH2)/Ototal) was found to increase significantly upon H2 reduction (unreduced Pt/MoO3 (20.3%) → Pt/HxMoO3−y (41–49%)), evidencing the H+-intercalation upon H2 reduction process.64
The above results verify the co-existence of the intercalated H atoms and oxygen vacancies in Pt/HxMoO3−y, which accompanies the formation of low-valence Mo species. To quantify the amounts of doped H atoms and oxygen vacancies, TG analysis was performed.65,66 Upon heat treatment of oxygen-defective HxMoO3−y in an inert gas flow, a dehydration reaction may occur through eqn (1):
| HxMoO3−y → MoO3−y−x/2 + 1/2x H2O | (1) |
However, upon heat treatment in an air gas flow, both the dehydration reaction and a filling of the oxygen vacancies to form molybdenum trioxide (MoO3) possibly occur through eqn (2):
| HxMoO3−y + O2 (air) → MoO3 + 1/2x H2O | (2) |
Therefore, the stoichiometry of the doped H atoms (x) and the oxygen vacancies (y) in HxMoO3−y can be calculated from the changes in thermal weight observed under the two different conditions (Fig. S8 in ESI†). Assuming the composition of the oxygen-defective molybdenum oxide of HxMoO3−y, the composition was determined as H1.76MoO2.99 (100 °C reduction) → H1.15MoO2.72 (200 °C reduction) → H0.35MoO2.26 (300 °C reduction) from the results of TG analysis, showing that the intercalated H atoms are continuously removed via thermal dehydration, while an increased number of oxygen vacancies is introduced after H2 reduction at elevated temperatures. As shown in Fig. 1d, the CO2 conversion and the yield of methanol increased along with an increase in the stoichiometry of the oxygen vacancy (y) in the Pt/HxMoO3−y(T) catalysts in the reduction temperature range of 100 to 300 °C. It should be mentioned that the stoichiometry of x and y in the Pt/HxMoO3−y(400) catalyst was almost equal to 0.0 and 1.0, respectively, indicating the formation of MoO2, which is consistent with XRD data (Fig. 3b). The decreased activity for Pt/HxMoO3−y(400) is probably attributed to the transition to monoclinic MoO2 with less oxygen vacancies. These results indicate the possibility that the oxygen vacancies formed in the quasi-stable HxMoO3−y sub-oxide during H2 reduction play a pivotal role in the CO2 hydrogenation and in the production of methanol.
Understanding the role of the oxygen vacancy
CO2 adsorption is generally regarded as being a prerequisite in the CO2 reduction process. Based on the above experiments, it may be hypothesized that the presence of abundant surface oxygen vacancies endows the Pt/HxMoO3−y with enhanced CO2 adsorption, leading to an efficient activation of CO2 on the surface. This was verified by the CO2 adsorption measurement (Fig. S9 in ESI†). The Pt/HxMoO3−y(300), which possessed the highest oxygen vacancy concentration, showed a much higher CO2 adsorption capacity than the unreduced Pt/MoO3.To understand the role of the oxygen vacancy at an atomic level, the CO2 adsorption energies over the surface of oxygen-defective and perfect molybdenum oxide were calculated using density function theory (DFT) calculations. Considering the layered structure of H0.9MoO3 in the Pt/HxMoO3−y catalyst, the (100) surface of H0.9MoO3 was chosen to construct the slab model. For oxygen-defective slab model, oxygen vacancy was created at the bi-bridging oxygen atom position.58,59 The adsorption energy of CO2 on the oxygen-defective H30Mo32O95 surface was calculated to be −8.3 kcal mol−1, which was significantly higher than that on the perfect H30Mo32O96 surface (−0.23 kcal mol−1), indicating that an oxygen defect site is favorable for adsorption of CO2.67,68 When CO2 is adsorbed at the oxygen vacancy site, the CO2 molecule becomes bent, and the O–C–O angle changes from 179.2° to 125.1°, and the C–O bond length is extended from 1.178 Å to 1.224/1.370 Å (Fig. 4a), while those adsorbed on the perfect surface were unchanged (Fig. 4b).68 These findings indicate that the C–O bonds are weakened on the oxygen-defective H30Mo32O95 surface. Furthermore, Mulliken population analysis demonstrated that the total charge (Δq) of CO2 is increased from +0.0e (on perfect H30Mo32O96) to −0.47e (on oxygen-defective H30Mo32O95).68 The CO2 molecule adsorbed on an oxygen vacancy gains more electrons from the low-valence Mo ions (i.e. Mo5+/Mo4+ species) with partially higher electron densities, which leads to polarization of CO2, which, therefore, promotes the activation and dissociation of the CO2 molecule.
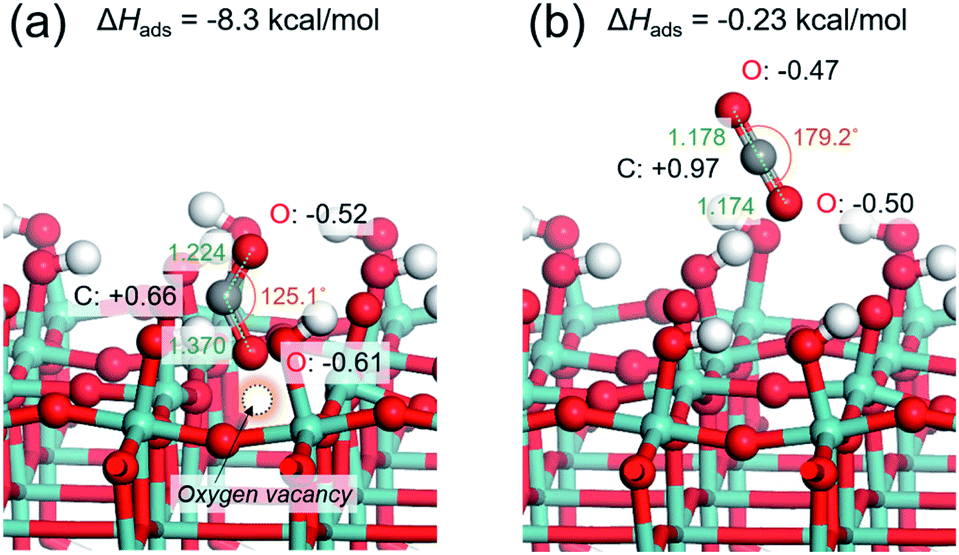 | ||
| Fig. 4 Optimized structure models for CO2 adsorbed on (a) oxygen-defective HxMoO3−y (H30Mo32O95) surface and (b) perfect HxMoO3 (H30Mo32O96) surface. | ||
To understand the catalytic role of the oxygen vacancy in CO2 hydrogenation, in situ XAFS measurement was performed. Fig. 5a shows the XANES spectra in the Mo K-edge region for the as-prepared Pt/MoO3 sample before and after H2 reduction at 200 °C, and for those measured after subsequent exposure to H2 and CO2 at 200 °C. The as-prepared Pt/MoO3 sample exhibited an absorption spectrum with a characteristic pre-edge absorption at 20006 eV, which was almost the same as that of orthorhombic α-MoO3. After H2 reduction at 200 °C, the pre-edge absorption was significantly diminished and the absorption edge position clearly shifted towards the lower energy region, which led to an absorption spectrum close to that of monoclinic MoO2. This is because of the phase transition from the orthorhombic α-MoO3 with a distorted octahedral geometry to the HxMoO3−y sub-oxide with a symmetric octahedral geometry and low-valence Mo atoms.69,70 Such a spectral change upon H2 reduction is consistent with the results of XRD and Mo 3d XPS. After the introduction of the 20% CO2/He flow gas at 200 °C, the absorption edge shifted slightly towards the higher energy region, showing substantial oxidation of Mo species with CO2. The subsequent switching to 20% H2/He flow caused an absorption edge shift back towards the lower energy region, indicating a re-reduction of Mo species with H2. The average valence state of Mo ions in the catalyst during the in situ XAFS measurement was determined from the absorption edge position (E0) using a linear interpolation method and was plotted as a function of time. As shown in Fig. 5b, the average valence state of Mo increased/decreased reversibly for the CO2/H2 flow at 200 °C, clearly demonstrating that a redox event involving the Mo species took place during reduction of CO2. The molybdenum oxide is initially reduced by H atoms dissociated on Pt NPs through a H-spillover process to produce oxygen vacancies. The CO2 molecule is adsorbed and activated at the oxygen vacancy interbedded between the under-coordinated Mo (Mo5+/Mo4+) sites, which leads to the formation of CO and a concurrent replenishment of the oxygen vacancy (CO2 + VO → CO + OO) accompanied by the oxidation of Mo atoms. This was also corroborated by Mo 3d XPS spectra, in which the proportion of Mo4+ species considerably decreased and the average oxidation number of Mo increased upon a treatment with 1.0 MPa CO2 at 200 °C (Fig. S10 in ESI†). In the presence of H2, the oxygen vacancy can be regenerated by the reaction with H atoms, thus the catalytic cycle can be achieved. This process can be understood as an oxygen-vacancy-mediated “reverse Mars–van Krevelen (M–vK)71” mechanism.31,33,41,72 Thus, DFT calculations and in situ XAFS measurement revealed that the oxygen vacancy sites in oxygen-defective HxMoO3−y not only stabilize CO2 by donating electrons, but also promote dissociation of CO2 through electron transfer from the abundant localized electrons on the ionic Mo (Mo5+/Mo4+) species to CO2, which should be effective for promoting the cleavage of CO2 and the subsequent hydrogenation reactions.
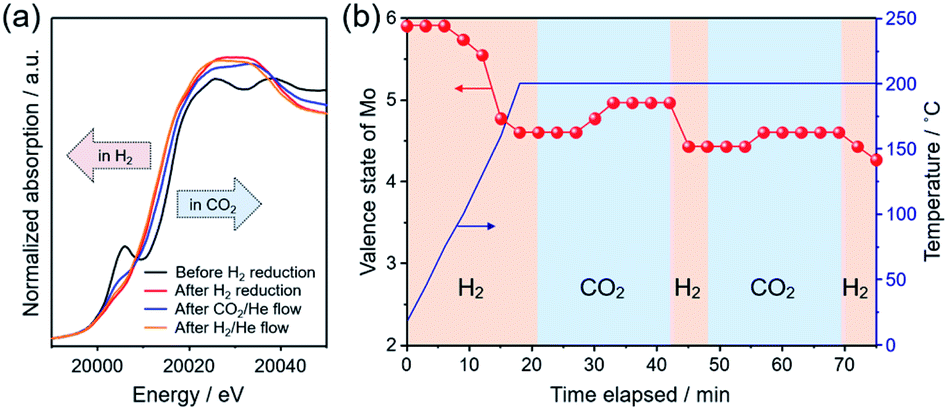 | ||
| Fig. 5 (a) In situ Mo K-edge XANES spectra of Pt/MoO3 measured at 200 °C; before H2 reduction (black line), after H2 reduction under a flow of 20% H2/He (red line), after subsequent flow of 20% CO2/He (blue line) and subsequent flow of 20% H2/He (orange line). (b) Change of valence state of the Mo species during the in situ XAFS measurement. The valence state was determined by a linear interpolation method. | ||
The CO2 hydrogenation mechanism
To monitor the CO2 hydrogenation process, in situ DRIFT experiments were performed (Fig. 6). Prior to DRIFT spectra measurement, the as-synthesized Pt/MoO3 sample was pre-treated under H2 flow for 30 min at 300 °C to yield Pt/HxMoO3−y(300), followed by cooling to 250 °C, and then 1.0 MPa of CO2 and 2.0 MPa of H2 were successively introduced. | ||
| Fig. 6 In situ differential DRIFT spectra of adsorbed species on (a) Pt/HxMoO3−y(300) catalyst and (b) pristine MoO3. | ||
After the introduction of CO2, two distinct peaks were observed at 1404 and at around 1530 cm−1, the former being commonly assigned to symmetric stretching vibration mode of monodentate carbonate species (νs(OCO−)) (major species) and the latter being characteristic of the CO stretching vibration of bidentate carbonates (minor species).23,73–75 After the introduction of H2, a broad band assignable to gaseous CO was observed at around 2130 cm−1,74–76 indicating that the CO2 adsorbed on the catalyst underwent deoxygenation to produce CO, although such a peak was not observed before H2 introduction because of only a small yield of CO. Along with the increase in time, several additional features associated with the hydrogenated products were observed with increased IR intensity; the peaks observed at 2851 and 2922 cm−1 are assignable to stretching vibrations of C–H bond.76,77 The tailing band observed at around 1300–1400 cm−1 is assignable to hydroxyl O–H deformation vibration and CH3 deformation vibration. The emergence of these bands indicate the formation of methanol over the Pt/HxMoO3−y(300) catalyst via hydrogenation of activated CO2 intermediates or gaseous CO. IR bands associated with formate intermediates were not detected by in situ DRIFT analysis, again elucidating that hydrogenation of CO2 on Pt/HxMoO3−y catalyst occurs via the “RWGS-CO pathway”. It is also noteworthy that CO/methanol were produced even in the absence of solvent, demonstrating the availability of Pt/HxMoO3−y catalyst in gas-phase CO2 hydrogenation reaction to produce CO/methanol. In contrast, the intensity of the IR band for CO2 adsorbed on pristine MoO3 was apparently less than that adsorbed on Pt/HxMoO3−y(300), indicating a much larger amount of adsorption sites for CO2 exists on Pt/HxMoO3−y(300). Furthermore, the IR bands associated with the hydrogenated carbon products were scarcely observed on pristine MoO3, demonstrating the role of Pt NPs as a hydrogenation center.
The reaction rate (R) of CO2 hydrogenation can be expressed by R = k × PCO2α × PH2β, where k is the rate constant, PCO2 and PH2 represent the partial pressure of CO2 and H2, and α and β represent the reaction order of CO2 and H2, respectively. Kinetic analyses demonstrated that the reaction order of CO2 (α) for CO production (0.532) was apparently larger than those for methanol production (0.363) and CH4 production (0.380), indicating that the CO formation step is primarily governed by the CO2 pressure and H2 is rarely involved in this step. However, the reaction orders of H2 (β) for methanol production (1.847) and CH4 production (0.671) were much larger than that for CO production (0.209), indicating that methanol and CH4 are produced from a CO intermediate via hydrogenation and the methanol production rate is strongly dependent on the H2 pressure. These results are consistent with the conclusions drawn by catalytic experiments and the in situ DRIFT spectra measurement whereby CO is produced via deoxygenation of CO2 at the oxygen vacancy sites and methanol and CH4 are produced via hydrogenation of the CO on the Pt NPs. Furthermore, the reaction order of H2 (β) for methanol production (1.847) was close to 2, which is consistent with the stoichiometric ratio of the CO hydrogenation reaction to produce methanol (CO + 2H2 → CH3OH). Reaction rates decreased as the reaction temperature was lowered (Fig. 7c), although methanol synthesis from CO2/H2 favors lower reaction temperature due to an exothermic reaction. This is probably because of the RWGS reaction, an endothermic process (CO2 + H2 = CO + H2O; ΔH0298 = 41.2 kJ mol−1), dominantly takes place in the early stage of reaction. From the Arrhenius plots, the activation energies for the production of CO, methanol, and CH4 were determined as 46.8, 71.1, and 72.9 kJ mol−1, respectively (Fig. 7d), verifying that the former deoxygenation reaction of CO2 to produce CO is energetically more favorable than the latter hydrogenation reactions of the CO intermediate.
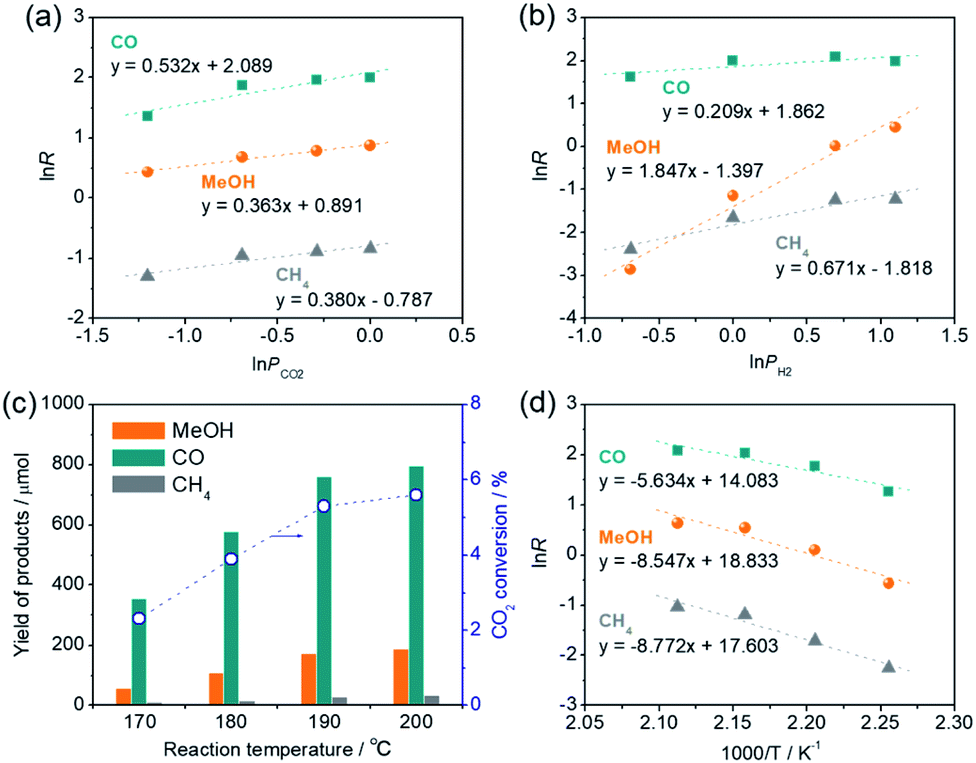 | ||
| Fig. 7 (a) Double logarithm plots of reaction rate (R) and the partial pressure of CO2 (PCO2), (b) double logarithm plots of reaction rate (R) and the partial pressure of H2 (PH2), (c) effect of reaction temperature on catalytic performance, and (d) Arrhenius plots for the Pt/HxMoO3−y(300) catalyst. Reaction conditions: catalyst (50 mg), 1,4-dioxane (15 mL), reaction time = 2 h. | ||
To draw a possible reaction pathway for CO2 hydrogenation whereby methanol is produced over the Pt/HxMoO3−y catalyst, DFT calculations using the periodic slab model were performed. Based on the HR-TEM observation results and previous literature,42,43 a slab model composed of a Pt20 cluster immobilized on the (100) exposed surface of H30Mo32O96 of which the interface is bridged by four Mo–O–Pt bonds was established (state A in Fig. 8). The calculated stepwise energy diagrams for CO2 hydrogenation to methanol are depicted in Fig. 8 (the optimized structure models for each reaction step are presented in Fig. S11 in ESI†). Note that all the presented intermediate states were optimized after considering multiple possible pathways with the lowest energies. To begin with, three H2 molecules are adsorbed into the slab model, which results in the formation of six dissociated H atoms on the Pt20 cluster resulting in a large stabilization energy due to exothermic process (state B). The thus formed active H atoms are transferred to nearby surface terminal O atoms (states C, D), and then coordinated to the bi-bridging oxygen atom (states E, F), which eventually leads to the formation of H2O (state G) and an oxygen vacancy (state H) (2H+ + 2e− + OO → H2O + VO), coinciding well with the previous reports of O vacancy formation on α-MoO3.58,59 The above reaction steps proceed with relatively low activation energies (TS1 ∼ TS5; Ea < 28 kcal mol−1) compared with the later reaction steps, while no possible pathways were found over a H30Mo32O96 slab model without the Pt20 cluster. Thus, an oxygen vacancy is likely to be formed via the H-spillover process involving the Pt NPs as illustrated in Scheme 1.
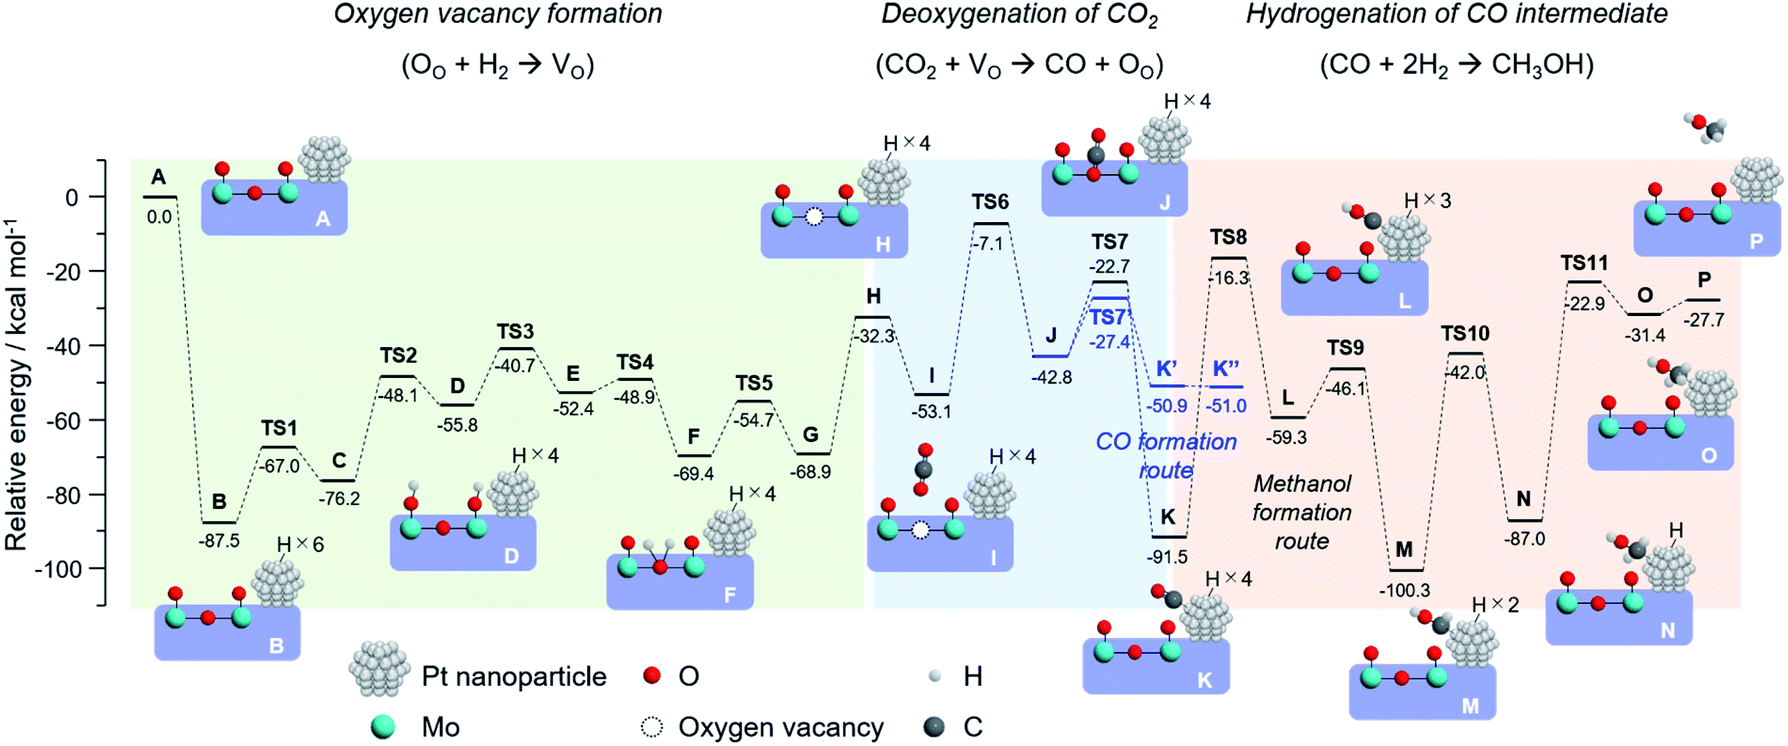 | ||
| Fig. 8 Optimized reaction pathway for CO2 hydrogenation to produce methanol, and potential energy diagram obtained by DFT calculation using H26Mo32O96–Pt20 slab model and schematic illustrations of the corresponding structure models in each reaction step. | ||
Next, one CO2 molecule is adsorbed nearby the oxygen vacancy site (state I). As demonstrated for the oxygen-defective H30Mo32O95 slab model (Fig. 4a), CO2 is adsorbed and coordinated on the oxygen vacancy (state J) with an energy barrier of 46.0 kcal mol−1 (TS6) to form the monodentate carbonate species (*O–C–O) or bidentate carbonate species (CO32−) as intermediates, which is well consistent with the results obtained above whereby the oxygen vacancy is responsible for capturing and activating CO2. The dissociation of the CO bond of these intermediates occurs on the O vacancy site with an energy barrier of 20.1 kcal mol−1 (TS7), and the dissociated *CO is stabilized by being adsorbed on the Pt20 cluster (state K). The CO bond cleavage on O vacancy site is corroborated by comparing the reaction paths on the different sites; over the perfect slab model without an oxygen vacancy, CO2 molecule is stabilized most by being adsorbed on the Pt20 cluster surface, and the path for *CO formation could not be explored. The dissociation of CO2 on the Pt20 cluster surface was found to involve a high energy barrier of 102.1 kcal mol−1 (Fig. S12 in ESI†), which is 5-fold higher than that on the O vacancy site, indicating a low possibility of CO2 dissociation on the Pt surface. Thus, the oxygen vacancy of HxMoO3−y lowers the energy barriers for the cleavage of the CO bond and functions as a deoxygenation center, rendering the Pt/HxMoO3−y catalyst highly active towards CO2 hydrogenation.
Subsequently, the *CO intermediate adsorbed on the Pt20 cluster is hydrogenated by the active H atoms to finally produce methanol. The H atom on Pt first adds to the oxygen atom of the *CO (state L), which is followed by successive hydrogenation of the *COH intermediate to form *CHOH (state M), *CH2OH (state N), and finally to produce the desired *CH3OH (state O). The hydrogenation of *CO into *COH, *CHOH, *CH2OH and *CH3OH involves high energy barriers of 75.2, 13.2, 58.3, and 64.1 kcal mol−1, respectively. In particular, the addition of the first H atom to *CO is required to overcome the highest energy barrier among all the TS's. This result suggests that CO serves as the main intermediate, and the rate-determining step of this reaction is the hydrogenation of the *CO intermediate (TS8), this being consistent with the reaction results and the kinetic analysis (Fig. 7).
We further explored the reaction paths for the production of CO and methane over the same slab model. Free CO can be formed from the *O–C–O intermediate with an energy barrier of 15.4 kcal mol−1 (TS7′) (for optimized structure models, see Fig. S13 in ESI†), which is slightly lower than the energy barrier for the formation of the *CO intermediate adsorbed on the Pt20 cluster (TS7: Ea = 15.4 kcal mol−1) and is significantly lower than those for methanol production from the *CO intermediate (TS8, TS10, TS11). This result indicates that gaseous CO formation is thermodynamically more favorable than the formation of methanol, being in line with the experimental results. Regarding methane production via hydrogenation of the *CO intermediate, possible intermediates and reaction pathways over the H26Mo32O96–Pt20 model were screened for. Given that the energy barrier for dehydration of *CHOH to form *CH (Ea = 65.4 kcal mol−1) was lower than those for dehydration of *COH (Ea = 67.7 kcal mol−1) and *CH2OH (Ea = 118.3 kcal mol−1), *CH is considered as the stable intermediate upon the formation of methane on the Pt/HxMoO3−y catalyst (Fig. S14 in ESI†). The following hydrogenation of *CH proceeds via a stepwise formation of *CH2, *CH3 and CH4 with reaction barriers of 20.1, 36.2 and 54.8 kcal mol−1, respectively. The highest energy barrier to generate methanol from the *CHOH intermediate is 64.1 kcal mol−1, which is lower than that for the transformation into methane (Ea = 65.4 kcal mol−1). Thus, methanol formation is energetically more favorable than methane formation over the Pt/HxMoO3−y catalyst; hence the higher selectivity for methanol rather than for methane being well elucidated as demonstrated in the reaction experiments.
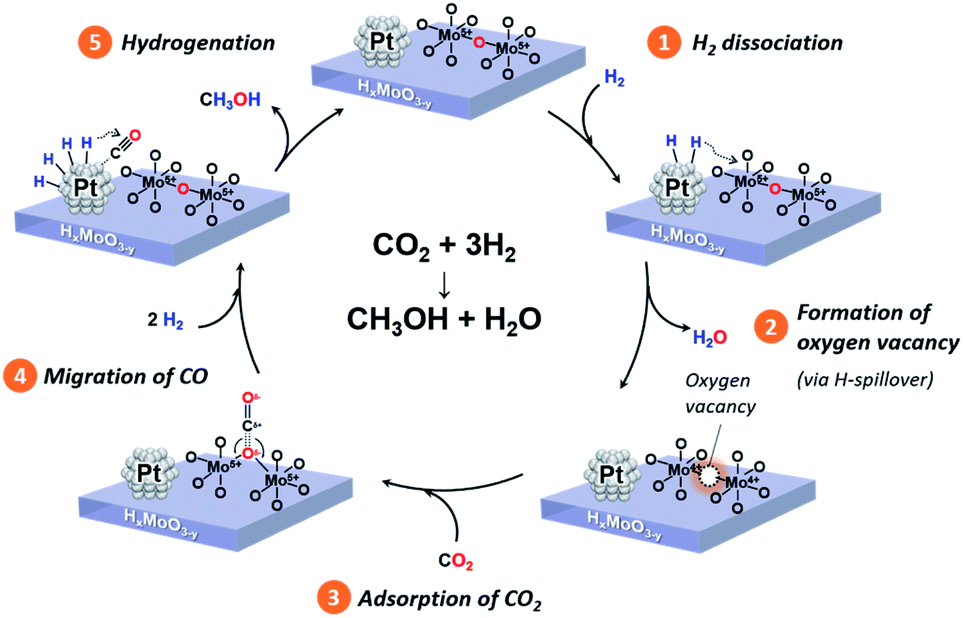
Based on comprehensive analyses of the reactions, in situ spectroscopic measurements and DFT calculations, we conclude that CO2 hydrogenation to produce methanol over the Pt/HxMoO3−y catalyst is achieved via oxygen vacancy-mediated “reverse Mars–van Kreveren” mechanism,31,33,41,72 as illustrated in Scheme 2. First, oxygen vacancies are formed in the HxMoO3−y sub-oxide during H2 reduction through H2 dissociation on the Pt NPs and the H-spillover process (steps 1 and 2). CO2 is adsorbed on the oxygen vacancies and activated by the adjacent under-coordinated low-valence Mo centers (Mo5+/Mo4+) via electron donation with high adsorption energy, which induces the polarization of CO2, weakening and then dissociation of the CO bond. As a result, a CO intermediate is formed, and the oxygen vacancy is concurrently replenished with O atoms to restore an intact oxide surface (step 3). Based on the exploration by DFT calculation, the *CO intermediate is likely to migrate onto the Pt NP surface (step 4). The *CO intermediate reacts with active H species dissociated on the Pt NPs to initially form *COH species, which then undergo stepwise C–H bond formation, finally leading to the formation of methanol (step 5). A sole HxMoO3−y works as a “reductant” but cannot be deemed as a “catalyst” for CO2 reduction. On the contrary, the hybrid Pt/HxMoO3−y catalyst developed in this study contains Pt NPs, which act as (i) active sites to supply dissociated H atoms to generate oxygen vacancies in Mo oxide and as (ii) active sites for hydrogenation of the CO intermediate to finally produce methanol (and methane). Owing to the high H2 dissociation ability of the Pt NP (which occurs at around 140 °C, see Fig. 3a), the catalyst can sustain oxygen vacancies, and thus the catalytic cycle can be realized (steps 1 and 2). These catalytic cycles and the cooperative effect at the Pt–HxMoO3−y interface facilitate efficient CO2 hydrogenation under relatively mild reaction conditions.38,74,75 The proposed reaction mechanism is totally different from the one known for the conventional Cu-based catalysts which normally require much higher reaction temperatures.39,45,46
 | ||
| Scheme 2 Proposed reaction mechanism of CO2 hydrogenation to produce methanol over the Pt/HxMoO3−y catalyst. | ||
In addition, recyclability of the Pt/HxMoO3−y(300) catalyst was investigated in recycling tests (Fig. S15 in ESI†). The Pt/HxMoO3−y(300) retained its catalytic activity for methanol production over multiple cycles; however, a continuous reduction of activity and methanol yield was observed. Characterization data including the XRD, XPS and XAFS results demonstrated that the structural variation of the HxMoO3−y support was negligible even after the fourth cycle (see Fig. S16 in ESI†); however, TEM observation showed that the average Pt particle diameter of the spent catalyst apparently increased. As demonstrated above, the CO2 deoxygenation is the dominant reaction at the interface between the Pt NPs and the HxMoO3−y sub-oxide. Therefore, the reason for the continuous reduction in activity is probably due to the decreased number of Pt–HxMoO3−y interfacial sites due to the aggregation of the Pt NPs upon catalytic use,78 hence making the cooperative effect less effective.
Conclusions
In conclusion, the Pt/HxMoO3−y hybrid catalyst was demonstrated to function as an efficient catalyst for CO2 hydrogenation to produce methanol under relatively mild reaction conditions. The Pt NPs immobilized on a quasi-stable HxMoO3−y sub-oxide exhibited the highest CO2 conversion and methanol yield among the oxide-supported Pt catalysts examined, with a methanol formation rate of 1.53 mmol g-cat−1 h−1 in the liquid-phase CO2 hydrogenation under relatively mild reaction conditions (total 4.0 MPa, 200 °C). Comprehensive analyses revealed that abundant surface oxygen vacancies and redox ability of Mo species in quasi-stable HxMoO3−y endows this catalyst with enhanced adsorption and activation of CO2 to produce a CO intermediate. As a result, the Pt NP can act as (i) a hydrogenation center to produce methanol from *CO species and as (ii) a site to supply active H atoms to regenerate oxygen vacancies via the H-spillover process. Thus, it has been clarified that CO2 hydrogenation on the Pt/HxMoO3−y catalyst is governed by the oxygen-vacancy-mediated “reverse Mars–van Krevelen” mechanism, which is promoted by the synergetic interaction between reducible Mo oxide as a CO2-activation center and Pt NP as a H2-activation center. For future development with the aim of large-scale implementation, further efforts to improve the reusability as well as to reduce the cost of the catalyst/process are needed. We expect that a continuous production of methanol/CO with a higher methanol selectivity is possible by employing a gas-phase fixed-bed reactor system, which can circumvent some problems in liquid-phase batch reactor system, such as catalyst deactivation, solvent use and post-separation process. The insights gained in this study is expected to provide a new avenue for manipulating catalytic properties via “oxygen vacancy engineering” approach and for advancing the mechanistic understanding of heterogeneous catalysis involving oxygen vacancies of metal oxides, which would contribute to the future development of more elaborated and high-performance catalysts for CO2 hydrogenation.Author contributions
Y. Kuwahara led the conceptualization, design of the experiments, analysis and validation of the results, and wrote the manuscript. T. Mihogi, K. Hamahara and K. Kusu contributed to material synthesis, data collection, and formal analysis. H. Kobayashi contributed to the DFT calculation, formal analysis and data curation. H. Yamashita provided key advice and supervised the study.Conflicts of interest
There are no conflicts to declare.Acknowledgements
The present work was supported by JST, PRESTO (grant no. JPMJPR19T3), Japan, the Tonen General Sekiyu Research/Development Encouragement & Scholarship Foundation, and the Iwatani Naoji Foundation. A part of this work was supported by the grant for research of the Japan Petroleum Institute, 2018, awarded to Y. K. Y. K. and H. Y. thank Element Strategy Initiative of MEXT (grant no. JPMXP0112101003). The synchrotron radiation experiments for XAFS measurements were performed at the BL01B1 beam line in SPring-8 with the approval from JASRI (no. 2018B1185 and 2019A1050).Notes and references
- J. Artz, T. E. Muller, K. Thenert, J. Kleinekorte, R. Meys, A. Sternberg, A. Bardow and W. Leitner, Chem. Rev., 2018, 118, 434–504 CrossRef CAS PubMed.
- A. J. Hunt, E. H. Sin, R. Marriott and J. H. Clark, ChemSusChem, 2010, 3, 306–322 CrossRef CAS PubMed.
- E. V. Kondratenko, G. Mul, J. Baltrusaitis, G. O. Larrazábal and J. Pérez-Ramírez, Energy Environ. Sci., 2013, 6, 3112–3135 RSC.
- E. A. Quadrelli, G. Centi, J. L. Duplan and S. Perathoner, ChemSusChem, 2011, 4, 1194–1215 CrossRef CAS PubMed.
- A. Alvarez, A. Bansode, A. Urakawa, A. V. Bavykina, T. A. Wezendonk, M. Makkee, J. Gascon and F. Kapteijn, Chem. Rev., 2017, 117, 9804–9838 CrossRef CAS PubMed.
- M. D. Porosoff, B. Yan and J. G. Chen, Energy Environ. Sci., 2016, 9, 62–73 RSC.
- R. Sun, Y. Liao, S.-T. Bai, M. Zheng, C. Zhou, T. Zhang and B. F. Sels, Energy Environ. Sci., 2021, 14, 1247–1285 RSC.
- A. Karelovic, G. Galdames, J. C. Medina, C. Yévenes, Y. Barra and R. Jiménez, J. Catal., 2019, 369, 415–426 CrossRef CAS.
- R. P. Ye, J. Ding, W. Gong, M. D. Argyle, Q. Zhong, Y. Wang, C. K. Russell, Z. Xu, A. G. Russell, Q. Li, M. Fan and Y. G. Yao, Nat. Commun., 2019, 10, 5698 CrossRef CAS PubMed.
- Z. Ma and M. D. Porosoff, ACS Catal., 2019, 9, 2639–2656 CrossRef CAS.
- D. R. Palo, Chem. Rev., 2007, 107, 3992–4021 CrossRef CAS PubMed.
- K. C. Waugh, Catal. Lett., 2012, 142, 1153–1166 CrossRef CAS.
- M. Saito, Catal. Surv. Jpn., 1998, 2, 175–184 CrossRef CAS.
- G. A. Olah, Angew. Chem., Int. Ed., 2013, 52, 104–107 CrossRef CAS PubMed.
- G. A. Olah, A. Goeppert and G. K. S. Prakash, J. Org. Chem., 2009, 74, 487–498 CrossRef CAS PubMed.
- R. Gaikwad, A. Bansode and A. Urakawa, J. Catal., 2016, 343, 127–132 CrossRef CAS.
- W. H. Wang, Y. Himeda, J. T. Muckerman, G. F. Manbeck and E. Fujita, Chem. Rev., 2015, 115, 12936–12973 CrossRef CAS PubMed.
- Y. Chen, S. Choi and L. T. Thompson, ACS Catal., 2015, 5, 1717–1725 CrossRef CAS.
- S. Kar, A. Goeppert, J. Kothandaraman and G. K. S. Prakash, ACS Catal., 2017, 7, 6347–6351 CrossRef CAS.
- J. Kothandaraman, A. Goeppert, M. Czaun, G. A. Olah and G. K. Prakash, J. Am. Chem. Soc., 2016, 138, 778–781 CrossRef CAS PubMed.
- N. M. Rezayee, C. A. Huff and M. S. Sanford, J. Am. Chem. Soc., 2015, 137, 1028–1031 CrossRef CAS PubMed.
- S. Wesselbaum, V. Moha, M. Meuresch, S. Brosinski, K. M. Thenert, J. Kothe, T. V. Stein, U. Englert, M. Holscher, J. Klankermayer and W. Leitner, Chem. Sci., 2015, 6, 693–704 RSC.
- S. Bai, Q. Shao, Y. Feng, L. Bu and X. Huang, Small, 2017, 13, 1604311 CrossRef PubMed.
- M. U. Khan, L. Wang, Z. Liu, Z. Gao, S. Wang, H. Li, W. Zhang, M. Wang, Z. Wang, C. Ma and J. Zeng, Angew. Chem., Int. Ed., 2016, 55, 9548–9552 CrossRef PubMed.
- H. Li, L. Wang, Y. Dai, Z. Pu, Z. Lao, Y. Chen, M. Wang, X. Zheng, J. Zhu, W. Zhang, R. Si, C. Ma and J. Zeng, Nat. Nanotechnol., 2018, 13, 411–417 CrossRef CAS PubMed.
- T. Toyao, S. Kayamori, Z. Maeno, S. M. A. H. Siddiki and K.-i. Shimizu, ACS Catal., 2019, 9, 8187–8196 CrossRef CAS.
- Z. He, Q. Qian, J. Ma, Q. Meng, H. Zhou, J. Song, Z. Liu and B. Han, Angew. Chem., Int. Ed., 2016, 55, 737–741 CrossRef CAS PubMed.
- X. Zheng, Y. Lin, H. Pan, L. Wu, W. Zhang, L. Cao, J. Zhang, L. Zheng and T. Yao, Nano Res., 2018, 11, 2357–2365 CrossRef CAS.
- W. Zhang, L. Wang, H. Liu, Y. Hao, H. Li, M. U. Khan and J. Zeng, Nano Lett., 2017, 17, 788–793 CrossRef CAS PubMed.
- K. W. Ting, T. Toyao, S. M. A. H. Siddiki and K.-i. Shimizu, ACS Catal., 2019, 9, 3685–3693 CrossRef CAS.
- D. Ferri, T. Bürgi and A. Baiker, Phys. Chem. Chem. Phys., 2002, 4, 2667–2672 RSC.
- G. Zhuang, Y. Chen, Z. Zhuang, Y. Yu and J. Yu, Sci. China Mater., 2020, 63, 2089–2118 CrossRef CAS.
- L. F. Bobadilla, J. L. Santos, S. Ivanova, J. A. Odriozola and A. Urakawa, ACS Catal., 2018, 8, 7455–7467 CrossRef CAS.
- B. J. Hare, D. Maiti, Y. A. Daza, V. R. Bhethanabotla and J. N. Kuhn, ACS Catal., 2018, 8, 3021–3029 CrossRef CAS.
- J. Ye, C. Liu, D. Mei and Q. Ge, ACS Catal., 2013, 3, 1296–1306 CrossRef CAS.
- G. Xi, S. Ouyang, P. Li, J. Ye, Q. Ma, N. Su, H. Bai and C. Wang, Angew. Chem., Int. Ed., 2012, 51, 2395–2399 CrossRef CAS PubMed.
- J. Li, Y. Ye, L. Ye, F. Su, Z. Ma, J. Huang, H. Xie, D. E. Doronkin, A. Zimina, J.-D. Grunwaldt and Y. Zhou, J. Mater. Chem. A, 2019, 7, 2821–2830 RSC.
- J. A. Rodriguez, P. Liu, D. J. Stacchiola, S. D. Senanayake, M. G. White and J. G. Chen, ACS Catal., 2015, 5, 6696–6706 CrossRef CAS.
- K. Larmier, W. C. Liao, S. Tada, E. Lam, R. Verel, A. Bansode, A. Urakawa, A. Comas-Vives and C. Coperet, Angew. Chem., Int. Ed., 2017, 56, 2318–2323 CrossRef CAS PubMed.
- M. S. Frei, C. Mondelli, R. Garcia-Muelas, K. S. Kley, B. Puertolas, N. Lopez, O. V. Safonova, J. A. Stewart, D. Curulla Ferre and J. Perez-Ramirez, Nat. Commun., 2019, 10, 3377 CrossRef PubMed.
- Y. Kuwahara, Y. Yoshimura, K. Haematsu and H. Yamashita, J. Am. Chem. Soc., 2018, 140, 9203–9210 CrossRef CAS PubMed.
- L. Chen, A. C. Cooper, G. P. Pez and H. Cheng, J. Phys. Chem. C, 2008, 112, 1755–1758 CrossRef CAS.
- H. Cheng, L. Chen, A. C. Cooper, X. Sha and G. P. Pez, Energy Environ. Sci., 2008, 1, 338–354 RSC.
- H. Cheng, T. Kamegawa, K. Mori and H. Yamashita, Angew. Chem., Int. Ed., 2014, 53, 2910–2914 CrossRef CAS PubMed.
- P. Liu, Y. Yang and M. G. White, Surf. Sci. Rep., 2013, 68, 233–272 CrossRef CAS.
- S. Kattel, P. Liu and J. G. Chen, J. Am. Chem. Soc., 2017, 139, 9739–9754 CrossRef CAS PubMed.
- J. J. Birtill and P. G. Dickens, Mater. Res. Bull., 1978, 13, 311–316 CrossRef CAS.
- S. Adams, J. Solid State Chem., 2000, 149, 75–87 CrossRef CAS.
- B. Braïda, S. Adams and E. Canadell, Chem. Mater., 2005, 17, 5957–5969 CrossRef.
- N. A. Chernova, M. Roppolo, A. C. Dillon and M. S. Whittingham, J. Mater. Chem., 2009, 19, 2526–2552 RSC.
- X. W. Lou and H. C. Zeng, Chem. Mater., 2002, 14, 4781–4789 CrossRef CAS.
- P. A. Sermon and G. C. Bond, Catal. Rev., 1973, 8, 211–239 CrossRef CAS.
- S. Masuda, K. Shun, K. Mori, Y. Kuwahara and H. Yamashita, Chem. Sci., 2020, 11, 4194–4203 RSC.
- P. A. Sermon and G. C. Bond, J. Chem. Soc., Faraday Trans. 1, 1976, 72, 730–744 RSC.
- R. Erre, H. van Damme and J. J. Fripiat, Surf. Sci., 1983, 127, 48–68 CrossRef CAS.
- R. Erre, H. van Damme and J. J. Fripiat, Surf. Sci., 1983, 127, 69–82 CrossRef CAS.
- J. G. Kim and J. R. Regalbuto, J. Catal., 1993, 139, 175–190 CrossRef CAS.
- Y.-H. Lei and Z.-X. Chen, J. Phys. Chem. C, 2012, 116, 25757–25764 CrossRef CAS.
- J. Z. Ou, J. L. Campbell, D. Yao, W. Wlodarski and K. Kalantar-zadeh, J. Phys. Chem. C, 2011, 115, 10757–10763 CrossRef CAS.
- M. Vasilopoulou, A. M. Douvas, D. G. Georgiadou, L. C. Palilis, S. Kennou, L. Sygellou, A. Soultati, I. Kostis, G. Papadimitropoulos, D. Davazoglou and P. Argitis, J. Am. Chem. Soc., 2012, 134, 16178–16187 CrossRef CAS PubMed.
- H. Cheng, M. Wen, X. Ma, Y. Kuwahara, K. Mori, Y. Dai, B. Huang and H. Yamashita, J. Am. Chem. Soc., 2016, 138, 9316–9324 CrossRef CAS PubMed.
- H. Cheng, X. Qian, Y. Kuwahara, K. Mori and H. Yamashita, Adv. Mater., 2015, 27, 4616–4621 CrossRef CAS PubMed.
- H. S. Kim, J. B. Cook, H. Lin, J. S. Ko, S. H. Tolbert, V. Ozolins and B. Dunn, Nat. Mater., 2017, 16, 454–460 CrossRef CAS PubMed.
- A. Borgschulte, O. Sambalova, R. Delmelle, S. Jenatsch, R. Hany and F. Nuesch, Sci. Rep., 2017, 7, 40761 CrossRef CAS PubMed.
- J. J. Birtill and P. G. Dickens, J. Solid State Chem., 1979, 29, 367–372 CrossRef CAS.
- N. Sotani, K. Eda, M. Sadamitu and S. Takagi, Bull. Chem. Soc. Jpn., 1989, 62, 903–907 CrossRef CAS.
- S. Chen, H. Wang, Z. Kang, S. Jin, X. Zhang, X. Zheng, Z. Qi, J. Zhu, B. Pan and Y. Xie, Nat. Commun., 2019, 10, 788 CrossRef CAS PubMed.
- X. Yang, S. Wang, N. Yang, W. Zhou, P. Wang, K. Jiang, S. Li, H. Song, X. Ding, H. Chen and J. Ye, Appl. Catal., B, 2019, 259, 118088 CrossRef CAS.
- R. Radhakrishnan, C. Reed, S. T. Oyama, M. Seman, J. N. Kondo, K. Domen, Y. Ohminami and K. Asakura, J. Phys. Chem. B, 2001, 105, 8519–8530 CrossRef CAS.
- Y. N. Zhou, J. Ma, E. Hu, X. Yu, L. Gu, K. W. Nam, L. Chen, Z. Wang and X. Q. Yang, Nat. Commun., 2014, 5, 5381 CrossRef.
- P. Mars and D. W. van Krevelen, Chem. Eng. Sci., 1954, 3, 41–59 CrossRef CAS.
- A. V. Mironenko and D. G. Vlachos, J. Am. Chem. Soc., 2016, 138, 8104–8113 CrossRef CAS PubMed.
- S. Gaur, H. Wu, G. G. Stanley, K. More, C. S. S. R. Kumar and J. J. Spivey, Catal. Today, 2013, 208, 72–81 CrossRef CAS.
- Y. F. Li, W. Lu, K. Chen, P. Duchesne, A. Jelle, M. Xia, T. E. Wood, U. Ulmer and G. A. Ozin, J. Am. Chem. Soc., 2019, 141, 14991–14996 CrossRef CAS.
- Y. F. Li, N. Soheilnia, M. Greiner, U. Ulmer, T. Wood, A. A. Jelle, Y. Dong, A. P. Yin Wong, J. Jia and G. A. Ozin, ACS Appl. Mater. Interfaces, 2019, 11, 5610–5615 CrossRef CAS PubMed.
- S. Bai, Q. Shao, P. Wang, Q. Dai, X. Wang and X. Huang, J. Am. Chem. Soc., 2017, 139, 6827–6830 CrossRef CAS.
- A. Lubezky, L. Chechelnitsky and M. Folman, J. Chem. Soc., Faraday Trans., 1996, 92, 2269–2274 RSC.
- H. Bahruji, M. Bowker, G. Hutchings, N. Dimitratos, P. Wells, E. Gibson, W. Jones, C. Brookes, D. Morgan and G. Lalev, J. Catal., 2016, 343, 133–146 CrossRef CAS.
Footnote |
| † Electronic supplementary information (ESI) available. See DOI: 10.1039/d1sc02550c |
| This journal is © The Royal Society of Chemistry 2021 |