
 Open Access Article
 This Open Access Article is licensed under a Creative Commons Attribution-Non Commercial 3.0 Unported Licence
Mechanical unfolding of ensemble biomolecular structures by shear force†
Changpeng
Hu‡
,
Sagun
Jonchhe‡
 ,
Pravin
Pokhrel
,
Deepak
Karna
and
Hanbin
Mao
*
,
Pravin
Pokhrel
,
Deepak
Karna
and
Hanbin
Mao
*
Department of Chemistry & Biochemistry and School of Biomedical Sciences, Advanced Materials and Liquid Crystal Institute, Kent State University Kent, OH 44242, USA. E-mail: hmao@kent.edu; ppokhre1@kent.edu
First published on 12th July 2021
Abstract
Mechanical unfolding of biomolecular structures has been exclusively performed at the single-molecule level by single-molecule force spectroscopy (SMFS) techniques. Here we transformed sophisticated mechanical investigations on individual molecules into a simple platform suitable for molecular ensembles. By using shear flow inside a homogenizer tip, DNA secondary structures such as i-motifs are unfolded by shear force up to 50 pN at a 77![[thin space (1/6-em)]](https://www.rsc.org/images/entities/char_2009.gif) 796 s−1 shear rate. We found that the larger the molecules, the higher the exerted shear forces. This shear force approach revealed affinity between ligands and i-motif structures. It also demonstrated a mechano-click reaction in which a Cu(I) catalyzed azide–alkyne cycloaddition was modulated by shear force. We anticipate that this ensemble force spectroscopy method can investigate intra- and inter-molecular interactions with the throughput, accuracy, and robustness unparalleled to those of SMFS methods.
796 s−1 shear rate. We found that the larger the molecules, the higher the exerted shear forces. This shear force approach revealed affinity between ligands and i-motif structures. It also demonstrated a mechano-click reaction in which a Cu(I) catalyzed azide–alkyne cycloaddition was modulated by shear force. We anticipate that this ensemble force spectroscopy method can investigate intra- and inter-molecular interactions with the throughput, accuracy, and robustness unparalleled to those of SMFS methods.
Introduction
Mechanical properties of individual molecular structures have been probed using instruments such as optical tweezers, magnetic tweezers, and an AFM.1–4 There is no approach currently available to investigate mechanical properties of more than a few hundred molecular structures without attaching to specific surfaces. The limited number is set by the field of view in magnetic tweezers2,4 and miniature centrifuge force microscopes (MCF)5–8 where micrometer-sized beads are required to introduce force, as well as in fluorescence microscopes in which fluorescence9 or FRET (fluorescence resonance energy transfer) signals have been used to report the force for molecules anchored in DNA origami frameworks.10 The difficulty in measuring mechanical properties of a larger set of molecules lies in the directionality of the force. Before any mechanical manipulation can be made, different molecules must be oriented along the same direction. For single-molecule studies, such a requirement is trivial as only one molecule needs to be aligned. However, for millions of molecules at the ensemble level, it is insurmountable to align these molecules by current instruments before probing their mechanical properties.Shear flow offers a potential solution to orient a large set of molecules. In a liquid stream, the no-slip condition dictates that the speed of the fluid at the boundary is zero, while that at the middle of the flow is fastest.11 Such a gradient of flow speed incurs a shear stress applied parallel to the surface of the boundary. For example, when the shear force is higher than the entropic recoiling force of a polymer, the polymer gets stretched by the tensile force applied along its long axes (Fig. 1A). As long as the flow direction and the variation in the flow rate are maintained, all molecules in such a flow stream will take the same orientation along which the same force can be applied.
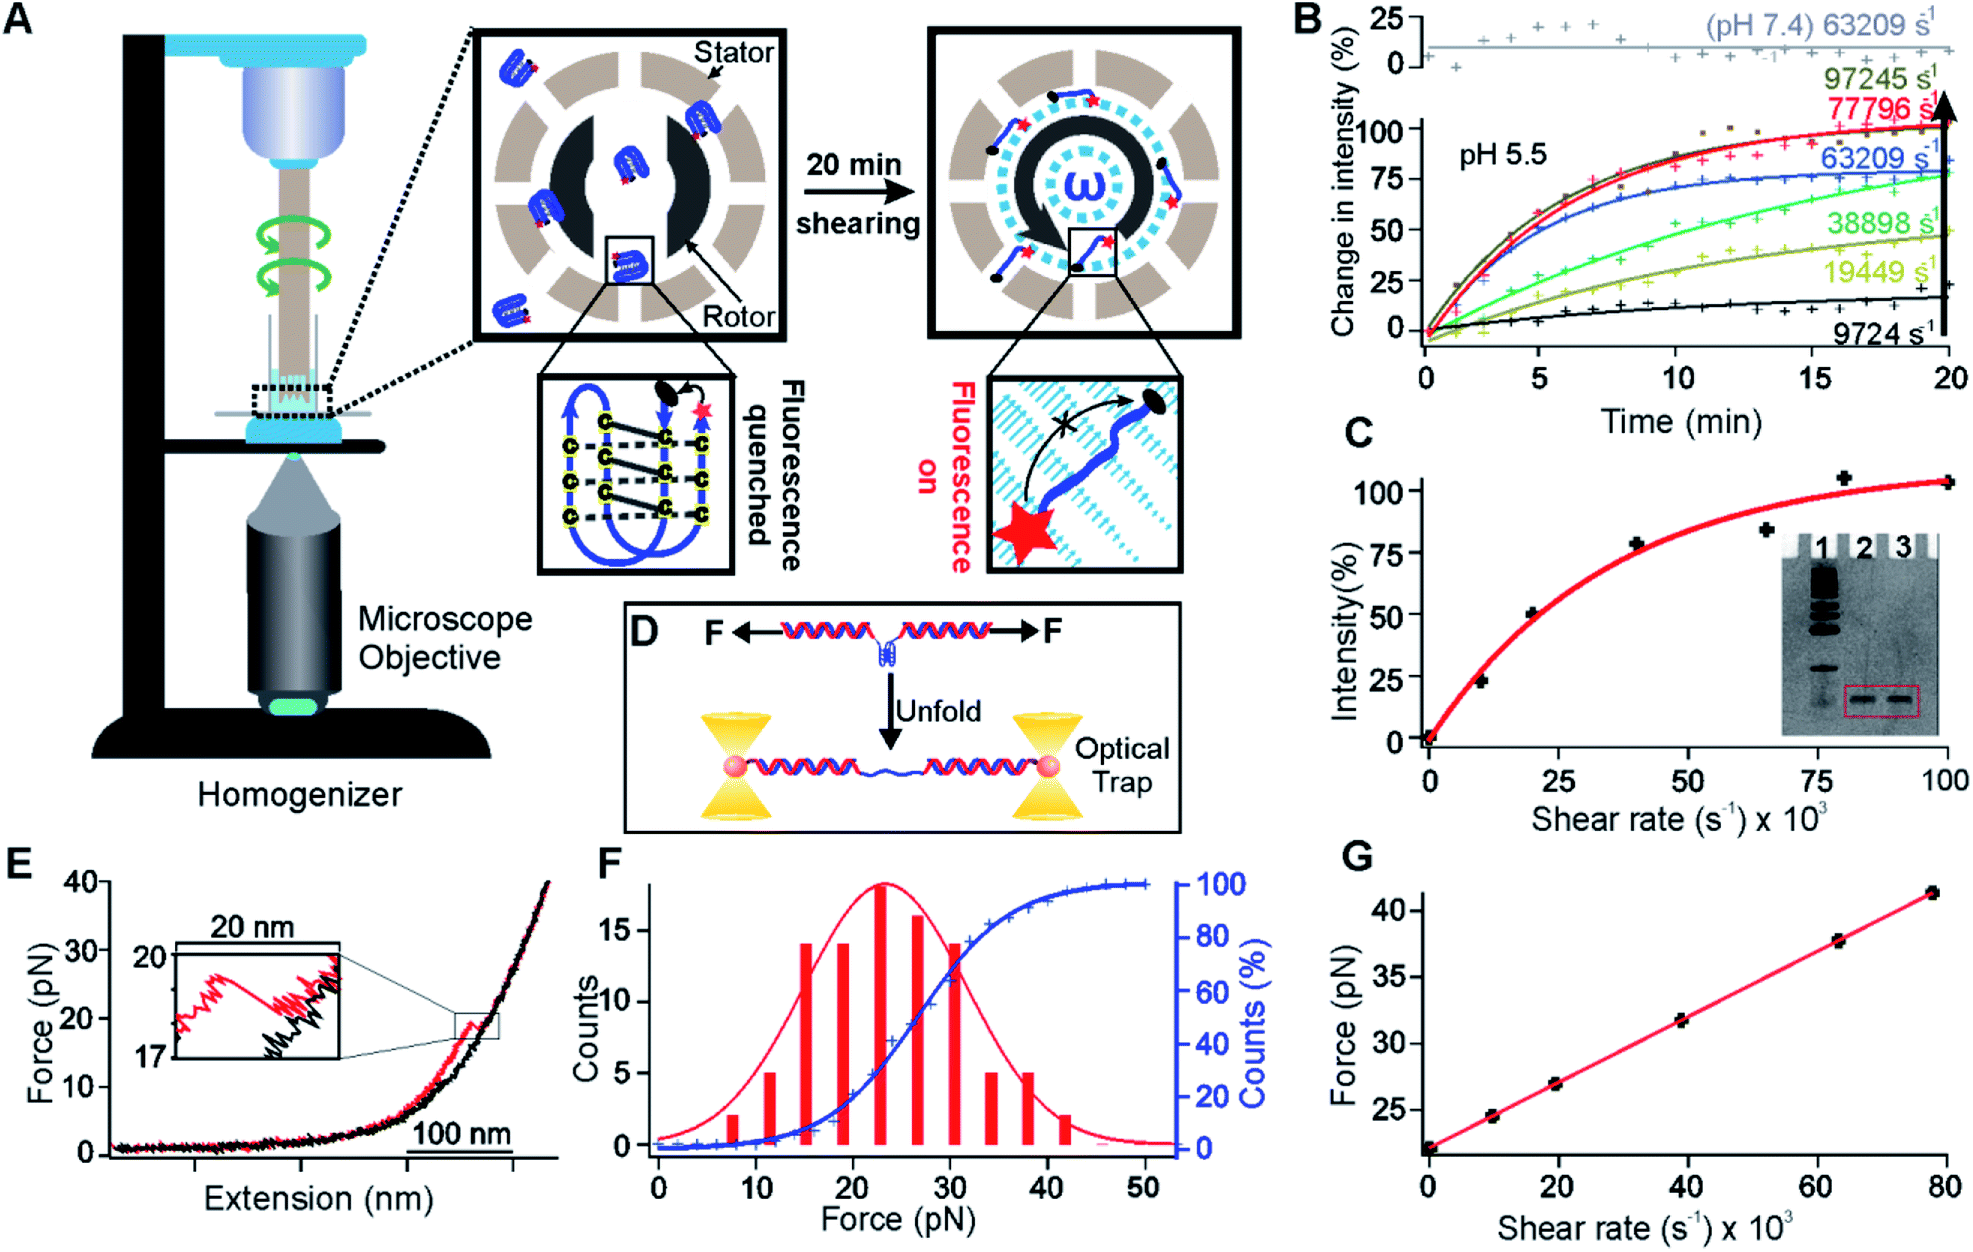 | ||
| Fig. 1 Unfolding of the i-motif in shear flow. (A) Schematic of the unfolding of a FRET pair (Cy5 and Iowa Black® RQ) labelled i-motif (Oligo 5, Table S2†) by the shear flow generated in a benchtop homogenizer. Insets: the dotted cyan circle indicates the buffer under shear conditions. The grey circular arrow indicates the direction of the rotor. Zoomed view of the right inset: cyan arrows indicate the buffer flow during shearing. The length of each arrow depicts the velocity of a particular flow stream. (B) Real time percentage change of the fluorescence intensity due to the unfolding of the i-motif at different shear rates (see Fig. S10† for the raw data). Solid curves indicate the exponential fitting. R2 values for the fitting in an ascending order of the shear rates at pH 5.5 are 0.69, 0.95, 0.99, 0.99, 0.98, and 0.97. (C) Shear rate vs. the percentage of increased fluorescence intensity after 20 min of shearing. The red curve depicts exponential fitting (R2 = 0.98). The inset shows the image of 15% denatured PAGE for the 27 nt i-motif at a 63209 s−1 shear rate for 20 min (lane 1, marker; lane 2, before shearing; lane 3, after shearing). (D) Schematic of the single-molecule mechanical unfolding of the human telomeric i-motif (Oligo 3, Table S2†) in optical tweezers. (E) A typical force-extension curve of unfolding the i-motif at pH 5.5 supplemented with 100 mM KCl. (F) Unfolding force histogram of the i-motif (left axis) and the cumulative unfolding percentage vs. force (right axis). The unfolding force histogram and cumulative plot are fitted with Gaussian (red) and sigmoidal functions (blue), respectively. (G) Diagram of the shear rate vs. the shear force for the i-motif sequence shown in (A). The red line depicts a linear fitting (R2 = 1.00). | ||
In this work, we used the shear flow generated in a homogenizer tip to mechanically unfold biomolecules as exemplified by human telomeric DNA i-motif structures.12 Using a pair of FRET dyes, we monitored the behavior of the i-motif at a shear rate of 9724–97245 s−1. These shear rates are equivalent to a 17–50 pN mechanical force after comparison with mechanical unfolding of the same DNA structure in optical tweezers. In the presence of an i-motif ligand, L2H2-4OTD,13 less unfolding was observed for the i-motif under the same shear force, consistent with the increased mechanical stability of the L2H2-4OTD bound i-motif. Such a strategy allowed us to reveal a dissociation constant of 34 μM for the L2H2-4OTD binding to the i-motif, a value consistent with that obtained by single-molecule mechanical unfolding in optical tweezers (31 μM) and close to that measured by the gel shift assay.13 Next, we used the shear force to unfold i-motifs, which exposed chelated Cu(I) ions to catalyze a fluorogenic click reaction.14 Using this so-called mechano-click chemistry, we were able to reveal the relationship between the shear force and the size of the i-motif modified with flanking ssDNA fragments. We found that the longer the flanking sequence of the i-motif, the higher the shear force, and the faster the click reaction. Given that the shear force approach drastically increased the throughput of the force spectroscopy, we anticipate that this new method will accurately elucidate mechanobiological and mechanochemical processes at the unprecedented ensemble level.
Results and discussion
Unfolding of the i-motif in shear flow
To demonstrate that the shear stress is able to mechanically unfold an ensemble set of biomolecular structures, we generated a rotational shear flow in a homogenizer generator (see the “Unfolding of the i-motifs with and without L2H2-4OTD” section in the ESI†), which contains a rotor (Fig. 1A, external diameter, 5.00 mm) and a stator (internal diameter, 5.11 mm). While the stator remains still, the speed of the rotor can be adjusted to generate a rotational velocity up to 20000 rpm, which is equivalent to a shear rate of 92745 s−1 for this homogenizer. We anticipated that the biomolecular structures may be mechanically unfolded at such a high shear rate. We used the DNA i-motif formed in the human telomeric sequence, 5′-TAA(CCCTAA)4,12,15 as an exemplary biomolecular structure to test our hypothesis. By attaching a FRET pair of fluorescent molecules, Cy5 and Iowa Black® RQ, to the 5′ and 3′ ends of the telomeric sequence, respectively (Oligo 5, Table S2†), the folded i-motif will not show fluorescence since Cy5 is quenched by Iowa Black® RQ due to close distance of the two dyes. Upon unfolding of the i-motif, the distance between Cy5 and Iowa Black® RQ is too long to carry out efficient energy transfer, resulting in the recovery of Cy5 fluorescence (Fig. 1A).
To observe fluorescence signals, the homogenizer was placed on top of an inverted fluorescence microscope (Fig. 1A). We then dissolved 5 μM of the FRET-pair labelled C-rich telomeric sequence (Oligo 5, Table S2†) in 300 μL of 10 mM MES buffer supplemented with 100 mM KCl at pH 5.5. It is well known that the i-motif was folded at pH 5.5,12 which was confirmed by circular dichroism (CD) data (Fig. S1†). The folded i-motif presented ∼1 nm end-to-end distance15 between Cy5 and Iowa Black® RQ, a value facilitating the Cy5 quenching by Iowa Black® RQ. Indeed, before the rotor was turned on, we observed low Cy5 fluorescence intensity. When the shear flow was established with a shear rate ranging from 9724 to 97245 s−1 in the homogenizer, we observed a saturating exponential increase in the fluorescence intensity (Fig. 1B and see Fig. S10† for the raw data). Turning off the shear flow reversed the trend of the signal change (Fig. S2†). All these observations suggested that the shear flow was able to mechanically unfold DNA i-motif structures. As a control, we repeated experiments for the same i-motif in an MES buffer at pH 7.4, and we found that the fluorescence increase was not observed at a shear rate of 63209 s−1 (Fig. 1B). Since the i-motif did not form at pH 7.4, this result confirmed that the fluorescence increase was due to the unfolding of the i-motif in the shear flow. The rate of the fluorescence signal increase was dependent on the shear rate (Fig. 1B and C), which was consistent with the fact that the higher the shear rate, the more the shear force, and the faster the unfolding rate of the i-motif. To confirm that the fluorescence increase was not due to the break of the i-motif forming DNA under shearing, we examined the integrity of the DNA strands after the shearing. We found negligible breakdown of the DNA strands at a shear rate of 63209 s−1 (Fig. 1C inset, lane 2: before shearing; lane 3: after shearing).
After ∼20 min of shearing, the fluorescence intensity reached a plateau (Fig. 1B) at different shear rates, indicating that a steady state was reached. When we plotted the plateau fluorescence intensity vs. shear rate, we observed that the fluorescence intensity did not change any more at the shear rate above 97245 s−1 (Fig. 1C), suggesting that the associated shear force was already higher than that required to unfold the i-motif. We therefore used the fluorescence intensity at 20 min at the 97245 s−1 shear rate as a reference point to calculate the percentage of unfolded i-motif structures at any time for different shear rates.
To calibrate the mechanical force at a specific shear rate, we compared the percentage of unfolding of the i-motif with that obtained by mechanical unfolding of the same i-motif structure in optical tweezers in the same buffer and pH16 (Fig. 1D, see the “Calculation of the shear force at a particular shear rate” section in the ESI† for details). As shown in the force–extension (F–X) curves of the i-motif (see a typical curve in Fig. 1E and more curves in Fig. S3†), we observed a rupture event (enlarged in Fig. 1E) from which the unfolding force and accompanied change in contour length (ΔL) could be retrieved. The ΔL value (7.6 nm) was consistent with that of the telomeric i-motif (Fig. S4,† expected ΔL: 8.0 nm; see the “Expected change-in-contour-length” section in the ESI† for ΔL calculations), confirming that the rupture event was indeed due to the unfolding of the i-motif. After integration of the unfolding force histogram of this i-motif (Fig. 1F), we obtained the cumulative unfolding percentage at a particular mechanical force (blue curve in Fig. 1F). Assuming that the percentage unfolding of the i-motif was equivalent between the single molecule mechanical unfolding experiment (Fig. 1E) and shear force experiment (Fig. 1C) at a particular force, we calibrated the shear force vs. shear rate in Fig. 1G, which depicted that up to 41 pN could be applied to the FRET-pair labelled i-motif at a shear rate of 77796 s−1. Given that the shear force is dependent on the size of the object inside the shear flow,11 even higher force can be generated if elongated handles such as DNA strands can be attached to molecular structures (see below).
Evaluation of ligand binding to biomacromolecules in shear flow
To demonstrate the capability of this new ensemble force spectroscopy approach, we used the shear flow to evaluate the binding complex between the i-motif and L2H2-4OTD.13 L2H2-4OTD is a compound that can bind to i-motif structures with a dissociation constant (Kd) in the micromolar range.13 After the above-mentioned Cy5 and Iowa Black® RQ labelled i-motif (Oligo 5, Table S2†) was mixed with L2H2-4OTD at different concentrations (6–60 μM) in the same buffer, the mixture was subjected to shear force generated in the homogenizer (Fig. 2). We anticipated that more Cy5 fluorescence would be quenched by Iowa Black® RQ at a particular shear rate since the unfolding of the i-motif became more difficult upon ligand binding.17 Indeed, when we evaluated the unfolding force of the L2H2-4OTD bound i-motif (Fig. S5†), we found an average unfolding force of ∼33 pN (Fig. S6†). Based on this force, we chose 63209 s−1 as the shear rate, which was expected to produce 38 pN on the 27 nt i-motif (Fig. 1G). Such a force was sufficient to unfold a free i-motif (23 pN) but would not unfold all L2H2-4OTD bound i-motifs.
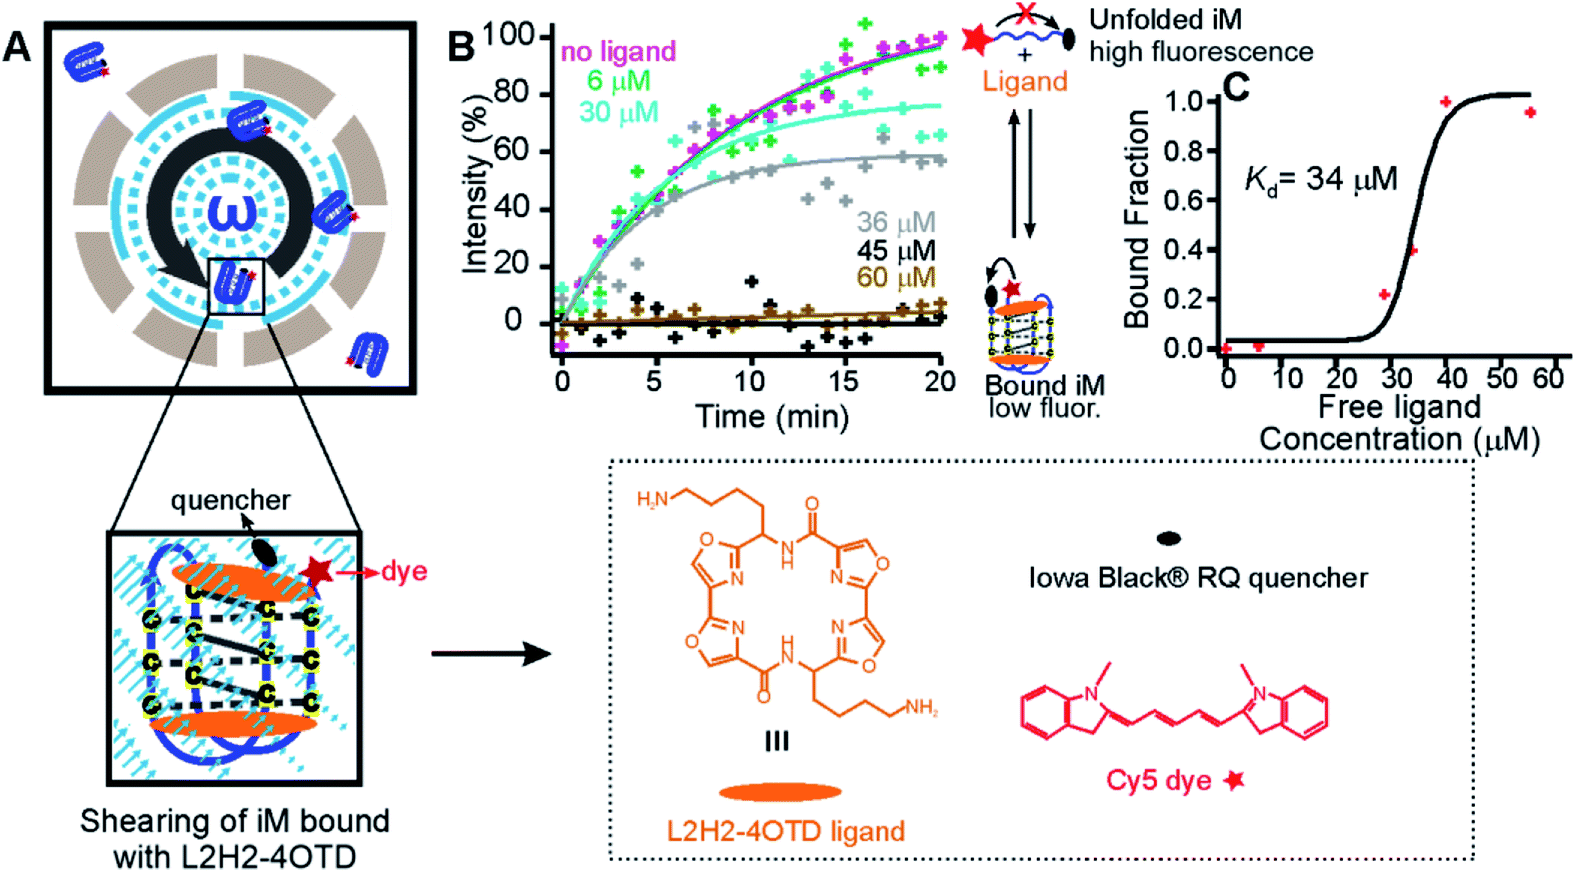 | ||
| Fig. 2 Unfolding of the ligand-bound telomeric i-motif. (A) Schematic of shearing a FRET-pair (Cy5 and Iowa Black® RQ) labelled telomeric i-motif (Fig. 1A) bound with the L2H2-4OTD ligand. (B) Percentage of increased fluorescence intensity of the i-motif versus shearing time at different concentrations of the ligand (0, 6, 30, 36, 45, and 60 μM). Pink, green, cyan, and grey curves indicate exponential fits for 0, 6, 30, and 36 μM ligand concentrations with R2 of 0.98, 0.91, 0.84, and 0.65, respectively. Black and light brown lines (45 and 60 μM ligand concentrations) indicate linear fitting to guide the eye. (C) Binding curve of the i-motif at different free L2H2-4OTD concentrations. See ESI Table S1† for the calculation of free ligand concentrations. The black curve represents the Hill fitting (see eqn (2) in the ESI†). | ||
We found that an increment in the fluorescence intensity became less obvious with increasing L2H2-4OTD concentrations (Fig. 2B), which was expected as more i-motifs were bound with the ligands when the concentration of L2H2-4OTD increased. After using single exponential fitting to these temporal traces, we retrieved the plateau values as the steady-state signals around 20 min, from which the binding percentage of the i-motif was calculated by interpolation against the curve without the ligand (0% binding) and that with 45 μM ligand (100% binding). These binding fractions were then plotted against the free ligand concentration (Fig. 2C). Using Hill’s equation18 (see the “Unfolding of the i-motifs with and without L2H2-4OTD” section in the ESI†), we retrieved a Kd of 34 μM between L2H2-4OTD and the i-motif. Single-molecule mechanical unfolding of the same i-motif in the presence of L2H2-4OTD generated a similar Kd (31 μM) in optical tweezers (Fig. S7†). This Kd is also comparable to that measured by the gel shift (105 μM).13 These results validated the accuracy of our shear flow based mechanical unfolding approach.
Shear force-actuated click reaction
Efficient and quantitative click reactions19 have been widely used in many fields such as biosensing, drug development, and material preparation. Here, we demonstrate a click reaction that is responsive to shear force. To evaluate the efficiency of the click reaction under the shear force, we chose a fluorogenic Cu(I)-catalyzed azide–alkyne cycloaddition (CuAAC) (Fig. 3A).20 Upon cycloaddition, the product of this reaction emits green fluorescence, which will be recorded in our instrument for shear flow experiments.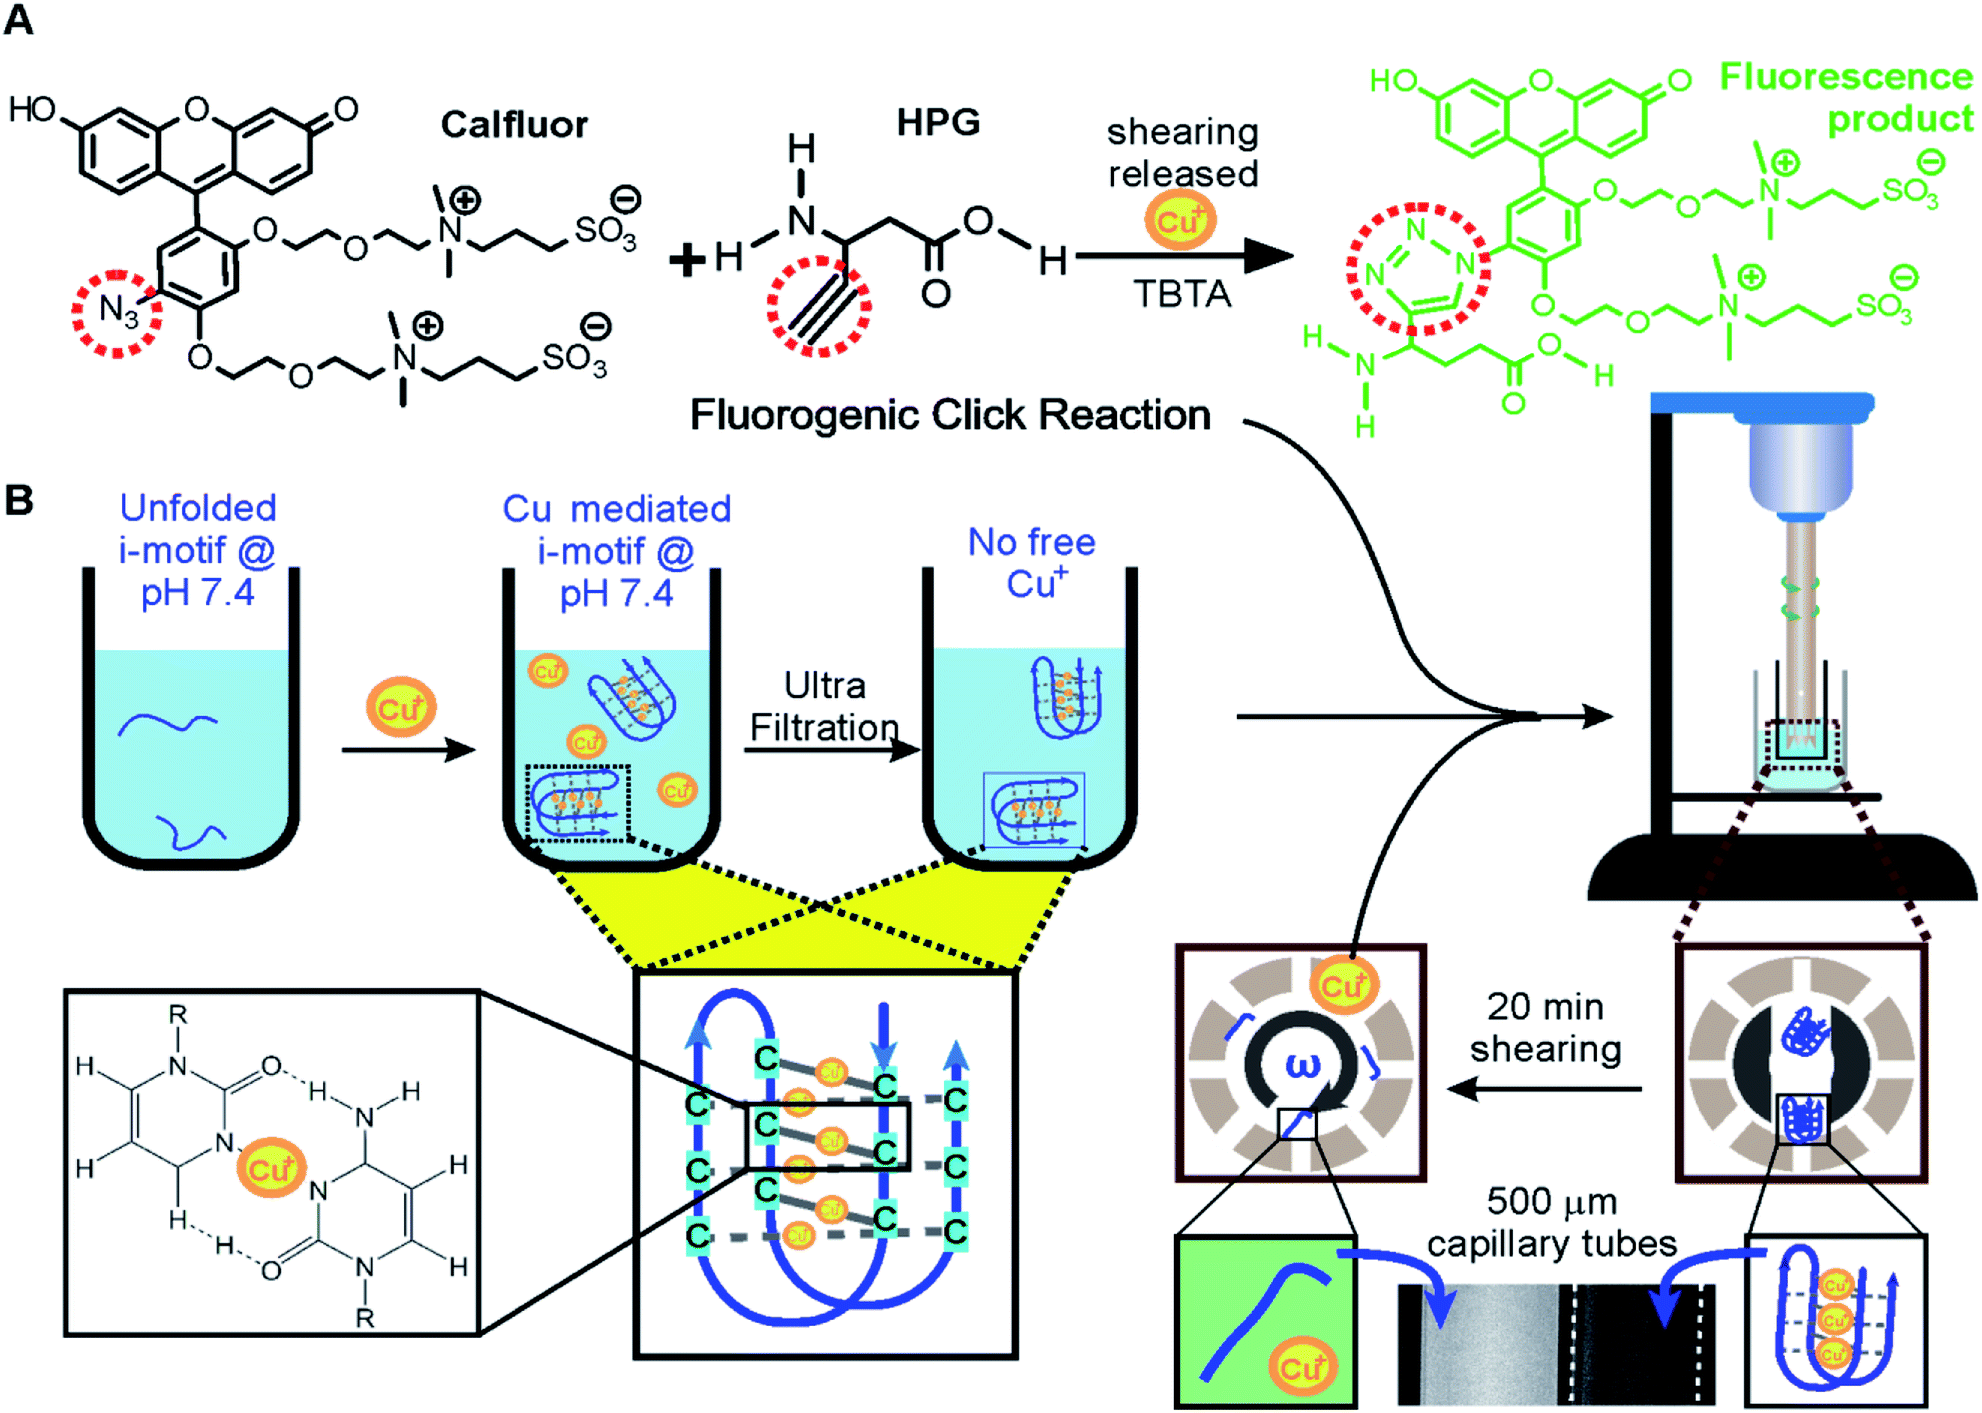 | ||
| Fig. 3 Mechano-click reactions. (A) A fluorogenic click reaction between Calfluor® and HPG (L-homopropargylglycine). The product of the click reaction emits green light. (B) The telomeric i-motif chelated with Cu+ at pH 7.4 was filtered to remove excess Cu+ in solution. The Cu+ chelated i-motif was unfolded by shear flow in the homogenizer. The released Cu+ catalyzed the fluorogenic Calfluor and HPG click reaction, which was observed in capillary tubes of 500 μm width (bottom). | ||
The same i-motif forming DNA, 5′-TAA(CCCTAA)4 (Oligo 3, Table S2†), was used as a carrier for the Cu(I) catalyst. At pH 7.4, it was found that the i-motif can fold due to the chelation of the Cu(I) ions to the cytosine: cytosine pairs (Fig. 3B),14 which was confirmed using CD signatures (Fig. S1†). Since this i-motif can be unfolded under the shear force (Fig. 1), we expected that chelated Cu(I) would be exposed to the solution to catalyze the fluorogenic CuAAC reaction. To test this hypothesis, we first mixed 10 μM i-motif forming sequence with 150 μM Cu(I) in 30 mM Tris buffer at pH 7.4 for 10 minutes. We used 300 μM ascorbic acid in each experiment to prevent the oxidation of Cu(I). An Amicon® filter (MWCO 3K) was then used to filter out any free Cu(I) to reduce the background click reaction catalyzed by these Cu(I) ions. A shear rate of 63209 s−1 was finally applied to the reaction mixture that contained two click reactants and TBTA21 (Fig. 3). This shear rate was chosen to ensure that the i-motif (mechanical stability ∼23 pN in Fig. 1F) can be readily unfolded mechanically by the shear flow (see Fig. 1G, 38 pN). As expected, we observed increased fluorescence after shearing, indicating that Cu(I) was indeed available for the click reaction due to the unfolding of the i-motif by shear force (Fig. 3B and 4A). In the control experiment, less than half the increase in fluorescence intensity was observed for a telomeric G-quadruplex forming DNA (4 G),22,23 5′-TTA(GGGTTA)4, or a structureless scrambled sequence (s4G), 5′-TGA GTG TGA GTG TGA GTG TGA GTG TAT (Fig. 4B), which firmly supported that it was the Cu(I) chelated i-motif that catalyzed the fluorogenic CuAAC reaction under the shear force. We anticipate that this mechano-click reaction can provide a unique modulation with reduced background for click chemistry. Since FRET pairs are no longer needed in the construct preparation, it also provides an affordable approach to investigate the mechanical effect on biomolecular structures.
 | ||
| Fig. 4 Shear force is determined by the molecular size in the shear flow. (A) Percentage increase of the fluorescence intensity of the click reaction shown in Fig. 3 increased over time at the 63209 s−1 shear rate. The 33 nt, 27 nt, and 21 nt depict the i-motif forming sequences with different lengths of flanking DNA (see the text for details). The control represents no DNA. Coloured curves represent the exponential fitting and the black line indicates the linear fit to guide the eye. R2 for red, green, blue, and black fits is 0.94, 0.89, 0.64, and 0.56, respectively. (B) Shearing of different sequences of DNA. The fluorescence intensities were recorded at the 20 min of respective actions. The 4G, s4G, and iM depict the G-quadruplex forming sequence (Oligo 9, Table S2†), scrambled sequence (Oligo 10), and the 27 nt i-motif forming sequence (Oligo 3), respectively. (C) Telomeric i-motif sequences vs. the fluorescence intensity of the click product at either 20 min shearing (*) or vortexing (#). Shear force, not the vortex force, triggered the fluorogenic click reactions. (D) Shear rate vs. percentage of increased fluorescence intensity for i-motif fragments with different lengths. Curves indicate the exponential fitting. The R2 for red, green, and blue curve fittings is 0.98, 0.99, and 0.95, respectively. (E) Optical tweezers experiments in which the unfolding force histogram (left) and cumulative unfolding percentage (right axis) are plotted for the 27 nt i-motif sequence in the presence of 150 μM Cu+ in 30 mM Tris buffer supplemented with 300 mM ascorbic acid and 100 mM KCl at pH 7.4. The unfolding force histogram and cumulative plot are fitted with Gaussian and sigmoidal functions, respectively. (F) Plot of the shear rate vs. shear force for the telomeric i-motif sequence with different lengths. All the lines depict linear fittings with R2 of 1.00, 0.98, and 0.78 for the red, green, and blue fittings, respectively. | ||
This affordable mechano-click reaction was subsequently used to elucidate the molecular size effect on the shear force (Fig. 4A, C, D and F). To vary the molecular size, we changed the length of the flanking sequence linked to the i-motif core (underlined), 5′-(TAA)m(CCC TTA)3CCC(TAA)n, where m = n = 0, 1, and 2 stand for the 21 nt, 27 nt, and 33 nt oligos, respectively; for the 24 nt DNA, m = 1 and n = 0. These DNA sequences were complexed with Cu(I), filtered with an Amicon® membrane (see above), and subjected to shear flow at a 63209 s−1 shear rate. The fluorogenic CuAAC reactions showed increased fluorescence intensity over time for all these i-motif constructs (Fig. 4A). Significantly, we found that the catalytic efficiency was increased with the length of the flanking sequence (Fig. 4A and C). This observation directly supported that the longer the flanking sequence, the higher the shear force experienced by the DNA construct. As a control, the filtered Cu(I)-chelated i-motif with different overhang lengths at pH 7.4 was subjected to random mechanical perturbation by vortexing for 20 min. Only 15%, 11%, and 17% fluorescence increases were observed (Fig. 4C) for the 24 nt, 27 nt, and 33 nt i-motif constructs, respectively, indicating that it was the stretching shear force, not the random vortexing force, that unfolded the i-motif. As expected, we also found that the efficiency of the CuAAC reactions increased with the shear rate (Fig. 4D). Finally, assuming all the i-motifs were unfolded at a 63209 s−1 shear rate for either the 27 nt or 33 nt i-motif construct, we estimated the percentage unfolding of the i-motif from the CuAAC click reaction and compared it with that obtained from the single-molecule unfolding in optical tweezers (Fig. 4E, see Fig. S8 and S9† for the F–X curves and ΔL histogram, respectively). The resultant shear force vs. shear rate calibration (Fig. 4F) confirmed the effect of the molecular size on the shear force: the longer the molecule, the higher the shear force.
Conclusions
In summary, we have successfully invented a shear flow based mechanical unfolding approach to investigate mechanical properties of an ensemble set of molecular structures. With this ensemble force spectroscopy method, we found that up to 50 pN force was generated on DNA i-motif structures. We demonstrated a new type of click reaction that can be actuated by shear forces. We confirmed that the shear force experienced by molecules increased with molecular size. This gave future directions to generate even higher forces after molecules are attached with elongated handles such as polymers or nanoparticles. We anticipate that such a shear flow method can transform single-molecule force spectroscopy, which is amenable to only a few molecules, into an ensemble force spectroscopy suitable for a large set of molecules in solution.Data availability
Raw images and data are included in ESI file. All the presented data can be provided upon resonable request.Author contributions
C. H., S. J., P. P., and D. K. performed the experiment. C. H., S. J., and H. M. wrote the manuscript. H. M. supervised the study.Conflicts of interest
There are no conflicts to declare.Acknowledgements
This research work was supported by the National Science Foundation [CBET-1904921] and the National Institutes of Health [NIH R01CA236350] to H. M.Notes and references
- M. T. Woodside, W. M. Behnke-Parks, K. Larizadeh, K. Travers, D. Herschlag and S. M. Block, Proc. Natl. Acad. Sci. U. S. A., 2006, 103, 6190–6195 CrossRef CAS PubMed.
- I. Vilfan, J. Lipfert, D. Koster, S. Lemay and N. Dekker, in Handbook of Single-Molecule Biophysics, ed. P. Hinterdorfer and A. Oijen, Springer US, 2009, ch. 13, pp. 371–395 Search PubMed.
- M. Grandbois, M. Beyer, M. Rief, H. Clausen-Schaumann and H. E. Gaub, Science, 1999, 283, 1727–1730 CrossRef CAS PubMed.
- T. Strick, J.-F. Allemand, D. Bensimon and V. Croquette, Biophys. J., 1998, 74, 2016–2028 CrossRef CAS PubMed.
- K. Halvorsen and W. P. Wong, Biophys. J., 2010, 98, L53–L55 CrossRef CAS PubMed.
- D. Yang, A. Ward, K. Halvorsen and W. P. Wong, Nat. Commun., 2016, 7, 11026 CrossRef CAS PubMed.
- H. Su, Z. Liu, Y. Liu, V. P.-Y. Ma, A. Blanchard, J. Zhao, K. Galior, R. B. Dyer and K. Salaita, Nano Lett., 2018, 18, 2630–2636 CrossRef CAS PubMed.
- M. W. H. Kirkness and N. R. Forde, Biophys. J., 2018, 114, 570–576 CrossRef CAS PubMed.
- J. Gorman and E. C. Greene, Nat. Struct. Mol. Biol., 2008, 15, 768–774 CrossRef CAS PubMed.
- P. C. Nickels, B. Wünsch, P. Holzmeister, W. Bae, L. M. Kneer, D. Grohmann, P. Tinnefeld and T. Liedl, Science, 2016, 354, 305 CrossRef CAS PubMed.
- I. B. Bekard, P. Asimakis, J. Bertolini and D. E. Dunstan, Biopolymers, 2011, 95, 733–745 CAS.
- K. Gehring, J. L. Leroy and M. Guéron, Nature, 1993, 363, 561–564 CrossRef CAS PubMed.
- S. Sedghi Masoud, Y. Yamaoki, Y. Ma, A. Marchand, F. R. Winnerdy, V. Gabelica, A. T. Phan, M. Katahira and K. Nagasawa, ChemBioChem, 2018, 19, 2268–2272 CrossRef CAS PubMed.
- M. A. Abdelhamid, L. Fábián, C. J. MacDonald, M. R. Cheesman, A. J. Gates and Z. A. Waller, Nucleic Acids Res., 2018, 46, 5886–5893 CrossRef CAS PubMed.
- S. Dhakal, J. D. Schonhoft, D. Koirala, Z. Yu, S. Basu and H. Mao, J. Am. Chem. Soc., 2010, 132, 8991–8997 CrossRef CAS PubMed.
- Y. Cui, D. Kong, C. Ghimire, C. Xu and H. Mao, Biochemistry, 2016, 55, 2291–2299 CrossRef CAS PubMed.
- D. Koirala, S. Dhakal, B. Ashbridge, Y. Sannohe, R. Rodriguez, H. Sugiyama, S. Balasubramanian and H. Mao, Nat. Chem., 2011, 3, 782–787 CrossRef CAS PubMed.
- D. Voet and J. G. Voet, Biochemistry, John Wiley and Sons, Inc., New York, 2nd edn, 1995 Search PubMed.
- H. C. Kolb, M. G. Finn and K. B. Sharpless, Angew. Chem., Int. Ed. Engl., 2001, 40, 2004–2021 CrossRef CAS PubMed.
- P. Shieh, V. T. Dien, B. J. Beahm, J. M. Castellano, T. Wyss-Coray and C. R. Bertozzi, J. Am. Chem. Soc., 2015, 137, 7145–7151 CrossRef CAS PubMed.
- T. R. Chan, R. Hilgraf, K. B. Sharpless and V. V. Fokin, Org. Lett., 2004, 6, 2853–2855 CrossRef CAS PubMed.
- Z. Yu, J. D. Schonhoft, S. Dhakal, R. Bajracharya, R. Hegde, S. Basu and H. Mao, J. Am. Chem. Soc., 2009, 131, 1876–1882 CrossRef CAS PubMed.
- F. F. W. J. Smith, Nature, 1992, 356, 164–168 CrossRef CAS PubMed.
Footnotes |
| † Electronic supplementary information (ESI) available. See DOI: 10.1039/d1sc02257a |
| ‡ These authors contributed equally to this work. |
| This journal is © The Royal Society of Chemistry 2021 |