
 Open Access Article
 This Open Access Article is licensed under a Creative Commons Attribution-Non Commercial 3.0 Unported Licence
Phosphorescent [3 + 2 + 1] coordinated Ir(III) cyano complexes for achieving efficient phosphors and their application in OLED devices†
Yuan Wu‡
a,
Chen Yang‡ *ab,
Jie Liuc,
Meng Zhangd,
Weiqiang Liue,
Wansi Lid,
Chengcheng Wua,
Gang Cheng*ef,
Qingdan Yang*b,
Guodan Wei*d and
Chi-Ming Cheef
*ab,
Jie Liuc,
Meng Zhangd,
Weiqiang Liue,
Wansi Lid,
Chengcheng Wua,
Gang Cheng*ef,
Qingdan Yang*b,
Guodan Wei*d and
Chi-Ming Cheef
aPURI Materials, 6F, Block A, Jiazhaoye Xindong Kechuang Park, 71st Zone Xindong, Baoan District, Shenzhen, 518133, China. E-mail: david_yang@purimat.com
bSchool of Chemical Engineering and Light Industry, Guangdong University of Technology, Guangzhou, 510006, China. E-mail: qdyang@gdut.edu.cn
cState Key Laboratory for Mechanical Behavior of Materials, Xi'an Jiaotong University, Xi'an, 710049, China
dTsinghua-Berkeley Shenzhen Institute (TBSI), Tsinghua Shenzhen International Graduate School, Tsinghua University, Shenzhen, 518055, China. E-mail: weiguodan@sz.tsinghua.edu.cn
eState Key Laboratory of Synthetic Chemistry, HKU-CAS Joint Laboratory on New Materials, Department of Chemistry, The University of Hong Kong, Pokfulam Road, Hong Kong SAR, China. E-mail: ggcheng@hku.hk
fHKU Shenzhen Institute of Research and Innovation, Shenzhen 518053, China
First published on 22nd June 2021
Abstract
A series of neutral [3 + 2 + 1] coordinated iridium complexes bearing tridentate bis-NHC carbene chelates (2,6-bisimidazolylidene benzene), bidentate chelates (C^N ligands, e.g. derivatives of 2-phenylpridine), and monodentate ions (halides and pseudo-halides, such as Br, I, OCN and CN ions) have been systematically designed and synthesized. X-ray single crystal structure characterization revealed that the nitrogen atom in C^N ligands is located trans to the carbon atom in the benzene ring in tridentate chelates, while the coordinating carbon atom in C^N ligands is located trans to the monodentate ligands. Photophysical studies reveal that the C^N ligands play a vital role in tuning the UV absorption and emission properties, while the tridentate bis-NHC carbene chelates influence the lowest absorption band and emission energy when compared to heteroleptic Ir(ppy)2(acac) [i.e. molar absorptivities at ∼450 nm for ppy-OCN and Ir(ppy)2(acac) are 350 M−1 cm−1 and 1520 M−1 cm−1 and emission maximum peaks are at 465 nm and 515 nm respectively]. Among monodentate ligands that the complexes bear, the group containing the cyanide ligand displays higher emission energy, higher photophysical quantum yields, longer triplet lifetimes and better electrochemical and thermal stabilities than those of cyanate and bromide. Particularly, a blue organic light-emitting diode (OLED) based on dfppy-CN exhibited a maximum external quantum efficiency of 22.94% with CIE coordinates of (0.14, 0.24). Furthermore, a small efficiency roll-off of 5.7% was observed for this device at 1000 cd m−2.
Introduction
Phosphorescent OLEDs (PhOLEDs), one of the most critical technologies in commercial OLED displays, have many performance advantages over traditional fluorescent OLEDs. For example, PhOLEDs can reach 100% utilization of its quantum efficiency (QE) whereas that of fluorescent OLEDs can only achieve about 25%.1–3 Commercial PhOLEDs, especially those employing cyclometalated iridium complexes as emitters, can be commonly found in red, yellow and green colors; achieving efficient deep blue phosphorescent emitters remains a great challenge due to limiting factors such as their poor lifetime (less than one tenth that of blue fluorescent OLEDs4) and the great y value of Commission International de L'Eclairage (CIE) coordinates. Although many approaches have been applied to improve the efficiency of PhOLEDs, such as developing an appropriater host to balance hole and electron combination to confine subsequent exciton generation and light out-coupling techniques in device construction to improve light efficiency,5–8 the finding of a satisfactory deep blue emitter is still in great demand. FIrpic,9 a notable phosphorescent blue emitter, was firstly reported to be used to fabricate PhOLED devices, which displayed emission with a peak maximum at 475 nm. However, its CIE coordinates of (0.16, 0.29) showed a sky blue color, instead of pure blue. Subsequently, Chou et al. reported a pure-blue PhOLED10 with CIE coordinates of (0.15, 0.11) and a maximum external quantum efficiency (ηext) of 11.9% by employing Ir(fppz)2(bdp) as the emitter, which bears a nonconjugated, high ligand-field strength benzyl phosphine chelate ligand. In 2016, Forrest and Thompson reported a stable deep-blue phosphorescent iridium complex fac-Ir(pmp)3 for achieving the most deep-blue PhOLED11 device so far with a ηext of 10.1% and CIE coordinates of (0.16, 0.09), which meets the requirements of the National Television System Committee (NTSC) for stringent blue. Currently, the most efficient deep blue PhOLED12 with a ηext of 31.9% and CIE coordinates of (0.14, 0.19) had been fabricated by employing deep-blue phosphorescent (dfpysipy)2Ir(mic).Most of the neutral iridium complexes for the fabrication of PhOLEDs are with a configuration of one iridium metal center, and three homoleptic/heteroleptic bidentate ligands, noted as [2 + 2 + 2] coordinated type. The classic [2 + 2 + 2] phosphors in the application of PhOLEDs are FIrpic,9,13–15fac-Ir(ppy)3 (ref. 16 and 17) and Ir(piq)2(acac).18 Additionally, a configuration of one iridium metal center and two heteroleptic tridentate chelates for a series of neutral [3 + 3] coordinated iridium complexes had been reported by Chi et al.19–23 These [3 + 3] iridium complexes have shown their advantages in rigidity and durability in application. An isoquniolinyl-functionalized red emitter (pzPhpyBphB)Ir(pziqph),20 with a unity PLQY, had been fabricated as a red PhOLED, giving a max. ηext of 28.17% and CIE coordinates of (0.63, 0.37). Subsequently, a carbazolyl-functionalized emitter Cz-5,23 with a high photoluminescent quantum yield (PLQY ∼ 96.2%), had been fabricated as a blue PhOLED, displaying a good performance with a max. ηext of 18.7% and CIE coordinates of (0.145, 0.218). To date, neutral iridium complexes with a configuration of [3 + 2 + 1] coordination have been reported to commonly have monoanionic N^C^N or C^N^N pincer chelates, where N stands for nitrogen atoms in pyridinyl,24–27 benzimidazoyl,28,29 pyrazolyl,30 and benzothiazolyl or benzoxazoyl31 ligands. However, a few of these complexes in form of [(N^C^N)Ir(C^N)Cl] which have been fabricated as PhOLEDs25 face problems, such as the degradation of halide ligands from Ir atoms,30 and the emission origin competition between tridentate and bidentate chelates25 in the complexes. On the other hand, most of these complexes show emission covering from the green to red region, and still suffered from blue chromaticity.
Herein, to address these shortcomings, intrinsic ligand design and adjustments should be considered for fulfilling the criterion of new emitters. For example, significant endeavors have been made to achieve stable high quantum efficiency blue phosphors from archetypal green emitters, fac-Ir(ppy)3,32 using strategies such as: (i) stabilizing the highest occupied molecular orbital (HOMO) by the addition of electron-withdrawing groups on the phenyl rings,33 (ii) destabilizing the lowest unoccupied molecular obital (LUMO) by the replacement of azolyl rings with the pyridyl ring. Principally, the energy difference between an excited triplet state and a metal-centered (3MC) dd state would determine the quantum efficiency (QE) of an emitter. However, for a triplet blue emitter, the energy difference for the above states is quite small; the triplet metal-centered (3MC) dd state can be populated at ambient temperature, leading to geometrical distortion, even a bond dissociation and/or the degradation of an excited molecule.34 To avoid the population of 3MC dd states, some strategies have been implemented, such as using strong-field ligands to create strong metal–ligand bonds,35 increasing rigidity of the coordinated ligand to prevent distortions in the excited state.22,36
N-Heterocyclic carbenes (NHC),35–42 featuring strong σ-donating and weak π-accepting properties,43 are regarded as an excellent candidate to destabilize the empty dσ orbital (major participation in the 3MC state) as well as to stabilize the filled dπ orbital (an important role in the emissive state, especially for the 3MLCT state), thus alleviating the promotion of an electron into the 3MC dd state. The utilization of ligands containing NHC ligands in transition metal complexes had been documented and regarded as an effective strategy to enhance the phosphorescence of triplet emitters.44 However, [3 + 2 + 1] iridium complexes containing tridentate ligands which bear bis(NHC) ligands are yet to be investigated. Wong et al. reported a class of [3 + 2 + 1] iridium complexes45 containing tridentate bis(NHC) ligands, wherein bipyridine served as the bidentate ligand and hydride as the monodentate ligand. As a result, these complexes are inherently salts, leading a hurdle in utilization through evaporated process into fabrication as PhOLEDs. Similar to the NHC carbene ligand, a cyanide ion,46 featuring strong σ-donating and unoccupied weak π-accepting orbitals, could promote the energy level of 3MC states and accept the electron pair in the filled dπ orbital from the metal. In contrast, the cyanide ion offers a negative charge, which shows affinity toward the positive iridium metal center, thus leading to a more stable bond. However, there is still a shortage of its application in current literature studies47,48 with the purpose of tuning the emission color in Ir(III) cyano complexes.
To date, bidentate cyclometalated ligands, 2-phenylpyridine as the prototypal structure, have played an extraordinary important role in tuning the emission colors in phosphorescent iridium complexes. With an aim to build a novel type of neutral iridium complex, a series of [3 + 2 + 1] coordinated iridium complexes had been designed and developed herein by using the strategy of combining the advantages of tridentate bis(NHC) ligands and bidentate cyclometalated ligands. This class of emitters display emission covering the whole visible light region, including blue, yellow, orange, and red emitters with the CIE coordinates ranging from 0.1 to 0.6. And most of these blue emitters display quantum yields greater than 50% and summary of CIEx+y below 0.3, which satisfied our criteria as good blue emitters.
Results and discussion
Synthesis
The synthetic route for the [3 + 2 + 1] coordinated iridium complexes are depicted in Chart 1. [3 + 2 + 1] coordinated Ir(III) halide complexes were synthesized from a two-step reaction. The first step was to combine the tridentate C^C^C ligand and an iridium precursor [Ir(μ-Cl)(COD)]2 (COD = 1,5-cyclooctadiene) in the presence of triethylamine (NEt3) in acetonitrile (CH3CN) solution and the mixture was refluxed under a nitrogen atmosphere at 90 °C for 8 hours. After that, the volatiles were removed under vacuum leaving an orange residue. The next step, without further isolation, the residue was treated with the bidentate C^N or C^C ligands in propionic acid or EtOCH2CH2OH solution at 150 °C (N2 atmosphere) to give the Ir(III)–Br or the Ir(III)–I complexes. The Ir(III)–CN or Ir(III)–OCN complexes were obtained by metathesizing the Ir(III)–Br or Ir(III)–I complexes with AgCN or AgOCN in DMF at 90 °C, respectively. The desired Ir(III) complexes were purified by column chromatography and characterized by nuclear magnetic resonance (NMR) and mass spectrometry. | ||
| Chart 1 Synthesis of [3 + 2 + 1] iridium complexes. [Reagents and conditions: (i) [Ir(cod)Cl]2 (0.5 eq.), NEt3 0.5–1 mL, MeCN 10 mL, 90 °C; (ii) CH^X ligands (1 eq.), solvents (X = N, propionic acid; X = CH, 2-ethoxylethanol, triethylamine as the base), 150 °C. (iii) 1, AgCN or AgOCN (2 eq., Celite), DMF, 2 h. N2 atmosphere for all steps], and structures of complexes. | ||
Crystallography
The crystal of thpy-Br was grown by steadily cooling down the hot dimethyl sulfoxide solution of the complex to room temperature; the crystal of TaBt-CN was grown by slow evaporation of dichloromethane (CH2Cl2) solution of the complex into hexane and the crystal of dfppy-OCN was grown by slow diffusion of diethyl ether into acetonitrile solution of the complex. The molecular structures of these complexes were examined by single-crystal X-ray crystallography.The structures are depicted in Fig. 1, and the crystallographic data, selected bond distances and angles are summarized in Table S1 and S2, respectively, see the ESI.† They all adopt a distorted octahedral coordination geometry around the iridium atom with one tridentate C^C^C ligand, one bidentate C^N ligand and a monodentate ligand (–Br, –CN or –OCN). The CNHC–Ir bond distances and the related CNHC–Ir–CNHC bite angles of thpy-Br, TaBt-CN, dfppy-OCN are in the range of 2.04–2.06 Å and 154.8–156.0° respectively, in consistent with those observed in Ir(III) complexes featuring similar pincer chelates. The N atom in the C^N ligand is located at the trans position of the CPh atom of the C^C^C ligand with a N–Ir–C angle of 173.7(3)° (thpy-Br), 172.07(19)° (TaBt-CN) and 173.07(18)° (dfppy-OCN), respectively. The N–Ir–C angles in the five-membered chelated ring based on the C^N ligand are 77.95(19)°, 78.87(18)° and 77.95(19)° in thpy-Br, TaBt-CN and dfppy-OCN, respectively. The bond length of Ir–Br is 2.6029(9) Å for thpy-Br and those of Ir–CCN and Ir–OOCN are 2.024(6) Å for TaBt-CN and 2.143(5) Å for dfppy-OCN respectively.
 | ||
| Fig. 1 ORTEP diagram of thpy-Br, TaBt-CN and dfppy-OCN showing the labeling scheme of the atoms. Ellipsoids are at the 50% probability level, and hydrogen atoms and solvent molecules were omitted for clarity. | ||
Photophysical studies
Absorption and phosphorescent emission spectra of all the Ir(III) complexes were recorded in degassed CH2Cl2 solution and a thin polymethylmethacrylate (PMMA) polymer film (2 wt% of Ir(III) complexes) at ambient temperature, and are shown in Fig. 2 and S1, S2 (ESI†). The photophysical data are tabulated in Table 1 and phosphorescent solid-state emission spectra at ambient temperature and low temperature (77 K) are shown in Fig. S3–S5 (ESI†). As expected, the high-energy absorption bands below 330 nm (ε > 1 × 10⁴ M−1 cm−1) were assigned to the ligand-centered (ππ*) transitions. The moderately intense absorption at a longer wavelength of 330–400 nm (3 × 10³ < ε < 1 × 10⁴ M−1 cm−1) is assigned to a mixed transition that contains both spin-allowed singlet metal-to-ligand charge transfer (1MLCT) and singlet ligand-centered/ligand-to-ligand charge transfer (1LC/1LLCT) transitions. As shown in Fig. 1a, the absorption bands for ppy-Br, ppy-OCN and ppy-CN (ppy group) beyond 400 nm (ε < 2 × 10³ M−1 cm−1) display very different characteristics from those of (ppy)2Ir(acac), indicating weak triplet metal-to-ligand charge transfer (3MLCT) transitions in these absorption bands for this group. On the other hand, the cyanide ligand in ppy-CN leads to more hypsochromic shift in the ppy group of Ir(III) complexes, resulting in a very weak 3MLCT characteristic absorption tail beyond 450 nm. This trend for the lowest absorption bands [λ(CN) < λ(Br) ∼ λ(OCN)] is commonly found in all the groups of Ir(III) complexes installing the same C^N ligands. Further modification by using difluorinated ppy ligands (dfppy and dfpypy ligands) and C^C type ligands (tmpi and pmp ligands) leads to hypsochromic shifts with the lowest absorption band order of λ(tmpi) < λ(pmp) < λ(dfpypy) < λ(dfppy) in Fig. 1b. Bathochromic shifts [λ(thpy) < λ(lpt) < λ(piq) < λ(TaBt)] are found for the lowest absorption bands for those C^N ligands with extending π-conjugations, assigned to the mixing of spin-forbidden 3MLCT and 3LC/3LLCT transitions. | ||
| Fig. 2 (a–c) UV-vis molar absorptivity and (d–f) emission of iridium complexes in CH2Cl2 (conc.: ∼2.0 × 10⁻⁵ M). | ||
| UV-Vis absorption | Emission | |||||
|---|---|---|---|---|---|---|
| Fluida | Fluida | Filmb | Colora | |||
| λmax/nm (ε × 103/M−1 cm−1) | λmax/nm (Φ; τ/μs) | CIE(x, y) | λmax/nm (Φ; τ/μs) | CIE(x, y) | ||
| a Data were recorded in a degassed CH2Cl2 solution (concentration of ∼2 × 10⁻⁵ M). b Data were recorded in thin-films (2 wt% in PMMA) at room temperature. c N.A. and N. D. stand for not available and not detected. | ||||||
| tmpi-I | 250 (24.95), 300 (10.65) | 397, 418 (N.A.c; 0.91) | (0.157, 0.052) | 397, 418 (N.D.c; 4.72) | (0.195, 0.184) |  |
| tmpi-CN | 270 (11.5), 300 (10.9), 315 (8.4), 350 (0.69) | 386, 408 (0.14; 1.73) | (0.157, 0.039) | 385, 407 (0.56; 7.6) | (0.157, 0.044) |  |
| pmp-I | 250 (25.85), 313 (20.5), 359 (4.0) | 444 (0.10; 0.72) | (0.154, 0.116) | 420 (0.06; 0.90) | (0.158, 0.070) |  |
| pmp-CN | 311 (26.1), 331 (13.8), 359 (2.66) | 410 (0.20; 0.87) | (0.157, 0.037) | 398 (0.56; 3.85) | (0.160, 0.049) |  |
| dfpypy-Br | 271.67 (15.6), 322.55 (9.35), 384.15 (1.25) | 480 (0.12; 0.34) | (0.176, 0.313) | 480 (0.69; 2.36) | (0.167, 0.288) |  |
| dfpypy-CN | 265 (29.4), 292 (18.2), 304 (16.6), 316 (15.9), 339 (5.84), 363 (3.24), 423 (0.51) | 436 (0.81; 5.76), 458 | (0.146, 0.114) | 436, 456 (0.78; 4.89) | (0.149, 0.109) |  |
| dfppy-Br | 273 (21.0), 296 (12.9), 326 (12.8), 361 (4.4), 384 (2.95), 444 (0.35) | 463 (0.015; 0.16), 480 | (0.144, 0.217) | 462 (0.55; 1.47), 481 | (0.145, 0.252) |  |
| dfppy-CN | 269 (20.4), 297 (13.2), 317 (12.3), 344 (4.97), 368 (3.37), 409 (0.29) | 441 (0.67; 4.86), 468 | (0.144, 0.138) | 440 (0.86; 4.51), 466 | (0.145, 0.127) |  |
| dfppy-OCN | 271 (19.0), 292 (13.0), 326 (12.8), 363 (3.52), 388 (2.22), 444 (0.3) | 465 (0.58; 1.78), 481 | (0.141, 0.244) | 463 (0.80; 1.74), 482 | (0.142, 0.230) |  |
| ppy-Br | 274 (21.2), 298 (13.1), 330 (12.6), 372 (4.5); 393 (3.19), 450 (0.25) | 473 (0.045; 0.22), 502 | (0.152, 0.286) | 474 (0.69; 1.9), 501 | (0.156, 0.379) |  |
| ppy-CN | 273 (24.8), 304 (17.6), 318 (15.6), 356 (6.75), 377 (5.04); 423 (0.69) | 454 (0.74; 6.55), 485, 511 | (0.145, 0.225) | 453 (0.77; 5.30), 484, 515 | (0.145, 0.212) |  |
| ppy-OCN | 274 (18.7), 297 (12.7), 329 (12.6), 372 (4.02), 394 (2.93), 463 (0.35) | 475 (0.58; 1.79), 499 | (0.153, 0.384) | 475 (0.91; 1.65), 501 | (0.151, 0.368) |  |
| FIrpic | 284 (27.0), 318 (14.2), 340 (7.89), 380 (5.54), 416 (2.89), 456 (0.56) | 466 (0.69; 1.82), 493 | (0.144, 0.286) | 466 (0.88; 1.67), | (0.141, 0.277) |  |
| (ppy)2Ir(acac) | 260 (37.0), 305 (16.4), 342 (8.39), 364 (5.99), 405 (2.49), 454 (1.52), 493 (0.46) | 515 (N.D.c; 0.73) | (0.325, 0.622) | 516 (N.D.c; 1.96) | (0.312, 0.624) |  |
| thpy-Br | 277 (13.0), 306 (17.9), 327 (15.3), 374 (5.61), 399 (4.3), 421 (3.03), 455 (0.19) | 527 (0.69; 16.4), 546, 569, 617 | (0.383, 0.600) | 528 (0.69; 11.9), 547, 570, 617 | (0.382, 0.597) |  |
| thpy-CN | 284 (14.8), 303 (17.5), 316 (16.1), 364 (6.0), 379 (5.3), 429 (0.32) | 517 (0.6; 34.3), 535, 556, 578, 600 | (0.353, 0.614) | 516 (0.60; 29.0), 534, 556, 602 | (0.352, 0.611) |  |
| thpy-OCN | 310 (21.1), 326 (19.1), 374 (6.5), 400 (4.6), 421 (3.45), 455 (0.48) | 528 (0.54; 16.1), 547, 569, 594, 618 | (0.384, 0.599) | 528 (0.63; 13.7), 546, 569, 617 | (0.377, 0.589) |  |
| lpt-Br | 288 (25.1), 331 (21.9), 399 (7.27), 434 (7.88), 474 (2.18) | 558 (0.75; 6.67), 601, 657 | (0.493, 0.504) | 560 (0.77; 5.64), 603, 658 | (0.496, 0.501) |  |
| lpt-CN | 291 (25.7), 318 (23.0), 392 (9.17), 416 (10.3), 474 (0.32) | 545 (0.78; 16.0), 588, 638 | (0.449, 0.546) | 547 (0.71; 13.2), 591, 642 | (0.443, 0.550) |  |
| piq-Br | 297 (22.7), 332 (18.2), 329 (18.5), 348 (12.8), 378 (7.2), 452 (3.62), 532 (0.40) | 581 (0.60; 4.46), 617 | (0.571, 0.428) | 581 (0.65; 3.3), 618 | (0.561, 0.434) |  |
| piq-CN | 295 (23.5), 318 (16.5), 332 (11.4), 348 (10.3), 379 (7.0), 431 (4.9), 532 (0.40) | 568 (0.49; 11.2), 602 | (0.534, 0.464) | 563 (0.58; 8.95), 600 | (0.523, 0.475) |  |
| piq-OCN | 295 (22.7), 318 (18.2), 329 (18.5), 348 (12.8), 379 (7.2), 450 (3.66), 505 (0.47) | 580 (0.62; 3.9), 614, 671 | (0.566, 0.433) | 582 (0.66; 2.93), 617 | (0.567, 0.432) |  |
| TaBt-Br | 308 (15.0), 328 (19.4), 343 (20.4), 368 (7.8), 398 (7.5), 416 (8.8), 468 (5.53) | 607 (0.27; 7.42), 663, 730 | (0.660, 0.340) | 607 (0.31; 6.08), 663, 728 | (0.657, 0.343) |  |
| TaBt-CN | 308 (14.4), 324 (17.8), 340 (20.1), 360 (12.4), 387 (11.5), 406 (13.6), 440 (7.5) | 591 (0.32; 18.5), 644, 706 | (0.617, 0.382) | 591 (0.37; 12.6), 644, 705 | (0.615, 0.384) |  |
| TaBt-OCN | 328 (31.0), 343 (30.8), 371 (10.6), 400 (10.6), 418 (13.1), 447 (7.84), 468 (8.53) | 609 (0.31; 8.48), 665, 730 | (0.661, 0.339) | 607 (0.34; 6.17), 664, 727 | (0.655, 0.345) |  |
All the Ir(III) complexes feature structured emission profiles with peaks at 386–609 nm in a degassed CH2Cl2 solution (Fig. 2d–f and S1 and S2 in the ESI†). It is interesting to note that the emission color can be easily tuned from the UV to red region through the substitution of different bidentate ligands. All the Ir(III) complexes exhibit the luminescent characteristics of their bidentate ligands including cyclometalated C^N and NHC C^C types. As shown in Fig. 2d, the ppy group of iridium complexes displays distinct structured emission profiles while (ppy)2Ir(acac) shows a structureless emission band which originated from 3MLCT transitions, indicating that the emission for the ppy group majorly comes from 3LC/3LLCT transitions. Additionally, significant hypsochromic shifts as well as greater structured-profiles are observed for the emission peaks of ppy-CN compared to those of ppy-Br and ppy-OCN, revealing greater 3LC/3LLCT characteristics in the triplet excited states in line with the less 3MLCT transitions for ppy-CN from the observations in their UV-vis absorption spectra.
The emission spectra of Ir(III) cyano (Ir(III)–CN) complexes are depicted in Fig. 2e and f. Because the strong ligand field of NHC could widen the energy gap by elevating the LUMO levels, tmpi-CN and pmp-CN complexes display ultraviolet and deep-blue emission (λ = 386 and 410 nm, Fig. 2e). For those Ir(III)–CN complexes with functionalized C^N ligands, benefiting from electron-withdrawing fluorine groups on the C-chelating block which lower its HOMO level, the emission peak is blue-shifted from 454 nm of ppy-CN to 440 nm of dfppy-CN. Further replacing the phenyl ring with a fluorinated pyridine ring results in a more hypsochromic shift of the maximum emission for dfpypy-CN (436 nm). Upon the substitution of pyridine with isoquinoline that possesses a more extended conjugation, piq-CN (568 nm) shows a significant bathochromic emission relative to ppy-CN. The complexes thpy-CN (517 nm), and lpt-CN (545 nm) bearing an electron-donating thiophene group as the C-chelating block also show red-shift emission relative to ppy-CN. For the C^N ligands with a benzothiazole ligand as the N-chelating block and benzothiophene ligand as the C-chelating block, complex TaBt-CN exhibits the lowest red emission at 591 nm.
The influence of variation of the monodentate ligand (–Br, –OCN or –CN) of Ir(III) complexes composed of the same tridentate and bidentate ligands had also been investigated. The emission spectra of Ir(III)–Br and Ir(III)–OCN complexes are superimposed, while Ir(III)–CN complexes exhibit a ca. 10–30 nm blue-shift. Such significant influence of the cyanide ligand can be rationalized by its strong electron-withdrawing effect, which leads to the lowering of the HOMO energy and results in a blue-shifted emission.
It is worth noting that all the Ir(III)–CN complexes exhibit a blue-shift as compared to the corresponding well-known [2 + 2 + 2] coordinated homo/heteroleptic Ir(III) complexes bearing the same bidentate ligands: tmpi-CN (386 nm, Φ = 0.56) vs.mer-Ir(tmpi)3 (412 nm, Φ= 0.72),49pmp-CN (410 nm, Φ = 0.56) vs.fac-Ir(pmp)3 (418 nm, Φ = 0.76),11dfpypy-CN (436 nm, Φ = 0.81) vs.fac-Ir(dfpypy)3 (438 nm, Φ = 0.43),50ppy-CN (454 nm, Φ = 0.74) vs.fac-Ir(ppy)3 (514 nm, Φ = 0.40),51dfppy-CN (441 nm, Φ = 0.67) vs.fac-Ir(dfppy)3 (468 nm, Φ = 0.43)51 and FIrpic (469 nm, Φ = 0.60),52thpy-CN (517 nm, Φ = 0.60) vs.fac-Ir(thpy)3 (550 nm, Φ = 0.50),53piq-CN (568 nm, Φ = 0.49) vs.fac-Ir(piq)3 (620 nm, Φ = 0.66),53TaBt-CN (591 nm, Φ = 0.32) vs.Ir(TaBt)2(acac) (650 nm).54
The solid-state emission properties at RT and 77 K, in DMF/MeOH/EtOH (1![[thin space (1/6-em)]](https://www.rsc.org/images/entities/char_2009.gif) :1:4, v/v/v) glassy solutions at 77 K (see Fig. S1–S5 in ESI†) and in 2 wt% doped PMMA thin films at RT were also examined (Table 1). Moreover, good accordance between the excitation spectrum and absorption spectrum of each iridium complex indicates that the emission arises from the complex purely. Absolute photoluminescence quantum yields (PLQYs) were also measured for all the Ir(III) complexes. In CH2Cl2 solutions, blue emitting Ir(III)–CN complexes (436–454 nm dfpypy-CN, dfppy-CN, and ppy-CN) exhibit high PLQYs in the range of 68–84%. It should be mentioned that the PLQY of dfpypy-CN (80%) is one of the highest quantum yields (Φ) reported for deep-blue phosphors. Complexes tmpi-CN and pmp-CN display relatively lower PLQY (14% and 20%) in CH2Cl2 solutions, while much higher PLQYs have been achieved in PMMA films (both are 56%). And it is majorly attributed to the less perturbation on the triplet excited molecule from the surroundings in a rigid matrix (PMMA) than in solutions. The green and yellow phosphors (thpy-CN (517 nm) and lpt-CN (545 nm)) exhibit moderate PLQYs of 60–78%. However, the PLQYs of orange and red phosphors are in a range of 32–49% owing to the fast nonradiative decay rate at a long wavelength (energy gap law).55,56 Compared with the counterpart Ir(III)–CN complexes, all Ir(III)–OCN and a few Ir(III)–Br complexes (thpy-Br and piq-Br) exhibit comparable PLQYs. Nevertheless, the Ir(III)–Br counterparts with blue emission show very low PLQYs (1.4% for dfppy-Br and 4% for ppy-Br) and such behaviors are probably attributed to the instability of the Ir–Br bond for molecules in high triplet energy. Ultraviolet and deep-blue emitters tmpi-CN and pmp-CN with NHC moieties exhibit short emission lifetimes (1.73 and 0.87 μs). The emission lifetimes of blue emitting Ir(III)–CN complexes are in the range of 3.48–7.39 μs. Furthermore, other Ir(III)–CN complexes with lower energy emission display much longer lifetimes (11.2–36.65 μs). It is worth noting that the emission lifetimes of these Ir(III) complexes bearing different monodentate ligands decrease in the order of Ir(III)–CN > Ir(III)–OCN > Ir(III)–Br.
:1:4, v/v/v) glassy solutions at 77 K (see Fig. S1–S5 in ESI†) and in 2 wt% doped PMMA thin films at RT were also examined (Table 1). Moreover, good accordance between the excitation spectrum and absorption spectrum of each iridium complex indicates that the emission arises from the complex purely. Absolute photoluminescence quantum yields (PLQYs) were also measured for all the Ir(III) complexes. In CH2Cl2 solutions, blue emitting Ir(III)–CN complexes (436–454 nm dfpypy-CN, dfppy-CN, and ppy-CN) exhibit high PLQYs in the range of 68–84%. It should be mentioned that the PLQY of dfpypy-CN (80%) is one of the highest quantum yields (Φ) reported for deep-blue phosphors. Complexes tmpi-CN and pmp-CN display relatively lower PLQY (14% and 20%) in CH2Cl2 solutions, while much higher PLQYs have been achieved in PMMA films (both are 56%). And it is majorly attributed to the less perturbation on the triplet excited molecule from the surroundings in a rigid matrix (PMMA) than in solutions. The green and yellow phosphors (thpy-CN (517 nm) and lpt-CN (545 nm)) exhibit moderate PLQYs of 60–78%. However, the PLQYs of orange and red phosphors are in a range of 32–49% owing to the fast nonradiative decay rate at a long wavelength (energy gap law).55,56 Compared with the counterpart Ir(III)–CN complexes, all Ir(III)–OCN and a few Ir(III)–Br complexes (thpy-Br and piq-Br) exhibit comparable PLQYs. Nevertheless, the Ir(III)–Br counterparts with blue emission show very low PLQYs (1.4% for dfppy-Br and 4% for ppy-Br) and such behaviors are probably attributed to the instability of the Ir–Br bond for molecules in high triplet energy. Ultraviolet and deep-blue emitters tmpi-CN and pmp-CN with NHC moieties exhibit short emission lifetimes (1.73 and 0.87 μs). The emission lifetimes of blue emitting Ir(III)–CN complexes are in the range of 3.48–7.39 μs. Furthermore, other Ir(III)–CN complexes with lower energy emission display much longer lifetimes (11.2–36.65 μs). It is worth noting that the emission lifetimes of these Ir(III) complexes bearing different monodentate ligands decrease in the order of Ir(III)–CN > Ir(III)–OCN > Ir(III)–Br.
Electrochemistry studies
The electrochemical properties of selected Ir(III) complexes in degassed CH2Cl2 have been assessed by cyclic voltammetry (CV) and the data are summarized in Table 2 (all values versus ferrocenium/ferrocene (Fc+/0)). The cyclic voltammograms of these complexes in CH2Cl2 are shown in Fig. 3 (Ir(III)–CN complexes) and Fig. S6† (Ir(III)–Br and Ir(III)–OCN complexes in ESI†). These complexes show one reversible oxidative wave in the range of 0.43–0.87 V, expect for dfpypy-CN and lpt-CN which display one irreversible oxidative wave. The presence of electron-withdrawing substituents on the phenyl group leads to an anodic shift for the oxidation couple for dfppy-CN at 0.72 V to ppy-CN at 0.59 V (vs. Fc+/0). Furthermore, a more positive oxidation couple is observed for dfpypy-CN (0.77 V) than dfppy-CN (0.72 V), which could be attributed to the electron-deficient properties of the pyridine group. The quasi-reversible/irreversible anodic waves of those complexes bearing thpy, lpt, ppy and piq ligands occur at ∼0.6 V vs. Fc+/0 showing a very slight difference in wave patterns. These trends are also observed in the group of Ir(III)–Br and Ir(III)–OCN complexes (Fig. S6 in ESI†). With the same bidentate ligands, the oxidation waves of Ir(III)–Br and Ir(III)–OCN complexes occur very closely, while that of Ir(III)–CN complexes occur around 0.15–0.19 V greater (Table 2), implying that these anodic waves for these Ir(III) complexes come from the admixture of the phenyl part in C^N ligands, the metal center and tridentate/monodentate ligands. With a strong σ-donating p orbital and a low-lying π orbital, the cyanide ligand strongly influences the metal centered frontier molecular orbital, thus leading to more positive Eox.| Complex | E ox /V vs. Fc+/0 | E red /V vs. Fc+/0 | E g /eV | HOMOe/LUMOf/eV | T d 98/°C |
|---|---|---|---|---|---|
| a Supporting electrolyte: 0.1 M nBu4NPF6 in CH2Cl2 and values are recorded vs. SCE; Fc+/0 occurs in the range of 0.48–0.51 V vs. SCE; scan rate: 100 mV s−1. b 2% weight loss in TGA measurements. c The values are reported versus Fc+/0; values without parentheses refer to E1/2 for reversible couples and with parentheses refer to the onset of the redox peak potential for the quasi/irreversible waves. d E g = 1240/λonset (UV). e HOMO = −e(Eox + 4.8). f LUMO = Eg + HOMO. | |||||
| tmpi-CN | (0.64) | — | 3.75 | −5.44/−1.69 | 350 |
| pmp-CN | (0.67) | — | 3.46 | −5.47/−1.97 | 368 |
| dfpypy-CN | 0.77 | −2.53 | 3.07 | −5.57/−2.50 | 355 |
| dfppy-Br | 0.55 | (−2.57) | 2.88 | −5.35/−2.47 | 338 |
| dfppy-CN | 0.72 | −2.66; (−2.59) | 3.12 | −5.52/−2.40 | 361 |
| dfppy-OCN | 0.57 | (−2.61) | 2.88 | −5.37/−2.49 | 299 |
| ppy-Br | 0.43 | (−2.68) | 2.78 | −5.23/−2.45 | 335 |
| ppy-CN | 0.59 | −2.74; (−2.67) | 2.97 | −5.39/−2.42 | 372 |
| ppy-OCN | 0.44 | (−2.67) | 2.75 | −5.23/−2.48 | 238 |
| thpy-Br | 0.42 | (−2.63) | 2.79 | −5.32/−2.53 | 347 |
| thpy-CN | 0.61 | (−2.69) | 2.84 | −5.41/−2.57 | 359 |
| thpy-OCN | 0.43 | (−2.69) | 2.79 | −5.33/−2.54 | 306 |
| piq-Br | 0.44 | −2.31 | 2.48 | −5.24/−2.76 | 362 |
| piq-CN | 0.60 | −2.29 | 2.69 | −5.40/−2.71 | 376 |
| piq-OCN | 0.45 | −2.29 | 2.48 | −5.25/−2.77 | 343 |
| lpt-CN | (0.56) | −2.40 | 2.66 | −5.36/−2.70 | 250 |
| Tabt-CN | 0.69 | −2.33 | 2.66 | −5.49/−2.83 | 382 |
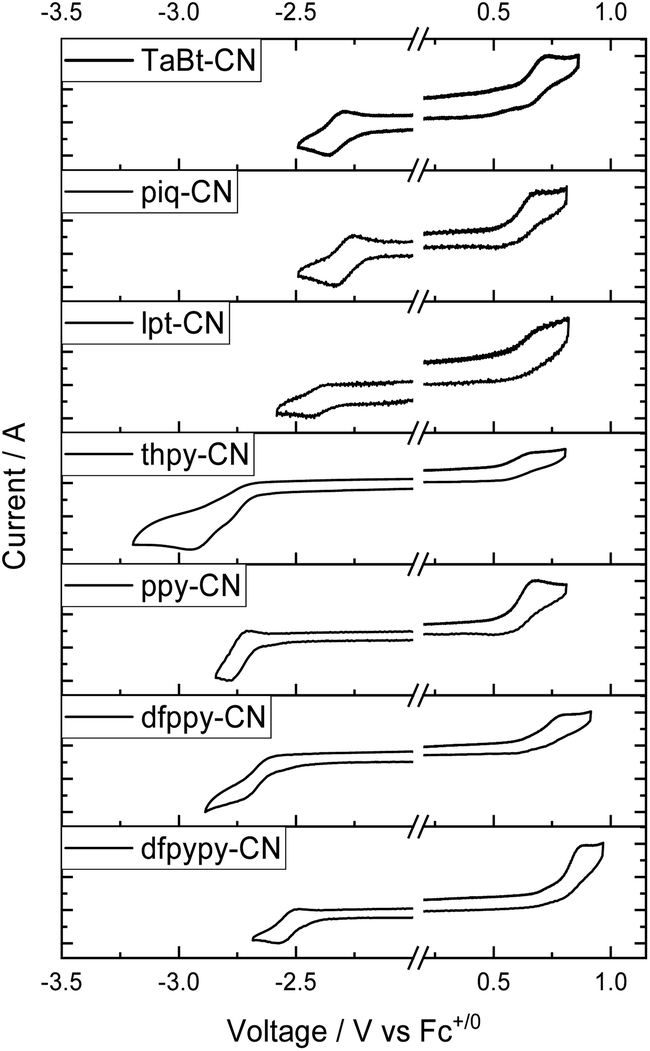 | ||
| Fig. 3 Cyclic voltammograms of Ir(III)–CN complexes in –CH2Cl2 with nBu4NPF6 (0.1 M) as the supporting electrolyte. Conditions: scan rate: 100 mV s−1; glass-carbon, working electrode; Pt wire, counter electrode; saturated calomel electrode (SCE) in saturated KCl aqueous solution, and reference electrode. | ||
On the other hand, these complexes display reduction waves (Ered) in the range of −2.22 to −2.75 V vs. Fc+/0, where those of the Ir(III)–CN complexes give reversible couples and those of the Ir(III)–Br or Ir(III)–OCN show irreversible waves. Impressively, the currents for the reversible reduction (ie) for the Ir(III)–CN complexes are almost equal to the currents for the oxidation ones (except ie of reduction wave is nearly double to that of oxidation couples for thpy-CN), while these currents for the Ir(III)–Br and Ir(III)–OCN complexes are quite different (Fig. S7†). Particularly, for the piq group (piq-Br, piq-OCN and piq-CN), their reversible reduction couples occur at around −2.3 V vs. Fc+/0, and the currents (ie) are equal to their oxidation couples. However, dfppy, ppy and thpy groups bearing Br and OCN as monodentate ligands display irreversible waves in the range of −2.57 to −2.69 V vs. Fc+/0, and the currents of their reduction waves are several times the current intensities of their oxidation couples. In addition, complexes lpt-CN (−2.40 V), piq-CN (−2.29 V), TaBt-CN (−2.33 V) and dfpypy-CN (−2.53 V) with greater π-conjugation ligands are capable of providing more positive reduction potentials with respect to ppy-CN (−2.74 V). All these imply that these reductions originated from the pyridinyl-ligand-based lowest unoccupied molecular orbital. And the cyanide monodentate ligand shows its advantage in electrochemical durability in this series of complexes in cyclovoltammetry studies.
Thermal stability
Thermogravimetric analysis (TGA) and differential scanning calorimetry (DSC) experiments revealed the thermal stability of Ir(III) complexes (see Fig. S8 in ESI†). Most of the Ir(III)–CN complexes show good thermal stability (2 wt% loss > 350 °C, except for the decomposition temperatures (Td) of 250 °C for lpt-CN). TGA of the Ir(III)–Br complexes give Td in the range of 335 to 362 °C which is 14–37 °C lower than that of Ir(III)–CN complexes. The Ir(III)–OCN complexes show the worst thermal stability in these groups, displaying Td around 238–343 °C which is 28–134 °C lower than that of the Ir(III)–CN complexes. It is worth noting that, in the group of the same monodentate ligand, the trend of Td increases with the formula weight of the Ir(III) complex. The reason for lpt-CN showing the lowest Td (250 °C) might be the steric effect in the back-forwarded iso-quinolinyl ligand in the lpt ligand, resulting in a weak Ir–N bond. The glass transition temperatures (Tg) of these complexes have not been observed prior to the decomposition of these complexes.Computational studies
To gain the insight into the electronic states, density functional theory (DFT) calculations (see the ESI† for details) have been performed to obtain the frontier molecular orbitals (MOs) of the selected complexes dfppy-CN, dfppy-OCN, ppy-Br, ppy-CN, ppy-OCN, thpy-Br and Tabt-CN. The geometry optimization in the calculations was employed using the crystal structure data, and the two highest occupied and lowest unoccupied molecular orbital (HOMO, HOMO−1, LUMO, and LUMO−1) surfaces and their corresponding energy levels are given in Fig. 4 and Table 3. | ||
| Fig. 4 (a) The computed frontier molecular orbitals energy levels and surfaces of dfppy-CN, dfppy-OCN, ppy-Br, ppy-CN, ppy-OCN, thpy-Br, and Tabt-CN at their ground state (S0) optimized geometry. | ||
| Complex | H−2 | H−1 | HOMO | LUMO | L+1 |
|---|---|---|---|---|---|
| a PBE0/6-31G* (LANL2DZ with ECP for Ir) level with PCM for modeling the CH2Cl2 solvent. | |||||
| thpy-Br | −6.07 | −5.61 | −5.42 | −1.26 | −0.74 |
| 44.0% | 37.8% | 5.3% | 2.0% | ||
| TaBt-CN | −6.14 | −5.89 | −5.58 | −1.75 | −0.50 |
| 37.6% | 22.6% | 4.7% | 2.4% | ||
| dfppy-CN | −6.32 | −5.81 | −5.80 | −1.35 | −0.80 |
| 40.2% | 38.6% | 4.1% | 2.5% | ||
| dfppy-OCN | −6.34 | −5.83 | −5.72 | −1.40 | −0.86 |
| 40.6% | 41.3% | 3.9% | 2.9% | ||
| ppy-Br | −6.03 | −5.58 | −5.49 | −1.27 | −0.79 |
| 44.4% | 44.25 | 3.5% | 2.5% | ||
| ppy-CN | −6.22 | −5.70 | −5.67 | −1.28 | −0.83 |
| 44.5% | 45.5% | 4.8% | 3.7% | ||
| ppy-OCN | −6.23 | −5.70 | −5.60 | −1.35 | −0.89 |
| 42.1% | 42.6% | 3.6% | 3.0% | ||
As shown in Fig. 4, the computed LUMOs are mainly located on the C^N ligands for all these complexes; however the computed HOMOs are of mixed metal–ligand characteristics with the contributions from Ir 5d orbitals, phenyl units in C^N ligands, the bis-NHC carbene pincer moiety and the monodentate ancillary. Ir 5d orbitals contribute over 35% in the HOMOs in most of these complexes, except for the TaBt-CN with 22.6%. Specifically, the participation of Ir 5d orbitals in the HOMO and HOMO−1 in the case of dfppy-CN is 38.6% and 40.2%, and their energy levels are quite close (−5.80 and −5.81 eV). The phenyl unit in C^N ligands contribute differently in these computed HOMOs. Owing to a large π-conjugation, the phenyl unit of TaBt contributes majorly in the HOMO of TaBT-CN. In turn, the phenyl unit of the bis-NHC pincer moiety was found to dominate the HOMO of the dfppy-CN, while the difluoro-phenyl unit of dfppy dominated its HOMO−1. The participation of both the bis-NHC carbene pincer moiety and monodentate ancillaries in the HOMOs of these complexes shows a reverse trend to the participation from the C^N ligands. In the ppy group, cyanide show the lowest the HOMO energy levels compared to bromide and cyanite. And these observations are in consistent with the findings in the electrochemical studies.
Their computed UV-Vis profiles by time-dependent density functional theory (TDDFT) are summarized in Fig. S9 and Table S3 (ESI†). For the ppy group (–Br/–CN/–OCN), the three major absorption bands with λ > 250 nm calculated are 290/269/290 nm, 320/310/327 nm, and 374/353/369 nm respectively, comparable to the bands from experiments (276/274/275 nm, 330/318/329 nm, and 372/356/372 nm). The lowest computed bands at 374/353/369 nm can be attributed to the transition of HOMO → LUMO (>96%, S1) and the attribution for other bands have been tabulated in Table S3 (ESI†). The lowest absorption bands for dfppy-CN, dfppy-OCN, thpy-Br and TaBt-CN were calculated to be 346 nm, 362 nm, 377 nm and 403 nm, giving the same trend as the observed 369 nm, 385 nm, 375 nm and 405 nm.
Electroluminescence properties
To investigate the electroluminescence (EL) properties of dfppy-OCN (devices II and V), ppy-OCN (devices III and VI), and dfppy-CN (device V), multi-layer OLEDs, with schematic device configurations in Fig. 5, were fabricated by the thermal deposition technique (see the ESI† for details). For comparison, the OLEDs with FIrpic (device I) were also fabricated as control devices. The EL characteristics of these devices are depicted in Fig. 6, Fig. S10 and S11.† Their key performances are listed in Table 3 (with a summary of some literature reported devices with CIEy < 0.25). As depicted in Fig. 6a, dfppy-CN, dfppy-OCN and ppy-OCN displayed EL spectra with the full width at half maxima (FWHMs) of around 60 nm at an optimized dopant concentration (Devices IV, V and VI). | ||
| Fig. 5 Schematic energy-level diagram for the various layers used assuming vacuum level alignment. | ||
 | ||
| Fig. 6 (a) Normalized EL spectra of devices IV, V and VI, and (b) J–V–L characteristics and (c) ηPE–L–ηExt characteristics of device IV with dfppy-CN at concentrations of 6 wt% and 12 wt%. (d) A CIE coordinates map of blue OLEDs with EQEmax over 15%. | ||
With HOMO/LUMO levels at −5.7/−2.3 eV and a ET of 2.76 eV, 4,4′,4′′-tris(carbazol-9-yl)triphenylamine (TCTA) was used as a host material for dfppy-OCN (HOMO/LUMO levels of −5.37/−2.49 eV and ET of 2.78 eV), ppy-OCN (−5.23/−2.48 eV and 2.70 eV), and FIrpic (−5.8/−2.9 eV (ref. 57) and 2.62 eV). The device structure was ITO/1,4,5,8,9,11-hexaazatriphenylenehexa-carbonitrile (HAT-CN, 10 nm)/1,1-bis[(di-4-tolylamino)phen-yl]cyclohexane (TAPC, 50 nm)/TCTA:Ir complexes (10 nm)/1,3,5-tri(m-pyridin-3-ylphenyl)benzene (TmPyPB, 50 nm)/(8-hydroxyquino-linato)lithium (Liq, 2 nm)/Al (120 nm) (Fig. 5a) for Devices I–III. In these devices, TAPC and TmPyPB were used as hole-transporting-layer (HTL) and electron-transporting-layer (ETL) materials, respectively. The device performance was optimized by varying the concentration of Ir complexes, dfppy-OCN, ppy-OCN, or FIrpic, that were doped in TCTA as emitters in the emitting layer (EML). Maximum current efficiencies/power efficiencies (ηL/ηp) of 24.1 cd A−1/25.0 lm W−1 and 32.3 cd A−1/28.8 lm W−1 were achieved at 20 wt% dopant concentration for dfppy-OCN (Device II) and ppy-OCN (Device III) while a maximum ηL/ηp of 36.9 cd A−1/41.4 lm W−1 was achieved at 20 wt% for FIrpic (Device I). Maximum ηExt values of 19.3, 11.9, and 11.7% were obtained for Devices I, II and III, respectively.
Since the ET of 2.87 eV for dfppy-CN was higher than that of TCTA (2.76 eV), dfppy-CN-based OLEDs were fabricated with a configuration of ITO/HAT-CN (5 nm)/TAPC (30 nm)/TCTA (10 nm)/9-(4-tert-butylphenyl)-3,6-bis(triphenylsilyl)-9H-carbazole (CzSi, 3 nm)/CzSi: dfppy-CN (17 nm)/diphenyl[4-(triphenylsilyl)-phenyl]phosphine oxide (TSPO1, 40 nm)/LiF (1.2 nm)/Al (100 nm). In these devices, CzSi (HOMO/LUMO level at −6.0/−2.5 eV)13 and TSPO1 (HOMO/LUMO level at −6.8/−2.5 eV)61 were used as host and ETL materials, respectively, because of their high ET (3.02 eV (ref. 13) for CzSi and 3.36 eV (ref. 61) for TSPO1). An acceptable blue device with a maximum ηL/ηp/ηExt of 34.1 cd A−1/24.5 lm W−1/22.9% was achieved with a dopant concentration of 12 wt% for dfppy-CN (Device IV). It is worth noting that the blue index, i.e. ηL/CIEy, of 141.9 for Device IV at the luminance of 100 cd m−2 is higher than those (typically lower than 120) of most reported Ir-based blue OLEDs with CIEy below 0.25 except for the one using 5 wt% of Ir(dfpy-4sipy)2(acac)62 in mCPPO1 whose blue index is 209.2 at 100 cd m−2 (Table 4). Additionally, the ηExt roll-off of 5.7% for Device IV at 1000 cd m−2 is one of the best values among the blue OLEDs listed in Table 4. By adopting the same architecture, dfppy-OCN (Device V) and ppy-OCN (Device VI) show higher ηExt and improved ηExt roll-offs at 1000 cd m−2, attributable to the improved exciton confinement by the CzSi host and TSPO1 EML. Nonetheless, the color chromatic is still a challenge in our device performance; further device optimization and development of hosts with a suitable high triplet level for these blue emitting iridium complexes are still ongoing. Preliminary operational lifetime (LT) measurements for OLEDs with ppy-CN and ppy-OCN were carried out under our laboratory conditions. The results are depicted in Fig. S12;† LT at 50% (LT50) of the initial luminance (L0) was 1.17 h at an L0 of 5000 cd m−2 and 0.269 h at an L0 of 13000 cd m−2 for the ppy-CN-based and ppy-OCN-based devices, respectively. For clear comparison, LT50 values of 85.7 h for the ppy-CN-based OLED and 99.9 h for the ppy-OCN-based one at L0 = 400 cd m−2 were estimated by assuming the accelerate coefficient of 1.7.63 In spite of similar LTs achieved in both devices, the maximum EQE (5.51%) of the ppy-CN-based device used for LT measurements was much lower than that (13.3%) of the ppy-OCN-based one (see Fig. S12a†). Considering the high PLQY of 0.77 for ppy-CN in the thin film (see Table 1), such a device structure might be unsuitable for ppy-CN. By optimzing the device structure, longer LT is expected for ppy-CN-based OLEDs. It is worth noting that the LT50 values for both ppy-CN-based and ppy-OCN-based devices are longer when compared with literature reported LT50 (20.1 h) of devices with FIrpic at the same L0,64 suggesting that the design strategy of [3 + 2 + 1] coordinated iridium complexes as phosphors in the application of OLEDs is effective.
| Dopants:Host/x wt% (Device) | EL | V 1/100/1000 | η L,max/100/1000b | η p,max/100/1000c | η Ext,max/100/1000 | CIEx,y | L J 1/2/max | Ref. | |
|---|---|---|---|---|---|---|---|---|---|
| a Voltage at the luminance at 1/100/1000 cd m−2. b The maximum current efficiency (ηL). c The maximum power efficiency (ηP). d The maximum external quantum efficiencies (ηExt) and these values at 100 and 1000 cd m−2. e The value of luminance at half of its maximum current density (J1/2) and the maximum luminance. Device structures in this work: f and for Device (I), (II) or (III): ITO/HAT-CN (10 nm)/TAPC (50 nm)/TCTA (Ir complexes: x wt%, 10 nm; x = 10, 15, 20, 30)/TmPyPB (50 nm)/Liq (2 nm)/Al (120 nm), g and for Device (IV), (V) or (VI): ITO/HAT-CN (5 nm)/TAPC (30 nm)/TCTA (10 nm)/CzSi (3 nm)/CzSi (Ir complexes: x wt%, 17 nm; x = 4, 8, 12, 18, 24, 30)/TSPO1 (40 nm)/LiF (1.2 nm)/Al (100 nm). | |||||||||
| FIrpic | |||||||||
| TCTA/10 wt% | 471 | 2.7/3.5/4.3 | 36.58/29.54/21.40 | 41.06/25.78/15.28 | 19.24/15.85/11.65 | 0.15, 0.29 | 6427/6680 | ||
| TCTA/20 wt% (I) | 471 | 2.7/3.4/4.3 | 36.86/33.20/26.19 | 42.59/32.01/18.70 | 19.30/17.78/13.55 | 0.15, 0.31 | 9938/10356 |
||
| TCTA/30 wt% | 476 | 2.7/3.4/4.3 | 35.47/33.57/26.73 | 39.93/31.01/19.08 | 17.78/16.83/13.47 | 0.16, 0.33 | 11955/12804 |
||
|
|||||||||
| dfppy-OCN , | |||||||||
| TCTA/10 wt% | 471 | 3/3.9/5.4 | 15.75/13.77/7.92 | 15.53/10.82/4.44 | 8.26/7.63/4.78 | 0.15, 0.24 | 2531/2804 | ||
| TCTA/15 wt% | 476 | 3/3.8/5 | 21.03/20.38/15.39 | 20.73/16.85/9.67 | 10.49/10.35/7.91 | 0.15, 0.27 | 4307/4749 | ||
| TCTA/20 wt% (II) | 476 | 3/3.8/4.9 | 24.05/22.96/18.21 | 24.95/18.98/12.40 | 11.70/11.35/9.36 | 0.16, 0.29 | 5643/6240 | ||
| CzSi/18 wt% | 485 | 3.2/4.4/6.4 | 41.40/38.94/34.58 | 37.91/27.18/16.73 | 18.83/17.87/16.16 | 0.16, 0.37 | 4027/6340 | ||
| CzSi/24 wt% | 485 | 3/4.2/6.2 | 41.94/40.12/37.11 | 41.72/28.02/19.19 | 18.93/18.22/16.93 | 0.16, 0.38 | 4654/6800 | ||
| CzSi/30 wt% (V) | 486 | 2.9/4/6 | 43.06/41.23/38.21 | 38.66/28.79/19.95 | 19.41/18.71/17.45 | 0.16, 0.39 | 5335/7100 | ||
|
|||||||||
| ppy-OCN , | |||||||||
| TCTA/10 wt% | 487 | 3/4.7/6.7 | 23.91/17.78/11.19 | 22.34/11.64/5.17 | 9.5/7.49/4.93 | 0.18, 0.38 | 5966/6722 | ||
| TCTA/20 wt% (III) | 487 | 3/4.5/6.1 | 32.27/31.16/22.74 | 28.77/21.29/11.52 | 11.92/11.59/8.68 | 0.19, 0.46 | 10032/11383 |
||
| TCTA/30 wt% | 488 | 3/4.7/6.3 | 32.28/31.89/25.18 | 29.55/20.89/12.36 | 11.67/11.58/9.31 | 0.20, 0.49 | 9375/11262 |
||
| CzSi/4 wt% (VI) | 488 | 3/4/5.4 | 45.72/44.00/33.74 | 38.07/34.56/17.45 | 16.67/16.05/12.28 | 0.19, 0.48 | 5219/6200 | ||
| CzSi/8 wt% | 489 | 3/3.8/5.4 | 40.94/39.35/34.45 | 32.54/32.54/20.40 | 14.93/14.35/12.58 | 0.19, 0.49 | 5428/6790 | ||
| CzSi/12 wt% | 490 | 3/3.8/5.2 | 39.21/38.40/36.54 | 35.00/31.75/20.08 | 14.72/14.42/13.72 | 0.20, 0.50 | 5478/6820 | ||
|
|||||||||
| dfppy-CN | |||||||||
| CzSi: 6 wt% | 479 | 3/4.8/6.8 | 31.87/30.93/26.82 | 25.03/19.44/12.25 | 21.88/21.48/18.84 | 0.14, 0.22 | 4241/6500 | ||
| CzSi: 12 wt% (IV) | 480 | 3/4.5/6.4 | 34.06/34.06/32.22 | 24.50/23.27/15.77 | 22.94/22.94/21.63 | 0.14, 0.24 | 4439/7100 | ||
|
|||||||||
| Ir(fpmi)2(pypz) | |||||||||
| UGH2/4 wt% | 466 | 4.2/—/— | 11.8/—/— | 7.4/—/— | 9.1/—/— | 0.14, 0.16 | —/5668 | 44 | |
| UGH2-CzSi/4 wt% | 470 | 4.3/—/— | 19.7/—/— | 13.8/—/— | 14.1/—/— | 0.14, 0.18 | —/8161 | ||
|
|||||||||
| Ir(fpmi)2(tfpypz) | |||||||||
| UGH2-CzSi/4 wt% | 454 | 4.9/—/— | 6.5/—/— | 4.1/—/— | 7.6/—/— | 0.14, 0.10 | —/3446 | 44 | |
|
|||||||||
| Ir(dfbmb)2(fptz) | |||||||||
| UGH2/6 wt% | 434, 460 | 4/—/— | 6.3/3.0/— | 4.0/0.9/— | 6.0/2.7/— | 0.158, 0.128 | —/<1000 | 38 | |
|
|||||||||
| Ir(fbppz)2(dfbdp) | |||||||||
| UGH2-CzSi/6 wt% | 455 | 4.4/—/— | 11.3/7.7/— | 8.6/3.1/— | 11.7/8.2/— | 0.155, 0.106 | —/4044 | 10 | |
|
|||||||||
| Ir in mCPPO1/10 wt% | |||||||||
| (TF)2Ir(fptz) | 448 | 3.3/4.5/— | 8.6/7.53/— | 8.1/5.25/— | 8.4/7.36/— | 0.174, 0.116 | <1000/∼1200 | 58 | |
| (TF)2Ir(pic) | 460 | 3.3/4.4/— | 21.7/21.31/— | 19/15.20/— | 17.1/16.83/— | 0.141, 0.158 | <2000/<2100 | ||
| (HF)2Ir(fptz) | 448 | 3.4/4.8/— | 9.1/7.78/— | 7.7/5.09/— | 8.4/7.1/— | 0.149, 0.130 | <300/∼300 | ||
| (HF)2Ir(pic) | 460 | 3.3/4.5/— | 16.8/15.25/— | 13.5/10.65/— | 12.6/11.53/— | 0.143, 0.169 | ∼500/∼500 | ||
|
|||||||||
| mer-Ir(pmp)3 | |||||||||
| TSPO1/20–8% graded | ∼435 | 14.4 ± 0.4/—/13.3 ± 0.1 | 0.16, 0.15 | 22000 ± 1000/— |
11 | ||||
|
|||||||||
| fac-Ir(pmp)3 | |||||||||
| TSPO1/20–8% graded | ∼460 | 10.1 ± 0.2/—/9.0 ± 0.1 | 0.16, 0.09 | 7800 ± 00/— | 11 | ||||
|
|||||||||
| Ir(dfpybpy)2(fpbpz) | |||||||||
| SimCP: 20 wt% | 440 | 4.14/—/— | 7.0/—/— | <2000/<3000 | 59 | ||||
|
|||||||||
| Ir(mimb)(pzpyBuOphF) | |||||||||
| DPEPO: 12 wt% | 467 | 3.8/5.2/— | 28.8/20.3/— | 22.6/12.3/<5 | 20.7/14.6/<8 | 0.15, 0.17 | <6000/<7000 | 19 | |
|
|||||||||
| Ir(dfpy-4sipy)2(acac) | |||||||||
| mCPPO1: 5 wt% | 3.0/3.8/4.7 | —/50.2/47.2 | 46.2/—/— | 30.9/30.4/28.5 | 0.14, 0.24 | 62 | |||
|
|||||||||
| Ir(dfpy-4sipy)2(acac) | |||||||||
| mCPPO1: 5 wt% | 3.2/3.7/4.6 | —/46.1/43.5 | 41.6/—/— | 28.2/28.0/26.6 | 0.14, 0.23 | ||||
|
|||||||||
| Ir(fdpt)3 | |||||||||
| DPEPO: 10 wt% | 3.9/—/— | 23.0/—/— | —/—/— | 22.5/16.5/11.1 | 0.15, 0.11 | 60 | |||
| DPEPO: 12 wt% | 3.7/—/— | 19.8/—/— | ∼15/—/— | 19.4/17.8/12.6 | 0.15, 0.11 | ∼3000/>3000 | |||
|
|||||||||
| Ir(dpt)3 | |||||||||
| DPEPO: 12 wt% | 3.5/—/— | 36.0/—/— | 21.9/21.2/21.0 | 0.15, 0.21 | /20070 |
||||
Conclusions
In conclusion, a series of neutral [3 + 2 + 1] iridium complexes bearing tridentate bis-NHC ligands, bidentate cyclometalated ligands and monodentate ligands has been successfully designed and synthesized. And these iridium complexes could display a wide range of phosphorescent emissions, which cover the UV and visible light range. The phosphorescent emission can be easily tuned by variation of the bidentate ligands. Among the three types of monodentate ligands in this study, the cyanide ion with strong σ-donor and weak π-acceptor properties shows abilities to (i) further increase the energy of the d–d states of the iridium atom and reduce the metal participation in the HOMO orbital and the excited states, thus leading to more ligand-centred transition characteristics in the absorption and longer emission lifetimes, (ii) stabilize the HOMO energy levels and the excited molecules in the high energy triplet state, (iii) slightly push the LUMOs up in blue and sky-blue emitters, (iv) increase the electrochemical durability in the cyclic voltammetry reduction process, and (v) improve the thermal stabilities. These iridium complexes show excellent absolute PLQYs with most them being over 50% and long emission lifetimes. And several blue and sky-blue emissive iridium complexes had been fabricated as devices. The device using dfppy-OCN as the sky-blue emitter at a dopant concentration of 20 wt% showed acceptable efficiencies compared to those of FIrpic in the same device structure but showed improved efficiency roll-offs at a high luminance of 1000 cd m−2. Particularly, a blue OLED (Device IV) with a blue index of 141.9 was achieved with dfppy-CN as the emitting dopant in the CzSi host with 12 wt% doping concentration at 100 cd m−2. The ηExt roll-off of 5.7% for Device IV at 1000 cd m−2 is one of the best values among blue OLEDs with Ir-emitters. The molecular-design strategy based on tridentate bis-NHC ligands and monodentate cyanide in the construction of [3 + 2 + 1] iridium complexes paves an alternative way for further development of phosphorescent plane displays.Data availability
(1) Crystallographic data for thpy-Br, TaBt-CN and dfppy-OCN have been doposited at the CCDC with CCDC No. of 2068837–2068839. (2) Date for this paper, including the photophysical, electrochemical, thermal properties, DFT calculation, device fabrication, synthesis of these complexes and their charaterization are available in ESI, and can be downloaded from https://doi.org/10.1039/d1sc01426a.Author contributions
Y. W. and C. Y. wrote the manuscript, measured the crystallography, photophysical, electrochemical and thermal stability properties of these materials and analysed related data. J. L. contributed to the DFT calculations. Y. W., C. Y., M. Z., W.-S. L., and C.-C. W. synthesized these materials. W.-Q. L., G. C., and Q.-D. Y. fabricated and optimized the PhOLEDs. C. Y., G. C., Q.-D. Y. and G.-D. W. supervised the project, and analysed the data and they provided comments and revised the whole work with C.-M. C.Conflicts of interest
There are no conflicts to declare.Acknowledgements
W. Y., C. Y. and C.-C. Wu acknowledge Shenzhen PURI Materials Technologies, Co., Ltd. and colleague for their supports. This work was supported by the Guangdong Major Project of Basic and Applied Basic Research (2019B030302009), National Natural Science Foundation of China (NSFC No. 52003059), the Guangzhou Science and Technology Program (No. 202002030397), and the Shenzhen Science and Technology Innovation Committee (JCYJ20190809172615277 and JCYJ20200109150414471).Notes and references
- C. Adachi, M. A. Baldo, M. E. Thompson and S. R. Forrest, J. Appl. Phys., 2001, 90, 5048–5051 CrossRef CAS.
- Y. Ma, H. Zhang, J. Shen and C.-M. Che, Synth. Met., 1998, 94, 245–248 CrossRef CAS.
- M. A. Baldo, D. F. O'Brien, Y. You, A. Shoustikov, S. Sibley, M. E. Thompson and S. R. Forrest, Nature, 1998, 395, 151–154 CrossRef CAS.
- W. Song and J. Y. Lee, Adv. Opt. Mater., 2017, 5, 1600901 CrossRef.
- S. E. Lee, T. V. Hoang, J.-H. Lee and Y. K. Kim, Phys. B Condens. Matter, 2018, 550, 122–126 CrossRef CAS.
- M. H. Lu and J. C. Sturm, Appl. Phys. Lett., 2001, 78, 1927–1929 CrossRef CAS.
- N. Gupta, R. Grover, D. S. Mehta and K. Saxena, J. Opt., 2015, 17, 075402 CrossRef.
- Y. Sun and S. R. Forrest, Nat. Photonics, 2008, 2, 483–487 CrossRef CAS.
- C. Adachi, R. C. Kwong, P. Djurovich, V. Adamovich, M. A. Baldo, M. E. Thompson and S. R. Forrest, Appl. Phys. Lett., 2001, 79, 2082–2084 CrossRef CAS.
- Y.-C. Chiu, J.-Y. Hung, Y. Chi, C.-C. Chen, C.-H. Chang, C.-C. Wu, Y.-M. Cheng, Y.-C. Yu, G.-H. Lee and P.-T. Chou, Adv. Mater., 2009, 21, 2221–2225 CrossRef CAS.
- J. Lee, H.-F. Chen, T. Batagoda, C. Coburn, P. I. Djurovich, M. E. Thompson and S. R. Forrest, Nat. Mater., 2016, 15, 92–98 CrossRef CAS PubMed.
- H. Shin, Y. H. Ha, H.-G. Kim, R. Kim, S.-K. Kwon, Y.-H. Kim and J.-J. Kim, Adv. Mater., 2019, 31, 1808102 CrossRef PubMed.
- E. Baranoff and B. F. E. Curchod, Dalton Trans., 2015, 44, 8318–8329 RSC.
- S. Tokito, T. Iijima, Y. Suzuri, H. Kita, T. Tsuzuki and F. Sato, Appl. Phys. Lett., 2003, 83, 569 CrossRef CAS.
- R. J. Holmes, S. R. Forrest, Y. J. Tung, R. C. Kwong, J. J. Brown, S. Garon and M. E. Thompson, Appl. Phys. Lett., 2003, 82, 2422–2424 CrossRef CAS.
- M. A. Baldo, S. Lamansky, P. E. Burrows, M. E. Thompson and S. R. Forrest, Appl. Phys. Lett., 1999, 75, 4–6 CrossRef CAS.
- M. A. Baldo, M. E. Thompson and S. R. Forrest, Nature, 2000, 403, 750–753 CrossRef CAS PubMed.
- Y.-J. Su, H.-L. Huang, C.-L. Li, C.-H. Chien, Y.-T. Tao, P.-T. Chou, S. Datta and R.-S. Liu, Adv. Mater., 2003, 15, 884–888 CrossRef CAS.
- H. H. Kuo, Y. T. Chen, L. R. Devereux, C. C. Wu, M. A. Fox, C. Y. Kuei, Y. Chi and G. H. Lee, Adv. Mater., 2017, 29, 1702464 CrossRef PubMed.
- P. Gnanasekaran, Y. Yuan, C. S. Lee, X. Zhou, A. K. Jen and Y. Chi, Inorg. Chem., 2019, 58, 10944–10954 CrossRef CAS PubMed.
- C.-Y. Kuei, S.-H. Liu, P.-T. Chou, G.-H. Lee and Y. Chi, Dalton Trans., 2016, 45, 15364–15373 RSC.
- H. H. Kuo, Z. L. Zhu, C. S. Lee, Y. K. Chen, S. H. Liu, P. T. Chou, A. K. Jen and Y. Chi, Adv. Sci., 2018, 5, 1800846 CrossRef PubMed.
- L.-Y. Hsu, Q. Liang, Z. Wang, H.-H. Kuo, W.-S. Tai, S.-J. Su, X. Zhou, Y. Yuan and Y. Chi, Chem.–Eur. J., 2019, 25, 15375–15386 CrossRef CAS PubMed.
- A. J. Wilkinson, H. Puschmann, J. A. K. Howard, C. E. Foster and J. A. G. Williams, Inorg. Chem., 2006, 45, 8685–8699 CrossRef CAS PubMed.
- P. Brulatti, R. J. Gildea, J. A. K. Howard, V. Fattori, M. Cocchi and J. A. G. Williams, Inorg. Chem., 2012, 51, 3813–3826 CrossRef CAS PubMed.
- Y. Koga, M. Kamo, Y. Yamada, T. Matsumoto and K. Matsubara, Eur. J. Inorg. Chem., 2011, 2011, 2869–2878 CrossRef CAS.
- K. C. Chan, W. K. Chu, S. M. Yiu and C. C. Ko, Dalton Trans., 2015, 44, 15135–15144 RSC.
- S. Obara, M. Itabashi, F. Okuda, S. Tamaki, Y. Tanabe, Y. Ishii, K. Nozaki and M.-a. Haga, Inorg. Chem., 2006, 45, 8907–8921 CrossRef CAS PubMed.
- L. Fu, M. Pan, Y.-H. Li, H.-B. Wu, H.-P. Wang, C. Yan, K. Li, S.-C. Wei, Z. Wang and C.-Y. Su, J. Mater. Chem., 2012, 22, 22496 RSC.
- L. Yang, F. Okuda, K. Kobayashi, K. Nozaki, Y. Tanabe, Y. Ishii and M.-a. Haga, Inorg. Chem., 2008, 47, 7154–7165 CrossRef CAS PubMed.
- J. Kuwabara, T. Namekawa, E. Sakabe, M.-a. Haga and T. Kanbara, J. Organomet. Chem., 2017, 845, 189–195 CrossRef CAS.
- T. Fleetham, G. Li and J. Li, Adv. Mater., 2017, 29, 1601861 CrossRef PubMed.
- J. Brooks, Y. Babayan, S. Lamansky, P. I. Djurovich, I. Tsyba, R. Bau and M. E. Thompson, Inorg. Chem., 2002, 41, 3055–3066 CrossRef CAS PubMed.
- L. Flamigni, A. Barbieri, C. Sabatini, B. Ventura and F. Barigelletti, Photochemistry and Photophysics of Coordination Compounds: Iridium, in Photochemistry and Photophysics of Coordination Compounds II. Topics in Current Chemistry, ed. V. Balzani and S. Campagna, Springer Berlin/Heidelberg, 2007, vol. 281, pp. 143–203 Search PubMed.
- D. Jacquemin and D. Escudero, Chem. Sci., 2017, 8, 7844–7850 RSC.
- A. F. Rausch, L. Murphy, J. A. G. Williams and H. Yersin, Inorg. Chem., 2012, 51, 312–319 CrossRef CAS PubMed.
- T. Sajoto, P. I. Djurovich, A. Tamayo, M. Yousufuddin, R. Bau, M. E. Thompson, R. J. Holmes and S. R. Forrest, Inorg. Chem., 2005, 44, 7992–8003 CrossRef CAS.
- C. F. Chang, Y. M. Cheng, Y. Chi, Y. C. Chiu, C. C. Lin, G. H. Lee, P. T. Chou, C. C. Chen, C. H. Chang and C. C. Wu, Angew. Chem., Int. Ed., 2008, 47, 4542–4545 CrossRef CAS PubMed.
- K. Li, G. Cheng, C. Ma, X. Guan, W.-M. Kwok, Y. Chen, W. Lu and C.-M. Che, Chem. Sci., 2013, 4, 2630–2644 RSC.
- R. Visbal and M. C. Gimeno, Chem. Soc. Rev., 2014, 43, 3551–3574 RSC.
- C. Yang, F. Mehmood, T. L. Lam, S. L.-F. Chan, Y. Wu, C.-S. Yeung, X. Guan, K. Li, C. Y.-S. Chung, C.-Y. Zhou, T. Zou and C.-M. Che, Chem. Sci., 2016, 7, 3123–3136 RSC.
- P. Pinter, J. Soellner and T. Strassner, Chem, 2019, 25, 14495–14499 CrossRef CAS PubMed.
- M. N. Hopkinson, C. Richter, M. Schedler and F. Glorius, Nature, 2014, 510, 485–496 CrossRef CAS PubMed.
- C. H. Hsieh, F. I. Wu, C. H. Fan, M. J. Huang, K. Y. Lu, P. Y. Chou, Y. H. Yang, S. H. Wu, I. C. Chen, S. H. Chou, K. T. Wong and C. H. Cheng, Chem.–Eur. J., 2011, 17, 9180–9187 CrossRef CAS PubMed.
- L.-H. Chung, H.-S. Lo, S.-W. Ng, D.-L. Ma, C.-H. Leung and C.-Y. Wong, Sci. Rep., 2015, 5, 15394 CrossRef CAS PubMed.
- T. P. Hanusa, Cyanide Complexes of the Transition Metals, in Encyclopedia of Inorganic Chemistry, ed. D. J. Burkey, 1st edn, 2005, pp. 1–11, DOI: DOI:10.1002/0470862106.ia059.
- K. Dedeian, J. Shi, E. Forsythe, D. C. Morton and P. Y. Zavalij, Inorg. Chem., 2007, 46, 1603–1611 CrossRef CAS PubMed.
- R. D. Sanner, N. J. Cherepy and V. G. Young, Inorganica Chim. Acta, 2016, 440, 165–171 CrossRef CAS.
- A. K. Pal, S. Krotkus, M. Fontani, C. F. R. Mackenzie, D. B. Cordes, A. M. Z. Slawin, I. D. W. Samuel and E. Zysman-Colman, Adv. Mater., 2018, 30, e1804231 CrossRef PubMed.
- S. J. Lee, K.-M. Park, K. Yang and Y. Kang, Inorg. Chem., 2009, 48, 1030–1037 CrossRef CAS PubMed.
- A. B. Tamayo, B. D. Alleyne, P. I. Djurovich, S. Lamansky, I. Tsyba, N. N. Ho, R. Bau and M. E. Thompson, J. Am. Chem. Soc., 2003, 125, 7377–7387 CrossRef CAS PubMed.
- A. F. Rausch, M. E. Thompson and H. Yersin, Inorg. Chem., 2009, 48, 1928–1937 CrossRef CAS PubMed.
- S. Okada, H. Iwawaki, M. Furugori, J. Kamatani, S. Igawa, T. Moriyama, S. Miura, A. Tsuboyama, T. Takiguchi and H. Mizutani, SID Symp. Dig. Tech. Pap., 2002, 33, 1360–1363 CrossRef CAS.
- Mitsubishi Chemical Corp., Japan, JP. Pat., 4192592, 2008 Search PubMed.
- J. V. Caspar and T. J. Meyer, J. Phys. Chem., 1983, 87, 952–957 CrossRef CAS.
- J. V. Caspar, E. M. Kober, B. P. Sullivan and T. J. Meyer, J. Am. Chem. Soc., 1982, 104, 630–632 CrossRef CAS.
- V. I. Adamovich, S. R. Cordero, P. I. Djurovich, A. Tamayo, M. E. Thompson, B. W. D'Andrade and S. R. Forrest, Org. Electron., 2003, 4, 77–87 CrossRef CAS.
- S. Lee, S. O. Kim, H. Shin, H. J. Yun, K. Yang, S. K. Kwon, J. J. Kim and Y. H. Kim, J. Am. Chem. Soc., 2013, 135, 14321–14328 CrossRef CAS PubMed.
- C.-H. Yang, M. Mauro, F. Polo, S. Watanabe, I. Muenster, R. Fröhlich and L. De Cola, Chem. Mater., 2012, 24, 3684–3695 CrossRef CAS.
- X. Li, J. Zhang, Z. Zhao, L. Wang, H. Yang, Q. Chang, N. Jiang, Z. Liu, Z. Bian, W. Liu, Z. Lu and C. Huang, Adv. Mater., 2018, 30, e1705005 CrossRef.
- S. O. Jeon, S. E. Jang, H. S. Son and J. Y. Lee, Adv. Mater., 2011, 23, 1436–1441 CrossRef CAS PubMed.
- R. Zaen, K.-M. Park, K. H. Lee, J. Y. Lee and Y. Kang, Adv. Opt. Mater., 2019, 7, 1901387 CrossRef CAS.
- C. Féry, B. Racine, D. Vaufrey, H. Doyeux and S. Cinà, Appl. Phys. Lett., 2005, 87, 213502 CrossRef.
- S. Yi, J.-H. Kim, Y.-J. Cho, J. Lee, T.-S. Choi, D. W. Cho, C. Pac, W.-S. Han, H.-J. Son and S. O. Kang, Inorg. Chem., 2016, 55, 3324–3331 CrossRef CAS.
Footnotes |
| † Electronic supplementary information (ESI) available: Details of X-ray crystallographic data, photophysical, electrochemical, and thermal properties, DFT calculations, and device fabrication and synthesis of these complexes are provided. CCDC 2068837–2068839. For ESI and crystallographic data in CIF or other electronic format see DOI: 10.1039/d1sc01426a |
| ‡ Y. W. and C. Y. contributed equally to this work. |
| This journal is © The Royal Society of Chemistry 2021 |