
 Open Access Article
 This Open Access Article is licensed under a
 Creative Commons Attribution 3.0 Unported Licence
Proton-conductive coordination polymer glass for solid-state anhydrous proton batteries†
Nattapol
Ma
 a,
Soracha
Kosasang
b,
Atsushi
Yoshida
a and
Satoshi
Horike
*acde
a,
Soracha
Kosasang
b,
Atsushi
Yoshida
a and
Satoshi
Horike
*acde
aDepartment of Synthetic Chemistry and Biological Chemistry, Graduate School of Engineering, Kyoto University, Katsura, Nishikyo-ku, Kyoto 615-8510, Japan. E-mail: horike@icems.kyoto-u.ac.jp
bDepartment of Chemical and Biomolecular Engineering, School of Energy Science and Engineering, Vidyasirimedhi Institute of Science and Technology, Rayong, 21210, Thailand
cAIST-Kyoto University Chemical Energy Materials Open Innovation Laboratory (ChEM-OIL), National Institute of Advanced Industrial Science and Technology (AIST), Yoshida-Honmachi, Sakyo-ku, Kyoto 606-8501, Japan
dInstitute for Integrated Cell-Material Sciences, Institute for Advanced Study, Kyoto University, Yoshida-Honmachi, Sakyo-ku, Kyoto 606-8501, Japan
eDepartment of Materials Science and Engineering, School of Molecular Science and Engineering, Vidyasirimedhi Institute of Science and Technology, Rayong, 21210, Thailand
First published on 12th March 2021
Abstract
Designing solid-state electrolytes for proton batteries at moderate temperatures is challenging as most solid-state proton conductors suffer from poor moldability and thermal stability. Crystal–glass transformation of coordination polymers (CPs) and metal–organic frameworks (MOFs) via melt-quenching offers diverse accessibility to unique properties as well as processing abilities. Here, we synthesized a glassy-state CP, [Zn3(H2PO4)6(H2O)3](1,2,3-benzotriazole), that exhibited a low melting temperature (114 °C) and a high anhydrous single-ion proton conductivity (8.0 × 10⁻³ S cm−1 at 120 °C). Converting crystalline CPs to their glassy-state counterparts via melt-quenching not only initiated an isotropic disordered domain that enhanced H+ dynamics, but also generated an immersive interface that was beneficial for solid electrolyte applications. Finally, we demonstrated the first example of a rechargeable all-solid-state H+ battery utilizing the new glassy-state CP, which exhibited a wide operating-temperature range of 25 to 110 °C.
Introduction
The proton (H+) has a diameter of 0.84 fm and is easily localized in the solid state.1 Fast-moving protons in solids are difficult to achieve, whereas solid-state H+ conductors are widely used in various electrochemical applications, including fuel cells, electrochemical catalysis, and sensors.2 Proton batteries are a new class of secondary batteries employing protons instead of metal ions as charge carriers.3,4 They consist of faradaic electrodes and acidic electrolytes. Since the H+ charge radius is significantly smaller than that of other ions, faster ion migration and negligible volume changes upon H+ insertion/desertion are expected. Additionally, replacing high-cost Li+ with cheaper and more abundant H+ provides a promising platform for environmentally benign and intrinsically safe energy storage.5–7 Redox-active organic molecules, such as quinone-functionalized conductive polymers,4,8 and metal oxides, including MoO3, WO3, and HxIrO4, are available as H+ electrodes.9–11 Though proton batteries show a smaller specific capacity with a limited number of applications, as compared to their metallic counterparts, diffusion-free charge transport via the Grotthuss mechanism in a defective, Prussian blue analog establishes a high-rate capability (380 A g−1) and extends cycling stability to over 0.5 million charge–discharge cycles, which is a unique advantage of aqueous proton batteries.6,12,13 In spite of various choices of electrodes, electrolytes are mostly limited to aqueous H2SO4 or H3PO4, which dictates the operating-temperature window and selection of usable electrodes.8,13–15Safely extending the operating-temperature window to ∼100 °C is essential for H+ batteries to tolerate internal/external heat generation so that they can be used in various high-temperature applications, such as rescue/inspection robots, space exploration, and measure-while-drilling (MWD) equipment in the oil and gas industries.16 As employing a conventional aqueous electrolyte is not possible at these high temperatures, solid-state H+ batteries with anhydrous solid electrolytes would be more suitable. There are no reports of solid-state H+ batteries working near or above 100 °C due to the difficulties in achieving high anhydrous H+ conductivity, high-temperature stability, and moldability required for H+ conductors.17 Apart from achieving a high H+ conductivity value (near 10−2 S cm−1), high thermal/chemical stability, processing ability, and ion selectivity are also needed to expand the practicality of solid-state electrolytes. Single-ion conductivity in solid-state electrolytes is a core factor that promotes charge-transport efficiency and prevents anion polarization.18,19 Discontinuities along the electrode–electrolyte interfaces and grain boundaries are primary bottlenecks for efficient utilization of solid electrolytes.17,20,21 H+ conductivity at the grain boundary of most crystalline compounds requires a higher migration activation energy than that required by H+ conductivity through the bulk crystal (grain boundaries contribute up to 40–50% of the overall resistance for Li+ conductors).22–25
Coordination polymers (CPs) and metal–organic frameworks (MOFs) exhibiting high H+ conductivity over a wide temperature regime (∼200 °C) represent a new class of solid-state H+ conductors.26–29 Despite their remarkable H+ conductivity, their crystalline nature hinders their processing ability, thus limiting their practicality.30 The glassy state of CP/MOFs is a strong platform to tackle these issues, and there have been increasing numbers of glassy-state CPs recently made from crystalline-state CPs.31–34 Some of these glassy-state CPs show anhydrous H+ conductivity superior to that of their crystalline counterparts by several orders of magnitude.35,36 Moreover, the vitrifying/melting behavior provides these CPs with processing capabilities and forms a grain-boundary free monolith and a flawless heterogeneous interface.31–34,37–41
To address this issue, we have developed a new H+-conductive CP glass suitable for high-temperature anhydrous solid-state H+ batteries. By optimizing the pKa value of the component with 1,2,3-benzotriazole (BTA, pKa 1.6) and the extended hydrogen-bonding network in Zn2+-based CPs, the material demonstrated high anhydrous H+ conductivity (8.0 × 10⁻³ S cm−1 at 120 °C), relatively low melting point (114 °C), and mechanical softness (42.8 Pa s at 120 °C), which are suitable for electrolytes. The structure and properties were characterized by single-crystal X-ray diffraction (SC-XRD), thermal gravimetric analysis (TGA), differential scanning calorimetry (DSC), dynamic mechanical analysis (DMA), impedance spectroscopy, electromotive force measurements, and solid-state NMR. We also demonstrated a full-cell evaluation of the anhydrous solid-state H+ batteries at 25, 100, and 110 °C.
Results and discussion
Crystal structure of [Zn3(H2PO4)6(H2O)3](BTA) (1a)
Zinc oxide, phosphoric acid, and BTA were subjected to mechanical milling to form the CP (1a) as a white crystalline powder. SC-XRD analysis of 1a provided its chemical formula, [Zn3(H2PO4)6(H2O)3](BTA), and it was found to exist as a one-dimensional (1D) chain along the a-axis (Fig. 1). Three crystallographically independent octahedral Zn2+ ions were identified, each with six bridging H2PO4− anions and one water molecule coordinated to them (Fig. 1A). BTA was stacked in a 1D fashion along the a-axis and surrounded by six chains of ZnO6 octahedra, which orderly arranged in the bc plane due to hydrogen-bonding interactions (Fig. 1B and C). Furthermore, 1a is an isostructure of previously reported [Zn3(H2PO4)6(H2O)3](benzimidazole),38 and it is expected that the dynamics of the phosphates bridging the Zn2+ ions (through a single bridging oxygen atom (μ2)) and the non-coordinating BTA could facilitate an anhydrous H+ migration.2,38,42,43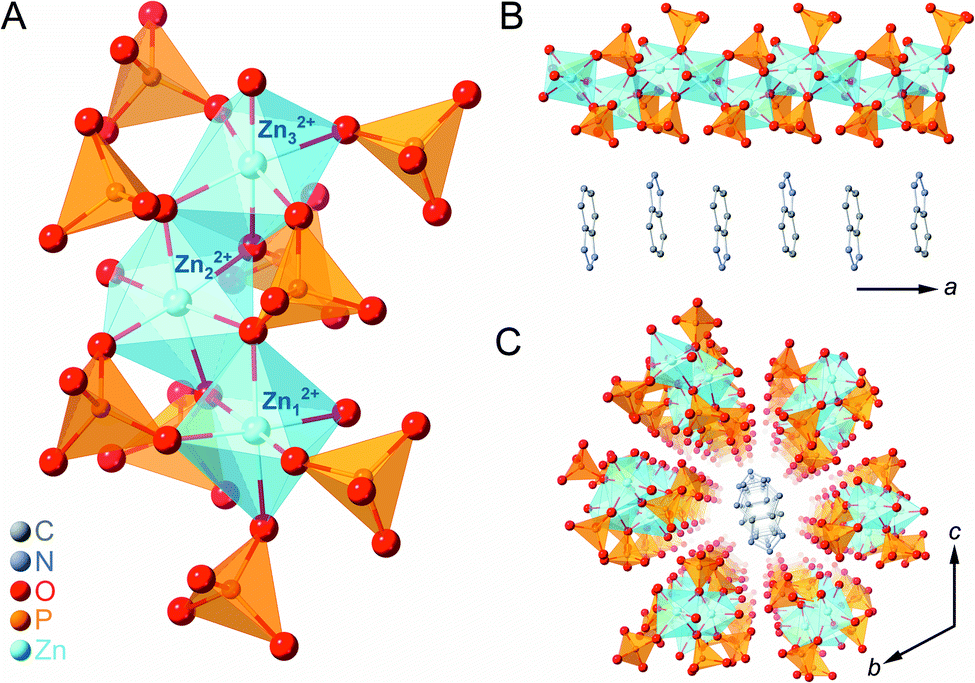 | ||
| Fig. 1 (A) Local coordination geometry in 1a. (B) Crystal structure of the one-dimensional (1D) chain along the a-axis. (C) Packing structure of 1a on the bc-plane. Zn, P, O, C, and N atoms are represented by light blue, orange, red, grey, and blue spheres, respectively. H atoms are omitted for clarity. | ||
The gram-scale synthesis of 1a was feasible via mechanical milling for 1 h followed by vacuum drying for 3.5 h to remove excess water molecules. Powder X-ray diffraction (PXRD) of 1a (Fig. S1†) demonstrated a pattern identical to the simulated SC-XRD pattern. The absence of residual free phosphoric acid in 1a was confirmed using both inductively coupled plasma emission spectroscopy (ICP-ES) and 31P magic-angle spinning (MAS) solid-state NMR (Fig. S2†).44 A P to Zn ratio (1![[thin space (1/6-em)]](https://www.rsc.org/images/entities/char_2009.gif) :1.97) slightly lower than the theoretical ratio (1:2) suggested the presence of a small amount of structural defects. All peaks in 31P NMR were located in the range of orthophosphate, suggesting that no condensation occurs during the mechanical synthesis.45–47 TGA of 1a showed a gradual weight loss due to the release of coordinated water at 100 °C (Fig. S4†). The total weight loss of dehydrated 1a is equivalent to the release of three coordinated water molecules (5.7 wt%). This dehydrated state is henceforth denoted as 1. A reversible structural change between 1a and 1 upon water adsorption and desorption was observed by PXRD (Fig. S5†).48–50 The release of each water molecule from the octahedral (Oh) coordination sphere caused the 1D chain structure to deform around the Zn2+ ion. Under ambient air, 1 converted to 1a by capturing atmospheric moisture.38
:1.97) slightly lower than the theoretical ratio (1:2) suggested the presence of a small amount of structural defects. All peaks in 31P NMR were located in the range of orthophosphate, suggesting that no condensation occurs during the mechanical synthesis.45–47 TGA of 1a showed a gradual weight loss due to the release of coordinated water at 100 °C (Fig. S4†). The total weight loss of dehydrated 1a is equivalent to the release of three coordinated water molecules (5.7 wt%). This dehydrated state is henceforth denoted as 1. A reversible structural change between 1a and 1 upon water adsorption and desorption was observed by PXRD (Fig. S5†).48–50 The release of each water molecule from the octahedral (Oh) coordination sphere caused the 1D chain structure to deform around the Zn2+ ion. Under ambient air, 1 converted to 1a by capturing atmospheric moisture.38
Crystal melting and glass formation
Differential thermal analysis of 1a by TGA (Fig. S4†) showed two endothermic peaks due to the release of coordinated water and crystal-to-liquid transformation and only the latter peak was observed in 1. DSC of 1 (Fig. 2A) showed an endothermic peak with an onset melting point (Tm) of 114 °C. Two minor endothermic peaks before that of the Tm were assigned to the dehydration of adsorbed water during the measurement setup.33 The Tm of 1 was 50 °C lower than that of the isostructure, [Zn3(H2PO4)6(H2O)3](benzimidazole), as BTA exhibits lower Tm and pKa values than those of benzimidazole.31,33 Additionally, no significant weight loss was seen at 120 °C after 12 h, confirming a stable liquid state (Fig. S6†). The liquid/molten state of 1 is henceforth referred to as 1m. The first cooling process in DSC confirmed the vitrification of 1m to a glassy state of 1 (denoted as 1g) that demonstrated a glass transition temperature (Tg) of 7.6 °C, exhibiting no Bragg diffraction, and was categorized as melt-quenched glass (MGQ) (Fig. S7†).34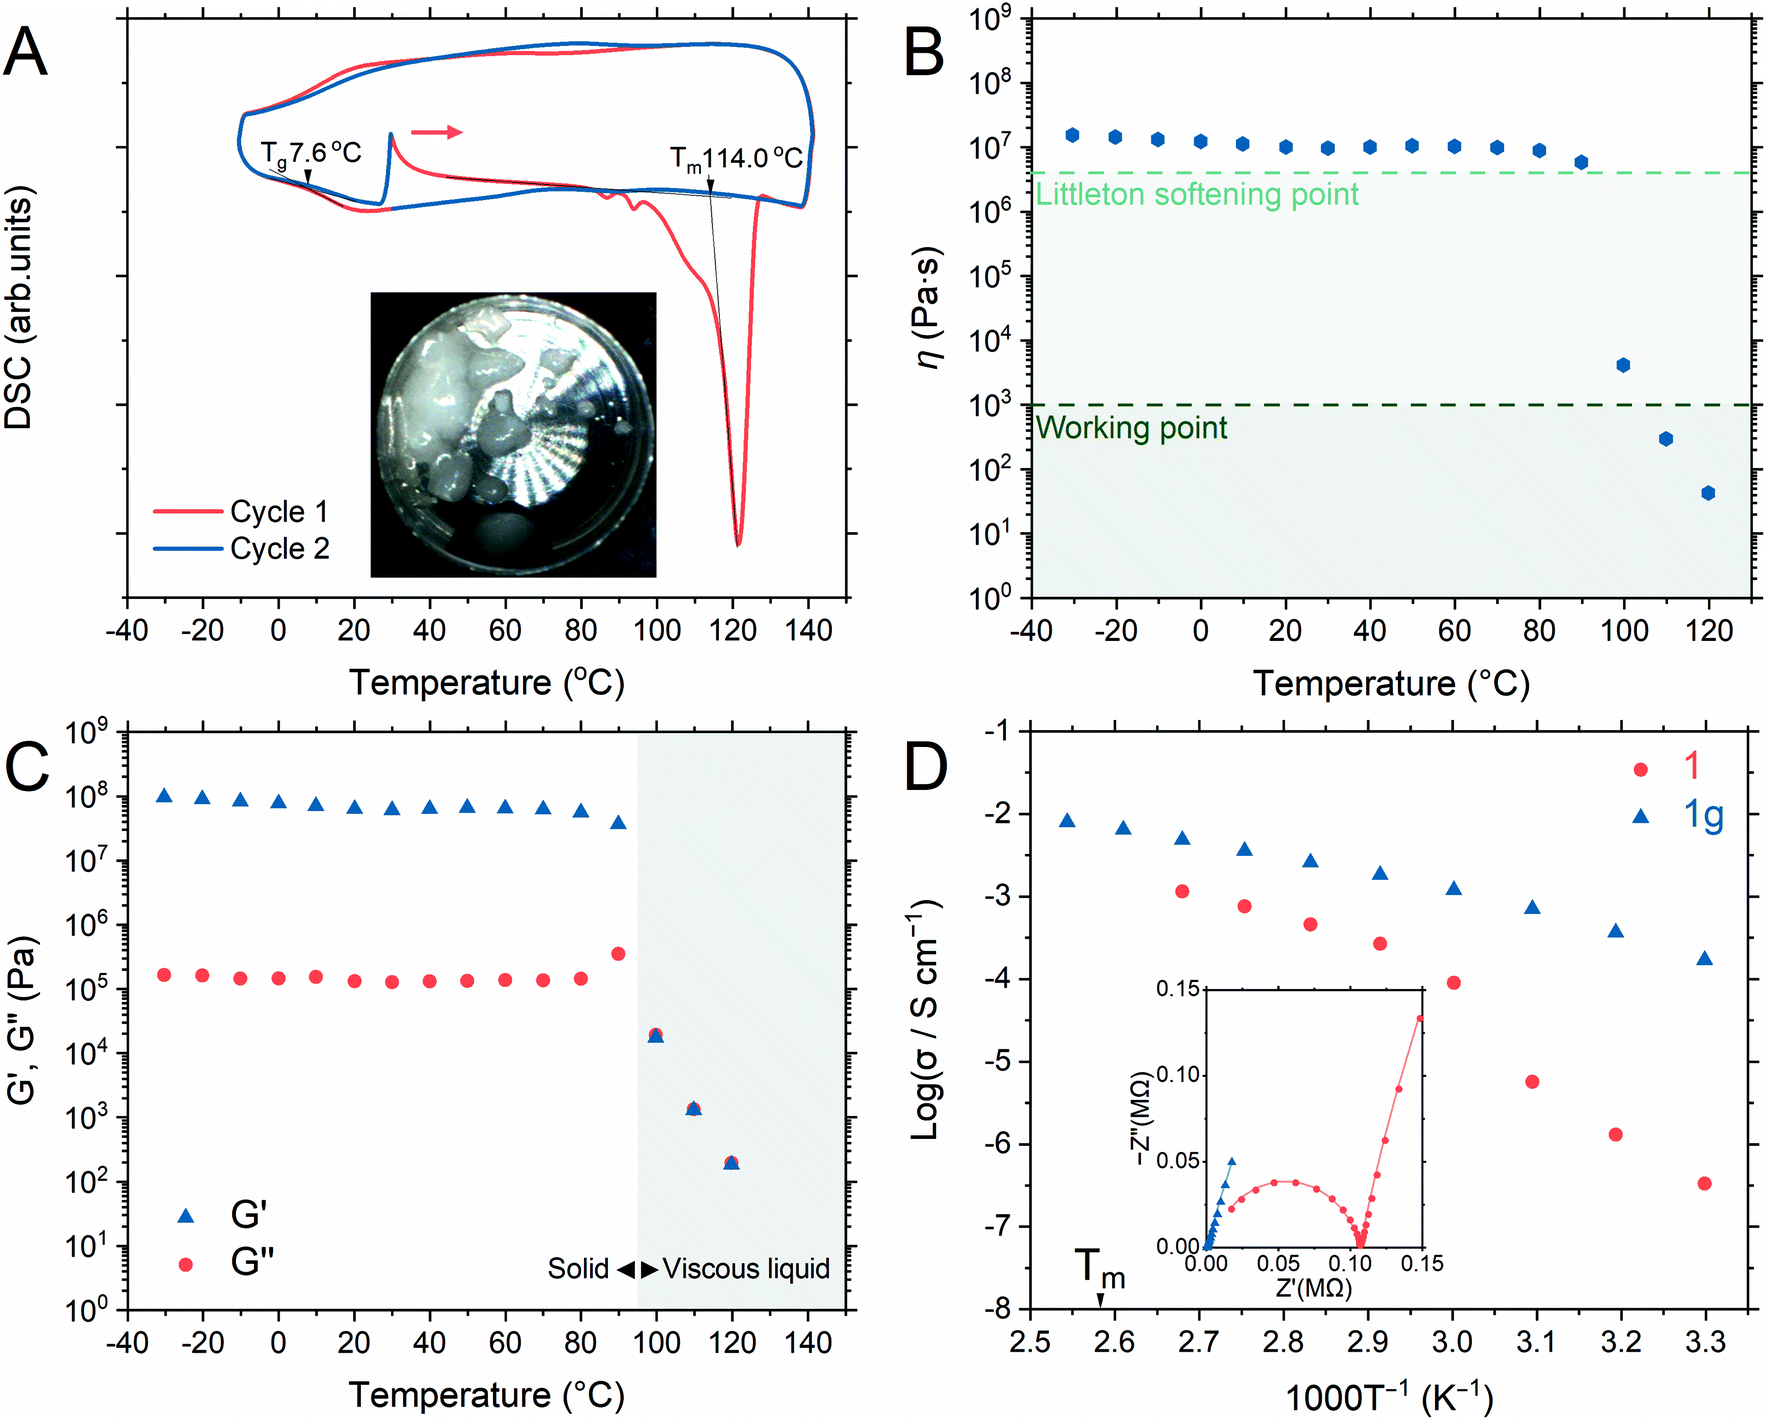 | ||
| Fig. 2 (A) First- (blue) and second-cycle (red) DSC profiles of 1 from −10 to 140 °C (begin with a heating step from 30 °C). The inset shows a photo of 1m at 140 °C. (B) Temperature-dependent viscosity of 1g. (C) DMA of 1g from −30 to 120 °C (heating rate of 2 °C min−1). The storage (G′) and loss (G′′) moduli were marked as (▲) and (●), respectively. (D) Arrhenius plots of the anhydrous conductivity of 1 (●) and 1g (▲) under an Ar atmosphere. The inset shows the Nyquist plot of 1 (●) and 1g (▲) at 50 °C. | ||
DMA and viscosity evaluation of 1g further determined its processing ability, where its viscosity (Fig. 2B) was observed above the Littleton softening point (106.6 Pa s) from −30 to 90 °C until it sharply decreased below the working point regime (103 Pa s) above 100 °C. The working point defines the viscosity regime in which the viscosity of a substance is equivalent to that of soda–lime–silica glass above 1100 °C (suitable for industrial forming processes).51 The storage modulus (G′) dominated the loss modulus (G′′) from −30 to 90 °C, verifying the solid character of 1g (Fig. 2C). Immediate reduction of G′ at 100 °C represents the softening of 1g, and the G′/G′′ crossover indicates the range in which 1g starts to behave like a viscous liquid.31,52
Anhydrous H+ conductivity
We measured the H+ conductivity of 1 and 1gvia variable-temperature alternating current (AC) impedance under an Ar atmosphere to exclude the influence of water molecules (Fig. 2D and S9†). The Nyquist plots were fitted with a single impedance response corresponding to the bulk resistance without the grain-boundary region.52,53 The conductivity of 1 was measured from 30 to 100 °C, where the crystalline phase of 1 was preserved. We observed conductivity values of 3.3 × 10⁻⁷ S cm−1 and 9.0 × 10⁻⁵ S cm−1 at 30 and 60 °C, respectively. The conductivity value increased rapidly upon heating, reaching 1.2 × 10⁻³ S cm−1 at 100 °C. The activation energy of 1 from 30 to 60 °C was 1.22 eV. Above 60 °C, the Arrhenius plot flattened and the activation energy reduced to 0.57 eV. Utilizing BTA with its low pKa in 1 provided higher conductivity values than those of the isostructure [Zn3(H2PO4)6](HBim) at 30 °C (1.2 × 10⁻⁷ S cm−1) and 60 °C (1.5 × 10⁻⁵ S cm−1).38To highlight the advantage of glass transformation on ionic conductivity, we prepared a monolith (1g) via melt-quenching directly into the electrochemical cell for impedance analysis. Upon the crystalline-to-glassy state transformation, only the bulk impedance response pattern was obtained (Fig. S9†) and it was identical to that of 1a in the higher temperature range. The Arrhenius plot (Fig. 2D) shows two different activation energy regimes: 0.59 eV between 30 and 60 °C and 0.39 eV from 60 to 120 °C. At 30 °C, 1g exhibited a conductivity value of 3.3 × 10⁻⁴ S cm−1, which increased to 4.9 × 10⁻³ S cm−1 and 6.5 × 10⁻³ S cm−1 at 100 and 110 °C, respectively. A conductivity value of 8.0 × 10⁻³ was achieved at 120 °C (molten state, 1m). Long-term conductivity retention was also evaluated. After 12 h, less than 4% and 10% loss in conductivity was observed at 100 and 120 °C, respectively (Fig. S10†). The contribution of the ions of interest to the total current can be distinguished via the H+ transport number (transference number) measurements.52,54 The transport numbers of most aqueous and ionic liquid electrolytes are lower than 0.6.54–56 The transport number of 1m was elucidated via electromotive force (EMF) measurements, which were conducted for different hydrogen partial pressure (−ln(P1/P2) values of 0.22, 0.51, 0.69, 0.92, and 1.61) at 120 °C (Fig. S11†).57 According to eqn S1 (ESI),† the H+ transference number of 1g is 1.0, indicating an ideal single-ion H+ conductivity. The absence of anion mobility suggests that the coordination networks are retained even in the molten state.31,58
Proton dynamics in 1 and 1g
The H+ conductivity would be dominated by either the phosphate or BTA dynamics; therefore, we utilized variable-temperature 1H MAS solid-state NMR to study their mobilities (Fig. 3). The peaks from 8.1–8.5 and 5.8–6.1 ppm were assigned to the phosphate and BTA H+, respectively.44,52 The substantial narrowing and intensifying of the peaks between 50 and 75 °C suggested a significant increase in both the phosphate and BTA dynamics. The molecular motion of BTA initiates at the temperature above 50 °C as the BTA peaks are barely distinguishable at 25 and 50 °C (Fig. 3A).38 The H+ mobilities of 1g and 1 were compared at 25 and 50 °C as well as at 50 and 75 °C, where the narrower and more intense peaks of 1g demonstrated its higher H+ mobility than that of 1 (Fig. 3B). This higher degree of H+ mobility was promoted by a disordered structure formed in 1g. Furthermore, the BTA dynamics were observable in 1g even at temperatures lower than 60 °C, which agrees with the impedance response and lower activation energy of 1g. Additionally, hydrogen-bond formations are indicated by downfield shifts.59 | ||
| Fig. 3 Variable-temperature 1H magic-angle spinning (MAS) solid-state NMR spectra (MAS 8 kHz) of (A) 1 and (B) 1g from 25 to 100 °C. | ||
Electrode–electrolyte interface
Discontinuities along the heterogeneous interface inhibit practical applications of solid-state electrolytes.17 Therefore, we are interested in the H+-conductivity integration and moldability of 1g as a grain boundary-free immersive solid electrolyte (Fig. 4A). Additionally, the lower Tm of 1 would prevent the anode/cathode materials from degrading during the fabrication process.8,9,12,13 A carbon fiber (CF) electrode was pressed to 1m at 120 °C and quenched to room temperature to provide the electrode–electrolyte interface (CF–1g). Cross-sectional scanning electron microscopy (SEM) images of CF–1g were collected (Fig. 4B, S12A, and B†), where neither a distinguishable solid–electrolyte interface nor grain boundaries were observed.60 Optimum contact between the CF layer and 1g domain was achieved as 1m can penetrate the CF, generating a fully immersed environment. Fig. 4C shows a cross-sectional SEM reference image of the pristine CF. Energy-dispersive X-ray (EDX) mapping (Fig. 4D–G) further elucidated the position of the CF electrode (intense C) with homogeneously distributed Zn, P, and O signals. To amplify the benefits of melt-quenching glass, we re-examined the morphological alteration of CF–1g after recrystallization. 1g undergoes the recrystallization process upon humidity exposure and transforms back to 1a. As confirmed by PXRD (Fig. S13†), atmospheric humidity (65% relative humidity) at room temperature (25 °C) is sufficient for the recrystallization to occur within 4 h. Fig. S12C and D† revealed grain boundaries and fractures formed throughout the recrystallized 1g matrix, especially in the region where the CF and 1g co-exist.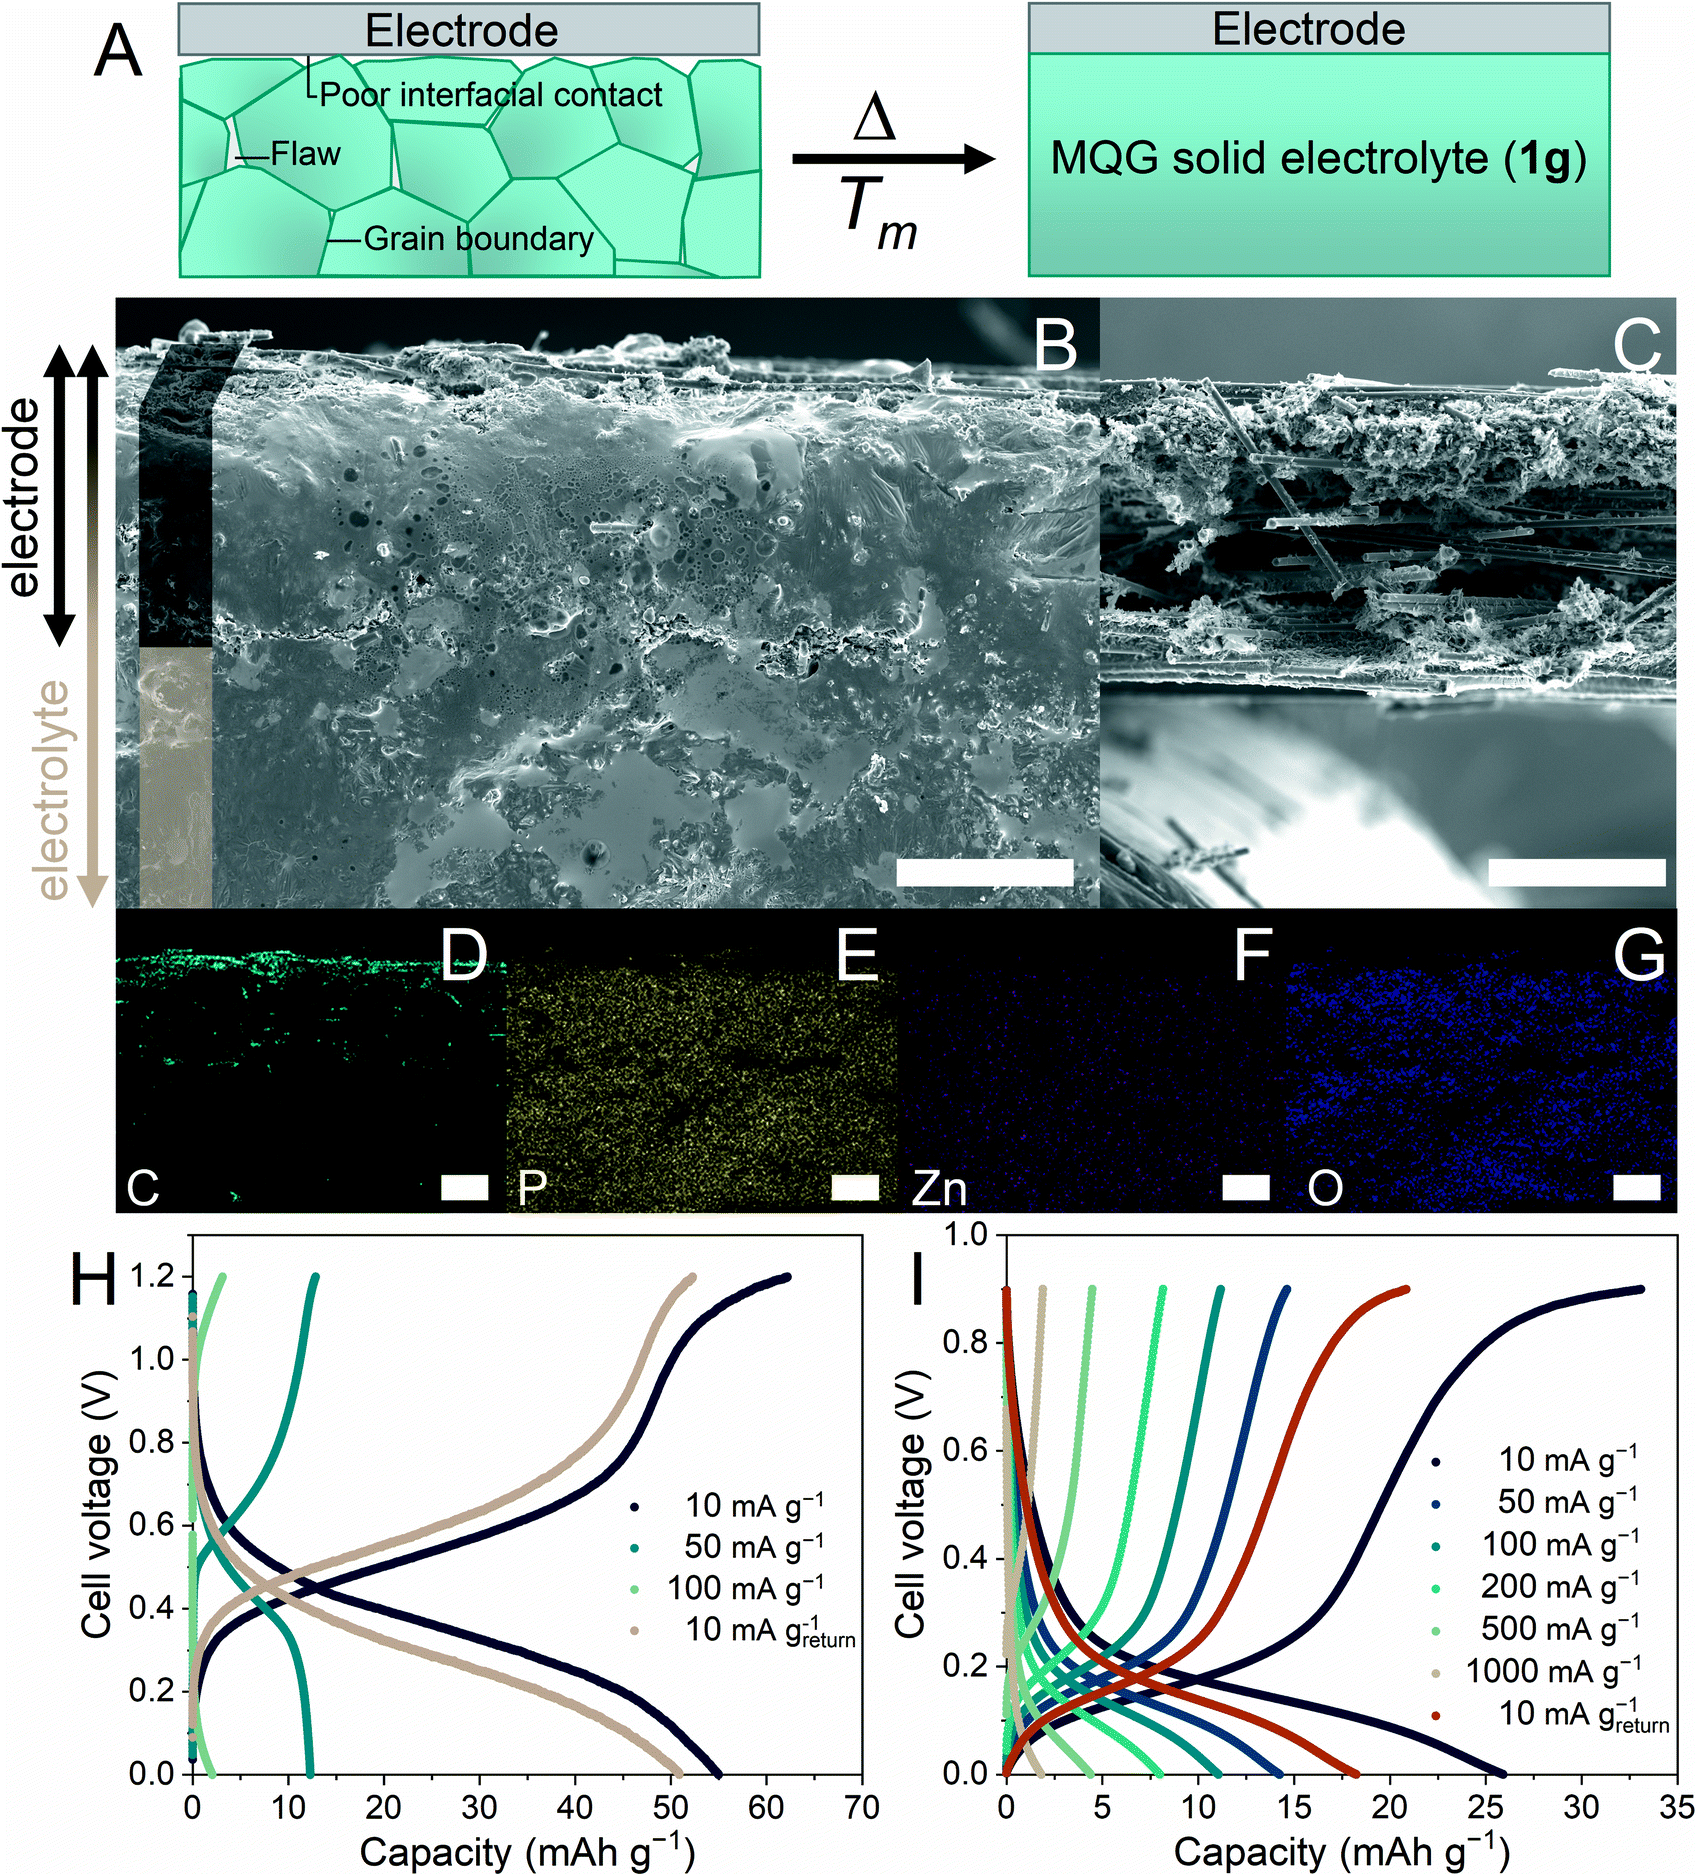 | ||
| Fig. 4 (A) Schematic representation of the interfaces/flaws within the polycrystalline solid electrolyte (left) and MQG solid electrolyte proposed in this work (1g). Cross-sectional scanning electron microscopy (SEM) images (×150 magnification) of (B) the electrode–solid-state electrolyte interface (CF–1g) and (C) CF electrode. Scale bar = 150 μm. Energy-dispersive X-ray (EDX) mapping for (D) C, (E) P, (F) Zn, and (G) O. Scale bar = 100 μm. Full-cell charge–discharge profiles utilizing 1g as a solid-state electrolyte at (H) 25 °C and (I) 100 °C. | ||
Solid-state H+ battery under anhydrous conditions
Adequately high H+ conductivity, single-ion conductivity, low processing temperatures, and thermal/electrochemical stabilities motivated us to apply 1g as a solid electrolyte for H+ batteries. MoO3 and CuII[FeIII(CN)6]2/3·4H2O (CuFe-TBA) were selected as a model cathode and anode, respectively.10,12 As a reference, we also evaluated a full-cell configuration in 2 M H2SO4 solution at 25 °C. It exhibited a discharge capacity of 35.8 mA h g−1 at 100 mA g−1 (Fig. S14†). The specific capacity was calculated based on the cathode mass. The distance between the electrodes was ca. 1 cm.12 The solid-state H+ battery was prepared by immersing both electrodes (1 cm separations) in 1m at 120 °C under an Ar atmosphere, where subsequent quenching to room temperature gave the 1g electrolyte. Fig. 4H and S15A† show the charge–discharge profiles (from 0 to 1.2 V) and rate performance evaluation of solid-state H+ batteries under an Ar atmosphere utilizing the 1g electrolyte at 25 °C. The highest discharge capacity was 55.4 mA h g−1 at 10 mA g−1. Another advantage the 1g-electrolyte system has over the aqueous system is its large operating-temperature range. The elevated-temperature H+ battery was evaluated at 100 and 110 °C under an Ar atmosphere (Fig. 4I and S15C†) and the redox potentials of both electrodes reduced, corresponding to the change in free energy.61,62 As shown in Fig. S15B and D,† rate performances improved significantly as the ionic conductivity of 1g was enhanced.2 In a high-temperature regime, electrodes would show an excessive self-discharge as well as a thermal structural distortion limiting the protonation/deprotonation processes, causing a net loss of capacity. For instance, in a Li-ion battery, capacity fading was observed in Li3V2(PO4)3 as elevated temperature promotes a larger structural distortion between Li3V2(PO4)3 and V2(PO4)3 limiting the re-insertion of Li+.63 Additionally, 76% of the original capacity was retained after 1000 cycles of the charge–discharge process at 110 °C (Fig. S16†). We also attempted to demonstrate a solid-state H+ battery using crystalline 1 with a similar configuration and an identical anode and cathode. However, charging and discharging processes were not possible at 25 °C nor under low-current (10 mA g−1) conditions, even though the thickness of this electrolyte was ten times smaller than that of the 1g electrolyte. This emphasizes the importance of interface engineering that endows soft glass materials with high H+ conductivity and moldability.17,20,21Conclusions
We synthesized a new H+ conductive CP, [Zn3(H2PO4)6(H2O)3](BTA), where the dehydrated state (1) integrated promising anhydrous H+ conductivity (1.2 × 10⁻³ S cm−1 at 100 °C) and relatively low melting point (114 °C). The melt-quenched glass of 1 (1g) enhanced the H+ dynamics of both phosphate and BTA, resulting in a H+ conductivity value of 8.0 × 10⁻³ S cm−1, a H+ transference number of 1.0, and a viscosity of 42.8 Pa s at 120 °C. The coexistence of high conductivity, transport number, and moldability of 1g, as well as its flawless interface, encouraged us to implement it in solid-state H+ battery applications. A solid-state H+ battery with an operating temperature range above room temperature (25–110 °C) was demonstrated for the first time. The tuning capability of the CP glass H+ conductivity, working temperature, and softness could provide H+ batteries with wider applications.Author contributions
S. H. designed the project, and N. M. and A. Y. synthesized the compounds. S. K. collected and analyzed solid-state NMR measurements. N. M. collected and analyzed SC-XRD, PXRD, TGA, SEM, DSC, ICP-ES, DMA, FTIR, conductivity and transport number measurements and battery evaluation. S. H. and N. M. wrote the paper.Conflicts of interest
There are no conflicts to declare.Acknowledgements
The work was supported by the Japan Society for the Promotion of Science (JSPS) for a Grant-in-Aid for Scientific Research (B) (JP18H02032), Challenging Research (Exploratory) (JP19K22200) from the Ministry of Education, Culture, Sports, Science and Technology, Japan, and the Adaptable and Seamless Technology Transfer Program through Target-driven R&D (A-STEP) from the Japan Science and Technology, Japan. N. M. acknowledges the Japanese Government (MEXT) scholarship.References
- R. Pohl, A. Antognini, F. Nez, F. D. Amaro, F. Biraben, J. M. R. Cardoso, D. S. Covita, A. Dax, S. Dhawan, L. M. P. Fernandes, A. Giesen, T. Graf, T. W. Hänsch, P. Indelicato, L. Julien, C.-Y. Kao, P. Knowles, E.-O. Le Bigot, Y.-W. Liu, J. A. M. Lopes, L. Ludhova, C. M. B. Monteiro, F. Mulhauser, T. Nebel, P. Rabinowitz, J. M. F. dos Santos, L. A. Schaller, K. Schuhmann, C. Schwob, D. Taqqu, J. F. C. A. Veloso and F. Kottmann, Nature, 2010, 466, 213–216 CrossRef CAS.
- K.-D. Kreuer, Chem. Mater., 1996, 8, 610–641 CrossRef CAS.
- K. Nueangnoraj, T. Tomai, H. Nishihara, T. Kyotani and C.-J. Cai, Carbon, 2016, 107, 831–836 CrossRef CAS.
- R. Emanuelsson, M. Sterby, M. Strømme and M. Sjödin, J. Am. Chem. Soc., 2017, 139, 4828–4834 CrossRef CAS PubMed.
- M. Armand and J. M. Tarascon, Nature, 2008, 451, 652–657 CrossRef CAS.
- X. Ji, Energy Environ. Sci., 2019, 12, 3203–3224 RSC.
- G. Liang, F. Mo, X. Ji and C. Zhi, Nat. Rev. Mater., 2021, 6, 109–123 CrossRef CAS.
- C. Strietzel, M. Sterby, H. Huang, M. Strømme, R. Emanuelsson and M. Sjödin, Angew. Chem., Int. Ed., 2020, 59, 9631–9638 CrossRef CAS.
- H. Jiang, J. J. Hong, X. Wu, T. W. Surta, Y. Qi, S. Dong, Z. Li, D. P. Leonard, J. J. Holoubek, J. C. Wong, J. J. Razink, X. Zhang and X. Ji, J. Am. Chem. Soc., 2018, 140, 11556–11559 CrossRef CAS PubMed.
- X. Wang, Y. Xie, K. Tang, C. Wang and C. Yan, Angew. Chem., Int. Ed., 2018, 57, 11569–11573 CrossRef CAS PubMed.
- P. Lemaire, O. Sel, D. Alves Dalla Corte, A. Iadecola, H. Perrot and J.-M. Tarascon, ACS Appl. Mater. Interfaces, 2020, 12, 4510–4519 CrossRef CAS PubMed.
- X. Wu, J. J. Hong, W. Shin, L. Ma, T. Liu, X. Bi, Y. Yuan, Y. Qi, T. W. Surta, W. Huang, J. Neuefeind, T. Wu, P. A. Greaney, J. Lu and X. Ji, Nat. Energy, 2019, 4, 123–130 CrossRef CAS.
- X. Wu, S. Qiu, Y. Xu, L. Ma, X. Bi, Y. Yuan, T. Wu, R. Shahbazian-Yassar, J. Lu and X. Ji, ACS Appl. Mater. Interfaces, 2020, 12, 9201–9208 CrossRef CAS PubMed.
- L. Yan, J. Huang, Z. Guo, X. Dong, Z. Wang and Y. Wang, ACS Energy Lett., 2020, 5, 685–691 CrossRef CAS.
- H. Jiang, W. Shin, L. Ma, J. J. Hong, Z. Wei, Y. Liu, S. Zhang, X. Wu, Y. Xu, Q. Guo, M. A. Subramanian, W. F. Stickle, T. Wu, J. Lu and X. Ji, Adv. Energy Mater., 2020, 10, 2000968 CrossRef CAS.
- X. Lin, M. Salari, L. M. R. Arava, P. M. Ajayan and M. W. Grinstaff, Chem. Soc. Rev., 2016, 45, 5848–5887 RSC.
- Q. Zhao, S. Stalin, C.-Z. Zhao and L. A. Archer, Nat. Rev. Mater., 2020, 5, 229–252 CrossRef CAS.
- J. Evans, C. A. Vincent and P. G. Bruce, Polymer, 1987, 28, 2324–2328 CrossRef CAS.
- S. S. Park, Y. Tulchinsky and M. Dincă, J. Am. Chem. Soc., 2017, 139, 13260–13263 CrossRef CAS PubMed.
- J. van den Broek, S. Afyon and J. L. M. Rupp, Adv. Energy Mater., 2016, 6, 1600736 CrossRef.
- X. Han, Y. Gong, K. Fu, X. He, G. T. Hitz, J. Dai, A. Pearse, B. Liu, H. Wang, G. Rubloff, Y. Mo, V. Thangadurai, E. D. Wachsman and L. Hu, Nat. Mater., 2017, 16, 572–579 CrossRef CAS PubMed.
- P. G. Bruce and A. West, J. Electrochem. Soc., 1983, 130, 662 CrossRef CAS.
- Y. Inaguma, C. Liquan, M. Itoh, T. Nakamura, T. Uchida, H. Ikuta and M. Wakihara, Solid State Commun., 1993, 86, 689–693 CrossRef CAS.
- R. Murugan, V. Thangadurai and W. Weppner, Angew. Chem., Int. Ed., 2007, 46, 7778–7781 CrossRef CAS PubMed.
- J. A. Dawson, P. Canepa, T. Famprikis, C. Masquelier and M. S. Islam, J. Am. Chem. Soc., 2018, 140, 362–368 CrossRef CAS PubMed.
- S. Horike, D. Umeyama and S. Kitagawa, Acc. Chem. Res., 2013, 46, 2376–2384 CrossRef CAS PubMed.
- T. Yamada, K. Otsubo, R. Makiura and H. Kitagawa, Chem. Soc. Rev., 2013, 42, 6655–6669 RSC.
- P. Ramaswamy, N. E. Wong and G. K. H. Shimizu, Chem. Soc. Rev., 2014, 43, 5913–5932 RSC.
- D.-W. Lim and H. Kitagawa, Chem. Rev., 2020, 120, 8416–8467 CrossRef CAS PubMed.
- T. Inada, T. Kobayashi, N. Sonoyama, A. Yamada, S. Kondo, M. Nagao and R. Kanno, J. Power Sources, 2009, 194, 1085–1088 CrossRef CAS.
- D. Umeyama, S. Horike, M. Inukai, T. Itakura and S. Kitagawa, J. Am. Chem. Soc., 2015, 137, 864–870 CrossRef CAS PubMed.
- T. D. Bennett, Y. Yue, P. Li, A. Qiao, H. Tao, N. G. Greaves, T. Richards, G. I. Lampronti, S. A. T. Redfern, F. Blanc, O. K. Farha, J. T. Hupp, A. K. Cheetham and D. A. Keen, J. Am. Chem. Soc., 2016, 138, 3484–3492 CrossRef CAS PubMed.
- T. D. Bennett and S. Horike, Nat. Rev. Mater., 2018, 3, 431–440 CrossRef.
- S. Horike, S. S. Nagarkar, T. Ogawa and S. Kitagawa, Angew. Chem., Int. Ed., 2020, 59, 2–15 CrossRef PubMed.
- W. Chen, S. Horike, D. Umeyama, N. Ogiwara, T. Itakura, C. Tassel, Y. Goto, H. Kageyama and S. Kitagawa, Angew. Chem., Int. Ed., 2016, 55, 5195–5200 CrossRef CAS PubMed.
- Y. Ohara, A. Hinokimoto, W. Chen, T. Kitao, Y. Nishiyama, Y.-l. Hong, S. Kitagawa and S. Horike, Chem. Commun., 2018, 54, 6859–6862 RSC.
- S. Horike, D. Umeyama, M. Inukai, T. Itakura and S. Kitagawa, J. Am. Chem. Soc., 2012, 134, 7612–7615 CrossRef CAS PubMed.
- D. Umeyama, S. Horike, M. Inukai and S. Kitagawa, J. Am. Chem. Soc., 2013, 135, 11345–11350 CrossRef CAS PubMed.
- S. Horike, W. Chen, T. Itakura, M. Inukai, D. Umeyama, H. Asakura and S. Kitagawa, Chem. Commun., 2014, 50, 10241–10243 RSC.
- D. Umeyama, N. P. Funnell, M. J. Cliffe, J. A. Hill, A. L. Goodwin, Y. Hijikata, T. Itakura, T. Okubo, S. Horike and S. Kitagawa, Chem. Commun., 2015, 51, 12728–12731 RSC.
- T. D. Bennett, J.-C. Tan, Y. Yue, E. Baxter, C. Ducati, N. J. Terrill, H. H. M. Yeung, Z. Zhou, W. Chen, S. Henke, A. K. Cheetham and G. N. Greaves, Nat. Commun., 2015, 6, 8079 CrossRef CAS PubMed.
- N. Agmon, Chem. Phys. Lett., 1995, 244, 456–462 CrossRef CAS.
- D. Umeyama, S. Horike, M. Inukai, T. Itakura and S. Kitagawa, J. Am. Chem. Soc., 2012, 134, 12780–12785 CrossRef CAS PubMed.
- M. Inukai, S. Horike, T. Itakura, R. Shinozaki, N. Ogiwara, D. Umeyama, S. Nagarkar, Y. Nishiyama, M. Malon, A. Hayashi, T. Ohhara, R. Kiyanagi and S. Kitagawa, J. Am. Chem. Soc., 2016, 138, 8505–8511 CrossRef CAS PubMed.
- S. Hayashi and K. Hayamizu, Bull. Chem. Soc. Jpn., 1989, 62, 3061–3068 CrossRef CAS.
- P. Reinert, N. Z. Logar, J. Patarin and V. Kaucic, Eur. J. Solid State Inorg. Chem., 1998, 35, 373–387 CrossRef CAS.
- T. Akamatsu, T. Kasuga and M. Nogami, Adv. Mater. Res., 2007, 15–17, 327–332 CAS.
- S. Horike, S. Shimomura and S. Kitagawa, Nat. Chem., 2009, 1, 695 CrossRef CAS PubMed.
- S. Henke, A. Schneemann, A. Wütscher and R. A. Fischer, J. Am. Chem. Soc., 2012, 134, 9464–9474 CrossRef CAS PubMed.
- J. Canivet, A. Fateeva, Y. Guo, B. Coasne and D. Farrusseng, Chem. Soc. Rev., 2014, 43, 5594–5617 RSC.
- J. E. Shelby, Introduction to glass science and technology, Royal Society of Chemistry, Cambridge, UK, 2nd edn, 2005 Search PubMed.
- T. Ogawa, K. Takahashi, S. S. Nagarkar, K. Ohara, Y.-l. Hong, Y. Nishiyama and S. Horike, Chem. Sci., 2020, 11, 5175–5181 RSC.
- J. R. M. E. Barsoukov, Impedance Spectroscopy Theory, Experiment, and Applications, John Wiley & Sons, NJ, USA, 2nd edn, 2005 Search PubMed.
- P. V. Wright, MRS Bull., 2002, 27, 597–602 CrossRef CAS.
- H. Nakamoto, A. Noda, K. Hayamizu, S. Hayashi, H.-o. Hamaguchi and M. Watanabe, J. Phys. Chem. C, 2007, 111, 1541–1548 CrossRef CAS.
- S.-Y. Lee, T. Yasuda and M. Watanabe, J. Power Sources, 2010, 195, 5909–5914 CrossRef CAS.
- T. Norby, Solid State Ionics, 1988, 28–30, 1586–1591 CrossRef.
- R. Gaillac, P. Pullumbi, K. A. Beyer, K. W. Chapman, D. A. Keen, T. D. Bennett and F.-X. Coudert, Nat. Mater., 2017, 16, 1149–1154 CrossRef CAS PubMed.
- T. L. Greaves and C. J. Drummond, Chem. Rev., 2015, 115, 11379–11448 CrossRef CAS PubMed.
- A. Hayashi, K. Noi, A. Sakuda and M. Tatsumisago, Nat. Commun., 2012, 3, 856 CrossRef.
- S. G. Bratsch, J. Phys. Chem. Ref. Data, 1989, 18, 1–21 CrossRef CAS.
- A. J. Bard and L. R. Faulkner, Electrochemical Methods: Fundamentals and Applications, Wiley, 2nd edn, 2000 Search PubMed.
- Y. Q. Qiao, J. P. Tu, X. L. Wang and C. D. Gu, J. Power Sources, 2012, 199, 287–292 CrossRef CAS.
Footnote |
| † Electronic supplementary information (ESI) available: Experimental details, PXRD, solid PXRD, 31P MAS NMR, TG, and FTIR results, Nyquist plots, long-term conductivity measurements, transport number measurements, cross-sectional SEM images, and a solid state H+ battery. CCDC 2044808. For ESI and crystallographic data in CIF or other electronic format see DOI: 10.1039/d1sc00392e |
| This journal is © The Royal Society of Chemistry 2021 |