
 Open Access Article
 This Open Access Article is licensed under a Creative Commons Attribution-Non Commercial 3.0 Unported Licence
Clicking of organelle-enriched probes for fluorogenic imaging of autophagic and endocytic fluxes†
Xianjun
Liu
 ,
Mei-Hao
Xiang
,
Wen-Jing
Zhou
,
Fenglin
Wang
*,
Xia
Chu
and
Jian-Hui
Jiang
*
,
Mei-Hao
Xiang
,
Wen-Jing
Zhou
,
Fenglin
Wang
*,
Xia
Chu
and
Jian-Hui
Jiang
*
State Key Laboratory of Chemo/Biosensing & Chemometrics, College of Chemistry & Chemical Engineering, Hunan University, Changsha 410082, China. E-mail: jianhuijiang@hnu.edu.cn; fengliw@hnu.edu.cn
First published on 19th March 2021
Abstract
Autophagy and endocytosis are essential in regulating cellular homeostasis and cancer immunotherapeutic responses. Existing methods for autophagy and endocytosis imaging are susceptible to cellular micro-environmental changes, and direct fluorogenic visualization of their fluxes remains challenging. We develop a novel strategy via clicking of organelle-enriched probes (COP), which comprises a pair of trans-cyclooctenol (TCO) and tetrazine probes separately enriched in lysosomes and mitochondria (in autophagy) or plasma membrane (in endocytosis). These paired probes are merged and boost a fluorogenic click reaction in response to autophagic or endocytic flux that ultimately fuses mitochondria or plasma membrane into lysosomes. We demonstrate that this strategy enables direct visualization of autophagic and endocytic fluxes, and confer insight into correlation of autophagic or endocytic flux to cell surface expression of immunotherapeutic targets such as MHC-I and PD-L1. The COP strategy provides a new paradigm for imaging autophagic and endocytic fluxes, and affords potential for improved cancer immunotherapy using autophagy or endocytosis inhibitors.
Introduction
Cellular functions are tightly regulated through information and content exchange fluxes between different organelles. Autophagy and endocytosis are two pivotal pathways that are essential for cellular homeostasis,1 signal transduction2 and immunity.3 Both autophagic and endocytic fluxes end with lysosomes which fuse with the autophagosomes or late endosomes for cargo degradation and nutrient supply. Although autophagic and endocytic fluxes share some common proteins and tethers, they possess fundamentally distinct molecular pathways.4,5 Abnormal autophagic and endocytic fluxes are implicated in the initiation and progression of various diseases including cancer,6 neurodegeneration7 and immune diseases.8 More recently, it has been disclosed that autophagic and endocytic fluxes govern the abundance of membrane proteins, such as major histocompatibility complex class I (MHC-I) and programmed cell death ligand 1 (PD-L1), that play critical roles in cancer immunotherapy.9–11 Low abundance of these proteins is closely implicated in cancer resistance to immune check-point blocked (ICB) therapy and cellular immunotherapy.12–14 Therefore, monitoring of autophagic and endocytic fluxes can provide insight for disease diagnosis, and correlation of autophagic or endocytic flux with expression levels of cell surface proteins has significant therapeutic prospects, especially for cancer therapy.15,16Fluorescence probes hold great potential to investigate the autophagic and endocytic processes with high spatiotemporal resolution. Genetically encoded fluorescent proteins fused to autophagosome or endo-lysosome biomarkers have provided useful probes to monitor the autophagic or endocytic flux.17–20 Because of inferior photo-physical properties of fluorescent proteins, small molecule fluorescent probes afford a more versatile tool for monitoring autophagic and endocytic fluxes. Fluorescent probes allowing detection of autophagy and endocytosis has been engineered using microenvironment-sensitive fluorophores that display fluorescence changes in response to pH decreases21–24 and polarity shifts.25,26 A supramolecular host–guest strategy has been constructed for visualization of the autophagosome–lysosome fusion process in autophagic flux.27 However, current probes are not bioorthogonal and exhibit high susceptibility to cellular microenvironmental variations such as pH, polarity and co-existing interferents.
Bioorthogonal click reactions are typically two-component reactions that can proceed specifically and efficiently in physiological conditions.28 The click chemistry affords the possibility of developing fluorogenic reactions in which non-fluorescent reactants are activated to deliver intense fluorescence signals.29 Among the established bioorthogonal toolbox, the inverse electron demand Diels–Alder (IEDDA) cycloaddition between tetrazine-conjugated fluorophores and trans-cyclooctenol (TCO) has demonstrated superior reaction kinetics, high yield and large turn-on fluorescence ratios.30 These tetrazine and TCO probes have created useful platforms for biomolecular labeling, molecular imaging and protein or prodrug activation.31–34 To our knowledge, bioorthogonal click chemistry has not been explored for developing fluorescent probes that enable specific imaging of autophagic and endocytic fluxes.
Herein, we develop a novel strategy via clicking of organelle-enriched probes (COP) that enables fluorogenic imaging autophagic and endocytic fluxes. The COP strategy comprises a pair of TCO and tetrazine probes, with TCO probes enriched in lysosomes and tetrazine probes accumulated in two distinct organelles, mitochondria in autophagy or plasma membrane in endocytosis. We envision that the paired probes enriched in specific organelles could boost the IEDDA reaction in response to autophagic or endocytic flux that ultimately fuses mitochondria or plasma membrane into lysosomes. Motivated by this hypothesis, we engineer the TCO probe tethered with a lysosome-localization moiety and the tetrazine probe conjugated to a targeting moiety for accumulation in mitochondria or plasma membrane. We demonstrate that the mitochondrion-targeting tetrazine probe and the lysosome-localized TCO probe allow fluorogenic imaging of autophagic flux with high contrast, specific to the complete autophagic flux associated with fusion of mitochondria into lysosomes. We further show that the plasma membrane-localized tetrazine probe and the lysosome-targeting TCO probe allow specific and sensitive imaging of the endocytic flux. The COP strategy is further exploited to correlate the autophagic or endocytic flux to the expression of cancer immunotherapeutic targets at cell surfaces to elucidate the modulating roles of the flux in cancer immunotherapy. The strategy affords a new paradigm for imaging of autophagic and endocytic fluxes, expanding the prospects of autophagy and endocytosis in clinical theranostics.
Results and discussion
Probe design and characterization
The COP strategy comprises the engineering of a pair of tetrazine and TCO probes separately localized in two distinct organelles involved in autophagic or endocytic flux (Fig. 1A). A lysosome-targeting TCO probe, Lyso-BODIPY-TCO, is designed by coupling boron-dipyrromethene (BODIPY) with a piperazine and a TCO moiety. The Lyso-BODIPY-TCO probe is non-fluorescent at neutral pH, and becomes highly fluorescent after localization in acidic lysosomes. Two tetrazine probes are engineered with different targeting moieties. The mitochondria-targeting probe, Mito-Rh-Tz, is designed by conjugating a tetrazine moiety to rhodamine. The plasma membrane anchoring probe, Mem-Rh-Tz, is designed by conjugating a tetrazine moiety to rhodamine with two cholesterol units. Both tetrazine–rhodamine probes, Mito-Rh-Tz and Mem-Rh-Tz, are nonemissive because of fluorescence quenching by the tetrazine moiety via a FRET mechanism.30 Upon reacting with the Lyso-BODIPY-TCO probe, the tetrazine–rhodamine probes restore intense fluorescence through conversion of the tetrazine quencher into a dihydropyrazine product. In addition, the Lyso-BODIPY-TCO probe in acidic conditions and the tetrazine–rhodamine probes activated after the IEDDA reaction exhibited distinct fluorescence. This design allows dual-color fluorescence imaging of two organelles involved in autophagy and endocytosis.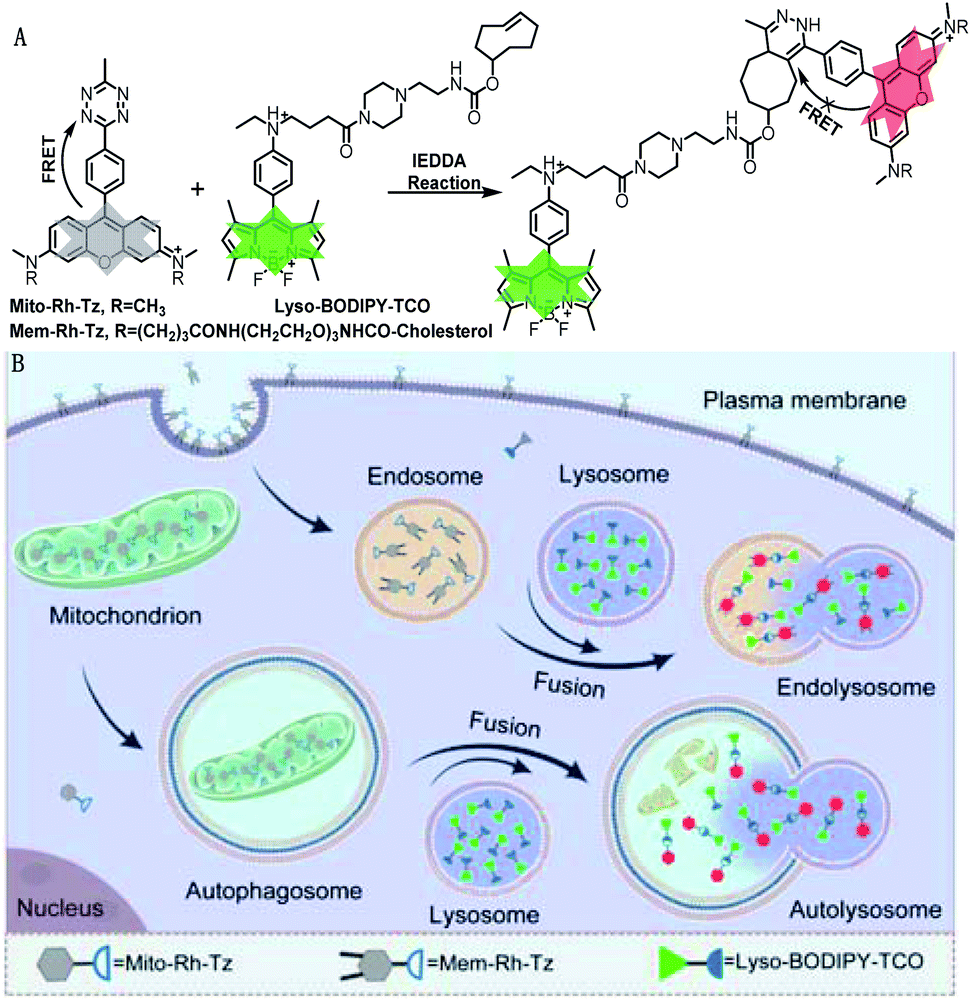 | ||
| Fig. 1 (A) Design of tetrazine and TCO probes and the corresponding fluorogenic click reaction. (B) Schematic illustration of COP strategy for imaging autophagic and endocytic fluxes. | ||
The incorporation of organelle-targeting moieties in the paired TCO and tetrazine probes confers their substantial enrichment in the designated organelles (Fig. 1B). Upon induction of autophagic flux (mitophagy), mitochondria are sequestered in autophagosomes which are ultimately fused with lysosomes. The high concentrations of TCO and tetrazine probes in the fused lysosomes boost the IEDDA reaction, allowing fluorogenic imaging of autophagic flux. On the other hand, in endocytic flux the plasma membrane is internalized into lysosomes via endosomes, facilitating efficient fluorogenic reaction between the enriched TCO and tetrazine probes. Because of bioorthogonality, fast kinetics and high yield of the IEDDA reaction, the COP strategy affords superb specificity and high contrast for direct imaging of the autophagic and endocytic fluxes (Table S1†).
The tetrazine probes, Mito-Rh-Tz and Mem-Rh-Tz, and Lyso-BODIPY-TCO probe were synthesized and characterized by ESI-MS, 1H NMR and 13C NMR, respectively (Schemes S1–S3†). Lyso-BODIPY-TCO probe exhibited a pH-dependent fluorescence with strong emission under acidic conditions and very low fluorescence at pH 7.4 (Fig. S1 and S2†). The pKa was ∼4.6, suggesting that it was a desirable fluorescence reporter for acidic lysosomes. Both tetrazine probes, Mito-Rh-Tz and Mem-Rh-Tz, gave negligible fluorescence even at 1 μM (Fig. 2A, S3 and S4†). These results were consistent with previous results of effective fluorescence quenching of rhodamine by the tetrazine moiety via a FRET mechanism.30 The tetrazine probes both exhibited substantially enhanced fluorescence after reacting with Lyso-BODIPY-TCO, with ∼15- and ∼14-fold signal-to-background ratios for Mito-Rh-Tz and Mem-Rh-Tz, respectively. Moreover, the fluorescence of the tetrazine probes had non-overlapping regions with that for the Lyso-BODIPY-TCO probe, implying the feasibility of dual-color fluorescence detection of the tetrazine and TCO probes. Further MS analysis confirmed the formation of dihydropyrazine products from the IEDDA reaction (Fig. S5†). Real-time fluorescence assays showed that the reaction between Lyso-BODIPY-TCO and Mito-Rh-Tz probes was very fast and completed within 100 s at pH 7.4 and 4.5 (Fig. 2B). The second-order rate constants were 170 ± 16 M−1 s−1 and 160 ± 14 M−1 s−1 at pH 7.4 and 4.5, respectively (Fig. S6†), which were similar to the rate constants reported previously.30 Together, these results demonstrated that fluorescence of the designed tetrazine probes could be activated with a fast kinetics and high turn-on ratio by the TCO probe under physiologically neutral or acidic conditions.
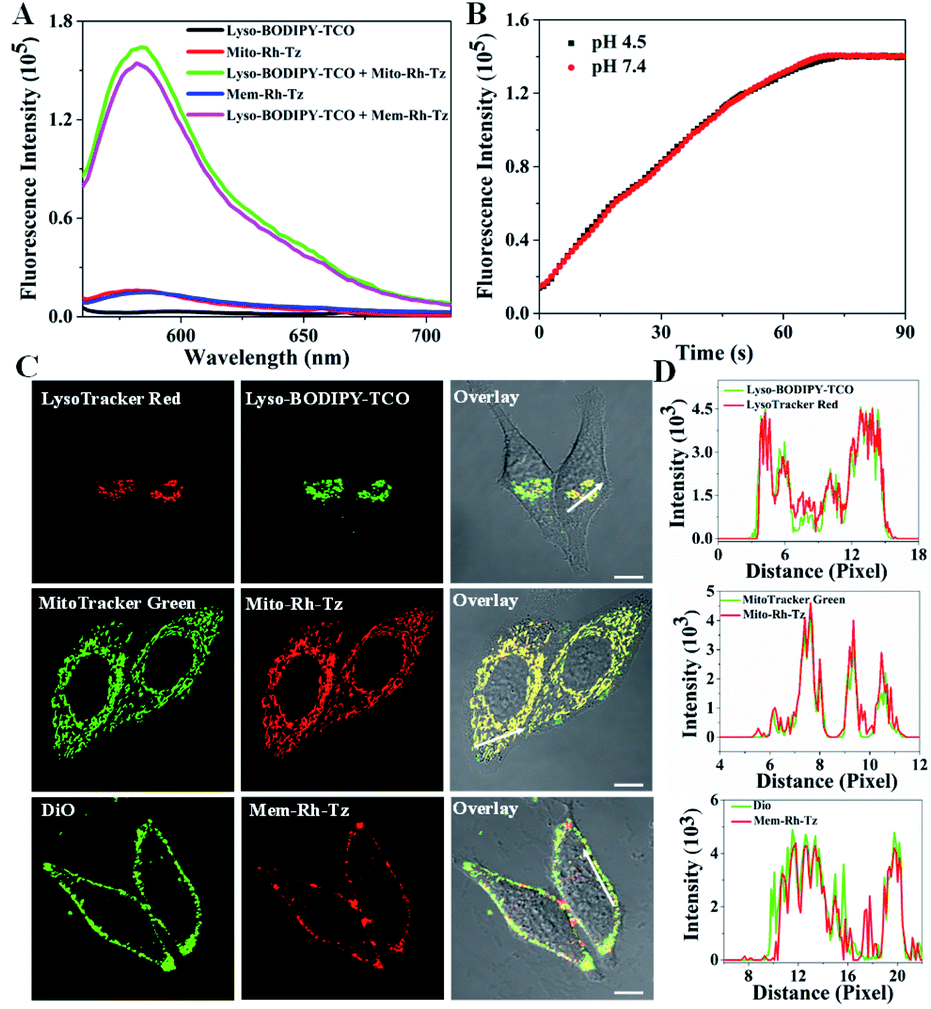 | ||
| Fig. 2 (A) Fluorescence spectra for Lyso-BODIPY-TCO (100 μM), Mito-Rh-Tz (10 μM) and Mem-Rh-Tz (10 μM) before and after reacting with Lyso-BODIPY-TCO (100 μM) at pH 4.5, λex = 550 nm. (B) Real-time fluorescence response of Mito-Rh-Tz (10 μM) toward Lyso-BODIPY-TCO (100 μM) at pH 4.5 or 7.4, λex/em = 550/585 nm. (C) CLSM images of HeLa cells co-stained with Lyso-BODIPY-TCO (0.5 μM) and LysoTracker Red (0.1 μM), Mito-Rh-Tz (5 μM) and MitoTracker Green (0.1 μM), or Mem-Rh-Tz (5 μM) and DiO (10 μM), scale bar = 10 μm. (D) Fluorescence intensity analysis along white arrows in the overlay images in (C). | ||
Subcellular localization and enrichment of probes
The subcellular distribution of Lyso-BODIPY-TCO, Mito-Rh-Tz and Mem-Rh-Tz was investigated. Confocal laser scanning microscopy (CLSM) images revealed that HeLa cells treated with Lyso-BODIPY-TCO displayed intense green fluorescence, indicating its localization in acidic organelles. Colocalization assays showed that the green fluorescence was colocalized with that of LysoTracker Red with a Pearson's correlation coefficient (PCC) of 0.93 (Fig. 2C and D), verifying the localization of Lyso-BODIPY-TCO in lysosomes. This lysosomal localization was ascribed to the designed piperazine moiety in the Lyso-BODIPY-TCO probe. To shed light on the localization of the low-fluorescence Mito-Rh-Tz probe, CLSM imaging with a high concentration of Mito-Rh-Tz was performed. Its fluorescence was found to colocalize with MitoTracker Green with a PCC of 0.91, indicating that Mito-Rh-Tz was predominantly localized in mitochondria. This localization was attributed to its overall hydrophobic and cationic structure.35 CLSM image for HeLa cells treated with Mem-Rh-Tz displayed typical localization on plasma membrane with desirable colocalization with DiO with a PCC of 0.86. This predominant plasma membrane localization was ascribed to the two cholesterol anchoring moieties. Moreover, colocalization assays for Mito-Rh-Tz and Mem-Rh-Tz at low concentrations upon TCO activation also confirmed their localization in mitochondria and plasma membrane, respectively (Fig. S7†). Collectively, these results demonstrated that Lyso-BODIPY-TCO, Mito-Rh-Tz and Mem-Rh-Tz could specifically target to lysosomes, mitochondria and plasma membrane, respectively. Further colocalization assays using HepG2 and MCF-7 cells with high concentrations of tetrazine probes also showed consistent results (Fig. S8 and S9†).Enrichment of the tetrazine and TCO probes in specific organelles was then verified. CLSM images of HeLa cells without washing out the excessive probes revealed that the average fluorescence for Mito-Rh-Tz in mitochondria and Mem-Rh-Tz in plasma membrane was enhanced by ∼110- and ∼118-fold as compared to that in extracellular or cytosolic regions (Fig. S10†). This result confirmed their effective enrichment in the specific organelles. The average fluorescence of Lyso-BODIPY-TCO in lysosomes was found to be ∼76-fold higher than that in the extracellular region with pH adjusted to 4.5, indicators for efficient enrichment of Lyso-BODIPY-TCO in lysosomes. It is noteworthy that high-efficiency enrichment of the tetrazine and TCO probes in specific organelles was crucial in the COP strategy for probing the autophagic and endocytic fluxes. This allowed the use of low probe concentrations to eliminate the background reaction between the paired probes, while permitted rapid fluorogenic IEDDA reaction upon organelle fusion. In addition, the cytotoxicity of Lyso-BODIPY-TCO, Mito-Rh-Tz and Mem-Rh-Tz, using a standard MTT assay was found to be very low, >85% viability obtained for the cells treated with these compounds up to 100 μM for 24 h (Fig. S11†). Cells incubated with up to 20 μM of the conjugates of Lyso-BODIPY-TCO and Mito-Rh-Tz or Mem-Rh-Tz also showed negligible cytotoxicity.
Imaging of autophagic flux
Autophagy (mitophagy) involves the fusion of mitochondria-sequestered autophagosomes with lysosomes.17 Hence, Lyso-BODIPY-TCO enriched in lysosomes could react efficiently with Mito-Rh-Tz accumulated in mitochondria to deliver activated fluorescence for imaging autophagic flux. To validate this strategy, we incubated HeLa cells with Lyso-BODIPY-TCO and Mito-Rh-Tz in serum-supplemented or serum-depleted medium (Fig. 3A). The cells in a serum-supplemented medium displayed bright fluorescence for Lyso-BODIPY-TCO, but very dim fluorescence for Mito-Rh-Tz (note: a low concentration of Mito-Rh-Tz was utilized here as compared to the localization studies). By contrast, intense fluorescence was obtained for both Lyso-BODIPY-TCO and Mito-Rh-Tz for cells in a serum-depleted medium. The merged images illustrated fully overlapped fluorescence for Mito-Rh-Tz and Lyso-BODIPY-TCO, indicating a starvation-induced autophagic flux in the cells. The colocalization of Mito-Rh-Tz and Lyso-BODIPY-TCO was also confirmed in Z-stacked imaging (Fig. S12†). Further experiments were performed by treating the cells with rapamycin (an autophagy inducer upon inhibition of the mechanistic target of rapamycin complex 1)36 or carbonyl cyanide 3-chlorophenylhydrazone (CCCP, a mitochondria damage inducer for autophagy induction)37 in a serum-supplemented medium, or with liensinine (an autophagy inhibitor) in a serum-depleted medium.17 As expected, appreciable fluorescence of Mito-Rh-Tz was observed for rapamycin and CCCP treated cells, whereas very weak fluorescence was obtained for liensinine treated cells (Fig. 3A and B). This result verified the specific response of our COP strategy to autophagic flux. An additional assay for cells treated in a serum-depleted medium containing chloroquine (CQ), a drug impairs the function of lysosomes and inhibits their fusion with other organelles.38 Interestingly, only negligible fluorescence appeared for Mito-Rh-Tz in the cells. It was noteworthy that CQ did not affect the formation autophagosomes.38 Hence, this finding suggested superb specificity of the COP strategy: fluorescence activation was specific to the complete autophagic process (from initial autophagosome formation to terminal lysosomal fusion), with no response to premature termination of autophagic flux at autophagosome formation. Flow cytometry analysis gave fluorescence activation profiles consistent with the CLSM images (Fig. 3C). Likewise, CLSM images for HepG2 and MCF-7 cells also showed that the fluorogenic IEDDA reaction between Mito-Rh-Tz and Lyso-BODIPY-TCO was specific to autophagic flux (Fig. S13 and S14†).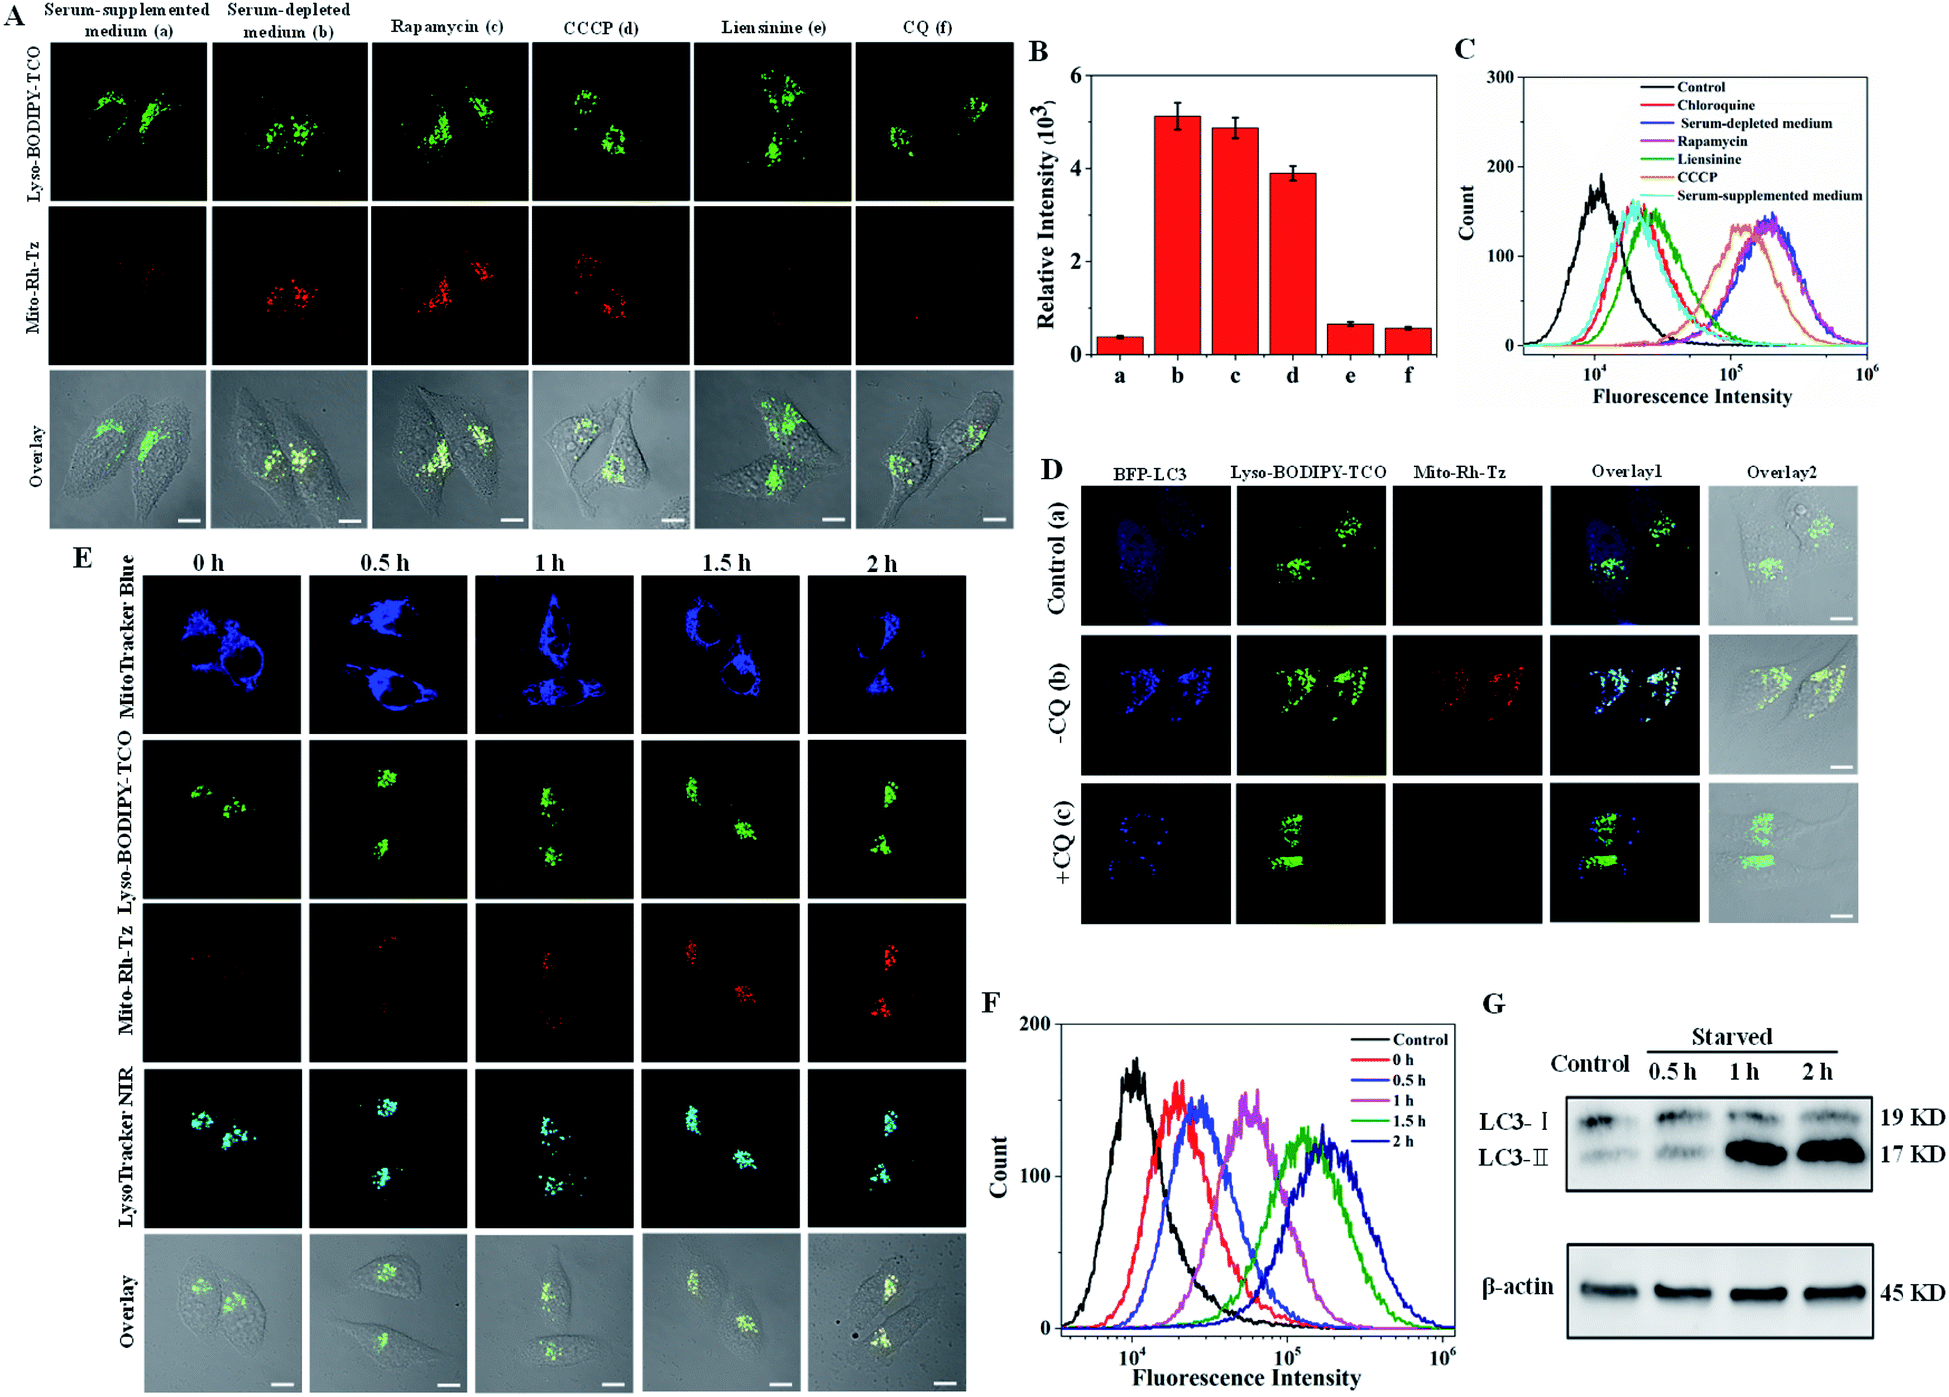 | ||
| Fig. 3 (A) CLSM images of HeLa cells incubated with Lyso-BODIPY-TCO (0.1 μM) and Mito-Rh-Tz (0.01 μM). (a) Cells incubated in serum-supplemented medium, (b) cells in serum-depleted medium, (c) cells pretreated with rapamycin in serum-supplemented medium, (d) cells pretreated with CCCP in serum-supplemented medium, (e) cells pretreated with liensinine in serum-depleted medium, (f) cells pretreated with CQ in serum-depleted medium. (B) Average fluorescence intensity of Mito-Rh-Tz in ten arbitrary regions in (A). (C) Flow cytometry analysis for HeLa cells treated under the conditions indicated in (A). (D) CLSM images for plasmid BFP-LC3 transfected cells treated with Lyso-BODIPY-TCO and Mito-Rh-Tz. (a) Cells incubated in serum-supplemented medium, (b) cells in serum-depleted medium, (c) cells pretreated with CQ in serum-depleted medium. (E) Time-dependent confocal images of HeLa cells treated with Lyso-BODIPY-TCO, Mito-Rh-Tz, MitoTracker Blue and LysoTracker NIR in serum-depleted medium. (F) Flow cytometry analysis for HeLa cells incubated without (control) and with Lyso-BDP-TCO plus Mito-Rh-Tz in serum-depleted medium at different times. (G) Western blotting analysis for proteins LC3-I and LC3-II in HeLa cells cultured in serum-depleted medium at different times. Scale bar = 10 μm. | ||
The utility of the COP strategy for detecting autophagic flux was further verified with reference to an autophagy indicator, a fusion protein of LC3 with blue fluorescence (LC3-BFP). This fusion protein displays punctuated fluorescence as indicators for the formed autophagosomes in autophagy.17 For cells in serum-supplemented media, blue fluorescence of LC3-BFP was evenly distributed in cytosol, while only very dim fluorescence was obtained for Mito-Rh-Tz (Fig. 3D). This observation indicated very weak autophagy for cells in serum-supplemented media. For cells in serum-depleted conditions, CLSM images showed that the fluorescence of LC3-BFP became punctuated, indicating the formation of autophagosomes. Concurrently, bright fluorescence appeared for the activated Mito-Rh-Tz probe. A closer examination revealed that the fluorescence of activated Mito-Rh-Tz probe was almost completely overlapped by that of BFP-LC3, evidencing the fusion of autophagosomes and lysosomes. A further control was performed using cells treated with CQ. We found that the cells exhibited punctuated fluorescence of LC3-BFP, while displayed negligible fluorescence for Mito-Rh-Tz. An additional assay for cells treated with an endocytosis inhibitor prochlorperazine10 also showed bright fluorescence for Mito-Rh-Tz with punctuated BFP fluorescence in lysosomes (Fig. S15†). Together, these results confirmed that fluorescence activation of Mito-Rh-Tz was specific for the complete autophagic flux and was not responsive to premature termination of autophagic flux. The capability of the COP strategy for autophagic flux detection was further investigated through time-dependent colocalization study using the mitochondrial stain MitoTracker Blue and the lysosome indicator LysoTracker NIR. We observed that the green fluorescence of Lyso-BODIPY-TCO remained bright throughout the assay (Fig. 3E). Colocalization assay with LysoTracker NIR showed the Lyso-BODIPY-TCO probe retained in lysosomes throughout the starvation induction. In contrast, the fluorescence of Mito-Rh-Tz was very weak before starvation, but it gradually increased within 2 h after starvation induction. Interestingly, the merged images obtained throughout the assay showed that the activated fluorescence for the Mito-Rh-Tz probe was fully overlapped by that for MitoTracker Blue and LysoTracker NIR (Fig. S16†). This result demonstrated that the activated fluorescence of Mito-Rh-Tz was localized in both lysosomes and mitochondria, implying the sequestration of mitochondria in lysosomes during the terminal stage of autophagy. Time-dependent fluorescence enhancement for Mito-Rh-Tz was also obtained in flow cytometry analysis (Fig. 3F). In addition, western blotting experiment showed time-dependent increases in the amount of LC3-II (the lipidated form of LC3, an autophagosome biomarker for autophagy indication), consistent with the CLSM results (Fig. 3G and S17†). Collectively, these results revealed that the COP strategy enabled directly visualization of autophagic flux in living cells.
Imaging of endocytotic flux
Next, the potential of the COP strategy using Mem-Rh-Tz and Lyso-BODIPY-TCO probes for endocytic flux imaging was explored. We used a model system of HeLa cells stimulated with epidermal growth factor (EGF), which was known for inducing enhanced endocytosis.39 For cells with a low basal endocytic flux in the absence of EGF induction, we observed bright Lyso-BODIPY-TCO fluorescence but negligible fluorescence for Mem-Rh-Tz (Fig. 4A). For cells stimulated with EGF, there was strong fluorescence for Lyso-BODIPY-TCO and Mem-Rh-Tz. This result indicated that the fluorescence of Mem-Rh-Tz was activated due to EGF induced endocytosis. The overlaid image showed that the activated fluorescence of Mem-Rh-Tz exhibited colocalization with that of Lyso-BODIPY-TCO, implying translocation of the plasma membrane enriched Mem-Rh-Tz into lysosomes upon endocytosis induction. An additional experiment was performed by incubating the cells with EGF and NaN3, an ATPase inhibitor known to prevent endocytosis.40 As expected, the cells only displayed very weak fluorescence of Mem-Rh-Tz. We further performed a closer assay for EGF induced cells pretreated with CQ. Interestingly, only very dim fluorescence was obtained for Mem-Rh-Tz, which was ascribed to the inhibition of the fusion between lysosomes and endosomes. Flow cytometry analysis validated that the COP strategy using Mem-Rh-Tz and Lyso-BODIPY-TCO probes was capable of detecting endocytic flux (Fig. 4B). To testify the ability of the COP strategy for imaging endocytic flux, we used an endocytosis marker, FITC–dextran, to compare to Mem-Rh-Tz plus a lysosome-targeting TCO probe without BODIPY fluorophore (Lyso-TCO). We found that EGF stimulated cells showed bright fluorescence for both Mem-Rh-Tz and FITC–dextran, whereas cells treated with EGF and CQ only gave strong fluorescence for FITC–dextran without fluorescence activation for Mem-Rh-Tz (Fig. 4C). It was noteworthy that cells treated with EGF and CQ retained substantial uptake of FITC–dextran into endosomes.41 This result confirmed that fluorescence activation of Mem-Rh-Tz was specific for the complete endocytic flux (from initial endosome formation to terminal lysosomal fusion), and was not responsive to premature termination of endocytic flux at endosome formation.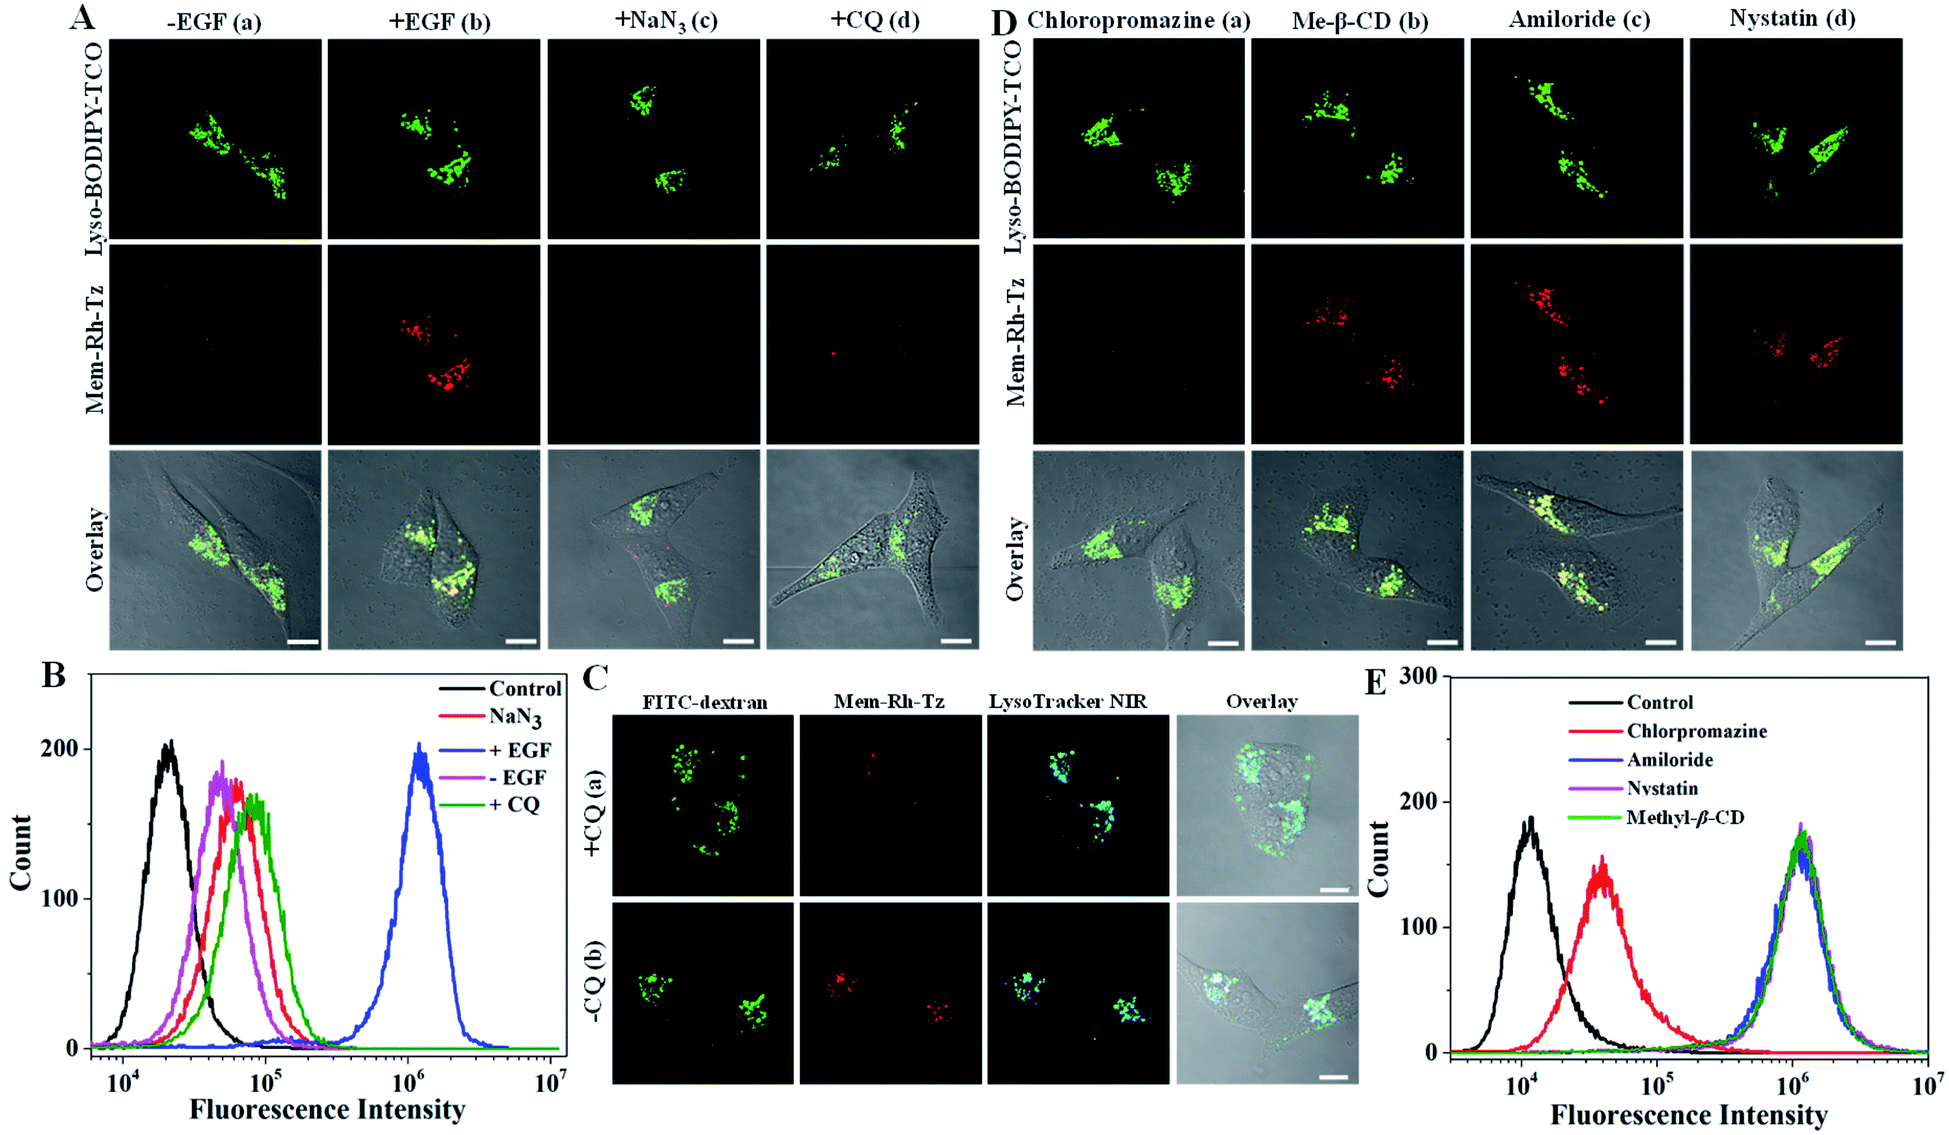 | ||
| Fig. 4 (A) CLSM images for HeLa cells incubated with Lyso-BODIPY-TCO (0.5 μM) and Mem-Rh-Tz (0.05 μM). (a) Cells without EGF induction, (b) cells stimulated with EGF (0.08 μg mL−1), (c) cells pretreated with 0.2% NaN3 followed by EGF stimulation, (d) cells pretreated with CQ followed by EGF stimulation. (B) Flow cytometry analysis for HeLa cells treated under the conditions indicated in (A). (C) CLSM images for HeLa cells incubated with Lyso-TCO, Mem-Rh-Tz, FITC–dextran and LysoTracker NIR, followed by EGF stimulation. (a) Cells pretreated with CQ, (b) cells pretreated without CQ. (D) CLSM images for HeLa cells incubated with Lyso-BODIPY-TCO and Mem-Rh-Tz followed by EGF stimulation. (a) Cells pretreated with chloropromazine, (b) cells pretreated with Me-β-CD, (c) cells pretreated with amiloride (d) cells pretreated with nystatin. (E) Flow cytometry analysis for HeLa cells treated under the conditions indicated in (D). | ||
We further utilized the Mem-Rh-Tz and Lyso-BODIPY-TCO probes to investigate the EGF-stimulated endocytosis pathway. HeLa Cells were pretreated with different drugs,42 including chloropromazine (clathrin mediated endocytosis inhibitor), methyl-β-cyclodextrin (Me-β-CD) (lipid-raft-dependent endocytosis inhibitor), amiloride (macropinocytosis inhibitor) and nystatin (caveolae-dependent endocytosis inhibitor), respectively. CLSM images revealed that cells pretreated with chloropromazine delivered much lower fluorescence of Mem-Rh-Tz, whereas cells pretreated with Me-β-CD, amiloride or nystatin still displayed strong fluorescence for Mem-Rh-Tz (Fig. 4D). This finding was consistent with that obtained in flow cytometry analysis (Fig. 4E). Together, these results implied that EGF induced endocytosis was predominantly dependent on the clathrin-mediated endocytosis pathway, consistent with the literature report.39
Correlation of autophagic and endocytic fluxes with expression of cell surface proteins
Cell surface proteins are critical therapeutic targets, and low abundance of these proteins has been closely implicated in cancer resistance to immune checkpoint blocked (ICB) therapy and cellular immunotherapy.12–14 It has been recently revealed that the expression levels of cell surface proteins are modulated by autophagy and endocytosis.9,10 Direct correlation of autophagic or endocytic flux with expression levels of cell surface proteins is of great value for developing efficient immune therapeutics. We then explored the utility of the COP strategy to correlate autophagic or endocytic flux with expression of two important immunotherapeutic targets, MHC-I and PD-L1.MHC-I plays a critical role in presenting antigen at the cell surface for immunosurveillance and cellular immunotherapy.12,13 To uncover the roles of autophagic and endocytic fluxes in modulating the expression of cell surface MHC-I, we chose three cell lines with varying resistance to cancer immunotherapy. The Hup-T3 cells, a pancreatic ductal adenocarcinoma (PDAC) cell line, were found to have high resistance to immunotherapies.9 Under culturing in serum-supplemented media, the cells displayed appreciable fluorescence signals upon treatment with the probes of Lyso-BODIPY-TCO and Mito-Rh-Tz or Mem-Rh-Tz (Fig. 5A), suggesting relatively high basal autophagic and endocytic fluxes in Hup-T3 cells. Immunofluorescence staining showed a low expression of MHC-I at the cell surface, which was in good agreement with the literature.9 After pre-treatment with thapsigargin, an inhibitor arresting autophagy by blocking the fusion between autophagosomes and lysosomes,43 Hup-T3 cells displayed increased immunostaining fluorescence for cell surface MHC-I with decreased fluorescence activation of Mito-Rh-Tz. Furthermore, Hup-T3 cells under autophagy induction via culturing in a serum-depleted medium delivered very low fluorescence in surface MHC-I immunostaining, but exhibited intense fluorescence for Mito-Rh-Tz. These data disclosed that the surface MHC-I expression in Hup-T3 cells was in negative correlation with autophagic flux. On the other hand, after Hup-T3 cells pretreated with prochlorperazine, an endocytosis inhibitor,10 we obtained increased immunostaining fluorescence for surface MHC-I abundance with a decreased endocytic flux. By contrast, cells stimulated with EGF for endocytosis induction had decreased abundance of surface MHC-I with an enhanced endocytic flux. These observations revealed that the surface MHC-I expression in Hup-T3 cells was also negatively correlated with endocytic flux. Moreover, Hup-T3 cells treated with bafilomycin A1 showed the highest abundance of surface MHC-I with dramatically reduced autophagic and endocytic fluxes. These fluorescence imaging results were in perfect consistency with those obtained in a flow cytometry assay (Fig. 5B and C). In addition, immunofluorescence imaging for fixed cells showed that MHC-I was predominantly localized in lysosomes (Fig. S18†), suggesting that the low cell surface MHC-I abundance was attributed to its degradation in lysosomes.9 Together, the results disclosed that the expression of cell surface MHC-I in Hup-T3 cells was in negative correlation with both autophagic and endocytic fluxes. Because increased cell surface abundance of MHC-I was beneficial for immunotherapy, this finding indeed implied the potential of autophagy or endocytosis inhibitors for improved immunotherapy of Hup-T3 cell derived cancer.
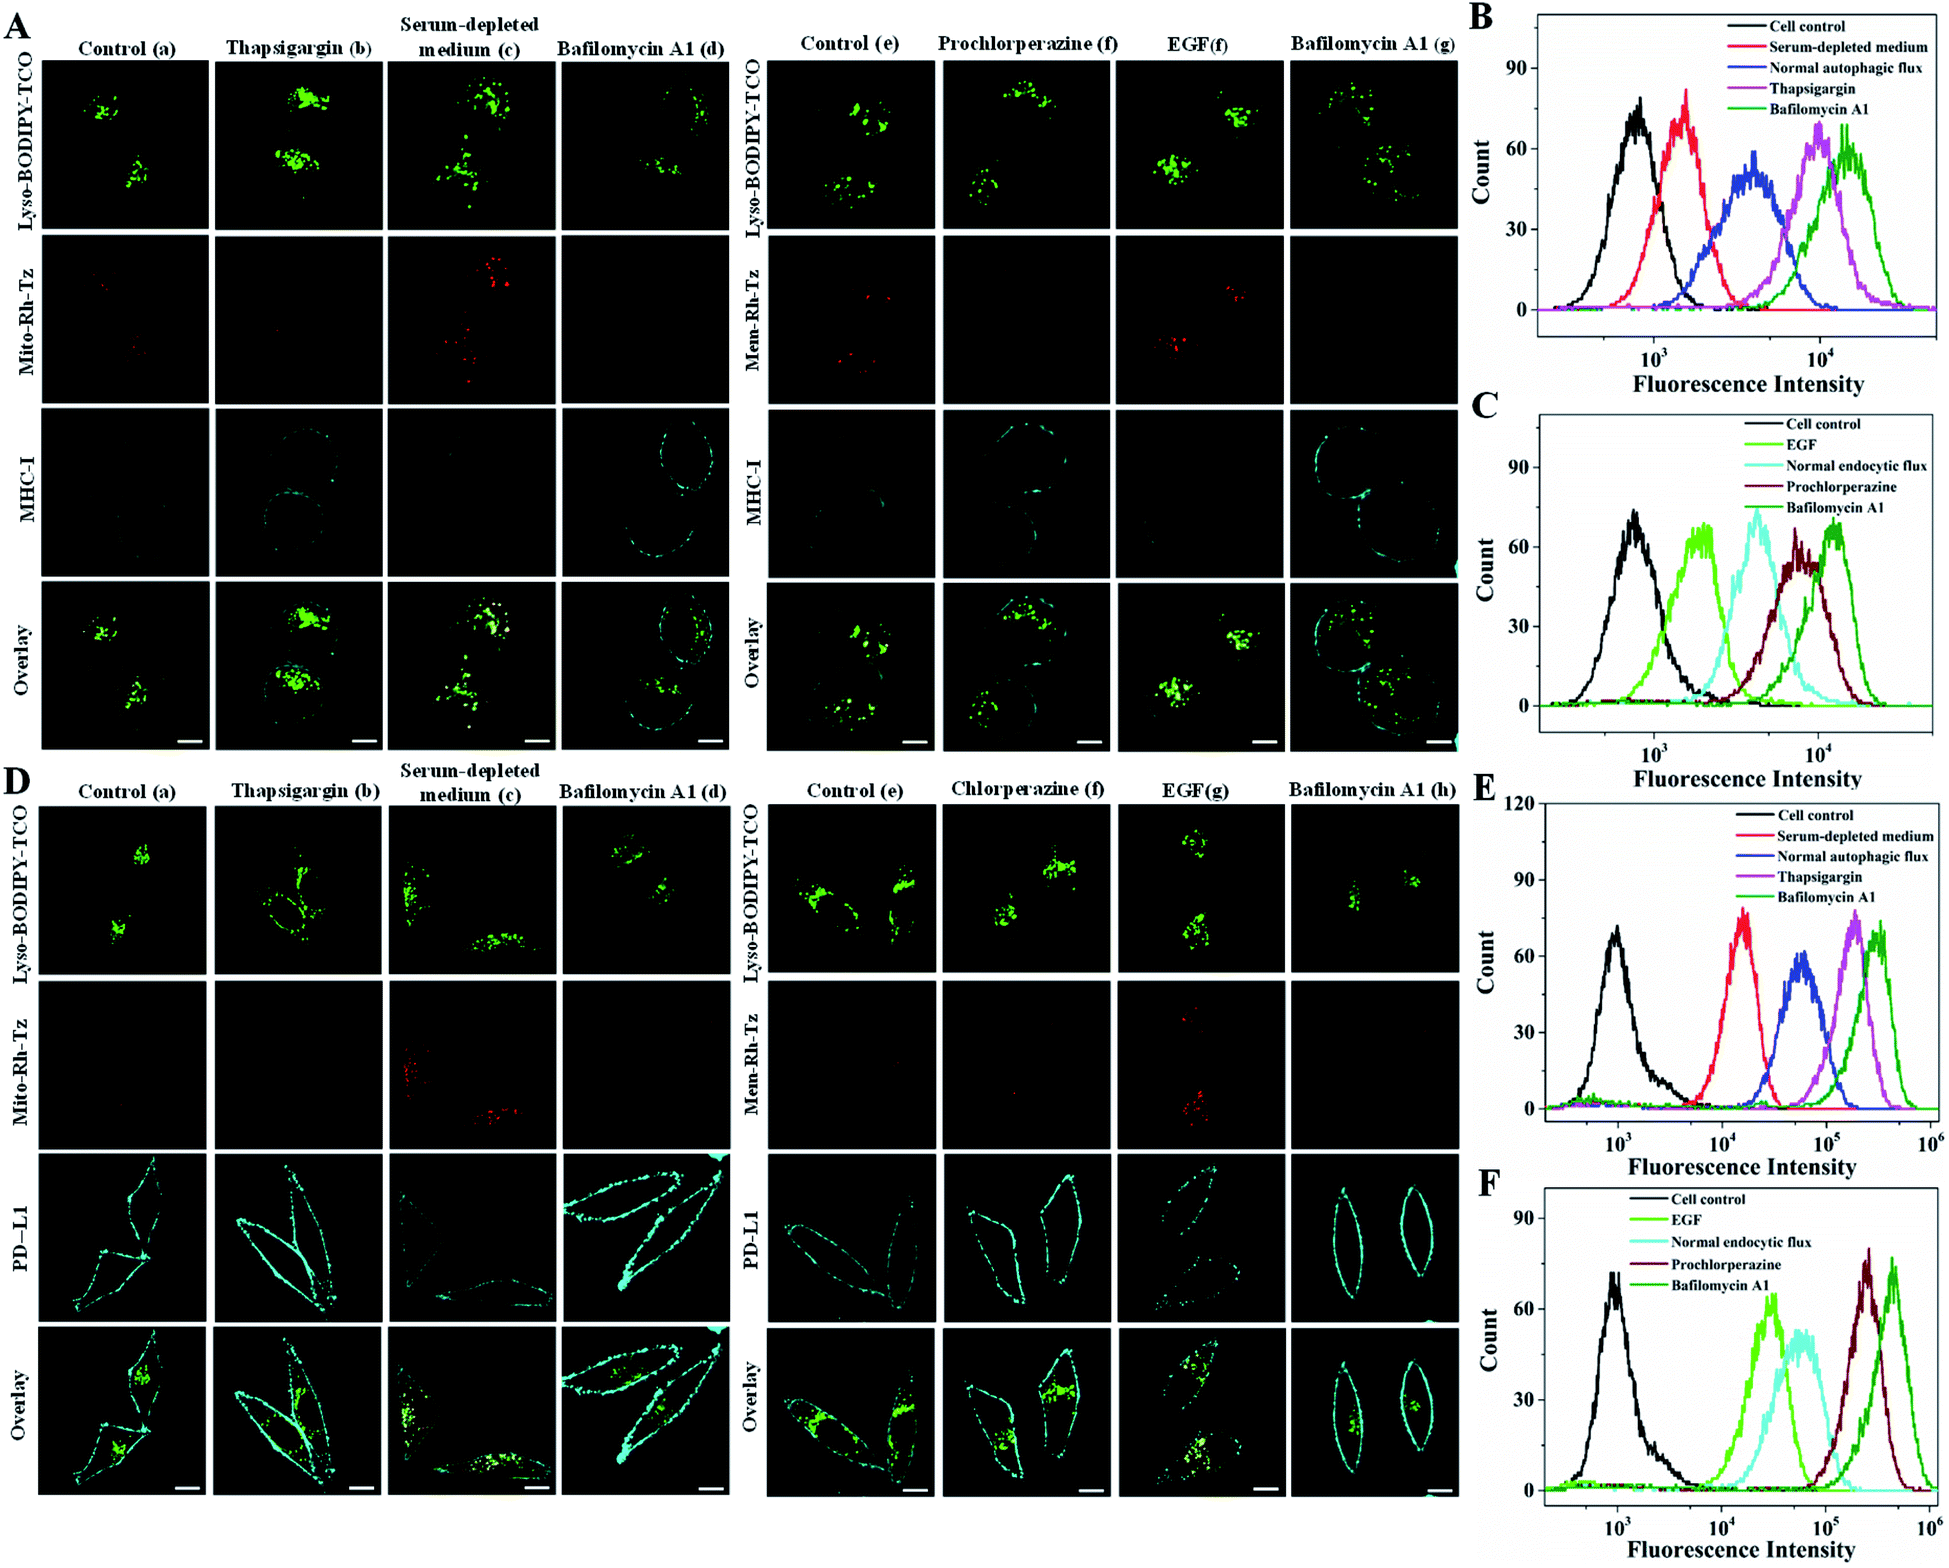 | ||
| Fig. 5 (A) Confocal images for Hup-T3 cells incubated with Lyso-BODIPY-TCO (0.1 μM), Mito-Rh-Tz (0.01 μM, a–d) or Mem-Rh-Tz (0.01 μM, e–g), followed by immunostaining. (a) Cells in serum-supplemented medium, (b) cells pretreated with thapsigargin (6 μM), (c) cells in serum-depleted medium, (d) cells pretreated with bafilomycin A1 (0.2 μM), (e) cells in serum-supplemented medium, (f) cells pretreated with prochlorperazine (20 μM), (g) cells stimulated with EGF (0.08 μg mL−1) and (h) cells pretreated with bafilomycin A1 (0.2 μM). (B and C) Flow cytometry analysis of immunofluorescence for MHC-1 in Hup-T3 cells treated under the conditions indicated in (A). (D) Confocal images for MDA-MB-231 cells incubated with Lyso-BODIPY-TCO (0.1 μM), Mito-Rh-Tz (0.01 μM, a–d), Mem-Rh-Tz (0.01 μM, e–g), followed by immunostaining. (a) Cells in serum-supplemented medium, (b) cells pretreated with thapsigargin (6 μM), (c) cells in serum-depleted medium, (d) cells pretreated with bafilomycin A1 (0.2 μM), (e) cells in serum-supplemented medium, (f) cells pretreated with prochlorperazine (20 μM), (g) cells stimulated with EGF (0.08 μg mL−1) and (h) cells pretreated with bafilomycin A1 (0.2 μM). (E and F) Flow cytometry analysis of immunofluorescence for PD-L1 in MDA-MB-231 cells treated under the conditions indicated in (D). | ||
We further used the COP strategy to investigate autophagic and endocytic fluxes of A549 cells, a non-small-cell lung cancer cell line and MCF-7, a breast cancer cell line. We found that A549 cells exhibited similar phenomena to Hup-T3 cells, displaying negative correlation of surface MHC-I expression with autophagic and endocytic fluxes (Fig. S19†). In contrast, we observed distinct phenomena for MCF-7 cells. Normal MCF-7 cells displayed high abundance of cell surface MHC-I with a low basal autophagic and endocytic fluxes (Fig. S20†). These cells also exhibited lower MHC-I abundance of cell surface under enhanced endocytosis, and higher surface MHC-I expression upon inhibition of endocytic flux. Surprisingly, cells pretreated with thapsigargin for autophagy inhibition showed decreased expression of surface MHC-I, while cells cultured in serum-depleted medium for autophagy induction displayed higher MHC-I abundance at the cell surface. It was revealed that the endocytic flux in MCF-7 cells increased upon thapsigargin treatment but decreased in serum-depleted medium (Fig. S21†). These results implied that the cell surface MHC-I might be degraded dominantly via endocytosis in MCF-7 cells. A further inspection of MCF-7 cells pretreated with bafilomycin A1 showed the highest expression for the surface MHC-I. This was ascribed to the dramatic reduction of autophagic and endocytic fluxes under bafilomycin A1 treatment. Flow cytometry analysis gave results consistent with CLSM data. These results demonstrated the utility of the COP strategy for interrogating the roles of autophagic and endocytic fluxes in modulating surface expressions of MHC-I in different cancer cells, which provided the potential of autophagy or endocytosis inhibitors for improved cellular immunotherapy.
PD-L1 is an immunosuppressive protein with its surface abundance closely implicated in the efficacy of ICB therapy.13,14 We then utilized the COP strategy to inspect the correlation of autophagic or endocytic flux with cell surface expression of PD-L1 using MDA-MB-231 cells, a highly aggressive triple-negative breast cancer cell line. Immunofluorescence imaging of MDA-MB-231 cells under normal autophagy or endocytosis conditions showed a high surface expression of PD-L1 (Fig. 5D). Fluorescence imaging of these cells using the paired probes gave very low basal endocytic and autophagic fluxes. Upon induction of autophagy or endocytosis flux, we observed decreased surface PD-L1 abundance with intense fluorescence for these probes. Under inhibited autophagy or endocytosis, higher surface PD-L1 expression appeared with negligible fluorescence for these probes. The highest surface PD-L1 abundance was obtained with bafilomycin A1 treatment with negligible autophagic and endocytic fluxes. In addition, immunofluorescence imaging for fixed cells showed that PD-L1 was mainly localized in lysosomes (Fig. S22†), suggesting that the expression of cell surface PD-L1 was modulated by its degradation in lysosomes via autophagy and endocytosis. Further flow cytometry analysis also confirmed the results obtained with CLSM images (Fig. 5E and F). These results demonstrated that surface PD-L1 expressions in MDA-MB-231 cells were negatively modulated by endocytic and autophagic fluxes. We also found high expression of cell surface PD-L1 in HeLa cells, which exhibited similar negative modulation by autophagic and endocytic fluxes (Fig. S23†). In contrast, the cell surface expression of PD-L1 in normal MCF-7 cells was much lower than those in MDA-MB-231 and HeLa cells, and its surface abundance also displayed negative correlation with autophagic and endocytic fluxes (Fig. S24†). Together, these results implied that the COP strategy afforded a useful tool for detecting and imaging the autophagic and endocytic fluxes and correlate them with surface expressions of MHC-I and PD-L1 in different cancer cells. This correlation insight could provide promise in developing improved cancer immunotherapy using autophagy or endocytosis inhibitors.
Conclusions
In summary, we developed a novel strategy for direct visualization of autophagic and endocytic fluxes via clicking of organelle-enriched probes. A lysosome-localized TCO probe and two tetrazine probes, one targeting mitochondria and the other targeting plasma membrane, were successfully developed. The COP strategy enabled high-contrast and high-specificity detection and imaging of autophagic and endocytic fluxes. It also provided a viable tool for interrogating the roles of autophagic or endocytic flux in modulating the expression of immunotherapeutic targets such as MHC-I and PD-L1 at cell surface. The results revealed that the cell surface expression levels of MHC-I and PD-L1 were closely correlated to autophagic and endocytic fluxes. This correlation insight could afford great potential for developing improved cancer immunotherapy using autophagy or endocytosis inhibitors. The COP strategy provided a new paradigm for live cell imaging of autophagic and endocytic fluxes, providing tools to clarify their link and internal relevance in live cells and expanding the prospects of autophagy and endocytosis in clinical theranostics.Author contributions
X. L. and J.-H. J. conceived the project. X. L., F. W. and J.-H. J. designed the experiments. X. L. performed majority of the experiments and data analysis. M.-H. X. participated in CLMS imaging. W.-J. Z. constructed the plasmid. The manuscript was written by F. W. and J.-H. J., and edited by all the co-authors.Conflicts of interest
There are no conflicts to declare.Acknowledgements
This work was supported by National Key Research Program (2019YFA0905800) and NSFC Programs (21991084, 21904034, 21991080 and 22090053).Notes and references
- A. Ballabio and J. S. Bonifacino, Nat. Rev. Mol. Cell Biol., 2019, 21, 101–118 CrossRef PubMed.
- P. P. Di Fiore and M. von Zastrow, Cold Spring Harbor Perspect. Biol., 2014, 6, a016865 CrossRef.
- V. Deretic, T. Saitoh and S. Akira, Nat. Rev. Immunol., 2013, 13, 722–737 CrossRef CAS PubMed.
- L. Yu, Y. Chen and S. A. Tooze, Autophagy, 2017, 14, 207–215 CrossRef.
- L. Langemeyer, F. Fröhlich and C. Ungermann, Trends Cell Biol., 2018, 28, 957–970 CrossRef CAS PubMed.
- J. M. M. Levy, C. G. Towers and A. Thorburn, Nat. Rev. Cancer, 2017, 17, 528–542 CrossRef CAS PubMed.
- R. A. Nixon, Nat. Med., 2015, 19, 345–357 Search PubMed.
- Z. Zhong, E. Sanchez-Lopez and M. Karin, Cell, 2016, 166, 288–298 CrossRef CAS PubMed.
- Y. Keisuke, A. Venida, J. Yano, D. E. Biancur, M. Kakiuchi, S. Gupta, A. S. W. Sohn, S. Mukhopadhyay, E. Y. Lin, S. J. Parker, R. S. Banh, J. A. Paulo, K. W. Wen, J. Debnath, G. E. Kim, J. D. Mancias, D. T. Fearon, R. M. Perera and A. C. Kimmelman, Nature, 2020, 581, 100–105 CrossRef PubMed.
- H. Y. Chew, P. O. D. Lima, J. L. G. Cruz, B. Banushi, G. Echejoh, L. Hu, S. R. Joseph, B. Lum, J. Rae, J. S. O'Donnell, L. M. Long, S. Okano, B. King, R. Barry, D. Moi, R. Mazzieri, R. Thomas, M. Foote, A. McCluskey, P. J. Robinson, I. H. Frazer, N. A. Saunders, R. G. Parton, R. Dolcetti, K. Cuff, J. H. Martin, B. Panizza, E. Walpole, J. W. Wells and F. Simpson, Cell, 2020, 180, 895–914 CrossRef CAS PubMed.
- X. He and C. Xu, Cell Res., 2020, 30, 660–669 CrossRef PubMed.
- F. Garrido, N. Aptsiauri, E. M. Doorduijn, A. M. G. Lora and T. van Hall, Curr. Opin. Immunol., 2016, 39, 44–51 CrossRef CAS.
- P. Sharma and J. P. Allison, Science, 2015, 348, 56–61 CrossRef CAS.
- A. Goodman, S. P. Patel and R. Kurzrock, Nat. Rev. Clin. Oncol., 2017, 14, 203–220 CrossRef CAS PubMed.
- S. R. Bonam, F. Wang and S. Muller, Nat. Rev. Drug Discovery, 2019, 18, 923–948 CrossRef CAS PubMed.
- I. Dikic and Z. Elazar, Nat. Rev. Mol. Cell Biol., 2018, 19, 349–364 CrossRef CAS PubMed.
- N. Mizushima, T. Yoshimori and B. Levine, Cell, 2010, 140, 313–326 CrossRef CAS PubMed.
- C. Zhou, W. Zhong, J. Zhou, F. Sheng, Z. Fang, Y. Wei, Y. Chen, X. Deng, B. Xia and J. Lin, Autophagy, 2012, 8, 1215–1226 CrossRef CAS PubMed.
- D. S. Richardson, C. Gregor, F. R. Winter, N. T. Urban, S. J. Sahl, K. I. Willig and S. W. Hell, Nat. Commun., 2017, 8, 577 CrossRef PubMed.
- H. Morishita, T. Kaizuka, Y. Hama and N. Mizushima, Autophagy, 2017, 13, 757–758 CrossRef CAS PubMed.
- M. Martineau, A. Somasundaram, J. B. Grimm, T. D. Gruber, D. Choquet, J. W. Taraska, L. D. Lavis and D. Perrais, Nat. Commun., 2017, 8, 1412 CrossRef PubMed.
- Y. Liu, J. Zhou, L. Wang, H. Xiao, X. Liu, M. Liu, Z. Cao, D. Shang and W. Tan, J. Am. Chem. Soc., 2016, 138, 12368–12374 CrossRef CAS PubMed.
- Y. Chen, C. Zhu, J. Cen, Y. Bai, W. He and Z. Guo, Chem. Sci., 2015, 6, 3187–3194 RSC.
- Y. Lei, W. Ren, C. K. Wang, R. R. Tao, H. J. Xiang, L. L. Feng, Y. P. Gao, Q. Jiang, X. Li, Y. Hu and F. Han, Theranostics, 2019, 9, 5672–5680 CrossRef CAS PubMed.
- A. Jiménez-Sánchez, E. K. Lei and S. O. Kelley, Angew. Chem., Int. Ed., 2018, 57, 8891–8895 CrossRef PubMed.
- L. Hou, P. Ning, Y. Feng, Y. Ding, L. Bai, L. Li, H. Yu and X. Meng, Anal. Chem., 2018, 90, 7122–7126 CrossRef CAS PubMed.
- M. Li, A. Lee, K. L. Kim, J. Murray, A. Shrinidhi, G. Sung, K. M. Park and K. Kim, Angew. Chem., Int. Ed., 2018, 57, 2120–2125 CrossRef CAS PubMed.
- H. C. Kolb, M. G. Finn and K. B. Sharpless, Angew. Chem., Int. Ed., 2001, 40, 2004–2021 CrossRef CAS.
- S. S. Nguyen and J. A. Prescher, Nat. Rev. Chem., 2020, 4, 476–489 CrossRef CAS.
- B. L. Oliveira, Z. Guo and G. J. L. Bernardes, Chem. Soc. Rev., 2017, 46, 4895–4950 RSC.
- J. C. T. Carlson, H. Mikula and R. Weissleder, J. Am. Chem. Soc., 2018, 140, 3603–3612 CrossRef CAS PubMed.
- L. Chu, J. Tyson, J. E. Shaw, F. Rivera-Molina, A. J. Koleske, A. Schepartz and D. K. Toomre, Nat. Commun., 2020, 11, 4271 CrossRef CAS PubMed.
- C. P. Ramil, M. Dong, P. An, T. M. Lewandowski, Z. Yu, L. J. Miller and Q. Lin, J. Am. Chem. Soc., 2017, 139, 13376–13386 CrossRef CAS PubMed.
- Q. Zheng, J. Li, R. Xie, X. Fan, Y. Liu, S. Zheng, Y. Ge and P. R. Chen, ACS Cent. Sci., 2016, 2, 325–331 CrossRef PubMed.
- M. Li, S. Long, Y. Kang, L. Guo, J. Wang, J. Fan, J. Du and X. Peng, J. Am. Chem. Soc., 2018, 140, 15820–15826 CrossRef CAS PubMed.
- J. Kim, M. Kundu, B. Viollet and K. L. Guan, Nat. Cell Biol., 2011, 13, 132–141 CrossRef CAS PubMed.
- S. Padman, M. Bach, G. Lucarelli, M. Prescott and G. Ramm, Autophagy, 2013, 9, 1862–1875 CrossRef.
- M. Mauthe, I. Orhon, C. Rocchi, X. Zhou, M. Luhr, K. J. Hijlkema, R. P. Coppes, N. Engedal, M. Mari and F. Reggiori, Autophagy, 2018, 14, 1435–1455 CrossRef CAS PubMed.
- I. Pinilla-Macua, A. Grassart, U. Duvvuri, S. C. Watkins and A. Sorkin, eLife, 2017, 6, e31993 CrossRef PubMed.
- M. W. Bowler, M. G. Montgomery, A. G. W. Leslie and J. E. Walker, Proc. Natl. Acad. Sci. U. S. A., 2006, 103, 8646–8649 CrossRef CAS PubMed.
- H. Maes, A. Kuchnio, A. Peric, S. Moens, K. Nys, K. D. Bock, A. Quaegebeur, S. Schoors, M. Georgiadou, J. Wouters, S. Vinckier, H. Vankelecom, M. Garmyn, A. Vion, F. Radtke, C. Boulanger, H. Gerhardt, E. Dejana, M. Dewerchin, W. Annaert, P. Agostinis and P. Carmeliet, Cancer Cell, 2014, 26, 190–206 CrossRef CAS PubMed.
- D. Dipannita and J. G. Donaldson, Cell. Logist., 2012, 2, 203–208 CrossRef PubMed.
- I. G. Ganley, P. M. Wong, N. Gammoh and X. Jiang, Mol. Cell, 2011, 42, 731–743 CrossRef CAS PubMed.
Footnote |
| † Electronic supplementary information (ESI) available. See DOI: 10.1039/d0sc07057b |
| This journal is © The Royal Society of Chemistry 2021 |