
 Open Access Article
 This Open Access Article is licensed under a Creative Commons Attribution-Non Commercial 3.0 Unported Licence
High-resolution imaging of catalytic activity of a single graphene sheet using electrochemiluminescence microscopy†
Hui
Zhu
,
Dechen
Jiang
 * and
Jun-Jie
Zhu
*
* and
Jun-Jie
Zhu
*
State Key Laboratory of Analytical Chemistry for Life Science, School of Chemistry and Chemical Engineering, Nanjing University, Nanjing 210093, China. E-mail: dechenjiang@nju.edu.cn; jjzhu@nju.edu.cn
First published on 16th February 2021
Abstract
Here, the electrocatalytic activity of a single graphene sheet is mapped using electrochemiluminescence (ECL) microscopy with a nanometer resolution. The achievement of this high-spatial imaging relies on the varied adsorption of hydrogen peroxide at different sites on the graphene surface, leading to unsynchronized ECL emission. By shortening the exposure time to 0.2 ms, scattered ECL spots are observed in the ECL image that are not overlaid with the spots in the consecutive images. Accordingly, after stacking all the images into a graph, the ECL intensity of each pixel could be used to reflect the electrocatalytic features of the graphene surface with a resolution of 400 nm. This novel ECL method efficiently avoids the long-standing problem of classic ECL microscopy regarding the overlap of ECL emissions from adjacent regions and enables the nanometer spatial resolution of ECL microscopy for the first time.
Introduction
Electrocatalysts have attracted great interest in fundamental research, biomedicine, and energy conversion.1,2 Currently, most characterization studies of these electrocatalysts are performed at the ensemble level.2,3 However, their structure, composition and electrical contact are intrinsically heterogeneous among different individuals, which impede the comprehensive understanding of their structure–activity correlation.4,5 To deeply unveil these heterogeneities, single particle electrochemistry has been developed rapidly in the past few decades.6–8 Among these single-particle electrochemical techniques, scanning probe microscopy (SPM) based on tip technology has ultra-small electroactive area, which can finely map the electrochemical activity of materials even down to atom-level spatial resolution, and thus, provides highly spatially localized catalytic features.9–11 However, the SPM approach is a serial measurement, resulting in a low throughput and the resultant difficulty in the statistical analysis.6 Different from SPM technology, optical imaging technology provides visual information to describe the activity of catalysts in real time.2,7 Remarkably, the recent application of super-resolution fluorescence microscopy in fundamental studies could help in visualizing the surface catalytic activity with a resolution of several nanometers. However, the inevitable background fluorescence and photobleaching increase the measurement difficulty.12,13 Therefore, establishing a new high spatial resolution microscopy method with simple equipment and a low background signal is urgently needed to investigate catalyst activity in real time.Electrochemiluminescence (ECL) is a process in which a luminophore is excited to an excited state during an electrochemical reaction, which then emits photons when returning to the ground state.14,15 Recently, ECL microscopy that integrates a voltage generator, optical pieces and electron-multiplying charge-coupled devices (EMCCD) can image ECL emission at the electrode. It has the advantages of simple setup and near-zero background signals so that it has been successfully applied to image immunosensors16–20 and single particle behavior21–26 with a spatiotemporal resolution. In our previous studies, we observed that active sites in a single particle induce the generation of hydroperoxide intermediates, which behave as coreactants to remarkably enhance ECL emission from luminol.27,28 As a result, the ECL intensity of the particles is visualized, which has been proven to be correlated with their catalytic activity. Nevertheless, time resolution must be sacrificed to obtain sufficient ECL emission from single particles due to the relatively weak ECL emission. Since these hydroperoxide and luminol intermediates have a certain lifetime, their diffusion distance is observed to be as large as a few microns.28,29 This phenomenon results in the overlapping of ECL emissions from adjacent regions, and might cover the catalytic behavior of single particles. Consequently, the spatial resolution of ECL microscopy at the micron level is a bottleneck for the highly spatial measurement on the catalytic activity of a material.
In classical electrochemical theory, both the electron transfer rate and the adsorption of reactants at the electrode control the electrochemical reaction.30–32 Typically, the adsorption ability of the reactants in different regions of the material varies,33 which is an important factor resulting in the unsynchronized electrochemical reaction and heterogeneous electrocatalytic activity on the surface.3 Accordingly, some active sites with a greater number of adsorbed reactants (labeled in red in part (i) of Fig. 1a) must be present at the electrode that emit brighter ECL compared with the ECL intensity in the surrounding regions with fewer adsorbed reactants. By shortening the exposure time to reduce the photon acquisition, the ECL emission in these surrounding regions becomes invisible. Only the active sites with a sufficient number of adsorbed reactants emit visual ECL; these active sites are rare and are highly likely to be well isolated in the image. In this situation, the contribution of ECL from the surrounding regions is minimal so that the electrocatalytic activity of these nanometer-sized sites at the electrode can be analyzed based on the ECL intensity.
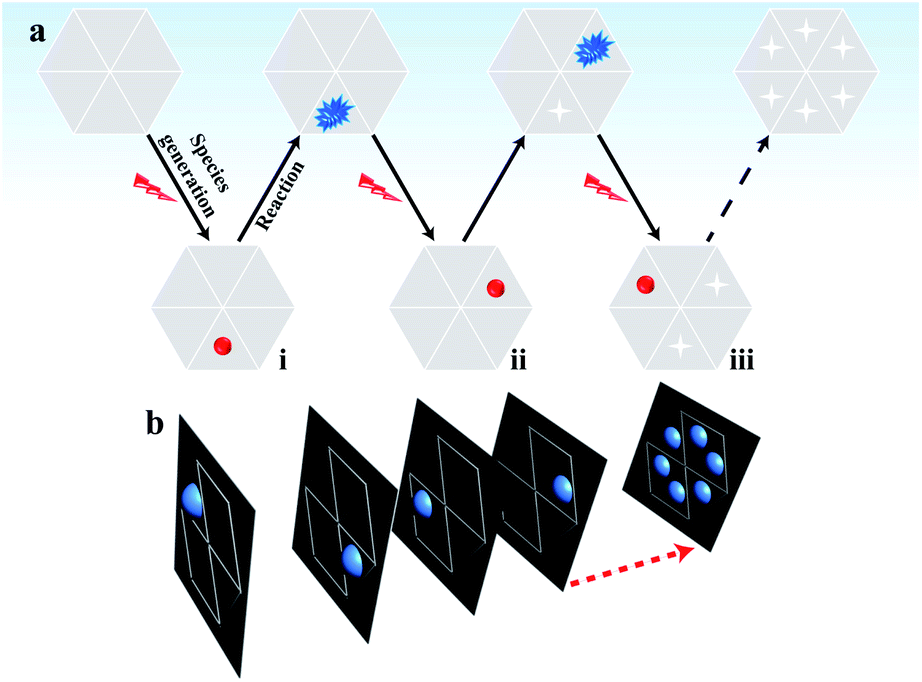 | ||
| Fig. 1 (a) Schematic sequence of the ECL images to map the electrocatalytic activity at different sites of single reduced graphene oxide (rGO) microsheets. The red spheres represent sites with sufficient adsorption of hydrogen peroxide; (b) the stacking process to obtain a final graph of the electrocatalytic activity of the rGO microsheet. | ||
After the reaction during the first exposure time, the adsorbed reactants at these active sites are consumed. Then, these sites have a low possibility of emitting visual ECL in the following time period. In the second exposure time, other sites that continuously adsorbed reactants to reach a sufficient amount (labeled in red in part ii of Fig. 1a) started to emit visual ECL illumination. The continuous voltage application and the consecutive collection of ECL images should induce ECL illumination from almost all the sites in the material in batches, according to their ability to adsorb hydrogen peroxide. Eventually, all these images are stacked into one image that should display the catalytic activity of the whole material surface with a high spatial resolution (Fig. 1b). The complete imaging process is illustrated in Fig. 1. This new ECL protocol efficiently avoids the ECL overlap from adjacent regions by the diffusion of the intermediates, thus overcoming the spatial resolution limitation in ECL microscopy. As a result, a high spatial ECL image with a resolution of 400 nm is realized to study the electrocatalytic activity of the material.
Results and discussion
The key to realizing a high spatial image of catalytic activity is visualization of isolated ECL spots from the material surface in a short exposure time so that the diffusion distance of the ECL intermediates is restricted to the nanometer scale. To achieve this goal, a reduced graphene oxide (rGO) microsheet with excellent electrical conductivity and tunable catalytic activity34 is chosen as a model catalyst, which is loaded on an indium tin oxide (ITO) slide. L012, as a luminol analog, could emit nearly 2 orders of magnitude stronger ECL illumination, and thus, is selected as the luminophore in our study.35 Our previous study employed density functional theory (DFT) to investigate the adsorption energy of ECL reactants (e.g. L012 and O2) at the surface.27 The computational result confirms that the ECL reaction will easily start once the ECL reactants are absorbed onto the surface of the catalyst. Since rGO can electrocatalyze the reaction between L012 and H2O2 to emit ECL light,36 it is reasonable to assume that L012 and hydrogen peroxide are adsorbed at the surface of rGO. Hydrogen peroxide is electrochemically oxidized into hydroperoxide intermediates by the catalysis of rGO. Meanwhile, L012 is electrochemically oxidized into L012 intermediates, which react with hydroperoxide intermediates to emit ECL, as illustrated in Fig. 2a. Although rGO has a good catalytic activity to enhance ECL, a relatively long exposure time is still needed to acquire sufficient ECL emission. This feature leads to apparent diffusion of the intermediates, and consequently, the impossibility to achieve high spatial resolution catalytic activity.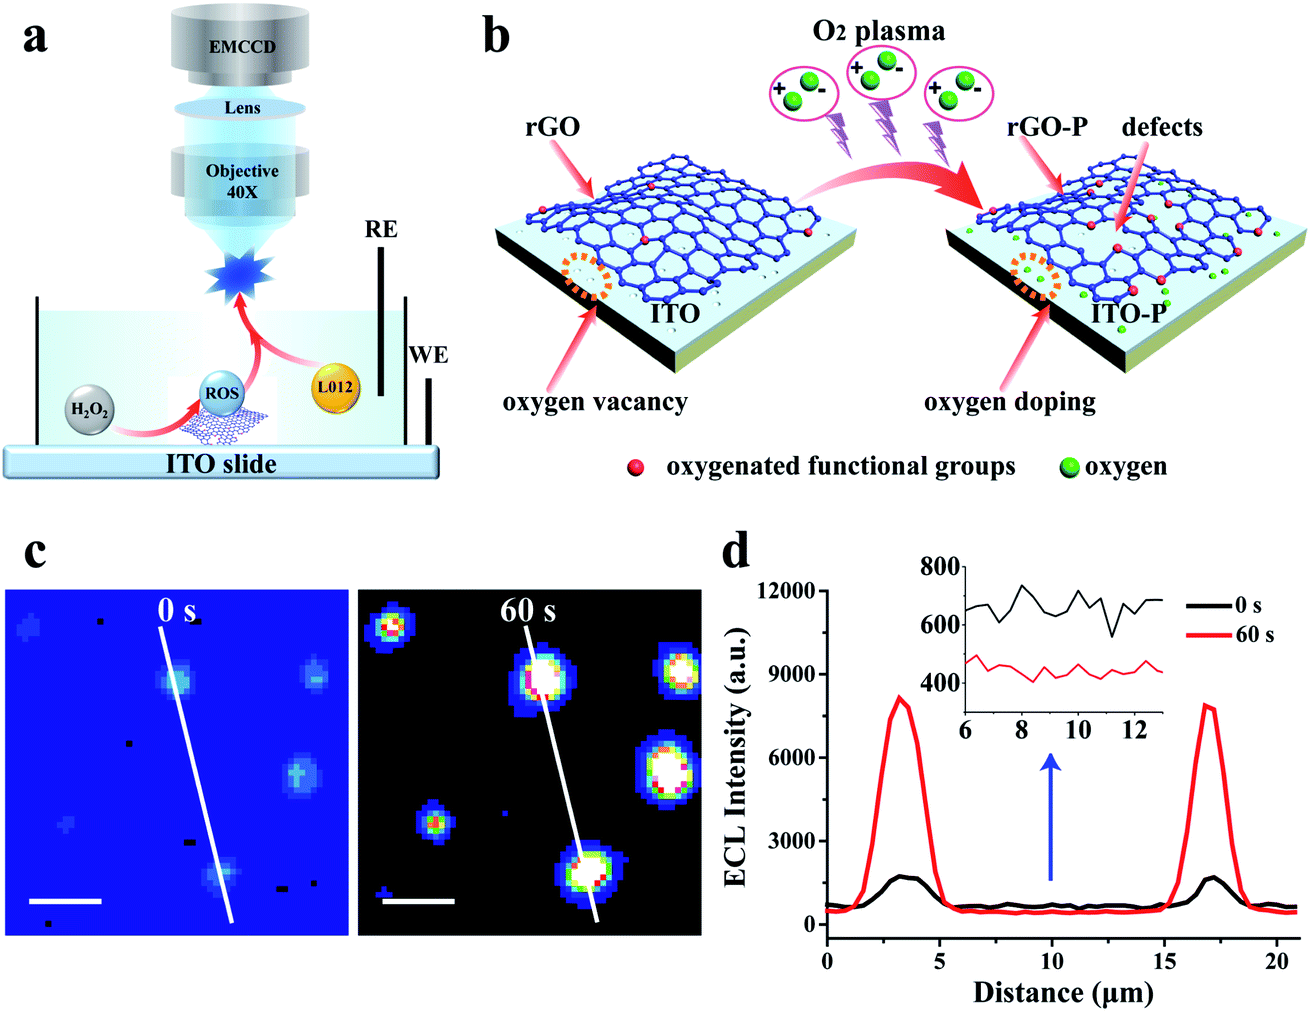 | ||
| Fig. 2 (a) Schematic illustration of the ECL microscopy setup and the electro-catalysis at rGO-P; (b) illustration of the oxygen plasma irradiation at the ITO slide with a rGO microsheet; (c) ECL images of rGO on ITO without and with O2 plasma treatment (60 s); and (d) the ECL intensity curve of the white line in (c). Exposure time: 100 ms, scale bar: 5 μm. | ||
To further enhance the ECL intensity from a single rGO microsheet, oxygen plasma irradiation is introduced to treat the ITO slide with rGO.37,38 The mechanism to increase the ECL intensity of rGO by plasma irradiation is illustrated in Fig. 2b. After irradiation, more edges are formed at the whole surface of rGO that are oxidized by oxygen to form oxygen-containing functional groups. This process results in an increase in defects on the rGO surface,34,39 as verified using scanning electron microscopy (SEM), high-resolution transmission electron microscopy (HRTEM), Raman spectroscopy and X-ray photoelectron spectroscopy (XPS) (Fig. S1–S6†). The presence of these defects reduces the binding energy between reactants and catalysts,39 which is more conducive to the adsorption and reaction of reactants. Thus, the catalytic ability at the rGO surface with the defects increases resulting in an enhanced ECL illumination (Fig. 2c and d). More importantly, the oxygen vacancies at the ITO surface are filled with oxygen during irradiation (Fig. S7 and S8†),40,41 leading to a significant decrease in the background ECL intensity (Fig. 2d inset).
With an optimized treatment time (60 s) (Fig. S9†), the ECL at the rGO microsheets increases by approximately 5 times, while the background intensity at the ITO slide decreases by more than 50 times (Fig. 2d and S9b†). Compared with the previous ECL image, the signal-to-noise (S/N) ratio of ECL illumination of rGO after the plasma treatment is improved by two orders of magnitude. When the treatment time exceeds 60 s, the ECL intensity at the rGO microsheet decreases slightly. This phenomenon might be ascribed to the reduced conductivity of rGO after a long plasma treatment time, which damages the skeleton structure of rGO (Fig. S1 and S2†).32,33 Moreover, the background ECL at the ITO surface remains almost the same, indicating the oxygen vacancies are saturated with oxygen. In view of the increase in S/N, shortening the exposure time to record the visual ECL from rGO is feasible.
Considering that the diffusion coefficients (D) for hydroperoxide intermediates and L012 are 7 × 10⁻⁶ cm2 s−1 (ref. 42) and 6.6 × 10⁻⁶ cm2 s−1,43 respectively, the diffusion distance (Δ) in a time period (t) could be calculated according to the diffusion equation:44
| Δ = (2Dt)0.5 | (1) |
The diffusion distance of these intermediates is determined to be 1200 nm with an exposure time of 1 ms, which decreases to 500 nm with an exposure time of 0.2 ms. Since one pixel in our ECL imaging system (40× water immersion objective) is 400 nm, imaging with an exposure time of 0.2 ms should be feasible to avoid overlapping ECL illumination from adjacent pixels.
In the experiments, ECL illumination from individual rGO microsheets after plasma irradiation is initially recorded with an exposure time of 1 ms. Compared with the bright-field image (Fig. 3a), most of the rGO surface emits ECL that is interconnected with adjacent regions (Fig. 3b). Additionally, some ECL is observed surrounding rGO, indicating the diffusion of intermediates during the exposure time. Thus, an exposure time of 1 ms is not short enough to achieve scattered ECL in the image. When the exposure time is set at 0.2 ms, some visual and scattered ECL spots appear in the image (Fig. 3c), as expected. The ECL intensity in the surrounding regions is weak or almost invisible.
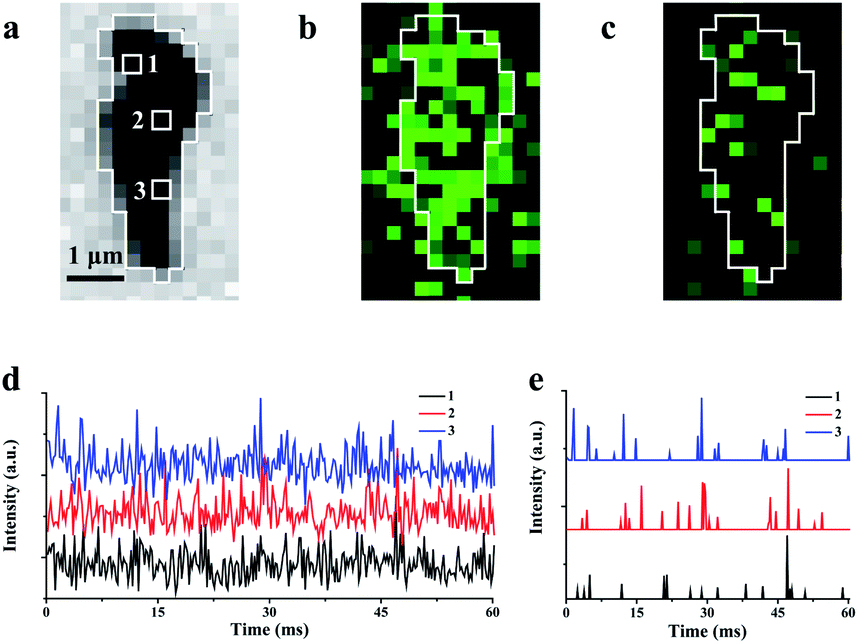 | ||
| Fig. 3 Bright-field image (a) and the corresponding ECL image with 1.0 ms (b) and 0.2 ms (c) exposure times; (d) the ECL intensities at three randomly selected pixels labeled as 1, 2 and 3 in (a); (e) the intermittent emission after the removal of noise from three pixels. | ||
Due to weak ECL illumination, the noise level in the image is carefully characterized to guarantee the authenticity of the ECL signal. Three hundred ECL images from single rGO microsheets with an exposure time of 0.2 ms are recorded continuously. The intensities at three randomly selected pixels are measured and plotted (Fig. 3d). Meanwhile, analysis of the control is conducted at the ITO surface without rGO to determine the noise (Fig. S10a†). The statistical analysis shows that the ECL intensity within 60 ms follows the Gaussian distribution with a standard deviation (σ) of 13.5 a.u. Generally, the standard deviation is used to filter out the noise.45,46 According to this algorithm, 99.7% of the background data are within the range of 3σ (Fig. S10b†). Therefore, we use 3σ as the threshold. After excluding 3σ, no ECL burst was observed from the ITO surface, while most ECL burst on rGO remains (Fig. 3e and S10c†). The observation of these intermittent emissions supports the non-synchronous process, including the accumulation at the surface and the consumption and the re-accumulation of hydrogen peroxide at these sites with different amounts of defects. A similar observation about the non-constant reaction rate at the heterogeneous surface of the catalyst has been reported using many other microscopies.11,33,47,48 The observations of these intermittent signals support our proposed ECL process in which the ECL intensity could be determined from nanometer-sized regions without obvious interruption from adjacent regions.
The average interval time for the intermittent signal is in the range of 2–4 ms (Fig. 3e), which suggests the possible stacking of 10–20 images without re-emission from the previous sites to map the rGO microsheets (Fig. 4a). To pseudocolor scattered ECL spots in the rGO in each image with one specific color, 7 ECL images are selected and only the intensities larger than 3-fold of the noise in each image are shown in Fig. 4a (1–7). The stacking of these images into one graph (Fig. 4b) shows that all the spots in the images are well isolated. Less than 10% of spots overlap, as labeled with “×”, supporting the idea of non-overlapping ECL illumination from adjacent regions. Moreover, the assembly of these spots almost covers the whole rGO surface, which verifies the different abilities to adsorb hydrogen peroxide at these sites to permit ECL emission in batches. Since these sites are not connected in each image, their electrocatalytic activity on the rGO could be determined from the ECL intensity of each pixel with a resolution of 400 nm.
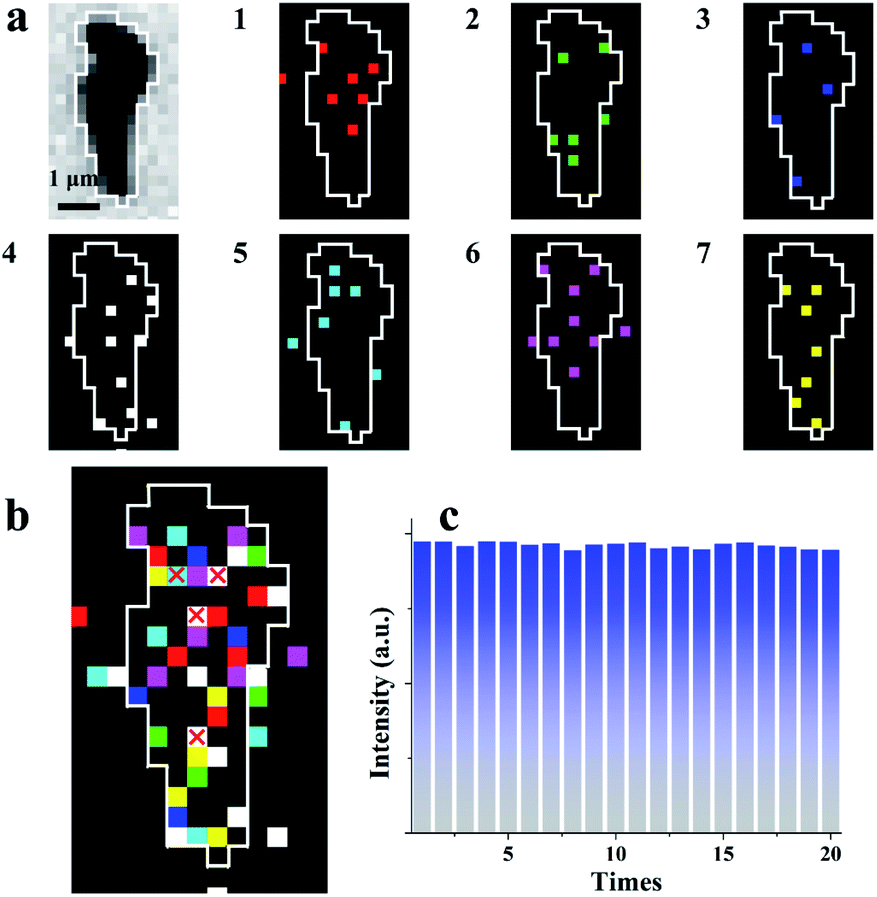 | ||
| Fig. 4 (a) Bright-field image and seven continuous ECL images with removed noise with different pseudocolors and exposure times: 0.2 ms; (b) the stacked image from Fig. 2a with a small amount of overlapping pixel signals (white frame); and (c) 15 ECL images stacked into one image with 20 cycles. | ||
To further verify that this approach could be used to characterize the electrocatalytic activity of a material, 300 consecutive images were stacked into 20 graphs with 15 images in one group (Fig. S11†). Notably, during stacking, a few sites emit ECL twice, which might be ascribed to the fast adsorption of hydrogen peroxide at these special sites. In this case, only the first ECL intensities at these sites are considered in the final graph. The total ECL intensities of a single rGO microsheet in these 20 graphs are measured and listed in Fig. 4c. The total intensities in these graphs are similar, with a relative standard deviation of 2%. This reproducible ECL emission confirms that the measured ECL intensity is reproducible and can be used to characterize the catalytic activity of rGO microsheets. Eventually, the established ECL technique could be used to determine the electrocatalytic activity of a material with a resolution of 400 nm for the first time, which overcomes the spatial resolution limitation of ECL microscopy.
Conclusions
In conclusion, a new ECL microscopy technique, with a high spatial resolution of 400 nm is established based on stochastic ECL illumination. The breakthrough in the spatial resolution of ECL microscopy not only enables characterization of the electrocatalytic features of a single rGO microsheet on the nanometer scale but also extends the capacity of ECL microscopy to visualize electrochemical processes. Research on further applications of this highly spatial ECL imaging in additional materials or assays is ongoing to advance this novel technique.Experimental
Chemicals
L012 (luminol analog, 8-amino-5-chloro-7-phenylpyrido [3,4-d]pyridazine-1,4(2H,3H) dione) was purchased from Wako Chemical (Richmond, USA). Graphene oxide (GO) was obtained from OBO New Materrial (Haike, China). All the other chemicals were obtained from Sigma-Aldrich Chemicals (St. Louis, USA).Synthesis of rGO microsheets
An aqueous GO suspension (2 mg mL−1) is first sonicated for 3 h, and then, freeze-dried to yield a brown sample. The obtained sample is annealed under N2 at 550 °C for 3 h converting GO into reduced GO (rGO). After cooling to room temperature under N2 protection, the final product of black rGO microsheets is obtained. To improve the signal-to-noise ratio of ECL emission at individual rGO microsheets, ITO slides containing rGO microsheets are treated with oxygen plasma irradiation for different times (0, 30, 60 and 90 s). The power of the irradiation is set at 240 W.Characterization of rGO microsheets
The morphology and structure of rGO microsheets are investigated by transmission electron microscopy (TEM, JEM-2100, JEOL Ltd, Japan) and scanning electron microscopy (SEM, S-4800, Hitachi Ltd, Japan). High resolution transmission electron microscopy (HRTEM) images are obtained on a JEM-2800(JEOL Ltd, Japan). The X-ray photoelectron spectra (XPS) are collected using a PHI 5000 Versaprobe X-ray photoelectron spectrometer using monochromatized Al-Kα X-rays as the excitation source (UIVAC-PHI, Japan). The defects at the surface are investigated using an inVia-Reflex Laser confocal Raman spectrometer with a 633 nm laser (Renishaw, England). Contact angle measurements are performed using a contact angle measuring device (OCA30, Dataphysics Instruments, Germany).ECL imaging of single rGO microsheets
The diluted rGO microsheets are drop-cast on the ITO slides and dried at 80 °C for 5 h. For ECL imaging, the ITO slides coated with rGO microsheets are used as the working electrode and an Ag/AgCl wire as the reference electrode. The solution is 1× phosphate buffered saline (PBS, pH 10) containing 200 μM L012 and 1 mM hydrogen peroxide. To induce optimal ECL from rGO microsheets and the supporting ITO surface, a potential of 1.0 V (vs. Ag/AgCl) is applied using a voltage generator (Rigol DG2000, Beijing, China). The ECL images are collected by using a microscope (Olympus BX 51, Japan) with a water-immersion objective (×40, Olympus, Japan), and projected onto an electron multiplying CCD (EM CCD) (515 × 512 pixels, Evolve, Photometrics, Tucson, AZ).Conflicts of interest
There are no conflicts to declare.Acknowledgements
We gratefully acknowledge the support from the National Natural Science Foundation of China (no. 21874069 and 22025403).Notes and references
- N. Limani, A. Boudet, N. Blanchard, B. Jousselme and R. Cornut, Chem. Sci., 2021, 12, 71–98 RSC.
- P. Chen, X. Zhou, N. M. Andoy, K. S. Han, E. Choudhary, N. Zou, G. Chen and H. Shen, Chem. Soc. Rev., 2014, 43, 1107–1117 RSC.
- W. Xu, J. S. Kong, Y. T. Yeh and P. Chen, Nat. Mater., 2008, 7, 992–996 CrossRef CAS.
- T. Chen, B. Dong, K. Chen, F. Zhao, X. Cheng, C. Ma, S. Lee, P. Zhang, S. H. Kang, J. W. Ha, W. Xu and N. Fang, Chem. Rev., 2017, 117, 7510–7537 CrossRef CAS.
- W. Wei, T. Yuan, W. Jiang, J. Gao, H. Y. Chen and W. Wang, J. Am. Chem. Soc., 2020, 142, 14307–14313 CrossRef CAS.
- J. B. Sambur and P. Chen, Annu. Rev. Phys. Chem., 2014, 65, 395–422 CrossRef CAS.
- W. Wang, Chem. Soc. Rev., 2018, 47, 2485–2508 RSC.
- F. T. Patrice, K. Qiu, Y. L. Ying and Y. T. Long, Annu. Rev. Anal. Chem., 2019, 12, 347–370 CrossRef.
- C. L. Bentley, M. Kang, F. M. Maddar, F. Li, M. Walker, J. Zhang and P. R. Unwin, Chem. Sci., 2017, 8, 6583–6593 RSC.
- J. H. K. Pfisterer, Y. Liang, O. Schneider and A. S. Bandarenka, Nature, 2017, 549, 74–77 CrossRef CAS.
- J. H. Zhong, X. Jin, L. Meng, X. Wang, H. S. Su, Z. L. Yang, C. T. Williams and B. Ren, Nat. Nanotechnol., 2017, 12, 132–136 CrossRef CAS.
- C. Wang, A. Fukazawa, M. Taki, Y. Sato, T. Higashiyama and S. Yamaguchi, Angew. Chem., 2015, 54, 15213–15217 CrossRef CAS.
- A. Acharya, A. M. Bogdanov, B. L. Grigorenko, K. B. Bravaya, A. V. Nemukhin, K. A. Lukyanov and A. I. Krylov, Chem. Rev., 2017, 117, 758–795 CrossRef CAS.
- M. Wujian, Chem. Rev., 2008, 108, 2506–2553 CrossRef.
- J. Zhang, S. Arbault, N. Sojic and D. Jiang, Annu. Rev. Anal. Chem., 2019, 12, 275–295 CrossRef CAS.
- F. Deiss, C. N. LaFratta, M. Symer, T. M. Blicharz, N. Sojic and D. R. Walt, J. Am. Chem. Soc., 2009, 131, 6088–6089 CrossRef CAS.
- J. Zhang, R. Jin, D. Jiang and H. Y. Chen, J. Am. Chem. Soc., 2019, 141, 10294–10299 CrossRef CAS.
- L. Xu, Y. Li, S. Wu, X. Liu and B. Su, Angew. Chem., 2012, 51, 8068–8072 CrossRef CAS.
- S. Voci, B. Goudeau, G. Valenti, A. Lesch, M. Jovic, S. Rapino, F. Paolucci, S. Arbault and N. Sojic, J. Am. Chem. Soc., 2018, 140, 14753–14760 CrossRef CAS.
- Y. Wang, R. Jin, N. Sojic, D. Jiang and H. Y. Chen, Angew. Chem., 2020, 59, 10416–10420 CrossRef CAS.
- Y.-L. Chang, R. E. Palacios, F.-R. F. Fan, A. J. Bard and P. F. Barbara, J. Am. Chem. Soc., 2008, 130, 8906–8907 CrossRef CAS.
- A. J. Wilson, K. Marchuk and K. A. Willets, Nano Lett., 2015, 15, 6110–6115 CrossRef CAS.
- S. Pan, J. Liu and C. M. Hill, J. Phys. Chem. C, 2015, 119, 27095–27103 CrossRef CAS.
- M. J. Zhu, J. B. Pan, Z. Q. Wu, X. Y. Gao, W. Zhao, X. H. Xia, J. J. Xu and H. Y. Chen, Angew. Chem., 2018, 57, 4010–4014 CrossRef CAS.
- C. Ma, H. F. Wei, M. X. Wang, S. Wu, Y. C. Chang, J. Zhang, L. P. Jiang, W. Zhu, Z. Chen and Y. Lin, Nano Lett., 2020, 20, 5008–5016 CrossRef CAS.
- W. Guo, H. Ding, P. Zhou, Y. Wang and B. Su, Angew. Chem., 2020, 59, 6745–6749 CrossRef CAS.
- Y. Chen, D. Zhao, J. Fu, X. Gou, D. Jiang, H. Dong and J. J. Zhu, Anal. Chem., 2019, 91, 6829–6835 CAS.
- C. Cui, Y. Chen, D. Jiang, H. Y. Chen, J. Zhang and J. J. Zhu, Anal. Chem., 2019, 91, 1121–1125 CrossRef CAS.
- J. Zhou, G. Ma, Y. Chen, D. Fang, D. Jiang and H. Y. Chen, Anal. Chem., 2015, 87, 8138–8143 CrossRef CAS.
- J. Du, Z.-L. Lang, Y.-Y. Ma, H.-Q. Tan, B.-L. Liu, Y.-H. Wang, Z.-H. Kang and Y.-G. Li, Chem. Sci., 2020, 11, 3007–3015 RSC.
- J.-X. Liu, D. Richards, N. Singh and B. R. Goldsmith, ACS Catal., 2019, 9, 7052–7064 CrossRef CAS.
- J. Li, Z. Xia, M. Zhang, S. Zhang, J. Li, Y. Ma and Y. Qu, J. Mater. Chem. A, 2019, 7, 17775–17781 RSC.
- X. Zhou, N. M. Andoy, G. Liu, E. Choudhary, K. S. Han, H. Shen and P. Chen, Nat. Nanotechnol., 2012, 7, 237–241 CrossRef CAS.
- L. Tao, Q. Wang, S. Dou, Z. Ma, J. Huo, S. Wang and L. Dai, Chem. Commun., 2016, 52, 2764–2767 RSC.
- C. Cui, Y. Chen, D. Jiang, J. J. Zhu and H. Y. Chen, Anal. Chem., 2017, 89, 2418–2423 CrossRef CAS.
- H. Zhu, R. Jin, D. Jiang and J. J. Zhu, ACS Appl. Mater. Interfaces, 2019, 11, 46666–46670 CrossRef CAS.
- S. Dou, L. Tao, R. Wang, S. El Hankari, R. Chen and S. Wang, Adv. Mater., 2018, 30, e1705850 CrossRef.
- Y. Zhang, L. Tao, C. Xie, D. Wang, Y. Zou, R. Chen, Y. Wang, C. Jia and S. Wang, Adv. Mater., 2020, 32, e1905923 CrossRef.
- Z. Liu, Z. Zhao, Y. Wang, S. Dou, D. Yan, D. Liu, Z. Xia and S. Wang, Adv. Mater., 2017, 29, e1606207 CrossRef.
- S. N. Luo, A. Kono, N. Nouchi and F. Shoji, J. Appl. Phys., 2006, 100, 113701 CrossRef.
- D.-K. Hwang, M. Misra, Y.-E. Lee, S.-D. Baek, J.-M. Myoung and T. I. Lee, Appl. Surf. Sci., 2017, 405, 344–349 CrossRef CAS.
- E. J. Vitt, C. D. Johnso and R. C. Engstrom, J. Electrochem. Soc., 1991, 138, 1637–1643 CrossRef.
- M. Okuda, T. Tsuruta and K. Katayama, Phys. Chem. Chem. Phys., 2009, 11, 2287–2292 RSC.
- N. S. Ginsberg and W. A. Tisdale, Annu. Rev. Phys. Chem., 2020, 71, 1–30 CrossRef CAS.
- CMS Collaboration, Phys. Lett. B, 2012, 716, 30–61 CrossRef.
- ATLAS Collaboration, Phys. Lett. B, 2018, 784, 173–191 CrossRef.
- Y. Fang, Z. Li, Y. Jiang, X. Wang, H. Y. Chen, N. Tao and W. Wang, Proc. Natl. Acad. Sci. U. S. A., 2017, 114, 10566–10571 CrossRef CAS.
- I. Liberman, W. He, R. Shimoni, R. Ifraemov and I. Hod, Chem. Sci., 2020, 11, 180–185 RSC.
Footnote |
| † Electronic supplementary information (ESI) available: Characterization of rGO and more ECL images. See DOI: 10.1039/d0sc06967a |
| This journal is © The Royal Society of Chemistry 2021 |