
 Open Access Article
 This Open Access Article is licensed under a Creative Commons Attribution-Non Commercial 3.0 Unported Licence
Modulation of the superficial electronic structure via metal–support interaction for H2 evolution over Pd catalysts†
Jin
Wang
a,
Dan
Cheng
bc,
Mengmeng
Gao
a,
Qian
Li
a,
Ying
Xin
a,
Nana
Zhang
a,
Zhaoliang
Zhang
 *ad,
Xuehua
Yu
d,
Zhen
Zhao
*d and
Kebin
Zhou
*b
*ad,
Xuehua
Yu
d,
Zhen
Zhao
*d and
Kebin
Zhou
*b
aSchool of Chemistry and Chemical Engineering, Shandong Provincial Key Laboratory of Fluorine Chemistry and Chemical Materials, University of Jinan, Jinan 250022, P. R. China. E-mail: chm_zhangzl@ujn.edu.cn
bSchool of Chemical Sciences, University of Chinese Academy of Sciences, Beijing 100049, P. R. China. E-mail: kbzhou@ucas.ac.cn
cDepartment of Biological Sciences, National University of Singapore, 117543, Singapore
dInstitute of Catalysis for Energy and Environment, College of Chemistry and Chemical Engineering, Shenyang Normal University, Shenyang 110034, Liaoning, P. R. China. E-mail: zhenzhao@cup.edu.cn
First published on 4th January 2021
Abstract
Electronic interactions can radically enhance the performance of supported metal catalysts and are critical for fundamentally understanding the nature of catalysts. However, at the microscopic level, the details of such interactions tuning the electronic properties of the sites on the metal particle's surface and metal–support interface remain obscure. Herein, we found polarized electronic metal–support interaction (pEMSI) in oxide-supported Pd nanoparticles (NPs) describing the enhanced accumulation of electrons at the surface of NPs (superficial Pdδ−) with positive Pd atoms distributed on the interface (interfacial Pdδ+). More superficial Pdδ− species mean stronger pEMSI resulting from the synergistic effect of moderate Pd–oxide interaction, high structural fluxionality and electron transport activity of Pd NPs. The surface Pdδ− species are responsible for improved catalytic performance for H2 evolution from metal hydrides and formates. These extensive insights into the nature of supported-metal NPs may open new avenues for regulating a metal particle's electronic structure precisely and exploiting high-performance catalysts.
Introduction
Metal–support interactions (MSIs) have become one of the most important and challenging topics for metal nanoparticle (NP)-supported catalysts over the past few decades.1–5 Specifically, strong metal–support interaction (SMSI), a term coined by Tauster et al.,6 has been widely accepted as a key determinant of catalytic performance which mainly originates from mass transport, i.e., metal encapsulation by a support overlayer.7,8 Recently, an electronic metal–support interaction (EMSI) different from the classic SMSI, as described by Campbell,9 was proposed to describe observed electronic perturbations (or charge transfer) at the metal–support interface, which is really effective in rationalizing the significantly enhanced catalytic activity in chemical processes such as the water–gas shift reaction (WGSR),10–12 O2 activation13 and H2 desorption.14The EMSI offers a viewpoint to directly correlate the electronic state of interface metal species with the bonding between the metal and the support. As observed by Rodriguez et al. in Au/TiC,15 interface Au atoms, in direct contact with the TiC(001) support, exhibit strong electronic interactions with the support and excellent WGS activity, while the top atoms of multilayer Au NPs undergo negligible electronic modification. Quantitative insights into charge transfer demonstrate that the EMSI reaches a maximum only for particles of around 50 atoms.2,16 Interestingly, a monotonic increase in the number of electrons lost per Pt particle with the Pt NP size (>50 atoms) was also observed, suggesting that inhomogeneous electron distribution across the particles occurred. Recently, long-range surface charging of NPs proposed in theoretical simulations has shown that electrons transferred from the support could accumulate at the outer surface of the NPs rather than at the direct contact interface.17,18
Therefore, both superficial and interfacial electronic redistribution induced by MSIs should be emphasized to elucidate the nature of the unique properties of supported metal NPs.19–21 However, to our knowledge, the inhomogeneous electronic distribution on supported NPs at the atomic scale has not been reported yet.
Metal hydrides and formates are important hydrogen carriers. Their decomposition or dehydrogenation is an efficient approach to obtain ultraclean H2 and is an indispensable process in the hydrogen economy, for instance, H2 storage systems22 and H2 production from biomass.23 Supported-Pd catalysts are robust in catalytic H2 evolution, especially for Pd ultrafine NPs with abundant electrons.24,25 However, achieving high-efficiency catalytic H2 evolution under ambient conditions is still the key issue and challenge.
Herein, we reported a systematic study on the localized electron distribution of oxide-supported monodispersed Pd particles using a combination of theoretical calculations and convincing experiments. A polarized electronic effect, referred to in this study as polarized EMSI (pEMSI), was then proposed. The concept of pEMSI describes the enhanced accumulation of electrons at the surface of NPs with positive Pd atoms distributed on the opposite side of the particle i.e., at the metal–support interface. The peculiar pEMSI promotes H2 evolution from hydride decomposition and formate dehydrogenation over Pd/MOx (MOx, metal oxides), which not only contributes to a deep understanding of MSIs but also shifts the common perception of electron transfer between metal NPs and oxide supports (EMSI), highlighting the significance of the electron redistribution phenomenon as a hot focus in future catalysis research.
Experimental
Computational details
Based on the plane-wave approach, all DFT calculations were performed using the Vienna ab initio simulation package (VASP). The projector augmented wave (PAW) potential and the generalized gradient approximation PBE exchange–correlation functional were widely used to study the electron interactions of transition-metal oxides with an energy cut-off of 450 eV. U correction was added to better describe the Ce (U = 5) and Ti (U = 5) systems with strongly correlated 4f and 3d electrons, respectively. In this study, the differences in total energy and in self-consistent forces were limited to 10−4 eV and 0.02 eV Å−1, respectively. These systems were placed in periodic supercells with a vacuum region of 20 Å. The 3 × 3, 3 × 2, 1 × 1 and 2 × 2 surface models with several atomic layers were employed for CeO2, TiO2, Al2O3 and SiO2, respectively, to avoid interaction.Catalyst preparation
Catalyst characterization
All of the size and morphology images were obtained with a Hitachi H-7650 transmission electron microscope (TEM), a JSM-7610F Field Emission SEM and a FEI Tecnai F20 high-resolution transmission electron microscope (HRTEM). The Pd loading was measured with a Varian Vista MPX Inductively Coupled Plasma Optical Emission Spectrometer (ICP-OES). The X-ray diffraction (XRD) patterns were obtained with a Bruker D8 Advance X-ray diffractometer with Cu Kα radiation (λ = 1.5418 Å), and the data were recorded at a scan rate of 4°·min−1. ChemiSorb 2720 apparatus equipped with a TCD detector was used to obtain temperature-programmed reduction (TPR) data. The TPD signal was collected directly from 10 °C to 200 °C using a 5 vol% H2/Ar mixture. The photoelectron spectra were obtained using X-ray photoelectron spectroscopy (XPS, ESCALAB 250 Xi) with Al Kα radiation. For the re-oxidization process, the fresh Pd/MOx catalysts were re-oxidized under a 20% O2/N2 atmosphere at 300 °C for 1 hour and then cooled down to room temperature, followed by 5% H2/Ar flushing for 30 min at 25 °C. These samples were denoted as Pd/MOx–O. The in situ DRIFTS spectra of CO chemisorption were obtained using a Bruker VERTEX 70 equipped with an MCT detector at a resolution of 4 cm−1. The Pd/MOx catalysts were pre-treated under Ar at 25 °C for 60 min and then exposed to a CO/Ar atmosphere for 30 min. Following Ar flushing for 30 min, the spectra were collected during the flushing.Catalyst activity evaluation
ChemiSorb 2720 apparatus equipped with a TCD detector was used to obtain temperature-programmed hydride decomposition (TPHD) data. Prior to TPHD experiments, the catalysts (50 mg), placed in TPR tubes, were pre-treated under a 5 vol% H2/Ar mixture with a temperature ramp of 10° min−1, up to 150 °C, and then cooled down to <10 °C under H2/Ar gas using an ice-water bath. TPR analysis was continued until a stable baseline was achieved under a low temperature (<10 °C). The activity of catalytic dehydrogenation of aqueous sodium formate was evaluated at atmospheric pressure and ambient temperature with a water bath. In a typical procedure, the catalysts (50 mg) placed in a reactor (25 mL) were well dispersed in 5 mL deionized water via sonication for 10 min. Once the formate solution (6 mol L−1, 5 mL) was added into the vessel, the catalytic reaction took place under stirring constantly. The volumes of gas generated were collected and monitored using an RTK-GMA-I gas metering cell.Results and discussion
First-principles calculations were first employed to construct a series of MSIs by investigating Pd4 clusters supported on well-defined oxides SiO2(001), Al2O3(110), TiO2(110) and CeO2(100), denoted Pd4/MOx, as examples. Fig. 1A shows the optimized geometric configurations of Pd4/MOx.28 The adsorption energy of the Pd4 clusters increases in the sequence SiO2 (0.85 eV) < Al2O3 (2.12 eV) < TiO2 (3.05 eV) < CeO2 (4.44 eV), which is accompanied by a decrease in the distance between the Pd4 cluster and the oxide surface (Fig. 1B), suggesting that the strength of the MSI increases in the order Pd4/SiO2 < Pd4/Al2O3 < Pd4/TiO2 < Pd4/CeO2. Then, the Bader charge of each Pd atom was calculated to explore MSI-derived EMSI by analysing the interface electron transfer of Pd4 clusters (Fig. 1C, yellow area).29 The increase in the electronic perturbations of the Pd4 clusters followed the same sequence as the MSI, as did the planar-averaged charge density difference along the Z-direction (Fig. 1D). Both results demonstrate the increase of EMSI with the MSI increase.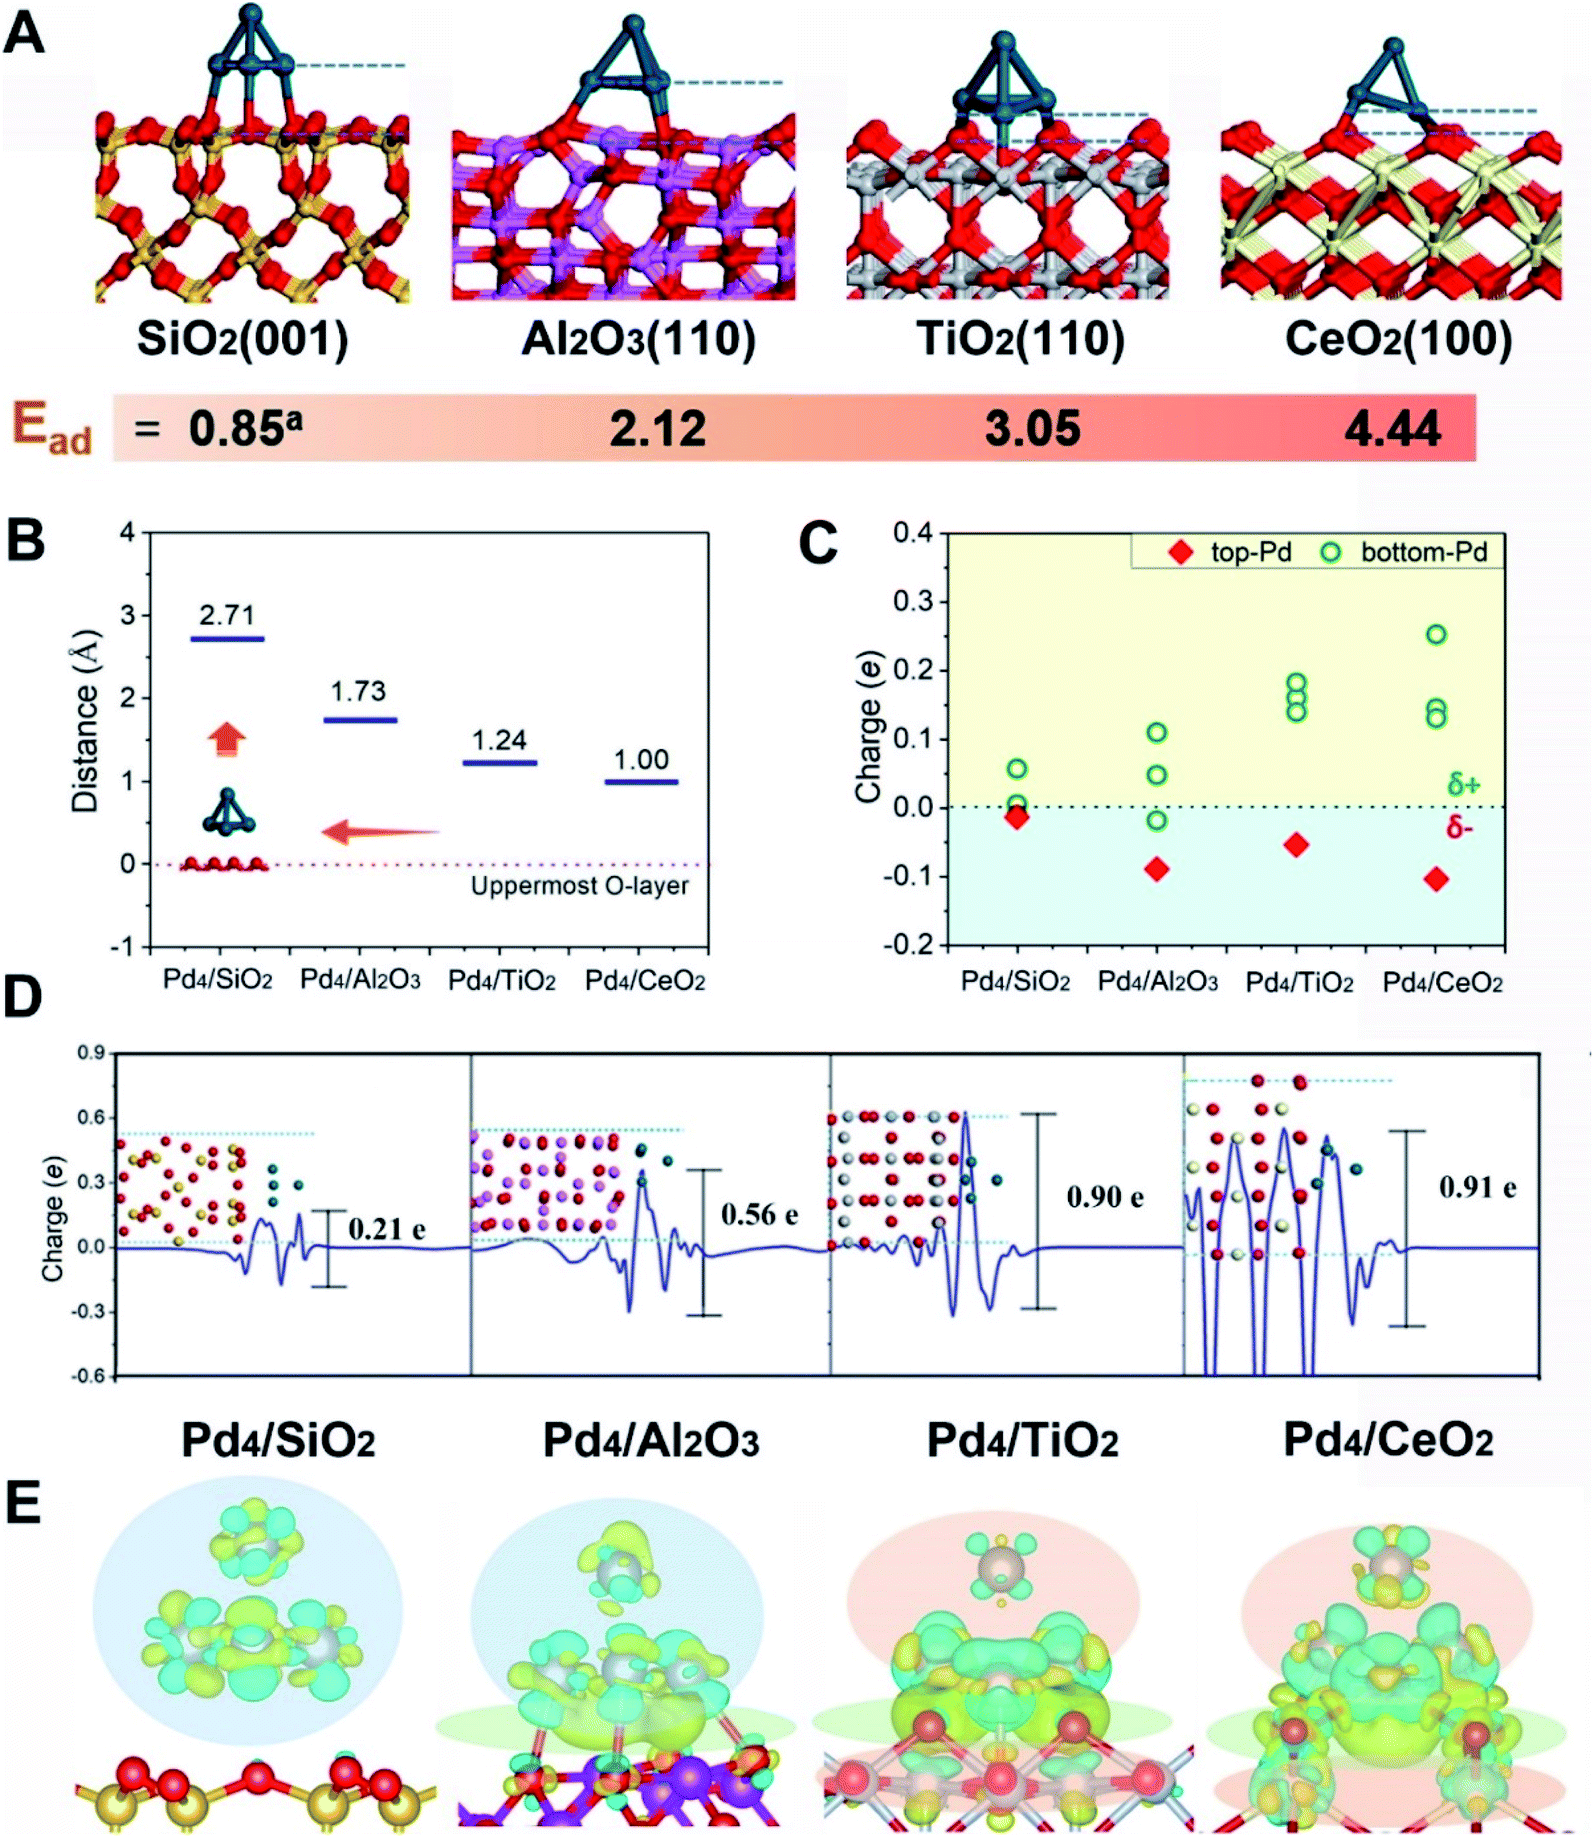 | ||
| Fig. 1 (A) Optimized geometric configurations for Pd4/SiO2(001), Pd4/Al2O3(110), Pd4/TiO2(110) and Pd4/CeO2(100) from first-principles simulations. The supports were chosen for different surface behaviours – SiO2 does not exhibit SMSI behaviour, Al2O3 and CeO2 possibly exhibit SMSI behaviour under particular conditions, whereas TiO2 is a well accepted support for exploring SMSI. The nanoparticle atoms are shown as Pd-dark blue and O-red, and the metal cation atoms of the supports are Ce-white, Ti-grey, Al-pink and Si-yellow. Adsorption energies (Ead) describing adsorption of the Pd4 cluster on the oxide surfaces are provided. Superscript a represents the Ead with dispersion corrections. (B) The distance between the contact layer of the Pd4 cluster and the uppermost surface oxygen atom of the oxide supports. This is the closest Pd–O contact. (C) Bader charge analysis of Pd atoms after adsorption on the surface of the oxide supports. (D) Charge transfer of the plane-averaged charge along the Z-direction of Pd4/MOx. The fluctuation at the interface suggests some electron transfer from the interfacial Pd atoms to the MOx, and the negative value at the surface suggests some electron accumulation on the superficial Pd atoms. (E) Electron density difference maps for Pd4/MOx. Electron accumulation and depletion of atoms are represented by blue and yellow areas, respectively. | ||
Significantly, a unique electron redistribution was found from Fig. 1C, that is the top Pd atoms bear negative charges, while Pd atoms at the bottom bear positive charges, especially for Pd4/TiO2 and Pd4/CeO2. The electron density difference maps (Fig. 1E) provide a further vivid illustration of charge redistribution of Pd clusters, in which the spheres of electron accumulation and depletion are marked in the orange area and green area in the direction perpendicular to the support surface, respectively. This charge separation between the surface and interface (i.e., the pEMSI) completely differs from the currently accepted understanding of EMSI induced electronic modification of metal NPs. The latter mainly describes the interfacial electron transfer, including metal → oxide (positively charged Pt10) or oxide → metal (negatively charged Au30 and Ni11 species). Furthermore, upon increasing the number of Pd atoms in NPs, an obvious pEMSI in Pd10/TiO2 is still observed as in Pd4/TiO2 (Fig. 2A and B), with positively and negatively charged Pd atoms distributed on opposite sides of the NPs. In addition, the Bader charge analysis of Pd22/TiO2 also sends a significant message that the unique electron redistribution still occurred for the larger cluster (Pd22). As shown in Fig. 2C and D, the Pd atoms at the top bear negative charges, while those at the bottom bear positive charges. Comparatively, the Pd atoms in the middle layer of the Pd22 cluster exhibit a nearly metallic state.
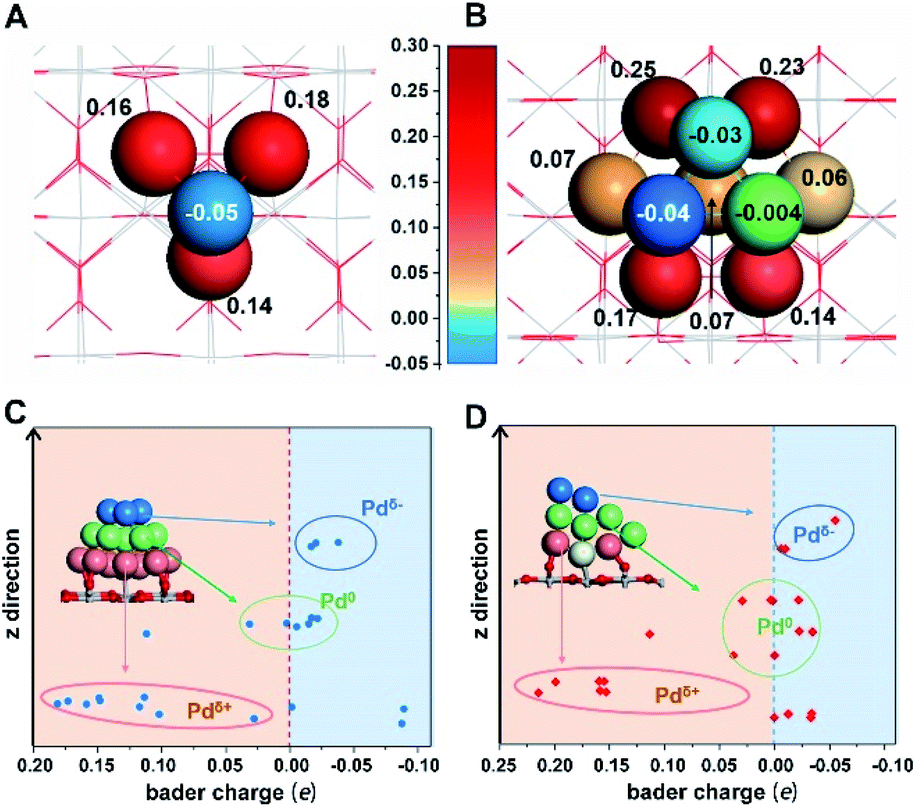 | ||
| Fig. 2 Bader charge analysis for (A) Pd4, (B) Pd10 and (C and D) Pd22 on TiO2(110). The insets in (C) and (D) show the structures of Pd22/TiO2(110). The blue, green and red balls represent the top, middle and bottom Pd atoms in the Pd22 cluster. Along the z-direction, the charge evolution of Pd atoms from Pdδ+ (red circle) to Pd0 (green circle) and then Pdδ− (blue circle). Outliers arise because a few atoms present an exceptional electronic state influenced by the surface Ti-atoms. | ||
In order to experimentally verify the theoretical discoveries, simultaneous control over the size of the Pd NPs and the exposed facets of supports was carried out. We synthesized the oxide-supported Pd catalysts with the colloidal deposition method. Generally, the classic SMSI is simultaneous with EMSI following a high temperature reduction treatment, as observed for TiO2-supported Pt and Pd (>250 °C)7,31 and TiO2-supported Au (>300 °C).8 In this study, however, low temperature reduction (150 °C, H2/Ar) was adopted (denoted as Pd/MOx) to rule out the geometric effect (metal encapsulation) for a complete understanding of the fundamental electronic redistribution for supported Pd NPs. As Fig. 3A shows, the Pd/MOx with uniformly sized Pd NPs (∼2–3 nm) on oxides having a uniform morphology (Fig. S1†) and terminated by well-defined SiO2{001}, Al2O3{110}, TiO2{110} and CeO2{100} facets were prepared (more TEM images and the corresponding histograms of the particle size distribution are shown in Fig. S2 and S3†). The X-ray diffraction (XRD) patterns of Pd/MOx (Fig. S4†) show only the peaks from the supports. The diffraction peaks of Pd metal were not observed (except for Pd/SiO2), indicating that the Pd NPs were too small to be detected by XRD. For Pd/SiO2, the broad Pd(111) peak was due to the weak diffraction contribution from the amorphous silicon support. The Pd loadings measured by inductively coupled plasma optical emission spectrometry (ICP-OES) are around 1.7 wt% for all Pd/MOx samples (Table S1†).
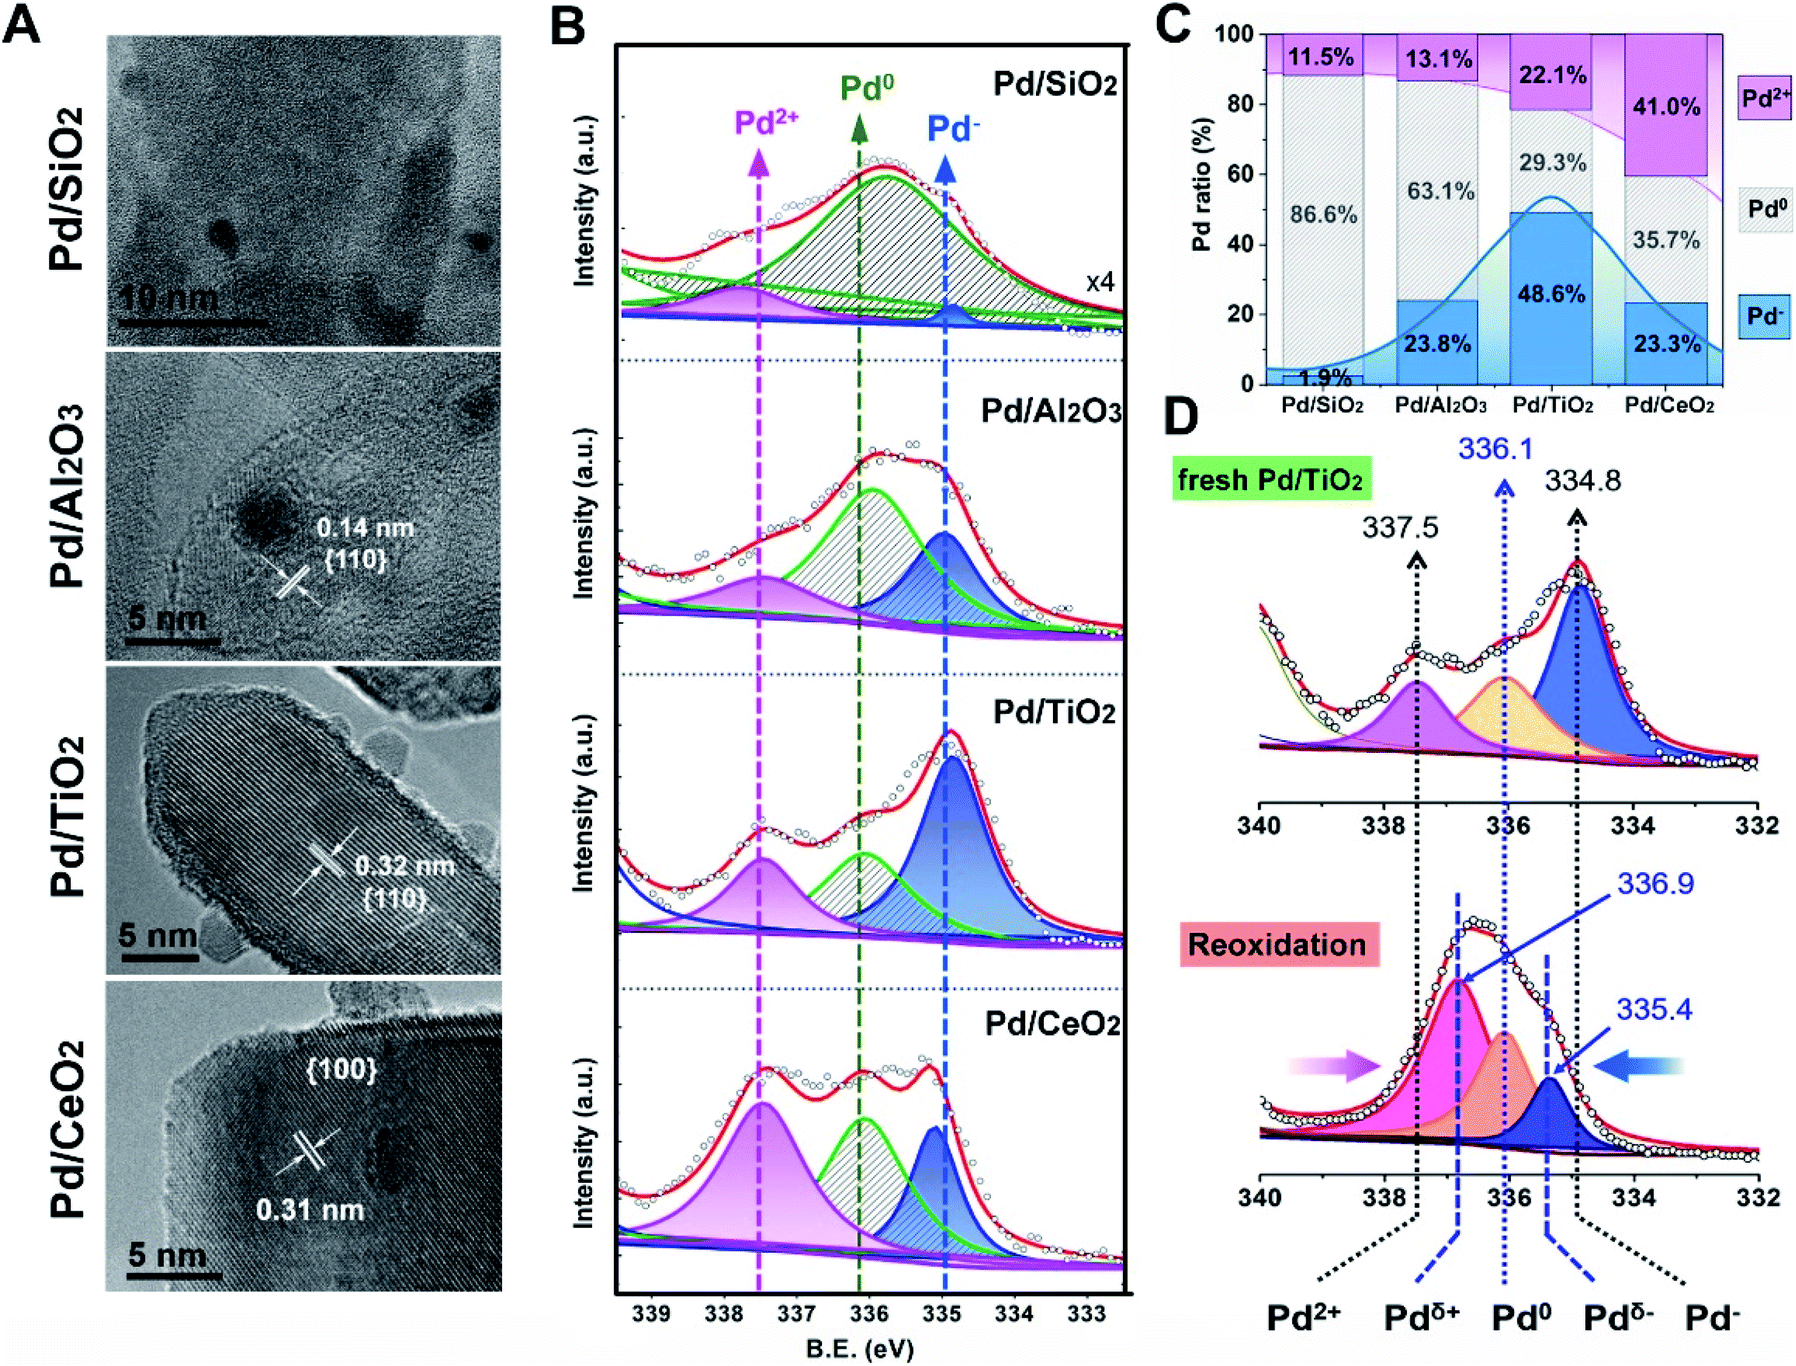 | ||
| Fig. 3 (A) HRTEM images of Pd/MOx: Pd/SiO2(001), Pd/Al2O3(110), Pd/TiO2(110) and Pd/CeO2(100). (B) Pd 3d XPS profiles for Pd/MOx, where the peaks for Pd2+, Pd0 and Pd− species are given in pink, shaded stripes and blue, respectively. (C) The relative proportions of Pd2+, Pd0 and Pd− species in Pd/MOx. (D) Comparison of peak positions and heights upon reversal treatment: (up) the fresh Pd/TiO2 and (down) Pd/TiO2–O, reoxidation treatment of the fresh Pd/TiO2 at 300 °C under O2/N2 followed by 5% H2/Ar flushing for 30 min at 25 °C. | ||
Based on the well-defined structure of Pd/MOx, the electronic structures were then probed using X-ray photoelectron spectroscopy (XPS). As observed in Fig. 3B, the peak at high binding energy (337.5 eV) is ascribed to Pd2+ species, relevant to the electronic transfer from Pd NPs to supports, the varying amount of which suggests distinct metal–support interaction in Pd/MOx (discussed later). The peak at ∼334.8 eV is assigned to Pd− species according to the Kai Siegbahn method where the per unit charge corresponds to a binding energy shift of ∼1.3 eV from the typical Pd0 position.32,33 The accumulation of negative charges in NPs (Pd− species), resulting from the polarization effect, demonstrated the occurrence of electronic redistribution (charge separation). Specifically, the clear coexistence of three valence states of Pd (Pd2+, Pd0 and Pd−) in differing proportions (Fig. 3C, D and S5†), reveals that polarization effects with varying degrees are present in the Pd/MOx system.
Despite revealing the charge separation across Pd NPs, it remains to be seen whether the accumulation of electrons occurred on the surface. So, the surface Pd species were further verified by in situ diffuse reflectance Fourier transform infrared spectroscopy (DRIFT) to track the Pd− species more precisely (Fig. 4, S6 and S7†).
For Pd/SiO2 (Fig. 4A) and Pd/Al2O3 (Fig. 4B), two broad absorption peaks (∼2090 cm−1 and ∼1950 cm−1) were observed, which were attributed to linearly and multiply coordinated CO, respectively, adsorbed at Pd0 sites.34,35 These peaks disappeared after 20 min of flushing with Ar due to weak CO adsorption on Pd NPs exhibiting low MSI with SiO2 or Al2O3. Differently, the CO adsorption on Pdδ− sites at 1973 cm−1 was observed on Pd/Al2O3 originating from moderate electronic modification, consistent with the results from XPS. In contrast, a similar peak at 1990 cm−1 was significantly strong for Pd/TiO2 (Fig. 4C) and did not disappear after subsequent flushing with Ar, suggesting that abundant Pdδ− species exist, in far greater proportion to the other species, on the surface of the Pd NPs. This was further evidenced by the band shift from 2097 to 2066 cm−136 because the relative redshift (30 cm−1) reflects electron donation from the surface Pdδ− atoms to the π* C![[double bond, length as m-dash]](https://www.rsc.org/images/entities/char_e001.gif) O orbital. For Pd/CeO2 (Fig. 4D), although both superficial Pd0 species (2092 cm−1) and Pdδ− species (2067 and 1980 cm−1) were observed, a new pronounced peak at 2145 cm−1, assigned to CO adsorption on Pd2+ species,37 suggests partially interfacial Pd2+ species simultaneously exposed to the interfacial perimeter in the presence of superficial Pd0 species and Pdδ− species. More details of the CO adsorption structure and additional explanations are shown in Fig. 4E and the ESI.†
O orbital. For Pd/CeO2 (Fig. 4D), although both superficial Pd0 species (2092 cm−1) and Pdδ− species (2067 and 1980 cm−1) were observed, a new pronounced peak at 2145 cm−1, assigned to CO adsorption on Pd2+ species,37 suggests partially interfacial Pd2+ species simultaneously exposed to the interfacial perimeter in the presence of superficial Pd0 species and Pdδ− species. More details of the CO adsorption structure and additional explanations are shown in Fig. 4E and the ESI.†
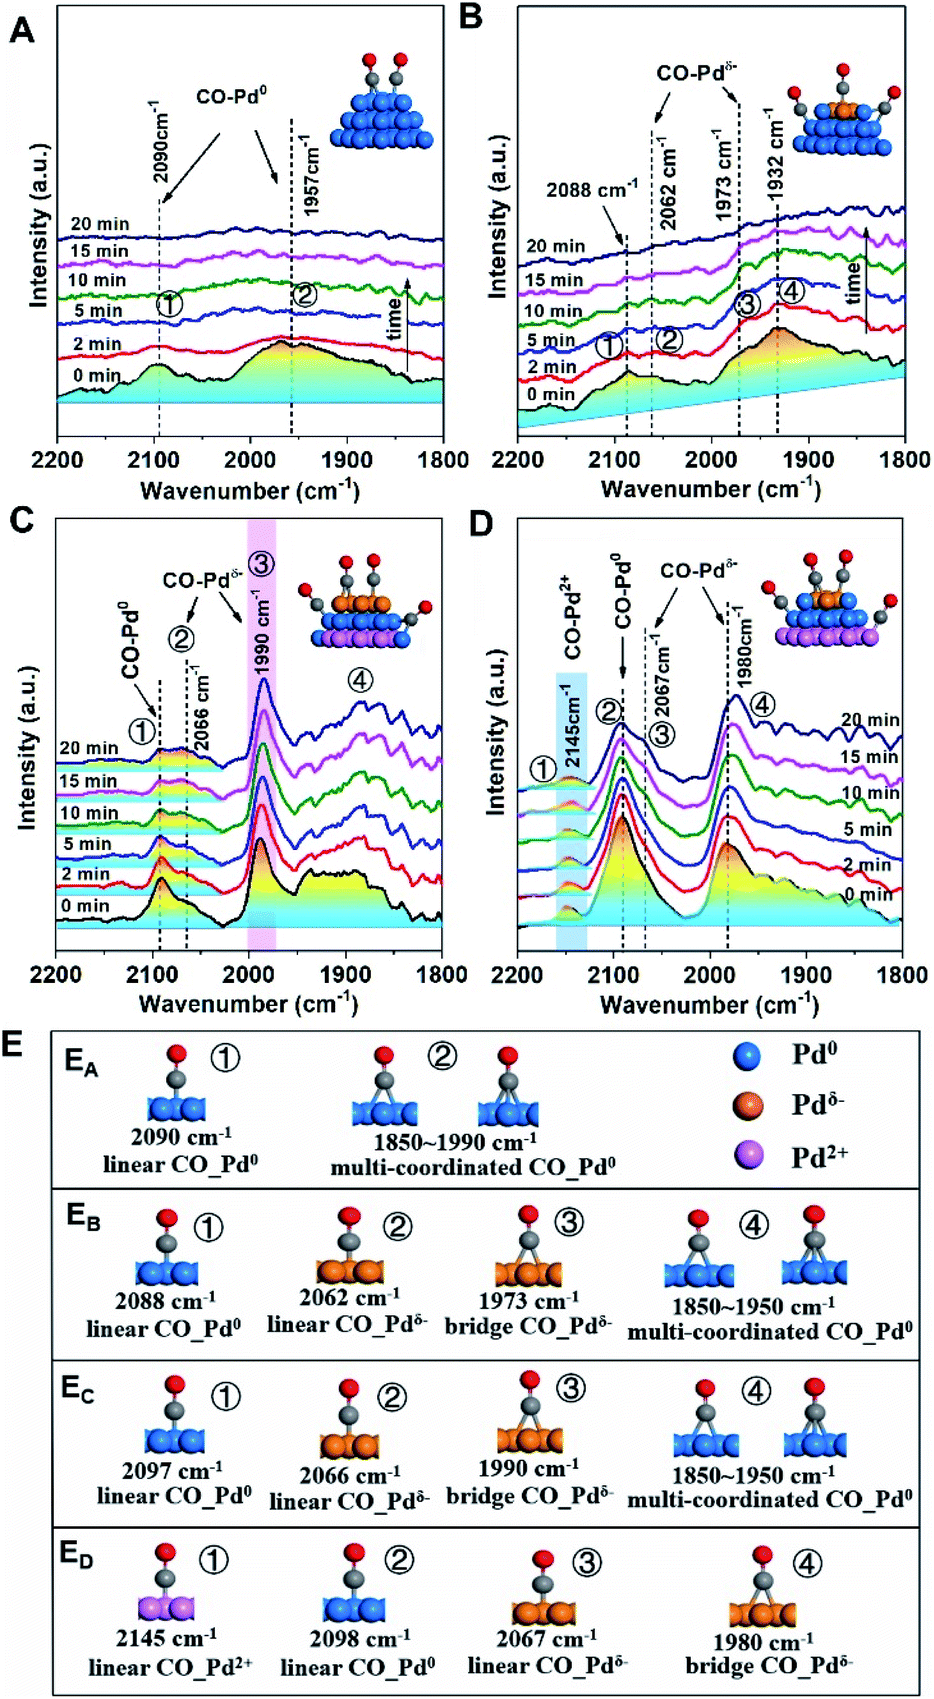 | ||
| Fig. 4 Changes of in situ DRIFTS spectra with Ar purging from 0 to 20 min after CO chemisorption over Pd/MOx at 25 °C: (A) Pd/SiO2; (B) Pd/Al2O3; (C) Pd/TiO2; and (D) Pd/CeO2. The catalysts were pre-treated in situ at 25 °C under an Ar atmosphere for 60 min, followed by exposure to a CO/Ar atmosphere for 30 min. The insets show the structures of CO on different Pd species, which are shown as Pdδ−-brown, Pd0-blue, and Pd2+-pink. (E) More details of the CO adsorption structure: (EA) Pd/SiO2; (EB) Pd/Al2O3; (EC) Pd/TiO2; (ED) Pd/CeO2, where CO–Pd0, CO–Pdδ− and CO–Pdδ+ are the adsorption structures of CO on Pd0, Pdδ− and Pdδ+ sites, respectively. The structures directly map one to one with peaks marked in Fig. 4A–D. | ||
The results from the XPS and DRIFT spectra unambiguously demonstrate that the pEMSI is formed in Pd/MOx with the coexistence of interfacial Pdδ+ and superficial Pdδ− species. Using the proportion of Pd− species (quantitative analysis of the XPS peaks) as the descriptor of the intensity of the pEMSI effect, the Pd NPs on TiO2 exhibited the strongest pEMSI with the largest proportion of Pdδ− species distributed across NP surfaces, followed by Pd NPs on CeO2 and Al2O3, while negligible pEMSI was observed in Pd/SiO2. Interestingly, the pEMSI exhibits the same reversibility as restoration of CO adsorption in EMSI7 and de-encapsulation in classical SMSIs.3,6 As shown in Fig. 3D, the multi-peak fitting results of Pd/TiO2–O (Pd/TiO2 after re-oxidation) exhibit Pd species transformation from Pd− to Pdδ− (δ < 1) concurrently with that from Pd2+ to Pdδ+ (δ < 2), meaning electron transfer from the metal surface to the inside and from the substrate to the metal after re-oxidation, respectively. The retreat of the preceding electron transfer demonstrates weakening of the pEMSI effect, which is confirmed by the absence of Pd− species (due to Pd− → Pd0), as observed in Pd/SiO2–O, Pd/Al2O3–O and Pd/CeO2–O (Fig. S8 and S9†).
In order to clarify the novelty of the pEMSI, the interfacial electronic transfer, namely EMSI in previous studies,9,11,12 was analysed by quantifying the amount of Pd2+ (Fig. 3C, pink line). Pd2+ species arise from electron transfer from the Pd NPs to the support, since no PdO species were observed from H2 temperature-programmed reduction (H2-TPR) (Fig. S10†).38 The clear increase in the proportion of Pd2+ species in the sequence Pd/SiO2 < Pd/Al2O3 < Pd/TiO2 < Pd/CeO2 reflects the increasing trend in EMSI for the Pd/MOx model catalysts studied and agrees well with the aforementioned theoretical calculations. The increase of calculated Ead, adopted as the descriptor of EMSI, can be reflected in the binding energies of surface oxygen atoms on oxide supports (Fig. S11†), which in turn depends on the electronegativity of the central metal ion (χ0), as supposed by Hoffmann et al. very recently (Fig. S12†),39 thereby leading to a strong linear correlation between Ead and χ0 (Fig. S13†). However, as discussed above, there is a volcano relationship for the strength of the pEMSI with the EMSI increase (Fig. 3C), highlighting the enhanced accumulation of electrons at the surface of Pd NPs in Pd/TiO2 over Pd/CeO2, which confirms that the pEMSI is a new type of electronic effect for the electronic modification of supported metal NPs.
Density functional theory (DFT) calculations are further utilized to explore the key factors governing the polarization electronic effect. It is known that the geometric rearrangements would modify the electronic structure of Pd NPs, for example, the d band centre shift.40Fig. 5A shows that the TiO2-supported Pd4 cluster displayed the most structural fluxionality resulting from enhanced elongation and/or shortening of the Pd–Pd bond length, with this characteristic following the sequence Pd/TiO2 > Pd/Al2O3 ≈ Pd/CeO2 > Pd/SiO2. Furthermore, an up-shift of 0.74 eV from the Fermi level in Pd/TiO2 was observed by analysing the local density of states (LDOS) for the spin-up component of unoccupied Pd 4d orbitals, demonstrating that the electron transport activity is the highest in Pd/TiO2, followed by Pd/Al2O3 (≈Pd/CeO2) and Pd/SiO2 (Fig. 5B). Accordingly, the formation mechanism of the pEMSI can be elucidated as follows. Once Pd NPs are deposited on the oxide surface, the charge transfer at the metal/oxide interface takes place depending on the EMSI, leading to charge unbalance in the inner Pd NPs. Thanks to structural fluxionality and electron transport activity, the charge separation within Pd NPs and electron accumulation at the surface of Pd NPs could be triggered through the electronic equilibration effect.17,18 The formation of pEMSI gives rise to a surprising construction of the supported catalyst, i.e., microscopically polarized Pd NPs (polar units) anchored on oxide surfaces (Fig. 5C), which would contribute to high catalytic performance.
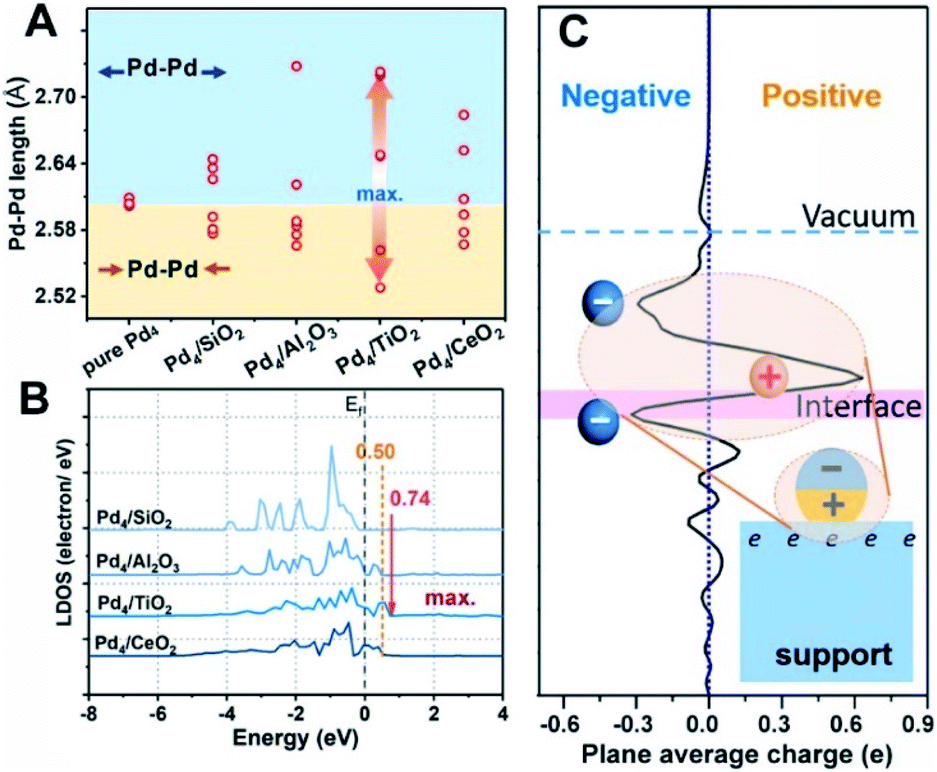 | ||
| Fig. 5 (A) Variations in the near Pd–Pd distance in Pd4 clusters as a function of oxide supports, with reference to the gas-phase Pd4 cluster (pure Pd4). The blue and brown areas represent the elongation and shortening, respectively, of the Pd–Pd bond length. (B) Local density of states (LDOS) of the Pd 4d orbitals with the Fermi level (Ef) setting to zero. (C) Charge transfer of the plane-averaged charge along the Z-direction of Pd4/TiO2; the inset shows the schematic of the electron density of metal NPs anchored on an oxide support. | ||
Therefore, the catalytic activities for the temperature-programmed hydride decomposition (TPHD) and catalytic formate dehydrogenation were investigated to verify the role of superficial electrons of supported Pd NPs in H2 evolution and to build the relationship between the electronic structure and activity of Pd/MOx catalysts (Fig. 6). The initial temperature of H2 desorption increased in the sequence Pd/TiO2 (31.9 °C) < Pd/Al2O3 (41.0 °C) ≈ Pd/CeO2 (41.1 °C) < Pd/SiO2 (52.0 °C), indicating that the activity increased in the opposite direction (Fig. 6A), in agreement with the pEMSI trend. The same pattern was also found for catalytic formate dehydrogenation (Fig. 6B). Furthermore, the turnover frequency (TOF) for the hydrogen evolution within the first 10 min was also measured (Table 1). The TOF per surface Pd atom from calculated metal dispersion as shown in Fig. S14† shows a nearly similar tendency to reaction rates, indicating that the activity of surface Pd atoms is changed once immobilized on different supports. So, the TOF per Pdδ− was further calculated (the number of surface Pdδ− atoms was derived from DRIFT as shown in Fig. S15†) and appears to be similar to the TOF per surface Pd atom, revealing the intrinsically distinct electron structures of Pd. With respect to Pd− species (the descriptor of pEMSI in this work), the strong linear relationship between the reaction rate (initial temperature of H2 desorption in the case of TPHD) and the proportion of Pd− species was established (Fig. 6C), consolidating the pivotal role of pEMSI in determining catalytic activity.
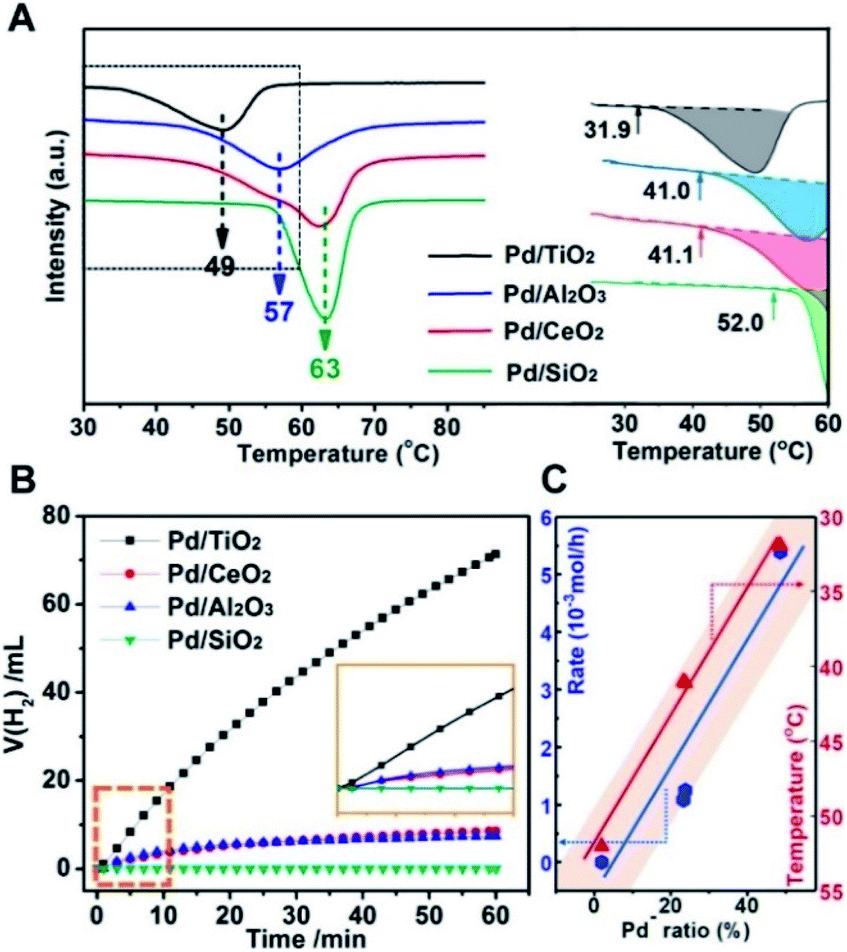 | ||
| Fig. 6 (A) Temperature-programmed hydride decomposition (TPHD) profiles for Pd/MOx catalysts with peak decomposition temperatures labelled (left) and the initial temperature of H2 desorption determined from TPHD (right). (B) H2 evolution via dehydrogenation of aqueous sodium formate (HCOONa; 3 M, 10 mL) at room temperature (298 K) over time. The inset shows the initial 10 min of the activity curve. (C) Linear relationship between the proportion of Pd− species (pEMSI) and the reaction rate (molH2 h−1) within the initial 10 min (blue line) and the initial temperature of H2 desorption (red line). | ||
In reducible supports, herein TiO2 and CeO2, oxygen defects are easily formed, which are known to affect the catalytic properties. As such, quantitative analysis of XPS spectra (Ti 2p and Ce 3d) was performed to explore the oxygen defects of Pd/TiO2 and Pd/CeO2 (Fig. S16 and Table S2†). The relative concentration of Ti3+ in Pd/TiO2 is zero, i.e. almost no oxygen defects exist in the Pd/TiO2 catalyst, indicating that the highly catalytic property of Pd/TiO2 has no direct relationship with oxygen defects. This view is further evidenced by the fact that lots of surface oxygen defects (6.5%) exist in Pd/CeO2, which rather exhibits comparatively low catalytic hydrogen evolution. Moreover, catalytic C–H bond cleavage over Pdδ− species, the key step in formate dehydrogenation,32,36,41 was consolidated by DFT calculation. A 0.02 Å lengthening of the C–H bond for bridging formate on the Pd(111) surface was observed when Pd(111) was negatively charged (Fig. S17†), revealing that activation of HCOO* can be effectively enhanced by Pdδ− species due to electron donation from electron-enriched Pd atoms to the HCOO* intermediate. Consequently, it is deduced that the pEMSI would play a key role in many reactions by regulating electron accumulation on the surface of Pd NPs.
The stability of the pEMSI under the reaction conditions was further studied. The XPS peaks corresponding to Pdδ− species remained essentially unchanged for Pd/MOx after usage, indicating that surface Pdδ− species are stable as active sites in reactions. However, the peaks corresponding to Pd2+ species disappeared, especially for Pd/CeO2 and Pd/TiO2 (Fig. S18†), suggesting the decline of the MSI during reactions. This may explain the gradual deactivation previously reported for Pd NPs of larger size after the catalytic formate dehydrogenation repeated two times at room temperature.25
Conclusions
In summary, theoretical calculations revealed charge separation between the surface and interfacial atoms of the Pd cluster, in contrast to the conventional understanding of electronic interactions. This polarized electronic effect, referred to in this study as polarized EMSI (pEMSI), was then proposed. Experimental evidence from XPS and DRIFTS showed that this pEMSI is present after low-temperature reduction and increases in the sequence Pd/SiO2 < Pd/CeO2 ≈ Pd/Al2O3 < Pd/TiO2, which is determined by moderate Pd-oxide interaction, high structural fluxionality and electron transport activity of Pd NPs. The amount of electron-rich species (Pd−), derived from pEMSI, is remarkably correlated linearly with catalytic hydride decomposition and formate dehydrogenation. This finding enables precise modulation of the electronic structure of supported metal NPs allowing for further exploitation of high-performance catalysts.Conflicts of interest
There are no conflicts to declare.Acknowledgements
This work was supported by the National Natural Science Foundation of China (21805112, 21876061, 21906063 and 22076062), a project funded by the China Postdoctoral Science Foundation (2018M640609) and the LiaoNing Revitalization Talents Program (No. XLYC1802076). The authors are thankful for the computational time for DFT calculations provided by the Shanghai Supercomputer Center.Notes and references
- S. Schauermann, N. Nilius, S. Shaikhutdinov and H. J. Freund, Acc. Chem. Res., 2013, 46(8), 1673 CrossRef CAS
.
- Y. Lykhach, S. M. Kozlov, T. Skála, A. Tovt, V. Stetsovych, N. Tsud, F. Dvořák, V. Johánek, A. Neitzel and J. Mysliveček,
et al.
, Nat. Mater., 2015, 15, 284 CrossRef
- T. W. van Deelen, C. Hernández Mejía and K. P. de Jong, Nat. Catal., 2019, 2(11), 955 CrossRef CAS
- J. Li, S. Song, Y. Long, S. Yao, X. Ge, L. Wu, Y. Zhang, X. Wang, X. Yang and H. Zhang, Chem. Sci., 2018, 9(38), 7569 RSC
- H. Tang, Y. Su, Y. Guo, L. Zhang, T. Li, K. Zang, F. Liu, L. Li, J. Luo and B. Qiao,
et al.
, Chem. Sci., 2018, 9(32), 6679 RSC
- S. J. Tauster, S. C. Fung and R. L. Garten, J. Am. Chem. Soc., 1978, 4, 170 CrossRef
- B. Han, Y. Guo, Y. Huang, W. Xi, J. Xu, J. Luo, H. Qi, Y. Ren, X. Liu and B. Qiao,
et al.
, Angew. Chem., Int. Ed., 2020, 59(29), 11824 CrossRef CAS
- H. Tang, Y. Su, B. Zhang, A. F. Lee, M. A. Isaacs, K. Wilson, L. Li, Y. Ren, J. Huang and M. Haruta,
et al.
, Sci. Adv., 2017, 3, e1700231 CrossRef
- C. T. Campbell, Nat. Chem., 2012, 4(8), 597 CrossRef CAS
- A. Bruix, J. A. Rodriguez, P. J. Ramirez, S. D. Senanayake, J. Evans, J. B. Park, D. Stacchiola, P. Liu, J. Hrbek and F. Illas, J. Am. Chem. Soc., 2012, 134(21), 8968 CrossRef CAS
- M. Xu, S. He, H. Chen, G. Cui, L. Zheng, B. Wang and M. Wei, ACS Catal., 2017, 7(11), 7600 CrossRef CAS
- M. Xu, S. Yao, D. Rao, Y. Niu, N. Liu, M. Peng, P. Zhai, Y. Man, L. Zheng and B. Wang,
et al.
, J. Am. Chem. Soc., 2018, 140(36), 11241 CrossRef CAS
- P. Hu, Z. Huang, Z. Amghouz, M. Makkee, F. Xu, F. Kapteijn, A. Dikhtiarenko, Y. Chen, X. Gu and X. Tang, Angew. Chem., Int. Ed., 2014, 53(13), 3418 CrossRef CAS
- J. Li, Q. Guan, H. Wu, W. Liu, Y. Lin, Z. Sun, X. Ye, X. Zheng, H. Pan and J. Zhu,
et al.
, J. Am. Chem. Soc., 2019, 141(37), 14515 CrossRef CAS
- J. A. Rodriguez, P. J. Ramirez, G. G. Asara, F. Vines, J. Evans, P. Liu, J. M. Ricart and F. Illas, Angew. Chem., Int. Ed., 2014, 53(42), 11270 CrossRef CAS
- T. E. James and C. T. Campbell, Nat. Energy, 2016, 1, 16002 CrossRef CAS
- T. Binninger, T. J. Schmidt and D. Kramer, Phys. Rev. B, 2017, 96(16), 165405 CrossRef
- T. Binninger, Nat. Commun., 2020, 11(1), 1471 CrossRef
- X. Lin, B. Yang, H.-M. Benia, P. Myrach, M. Yulikov, A. Aumer, M. A. Brown, M. Sterrer, O. Bondarchuk and E. Kieseritzky,
et al.
, J. Am. Chem. Soc., 2010, 132, 7745 CrossRef CAS
- V. Stamenkovic, B. S. Mun, K. J. Mayrhofer, P. N. Ross, N. M. Markovic, J. Rossmeisl, J. Greeley and J. K. Norskov, Angew. Chem., Int. Ed., 2006, 45(18), 2897 CrossRef CAS
- Y. Suchorski, S. M. Kozlov, I. Bespalov, M. Datler, D. Vogel, Z. Budinska, K. M. Neyman and G. Rupprechter, Nat. Mater., 2018, 17(6), 519 CrossRef CAS
- W.-H. Wang, Y. Himeda, J. T. Muckerman, G. F. Manbeck and E. Fujita, Chem. Rev., 2015, 115(23), 12936 CrossRef CAS
- P. Zhang, Y.-J. Guo, J. Chen, Y.-R. Zhao, J. Chang, H. Junge, M. Beller and Y. Li, Nat. Catal., 2018, 1(5), 332 CrossRef CAS
- Q. Y. Bi, J. D. Lin, Y. M. Liu, H. Y. He, F. Q. Huang and Y. Cao, Angew. Chem., Int. Ed. Engl., 2016, 55(39), 11849 CrossRef CAS
- J. Wang, H. Tan, D. Jiang and K. Zhou, Nano Energy, 2017, 33, 410 CrossRef CAS
- J. Wang, H. Tan, S. Yu and K. Zhou, ACS Catal., 2015, 5(5), 2873 CrossRef CAS
- S. Shen, W. K. Ng, L. S. O. Chia, Y. Dong and R. B. H. Tan, Cryst. Growth Des., 2012, 12(10), 4987 CrossRef CAS
- J. C. Matsubu, S. Zhang, L. DeRita, N. S. Marinkovic, J. G. Chen, G. W. Graham, X. Pan and P. Christopher, Nat. Chem., 2016, 9, 120 CrossRef
- Q. Q. Yan, D. X. Wu, S. Q. Chu, Z. Q. Chen, Y. Lin, M. X. Chen, J. Zhang, X. J. Wu and H. W. Liang, Nat. Commun., 2019, 10(1), 4977 CrossRef
- Y. Wang, D. Widmann and R. J. Behm, ACS Catal., 2017, 7(4), 2339 CrossRef CAS
- S. Zhang, P. N. Plessow, J. J. Willis, S. Dai, M. Xu, G. W. Graham, M. Cargnello, F. Abild-Pedersen and X. Pan, Nano Lett., 2016, 16(7), 4528 CrossRef CAS
- Q. Y. Bi, J. D. Lin, Y. M. Liu, H. Y. He, F. Q. Huang and Y. Cao, Angew. Chem., Int. Ed., 2016, 55(39), 11849 CrossRef CAS
- H. Tan, J. JWang, S. Yu and K. Zhou, Environ. Sci. Technol., 2015, 49(14), 8675 CrossRef CAS
- C. Wang, C. Wen, J. Lauterbach and E. Sasmaz, Appl. Catal., B, 2017, 206, 1 CrossRef CAS
- X. Zhai, C. Liu, Q. Chang, C. Zhao, R. Tan, H. Peng, D. Liu, P. Zhang and J. Gui, New J. Chem., 2018, 42, 18066 RSC
- S. Jones, J. Qu, K. Tedsree, X. Q. Gong and S. C. Tsang, Angew. Chem., Int. Ed., 2012, 51(45), 11275 CrossRef CAS
- G. Spezzati, Y. Su, J. P. Hofmann, A. D. Benavidez, A. T. DeLaRiva, J. McCabe, A. K. Datye and E. J. M. Hensen, ACS Catal., 2017, 7(10), 6887 CrossRef CAS
- N. J. Divins, I. Angurell, C. Escudero, V. Perez-Dieste and J. Llorca, Science, 2014, 346(6209), 620 CrossRef CAS
- M. Rahm, T. Zeng and R. Hoffmann, J. Am. Chem. Soc., 2019, 141, 342 CrossRef CAS
- M. Ahmadi, H. Mistry and B. Roldan Cuenya, J. Phys. Chem. Lett., 2016, 7(17), 3519 CrossRef CAS
- Z. L. Wang, J. M. Yan, Y. F. Zhang, Y. Ping, H. L. Wang and Q. Jiang, Nanoscale, 2014, 6(6), 3073 RSC
Footnote |
| † Electronic supplementary information (ESI) available: Additional characterization data and SEM and TEM images; XRD, TPR, XPS and DRIFTS results for the catalysts, as well as more explanations. See DOI: 10.1039/d0sc06795d |
| This journal is © The Royal Society of Chemistry 2021 |