 Open Access Article
Creative Commons Attribution 3.0 Unported Licence
Influence of hidden halogen mobility on local structure of CsSn(Cl1−xBrx)3 mixed-halide perovskites by solid-state NMR†
Abhoy
Karmakar
 ,
Amit
Bhattacharya
,
Diganta
Sarkar
,
Amit
Bhattacharya
,
Diganta
Sarkar
 ,
Guy M.
Bernard
 ,
Arthur
Mar
and
Vladimir K.
Michaelis
 *
*
Department of Chemistry, University of Alberta, Edmonton, Alberta T6G 2G2, Canada. E-mail: vladimir.michaelis@ualberta.ca
First published on 30th December 2020
Abstract
Tin halide perovskites are promising candidates for lead-free photovoltaic and optoelectronic materials, but not all of them have been well characterized. It is essential to determine how the bulk photophysical properties are correlated with their structures at both short and long ranges. Although CsSnCl3 is normally stable in the cubic perovskite structure only above 379 K, it was prepared as a metastable phase at room temperature. The transition from the cubic to the monoclinic phase, which is the stable form at room temperature, was tracked by solid-state 133Cs NMR spectroscopy and shown to take place through a first-order kinetics process. The complete solid solution CsSn(Cl1−xBrx)3 (0 ≤ x ≤ 1) was successfully prepared, exhibiting cubic perovskite structures extending between the metastable CsSnCl3 and stable CsSnBr3 end-members. The NMR spectra of CsSnBr3 samples obtained by three routes (high-temperature, mechanochemical, and solvent-assisted reactions) show distinct chemical shift ranges, spin-lattice relaxation parameters and peak widths, indicative of differences in local structure, defects and degree of crystallinity within these samples. Variable-temperature 119Sn spin-lattice relaxation measurements reveal spontaneous mobility of Br atoms in CsSnBr3. The degradation of CsSnBr3, exposed to an ambient atmosphere for nearly a year, was monitored by NMR spectroscopy and powder X-ray diffraction, as well as by optical absorption spectroscopy.
1. Introduction
Lead halide perovskites APbX3 (A = Cs+, CH3NH3+, CH(NH2)2+; X = Cl−, Br−, I−) show attractive optical and electrical properties for solar cells, lasers, light-emitting diodes, X-ray detectors, and other applications,1–6 with power conversion efficiencies now exceeding 25%,7 but they face significant challenges for commercialization because of poor chemical stability8 and risk of lead toxicity.9,10 Among lead-free alternatives, the tin-substituted analogues have been highly promising, showing power conversion efficiencies of up to 10%.11 Most of these compounds are iodides such as CH3NH3SnI3, CH(NH2)2SnI3, and CsSnI3, which have band gaps (1.2–1.4 eV) close to the optimum value (1.34 eV) to maximize efficiency.12,13 The hybrid organic–inorganic compounds CH3NH3SnI3 and CH(NH2)2SnI3 are more efficient but suffer from poor thermal stability because of the presence of the volatile organic cations; the purely inorganic compound CsSnI3 is more thermally stable but oxidizes rapidly in air (Sn(+2) → Sn(+4)).13,14 Among the bromide analogues, CsSnBr3 exhibits greater thermal and air stability, imparted by the Cs+, than CH3NH3SnBr3, which degrades in air within an hour.13,15 Solar devices fabricated with CsSnBr3 do not have to be encapsulated, lasting for hours with diode characteristics being retained.13 The band gap of CsSnBr3 (1.75–1.80 eV)13,16,17 lies in the optimal region for tandem solar cell technology.18Recently, the mixed-halide perovskites CsSn(Cl1–xBrx)3 have been prepared in the form of nanocrystals or thin films, in which the band gap can be adjusted with composition, making them suitable for optoelectronic applications such as light emitting diodes and lasers.19,20 However, some of the structural details of these mixed-halide perovskites are unclear because the end-members are known to exhibit multiple phase transitions: CsSnCl3 adopts a monoclinic structure at room temperature (own type; space group originally reported as P21/n, but standardized as P21/c) and transforms to the cubic perovskite structure (space group Pm![[3 with combining macron]](https://www.rsc.org/images/entities/char_0033_0304.gif) m) above 379 K,21 and CsSnBr3 undergoes complicated phase transitions at low temperature, but ultimately attains the cubic structure above 292 K.22 Because the physical properties depend sensitively on the structure and stability of these mixed-halide perovskites, it is essential to determine the local and long-range atomic arrangement, to unravel the dynamics of halogen mobility, and to evaluate changes entailed by different synthetic methods and exposure to ambient conditions.
m) above 379 K,21 and CsSnBr3 undergoes complicated phase transitions at low temperature, but ultimately attains the cubic structure above 292 K.22 Because the physical properties depend sensitively on the structure and stability of these mixed-halide perovskites, it is essential to determine the local and long-range atomic arrangement, to unravel the dynamics of halogen mobility, and to evaluate changes entailed by different synthetic methods and exposure to ambient conditions.
To date, halide perovskites have been extensively characterized by X-ray diffraction (XRD), which gives information about the average long-range structure. However, solid-state nuclear magnetic resonance (NMR) spectroscopy is an invaluable method to investigate local structure (e.g., halide distribution, domain structure) and dynamics in perovskites.23–38 In particular, 133Cs (I = 7/2, 100% abundance) and 119Sn (I = 1/2, 8.59% abundance) are ideal NMR-sensitive nuclei, useful for probing the local structure of the A and B sites in perovskites ABX3,30,37,39–45 as well as of sites in other types of compounds.46–49
Here we target the preparation of CsSn(Cl1−xBrx)3 to ascertain if a complete solid solution with the cubic perovskite structure can be attained for the entire range. Powder XRD and NMR spectroscopy were carried out to determine the long-range structure and the local coordination around the Cs and Sn sites by Cl and Br atoms, which could be ordered or disordered. Optical band gaps were measured by UV-visible absorption spectroscopy and correlated with composition. Given the ambiguity about the nature of CsSnBr3, we evaluate whether samples prepared by various methods show important structural differences which could influence their optical properties. The activation energy for rapid halogen dynamics in CsSnBr3 was quantified by variable-temperature 119Sn NMR spectroscopy. Finally, the stability of CsSnBr3 under ambient conditions was assessed by examining the products and pathways of its degradation.
2. Results and discussion
2.1. Monoclinic and cubic phases of CsSnCl3
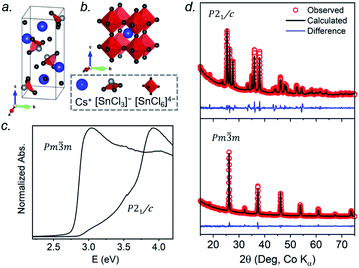
At room temperature, CsSnCl3 adopts a monoclinic structure (space group P21/c) containing isolated [SnCl3]− ions in trigonal pyramidal geometry with Sn–Cl bonds of 2.50–2.55 Å (Fig. 1a). If three much more distant Cl atoms at 3.21–3.77 Å are included, the coordination geometry around the Sn atoms (coordination number (CN) with 3 shorter and 3 longer bonds, CN3 + 3) could also be described as distorted octahedral.21 Above 379 K, CsSnCl3 transforms to the cubic perovskite structure (space group Pm![[3 with combining macron]](https://www.rsc.org/images/entities/char_0033_0304.gif) m) containing a network of corner-sharing ideal [SnCl6]4− octahedra with Sn–Cl bonds of 2.78 Å (Fig. 1b).21,50 However, as described later, the cubic form can be obtained at room temperature as a metastable phase. From le Bail fitting of the powder XRD patterns (Fig. 1d), the cell parameters were refined to be a = 5.7286(6) Å, b = 7.6936(11) Å, c = 16.9175(15) Å, and β = 106.505(4)° for the monoclinic phase and a = 5.5894(5) Å for the room temperature cubic phase, in good agreement with previously reported values.50,51 The room temperature UV-visible absorption spectra show that the monoclinic phase has a larger optical band gap (3.33 eV) than the cubic phase (2.83 eV) (Fig. 1c), consistent with the less delocalized electronic structure associated with the discrete [SnCl3]− units in the former.
m) containing a network of corner-sharing ideal [SnCl6]4− octahedra with Sn–Cl bonds of 2.78 Å (Fig. 1b).21,50 However, as described later, the cubic form can be obtained at room temperature as a metastable phase. From le Bail fitting of the powder XRD patterns (Fig. 1d), the cell parameters were refined to be a = 5.7286(6) Å, b = 7.6936(11) Å, c = 16.9175(15) Å, and β = 106.505(4)° for the monoclinic phase and a = 5.5894(5) Å for the room temperature cubic phase, in good agreement with previously reported values.50,51 The room temperature UV-visible absorption spectra show that the monoclinic phase has a larger optical band gap (3.33 eV) than the cubic phase (2.83 eV) (Fig. 1c), consistent with the less delocalized electronic structure associated with the discrete [SnCl3]− units in the former.
The lack of a simple relationship between the monoclinic and cubic structures of CsSnCl3 implies a reconstructive phase transition involving considerable mobility of atoms, because the process takes place at a relatively low temperature. In preparation for a detailed examination of the dynamics of this process, the local environments around the Cs and Sn atoms within the monoclinic and cubic phases were first probed by solid-state NMR spectroscopy to establish a frame of reference.
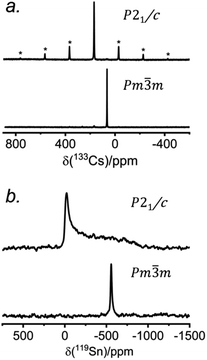
The 133Cs NMR characteristics depend strongly on local electronic and chemical environments. The position and widths of the 133Cs resonances, as measured by their isotropic chemical shift (δiso) and full-width-at-half-maximum (fwhm) values, are quite different within the monoclinic (δiso = 168.5(1) ppm, fwhm = 320 Hz) and cubic structures (δiso = 64.7(1) ppm, fwhm = 138 Hz) (Fig. 2a). The 133Cs spin-lattice relaxation time decreases significantly from the monoclinic (T1 = 252 s) to the cubic structure (T1 = 15 s), which may be related to greater mobility of Cl atoms in the latter.21 The local environment of Cs atoms surrounded by Cl atoms is less symmetrical within the monoclinic structure (CN10, bicapped square prismatic), giving rise to a manifold of spinning sidebands due to a small quadrupole coupling constant (CQ) of 190 kHz, whereas it is highly symmetrical within the cubic structure (CN12, cuboctahedral) for which CQ is ∼0 kHz. At a magic-angle spinning (MAS) frequency of 13 kHz, a single low-intensity spinning side band is observed in cubic CsSnCl3 (Fig. S1†), which is most likely due to intrinsic defects (e.g., Cl vacancies).52 The distinctly different 133Cs NMR spectra for these two forms of CsSnCl3 can then be exploited to quantitatively determine their relative amounts in more complex samples obtained by various synthetic procedures.
Similarly, the 119Sn NMR features serve as helpful diagnostics of these forms of CsSnCl3 (Fig. 2b). The lower symmetry monoclinic form exhibits a broad pattern characteristic of chemical shift anisotropy (δiso = −295(2) ppm, span Ω = 870(5) ppm, skew k = 0.95(2)), whereas the higher symmetry cubic form exhibits a symmetric resonance (δiso = −560(1) ppm, fwhm = 1.8 kHz) with no evidence for chemical shift anisotropy.
2.2. Trapping cubic CsSnCl3 at room temperature
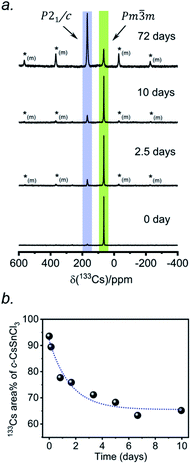
According to recent reports, cubic CsSnCl3 can be obtained as a metastable phase at room temperature by ball milling,53 or by “briefly heating” the monoclinic form to 380 K.44 However, questions still remain about how long this cubic phase persists under ambient conditions, and to our knowledge, there has been no systematic study on its stability upon exposure to air.Two separate samples of CsSnCl3 were prepared by reaction of CsCl and SnCl2, which were loaded into sealed and evacuated fused-silica tubes, and heated at 673(10) K for 15 h in a box furnace (see Experimental section in ESI†). For the first sample, the tubes were cooled slowly at 5 K min−1 to room temperature. This sample contained a mixture of cubic and monoclinic phases with the latter >50%, as revealed by both powder XRD and 133Cs NMR spectroscopy performed within 24 hours of synthesis (Fig. S2†). After 6 days at room temperature, the sample transformed to mostly the monoclinic phase, with <10% of the cubic phase remaining. For the second sample, the tubes were cooled at 5 K min−1 to 573 K, followed by quenching in an ice-water bath. Although the powder XRD data suggest a phase-pure sample consisting of only the cubic phase (lower part of Fig. 1d), the 133Cs NMR spectrum shows a small amount (6%) of the monoclinic phase (Fig. 3a). Time-dependent 133Cs NMR spectra were collected on the sample, kept at room temperature, at various intervals up to 72 days. The proportion of the cubic phase decreases monotonically in an exponential manner, with 65% remaining after 10 days and 14% after 72 days (Fig. 3b and S2c†). This process is much slower than a similar one that we have recently reported for the transformation of metastable γ-CsPbI3 perovskite to δ-CsPbI3 non-perovskite at room temperature, which is complete within 2 hours, as monitored by 133Cs NMR spectroscopy.41
2.3. Cubic CsSn(Cl1−xBrx)3 solid solution: synthesis, long-range structure and optical properties
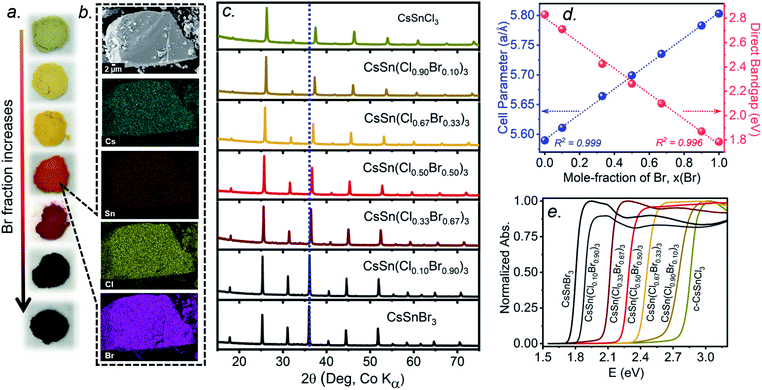
The multiple phase transitions encountered for both CsSnCl3 and CsSnBr3 make it challenging to prepare a complete mixed-halide solid solution CsSn(Cl1−xBrx)3 having the cubic perovskite structure over the entire range for x at room temperature. Moreover, the parent end-members only adopt the stable cubic structure above room temperature (>379 K for CsSnCl3 and >292 K for CsSnBr3).21,22 Samples of CsSn(Cl1−xBrx)3 prepared by solution methods were reported to form monoclinic phases for Cl-rich compositions (x < 0.50) and cubic phases for Br-rich compositions (x > 0.50) at room temperature.16 The retention of cubic CsSnCl3 as a metastable phase at room temperature, presented above, suggests that it may yet be possible to prepare a complete solid solution with the cubic structure through similar high-temperature reactions of CsX and SnX2 (X = Cl, Br). As detailed in the experimental section, the critical step is rapid quenching (see ESI†).Freshly synthesized samples of CsSn(Cl1−xBrx)3 show colours starting from faint yellow (CsSnCl3) and gradually evolving with increasing Br content to orange, red, and finally black (CsSnBr3), consistent with a decrease in the band gap (Fig. 4a). The samples are polycrystalline with micron-sized particles having uniform distribution of all elements (Cs, Sn, Cl, Br) down to this scale, as seen in elemental mapping images collected on a field-emission scanning electron microscope (Fig. 4b and S3†). The chemical compositions, as determined by energy-dispersive X-ray analysis, agree well with the nominal compositions CsSn(Cl1−xBrx)3 loaded in the reactions (Table S1†).
Powder XRD patterns collected at room temperature confirm the cubic perovskite structure (space group Pm![[3 with combining macron]](https://www.rsc.org/images/entities/char_0033_0304.gif) m) for all members of the solid solution (Fig. 4c and S4†). The refined unit cell parameter for CsSn(Cl1−xBrx)3 increases linearly from 5.5894(5) Å for CsSnCl3 to 5.8031(3) Å for CsSnBr3, in accordance with Vegard's law, with no deviations being shown (Fig. 4d and Table S2†). Strict adherence to Vegard's law behaviour has also been observed in lead-containing mixed-halide perovskites.35,36
m) for all members of the solid solution (Fig. 4c and S4†). The refined unit cell parameter for CsSn(Cl1−xBrx)3 increases linearly from 5.5894(5) Å for CsSnCl3 to 5.8031(3) Å for CsSnBr3, in accordance with Vegard's law, with no deviations being shown (Fig. 4d and Table S2†). Strict adherence to Vegard's law behaviour has also been observed in lead-containing mixed-halide perovskites.35,36
UV-visible absorption spectra, which were converted from diffuse reflectance spectra using the Kubelka–Munk function, show gradual shifts in the absorption edge to lower energy with increasing Br content in CsSn(Cl1−xBrx)3 (Fig. 4e). With the assumption of a direct band gap, the linear regions in the Tauc plots of (αhν)2vs. E were extrapolated to extract optical band gap values (Fig. S5†). The band gap in CsSn(Cl1−xBrx)3 decreases linearly with increasing Br content from 2.83 eV for CsSnCl3 to 1.79 eV for CsSnBr3 (Fig. 4d), similar to the behaviour seen in lead-containing mixed-halide perovskites.35,36,41
2.4. Cubic CsSn(Cl1−xBrx)3 solid solution: local structure using 133Cs and 119Sn NMR spectroscopy
The local environments of Cl and Br atoms around the Cs and Sn atoms in CsSn(Cl1−xBrx)3 were probed by NMR spectroscopy. The Cs atoms reside in a cuboctahedral site surrounded by 12 halogen atoms (Fig. 5a). For the end-members, the 133Cs chemical shifts are similar but distinguishable: δiso = 64.7 ppm for CsSnCl3 and δiso = 64.0 ppm for CsSnBr3.44 Interestingly, the 133Cs resonances are quite sharp for all members of CsSn(Cl1−xBrx)3, with fwhm ranging from 70 to 150 Hz (or 1.1 to 2.3 ppm) (Fig. 5b). This result is in contrast to the lead-containing analogues CsPb(Cl0.50Br0.50)3, where much broader 133Cs resonances (fwhm of 2 kHz) were observed and attributed to inhomogeneities caused by the numerous possible arrangements of Cl and Br atoms.41 The sharper 133Cs NMR spectra for CsSn(Cl1−xBrx)3 imply that rapid halogen dynamics must be taking place even at room temperature, such that the effects of the 12 surrounding halogen atoms are averaged.44Most surprisingly, the 133Cs chemical shift does not vary monotonically between the end-members; rather, it is displaced to higher frequency relative to the end-members and reaches a maximum of δiso = 74.7 ppm in CsSn(Cl0.50Br0.50)3. The relationship between the chemical shift δiso and the Br content x can be fitted to a parabolic curve, following the quadratic function δiso(133Cs)/ppm = 64.8 + 40.6x − 41.5x2 (Fig. 5c). A comparable nonlinear change in 89Y and 119Sn NMR chemical shifts has been observed in pyrochlores.54,55 A similar nonlinear change in 133Cs NMR chemical shifts was recently reported for mixed-halide double perovskites Cs2AgBi(Cl1−xBrx)6 due to a non-additive effect of nearest and next-nearest neighbours on the chemical shift for 133Cs nuclei and the associated extended halide environment.56
A mixture of Cl and Br atoms in the cuboctahedral environment around the Cs atoms would be expected to enhance quadrupolar coupling interactions because of the lowering of symmetry and correspondingly to increase the manifold of 133Cs spinning side bands, as was previously observed in the lead-containing analogues CsPb(Cl0.50Br0.50)3.41 However, at a MAS frequency of 13 kHz, only a single spinning side band of low intensity was observed for all members of CsSn(Cl1−xBrx)3 (Fig. S1†), which could occur if the environment contains identical halogen atoms (not possible here) or if the halogen dynamics are sufficiently rapid (i.e., much shorter than the correlation times) such that only average values are measured for the relevant interactions. The 133Cs spin-lattice relaxation times T1 vary nonlinearly between 10 to 35 s with increasing Br content (Fig. 5c and Table S3†). These short relaxation times, on the order of seconds, are consistent with the absence of significant covalent bonding interactions between Cs and halogen atoms, similar to previous observations for CsPb(Cl0.50Br0.50)3.42
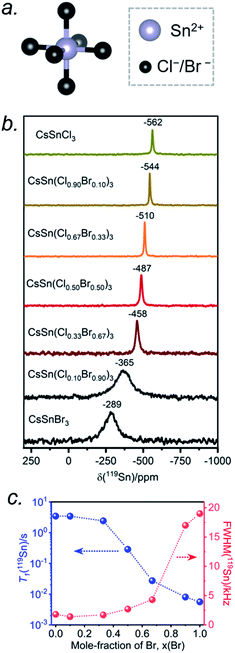
The Sn atoms in CsSn(Cl1−xBrx)3 reside in an octahedral site surrounded by six halogen atoms (Fig. 6a). For the end-members, the 119Sn NMR spectra show symmetric-like lineshapes with clear differences in isotropic chemical shifts for CsSnCl3 (δiso = −562 ppm) and CsSnBr3 (δiso = −289 ppm) (Fig. 6b). There is no evidence of spinning side bands, consistent with a highly symmetric chemical environment. As the Br content increases, the 119Sn chemical shift gradually displaces to higher frequency (Fig. 6b and Table S4†) and the linewidth increases from CsSnCl3 (fwhm = 1.8 kHz) to CsSnBr3 (fwhm = 19.0 kHz) (Fig. 6c). For CsSnBr3, the 119Sn NMR linewidth and lineshape are unchanged whether the magnetic field (B0) is 7.05 or 11.75 T (Fig. S6†). Furthermore, the linewidth (fwhm = 21 kHz) only decreases slightly when magic angle spinning is applied (fwhm = 19 kHz) (Fig. S7†); the small decrease is attributed to a reduced heteronuclear dipolar coupling between 119Sn and 79/81Br. The observed linewidths may also be influenced by indirect spin–spin coupling between 119Sn and six surrounding quadrupolar nuclei (I = 3/2 for 35/37Cl and 79/81Br) as recently reported in CH3NH3PbCl3 and CsPbCl3.24,28 For the Br-rich samples, the 119Sn signal-to-noise ratio drastically deteriorates upon increasing the echo delays from 24 to 94 μs, due to fast T2 relaxation (Fig. S8†).44 These results are similar to previous observations on the lead-containing analogues.24,28,31,35,36,41
The occurrence of single symmetric-like 119Sn resonances and the absence of spinning side bands imply that the chemical environment around the Sn atoms is uniform. If a distribution of several types of SnCl6−nBrn (n = 0–6) octahedra were present, they would give rise to multiple Sn resonances and possibly spinning side bands due to magnetic shielding anisotropy, but neither of these are observed. As before, the most probable explanation is that rapid halogen dynamics is taking place in CsSn(Cl1−xBrx)3 on the timescale of the NMR experiment, resulting in averaged chemical environments around the Sn atoms. This situation contrasts with the lead-containing analogues CsPb(Cl1−xBrx)3, where multiple chemical environments around Pb atoms are observed.41 The 119Sn NMR chemical shift can be further correlated with the band gap in CsSn(Cl1−xBrx)3 (Fig. S9†). The decrease in band gap is accompanied by a displacement of the 119Sn NMR chemical shift to higher frequency, suggesting a dominating paramagnetic shielding contribution.
The 119Sn spin-lattice relaxation times decrease dramatically from CsSnCl3 (T1 = 3.5 s) to CsSnBr3 (T1 = 0.006 s), a difference of three orders of magnitude which is comparable to recent observations on CH3NH3SnX3.44 The decrease is monotonic with increasing Br content (Fig. 6c and Table S4†). It has been shown previously that the T1 relaxation mechanism is dominated by the scalar coupling strength 1J(119Sn, X) (X = 35/37Cl or 79/81Br) for tin halides.44,57,58 The smaller T1 value for CsSnBr3 compared to CsSnCl3 is consistent with 1J(119Sn,79/81Br) being larger than 1J(119Sn,35/37Cl). In addition to J-coupling, chemical exchange processes due to the rapid halogen dynamics at room temperature may also play a significant role in the 119Sn T1 values for the Br-rich samples, as discussed later.
2.5. Local structure of CsSnBr3 prepared by solvent, high-temperature, and mechanochemical routes
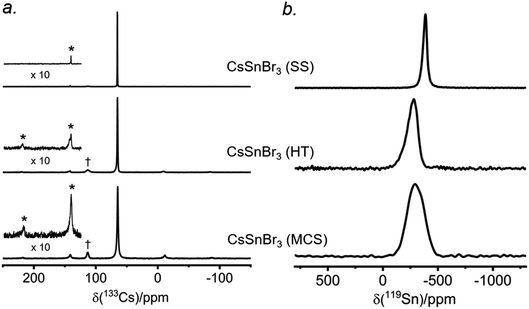
There have been many reports of halide perovskites being prepared by nonconventional routes, either in the presence or absence of solvent. For example, solvent-free “mechanochemical synthesis” routes involving ball-milling have been proposed to be advantageous for large-scale production of perovskite photovoltaic materials.59,60 However, it is unclear whether samples prepared by these nonconventional routes are really identical to more traditional solution-based methods on a local atomic-level. To understand this, samples of CsSnBr3 were prepared by three routes (solvent synthesis, high-temperature reaction, and ball-milling) and analyzed by 133Cs and 119Sn NMR spectroscopy.The 133Cs NMR spectra show resonances appearing in the same position, being sharpest for the sample prepared by solvent-synthesis (fwhm = 15 Hz), and growing increasingly broader for those prepared by high-temperature reaction (fwhm = 70 Hz) and ball-milling (fwhm = 120 Hz) (Fig. 7a). For these spectra acquired under slow magic-angle spinning (5 kHz), the spinning side band manifold increases along the same order. These observations indicate that the solvent-synthesized sample has the most well-ordered structure containing fewer defects, whereas the ball-milled sample has the most locally disordered structure exhibiting a wide distribution of environments and more defects.27,35 The higher defect concentrations in our ball-milled sample are maintained because no further post-grinding annealing treatment was performed. It is worth noting that one may minimize or circumvent the formation of grinding induced defects by performing a subsequent heat treatment after ball milling.61,62
The 119Sn NMR spectra for these samples (Fig. 7b) show even greater differences in chemical shifts, which span a range of almost 100 ppm, and linewidths: the sharpest at −386 ppm (fwhm = 7.5 kHz) for the solvent-synthesized sample, an intermediate one at −284 ppm (fwhm = 21 kHz) for the sample prepared at high temperature, and the broadest at −295 ppm (fwhm = 34 kHz) for the ball-milled sample. The 119Sn spin-lattice relaxation times depend greatly on the synthetic route: T1 = 25 ms for the solvent-synthesized sample, 7 ms for the high-temperature sample, and 3 ms for the ball-milled sample (Table S5†). A faster relaxation process implies greater local surface disorder/defects in the ball-milled sample, consistent with the conclusions from the 133Cs NMR spectra and the 119Sn NMR linewidths. This greater disorder is also reflected in broader peaks in the powder XRD patterns for the ball-milled sample compared to the other samples (Fig. S10†); all samples exhibit micron sized crystallites. However, the optical band gaps extracted from the UV-visible absorption spectra appear to be virtually identical (within experimental error), with values ranging from 1.77 eV for the solution-synthesized sample to 1.81 eV for the ball-milled sample. We note this disorder may also be related to the UV-vis absorption profile being different for the ball-milled sample (Fig. S11†).
2.6. Spontaneous halogen mobility in CsSnBr3
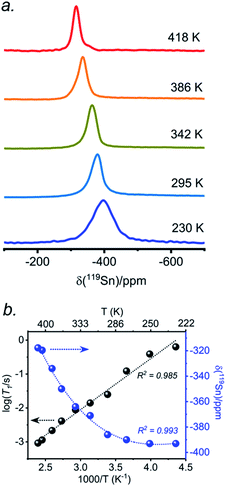
The presence of point defects or vacancies enables ionic migration within perovskites and plays an important role in photovoltaic efficiency and material stability, while also being responsible for photocurrent hysteresis characteristics.63–65 Metal halide perovskites ABX3 can exhibit a vacancy transport hopping mechanism through A-, B- or X-site migration,66 but X-site (halogen) diffusion is most probable as the halogen vacancy formation energy is comparable to the halogen ionic diffusion activation energy barrier (ca. 0.30 eV) in organic–inorganic hybrid perovskites.52,67,68 The analysis of the 133Cs and 119Sn NMR spectra above suggests that halogen atoms may be highly mobile in CsSn(Cl1−xBrx)3 even at room temperature. To deconvolute the halogen dynamics, variable-temperature 119Sn NMR spectroscopy was performed on the parent CsSnBr3 compound, prepared by solution synthesis. As the temperature increases from 230 to 418 K, the 119Sn resonances shift monotonically to higher frequency by about 75 ppm (Fig. 8 and Table S6†), following the cubic dependence The 119Sn NMR linewidth narrows from 14.7 to 4.5 kHz, the effective spin–spin relaxation time
  increases from 68 to 222 μs (Fig. S12 and Table S6†), and most notably, the spin-lattice relaxation time (T1) decreases drastically from 0.635 to 0.0009 s, a difference of three orders of magnitude (Table S6†). In accordance with an Arrhenius relationship, a plot of log10[T1(119Sn)/s] vs. [1000/T (K)] yields a linear dependence (Fig. 8b) from which an activation energy of 28.9 ± 1.2 kJ mol−1 (0.30 ± 0.01 eV) for the halogen dynamics was extracted (see ESI Note 1†). Although this result is in contrast to the metallic behaviour previously suggested from electrical conductivity measurements,67 it is in excellent agreement with those for other Sn- and Pb-based perovskites and metal halide solid ionic conductors including CH3NH3SnBr3 (0.30–0.37 eV),44,67,68 CH3NH3PbI3 (0.29 eV),69 CsPbCl3 (0.29 eV),70 CsPbBr3 (0.25 eV),70 CsSnCl3 (0.2 eV, theoretical),71 α-SnI2 (0.29 eV),72 PbCl2 (0.20–0.30 eV),70,73 and PbBr2 (0.23–0.25 eV).70,74 These observations support the conclusion that CsSnBr3 behaves like an ionic conductor and Br− mobility is responsible for the fast relaxation process of 119Sn nuclei in CsSnBr3, as observed recently in the organic–inorganic hybrid CH3NH3SnBr3 perovskite.44
The above NMR results suggest that the replacement of Pb with Sn in perovskite appears to enable faster halogen mobility, which causes an averaging of the relevant interactions through halide dynamics. The faster halogen dynamics alter the electrical properties for tin halide perovskites. For example, cubic CsSnCl3 was shown to have high ionic conductivity >10−4 S cm−1 at 313 K, fueling its potential as a solid electrolyte candidate for chloride ion batteries.71 We further note that a higher concentration of B site vacancies (ca. 2.9%)71 was reported in CsSnCl3 than that for CH3NH3PbI3 (ca. 0.4%).75 The higher B site vacancies in tin halide perovskites is most likely associated with Sn(+2) oxidation (Sn(+2) → Sn(+4) vs. Pb(+2)), which may cause an increase in the rate of halogen dynamics.
2.7. Air stability and degradation pathways for CsSnBr3
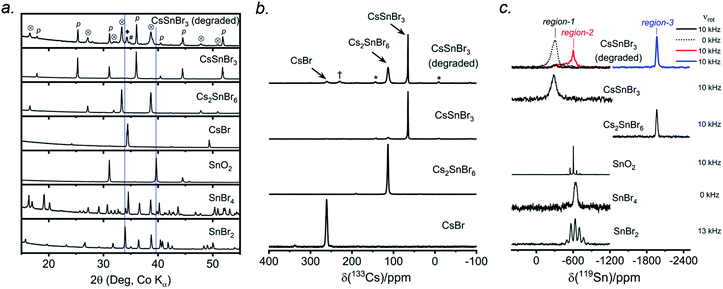
CsSnBr3 shows higher thermal and moisture stability than the organic–inorganic hybrid CH3NH3SnBr3. Nevertheless, CsSnBr3 slowly degrades over time under ambient conditions, becoming partially oxidized to Cs2SnBr6, and the UV-visible absorption spectra change drastically (Fig. S13†). Powder XRD and solid-state 133Cs and 119Sn NMR spectroscopy were performed to elucidate the decomposition pathways and the nature of the degraded products. A sample of CsSnBr3 was freshly synthesized by high-temperature reactions and stored in a parafilm-sealed glass vial under ambient laboratory conditions (298 K and 50–70% humidity) over 300 days. The powder XRD pattern of the degraded sample was compared to those for various reference standards (pristine CsSnBr3, Cs2SnBr6, CsBr, SnO2, SnBr4, and SnBr2) (Fig. 9a). In addition to CsSnBr3, which still constituted about 40% of the sample, significant amounts of Cs2SnBr6 and CsBr, and smaller amounts of SnBr4 were formed, but no SnO2 or SnBr2 were present. The powder XRD pattern also shows an increased background, suggestive of amorphous contributions.Complementary information about crystalline and amorphous components can be obtained from the solid-state NMR spectra. For quantitative analysis, the NMR parameters were optimized to achieve maximum sensitivity (Tables S7 and S8†). The 133Cs NMR spectrum of the degraded sample was compared to those for three reference standards (pristine CsSnBr3, Cs2SnBr6, and CsBr) (Fig. 9b). Based on assignment of the 133Cs NMR resonance areas, the sample consisted of 40% CsSnBr3 (65 ppm), 45% Cs2SnBr6 (113 ppm), 8% CsBr (260 ppm) and 7% of an unidentified Cs-containing phase (230 ppm). The 133Cs resonances are slightly broader for Cs2SnBr6 (fwhm of 320 Hz, compared to 170 Hz for the solvent-synthesized standard) and for CsBr (fwhm of 370 Hz, compared to 270 Hz for the standard). This broadening implies that Cs2SnBr6 and CsBr formed during the slow degradation process have smaller crystallite sizes than in the reference standards.44 The powder XRD pattern also shows broadening of diffraction peaks for these phases (Fig. 9a).
In the 119Sn NMR spectrum of the degraded sample, the resonances span about 8800 ppm (1.6 MHz at B0 = 11.75 T, Fig. 9c and S14†), with spin-lattice relaxation times extending over four orders of magnitude (Table S8†). Hence, the 119Sn NMR acquisition parameters were optimized within different spectral regions (Table S8†). Region 1 shows that a significant amount of CsSnBr3 is present. The 119Sn resonance intensity for CsSnBr3 is highly sensitive to the magic-angle spinning frequency; because these spectra were acquired with a spin echo, for which the delay depends on the spinning frequency, the signal is weakened due to the fast T2 relaxation process when slower MAS frequencies are used. Region 2 shows a 119Sn resonance at −600 ppm, which corresponds to SnO2, and a broad underlying component, which most likely corresponds to SnBr4, indicating that oxidation from Sn(+2) to Sn(+4) has taken place. The 119Sn signal for SnO2 in the degradation product is much broader (fwhm = 3.7 kHz) than in the bulk SnO2 standard (fwhm = 0.2 kHz). Although crystalline SnO2 was not detected in the powder XRD pattern, the broadness of the 119Sn NMR signal suggests that it may either be amorphous or in the form of nanodomains (<10 nm)76 embedded within other phases in the sample. Region 3 confirms the presence of Cs2SnBr6, as seen by the 119Sn resonance at −1964 ppm. Region 4 reveals a weak 119Sn signal that is assigned to metallic β-Sn and is Knight-shifted77 to higher frequency; however, this signal was detected only after two million scans, implying only a trace amount of β-Sn that likely originated as an impurity in the starting material SnBr2 used in the synthesis, as shown in Fig. S14.† Based on the XRD and NMR results, two simultaneous pathways are proposed for the room-temperature oxidation of CsSnBr3:
| (1) 2 CsSnBr3 + O2 (air) → Cs2SnBr6 (crystalline) + SnO2 (amorphous or nano-sized) |
| (2) 2 CsSnBr3 + O2 (air) → SnBr4 (crystalline) + 2 CsBr (crystalline) + SnO2 (amorphous or nano-sized). |
3. Conclusions
The complete solid solution CsSn(Cl1−xBrx)3 (0 ≤ x ≤ 1) exhibiting the cubic perovskite structure for all members, was prepared by rapid quenching of samples reacted at high temperature. In particular, this method is able to trap the end-member CsSnCl3 as a metastable cubic phase (instead of the monoclinic phase) at room temperature. The long-range structure was elucidated by powder XRD and the local structure and dynamics by 133Cs and 119Sn solid-state NMR spectroscopy. In contrast to the lead-containing analogues CsPbX3, the halogen atoms in CsSn(Cl1−xBrx)3 are much more mobile. The rapid halogen dynamics in CsSnBr3 were analyzed by measuring the 119Sn spin-lattice relaxation times at variable temperatures, giving a low activation energy of 28.9 ± 1.2 kJ mol−1 for the diffusion of Br atoms. Although CsSnBr3 can be prepared by various synthetic routes that apparently have similar long-range structures, as ascertained by powder XRD and optical properties, the local structure and degree of crystallinity differ, as revealed by NMR spectroscopy; in particular, samples prepared by mechanochemical synthesis tend to show greater local polyhedral disorder and vacancies, resulting in a reduction of the spin-lattice relaxation of 119Sn. In a study of CsSnBr3 exposed to air, insight into the degradation pathways was sought by NMR spectroscopy, which revealed the formation of amorphous or nano-sized SnO2, not detected by conventional diffraction methods. The results suggest that although the photophysical properties of Sn-containing perovskites are attractive, and their band gaps are tunable through halide substitution and not highly affected by synthetic methods despite differences in local structure, challenges remain in ensuring their ambient long-term stability.Author's contribution
All authors have given approval to the final version of the manuscript.Conflicts of interest
There are no conflicts to declare.Acknowledgements
This research is supported by the Natural Sciences and Engineering Research Council (NSERC) of Canada, Canada Foundation for Innovation, NSERC CREATE through ATUMS, Alberta Innovates and the University of Alberta’s Future Energy Systems (CFREF) programs. A. K. is supported by an Alberta Innovates Graduate Student Scholarship.References
- Y. Zhao and K. Zhu, Chem. Soc. Rev., 2016, 45, 655–689 RSC.
- M. V. Kovalenko, L. Protesescu and M. I. Bodnarchuk, Science, 2017, 750, 745–750 CrossRef.
- B. R. Sutherland and E. H. Sargent, Nat. Photonics, 2016, 10, 295–302 CrossRef CAS.
- S. Yakunin, M. Sytnyk, D. Kriegner, S. Shrestha, M. Richter, G. J. Matt, H. Azimi, C. J. Brabec, J. Stangl, M. V. Kovalenko and W. Heiss, Nat. Photonics, 2015, 9, 444–449 CrossRef CAS.
- S. F. Leung, K. T. Ho, P. K. Kung, V. K. S. Hsiao, H. N. Alshareef, Z. L. Wang and J. H. He, Adv. Mater., 2018, 30, 1704611 CrossRef.
- K. Chen, X. Deng, G. Dodekatos and H. Tüysüz, J. Am. Chem. Soc., 2017, 139, 12267–12273 CrossRef CAS.
- National Renewable Energy Laboratory (NREL), Best Research-Cell Efficiency Chart, https://www.nrel.gov/pv/assets/pdfs/best-research-cell-efficiencies.20200925.pdf, accessed Nov 2020 Search PubMed.
- J. Yang, B. D. Siempelkamp, D. Liu and T. L. Kelly, ACS Nano, 2015, 9, 1955–1963 CrossRef CAS.
- A. Babayigit, A. Ethirajan, M. Muller and B. Conings, Nat. Mater., 2016, 15, 247–251 CrossRef CAS.
- J. Li, H. Cao, W. Jiao, Q. Wang, M. Wei, I. Cantone, J. Lü and A. Abate, Nat. Commun., 2020, 11, 310 CrossRef CAS.
- M. A. Kamarudin, D. Hirotani, Z. Wang, K. Hamada, K. Nishimura, Q. Shen, T. Toyoda, S. Iikubo, T. Minemoto, K. Yoshino and S. Hayase, J. Phys. Chem. Lett., 2019, 10, 5277–5283 CrossRef CAS.
- C. C. Stoumpos, C. D. Malliakas and M. G. Kanatzidis, Inorg. Chem., 2013, 52, 9019–9038 CrossRef CAS.
- T. Bin Song, T. Yokoyama, C. C. Stoumpos, J. Logsdon, D. H. Cao, M. R. Wasielewski, S. Aramaki and M. G. Kanatzidis, J. Am. Chem. Soc., 2017, 139, 836–842 CrossRef.
- M. Konstantakou and T. Stergiopoulos, J. Mater. Chem. A, 2017, 5, 11518–11549 RSC.
- B. Li, R. Long, Y. Xia and Q. Mi, Angew. Chem., Int. Ed., 2018, 130, 13338–13342 CrossRef.
- L. Peedikakkandy and P. Bhargava, RSC Adv., 2016, 6, 19857–19860 RSC.
- D. Sabba, H. K. Mulmudi, R. R. Prabhakar, T. Krishnamoorthy, T. Baikie, P. P. Boix, S. Mhaisalkar and N. Mathews, J. Phys. Chem. C, 2015, 119, 1763–1767 CrossRef CAS.
- D. P. McMeekin, G. Sadoughi, W. Rehman, G. E. Eperon, M. Saliba, M. T. Hörantner, A. Haghighirad, N. Sakai, L. Korte, B. Rech, M. B. Johnston, L. M. Herz and H. J. Snaith, Science, 2016, 351, 151–155 CrossRef CAS.
- T. C. Jellicoe, J. M. Richter, H. F. J. Glass, M. Tabachnyk, R. Brady, S. E. Dutton, A. Rao, R. H. Friend, D. Credgington, N. C. Greenham and M. L. Böhm, J. Am. Chem. Soc., 2016, 138, 2941–2944 CrossRef CAS.
- F. Yuan, J. Xi, H. Dong, K. Xi, W. Zhang, C. Ran, B. Jiao, X. Hou, A. K. Y. Jen and Z. Wu, Phys. Status Solidi RRL, 2018, 12, 1800090 CrossRef.
- K. Yamada, Y. Kuranaga, K. Ueda, S. Goto, T. Okuda and Y. Furukawa, Bull. Chem. Soc. Jpn., 1998, 71, 127–134 CrossRef CAS.
- M. Mori and H. Saito, J. Phys. C: Solid State Phys., 1986, 19, 2391–2401 CrossRef CAS.
- R. E. Wasylishen, O. Knop and J. B. Macdonald, Solid State Commun., 1985, 56, 581–582 CrossRef CAS.
- G. M. Bernard, R. E. Wasylishen, C. I. Ratcliffe, V. Terskikh, Q. Wu, J. M. Buriak and T. Hauger, J. Phys. Chem. A, 2018, 122, 1560–1573 CrossRef CAS.
- D. J. Kubicki, D. Prochowicz, A. Hofstetter, M. Saski, P. Yadav, D. Bi, N. Pellet, J. Lewiński, S. M. Zakeeruddin, M. Grätzel and L. Emsley, J. Am. Chem. Soc., 2018, 140, 3345–3351 CrossRef CAS.
- A. Karmakar, M. S. Dodd, S. Agnihotri, E. Ravera and V. K. Michaelis, Chem. Mater., 2018, 30, 8280–8290 CrossRef CAS.
- A. Karmakar, G. M. Bernard, A. Meldrum, A. O. Oliynyk and V. K. Michaelis, J. Am. Chem. Soc., 2020, 142, 10780–10793 CrossRef CAS.
- M. Aebli, L. Piveteau, O. Nazarenko, B. M. Benin, F. Krieg, R. Verel and M. V. Kovalenko, Sci. Rep., 2020, 10, 8229 CrossRef CAS.
- L. Piveteau, M. Aebli, N. Yazdani, M. Millen, L. Korosec, F. Krieg, B. M. Benin, V. Morad, C. Piveteau, T. Shiroka, A. Comas-Vives, C. Copéret, A. M. Lindenberg, V. Wood, R. Verel and M. V. Kovalenko, ACS Cent. Sci., 2020, 6, 1138–1149 CrossRef CAS.
- L. Piveteau, V. Morad and M. V. Kovalenko, J. Am. Chem. Soc., 2020, 142, 19413–19437 CrossRef CAS.
- B. A. Rosales, L. Men, S. D. Cady, M. P. Hanrahan, A. J. Rossini and J. Vela, Chem. Mater., 2016, 28, 6848–6859 CrossRef CAS.
- W. M. J. Franssen, S. G. D. van Es, R. Dervişoğlu, G. A. de Wijs and A. P. M. Kentgens, J. Phys. Chem. Lett., 2017, 8, 61–66 CrossRef CAS.
- A. Senocrate, I. Moudrakovski, G. Y. Kim, T. Yang, G. Gregori, M. Grätzel and J. Maier, Angew. Chem., Int. Ed., 2017, 56, 7755–7759 CrossRef CAS.
- A. Senocrate, I. Moudrakovski, T. Acartürk, R. Merkle, G. Y. Kim, U. Starke, M. Grätzel and J. Maier, J. Phys. Chem. C, 2018, 122, 21803–21806 CrossRef CAS.
- A. Karmakar, A. M. Askar, G. M. Bernard, V. V. Terskikh, M. Ha, S. Patel, K. Shankar and V. K. Michaelis, Chem. Mater., 2018, 30, 2309–2321 CrossRef CAS.
- A. M. Askar, A. Karmakar, G. M. Bernard, M. Ha, V. V. Terskikh, B. D. Wiltshire, S. Patel, J. Fleet, K. Shankar and V. K. Michaelis, J. Phys. Chem. Lett., 2018, 9, 2671–2677 CrossRef CAS.
- D. J. Kubicki, D. Prochowicz, A. Hofstetter, S. M. Zakeeruddin, M. Grätzel and L. Emsley, J. Am. Chem. Soc., 2017, 139, 14173–14180 CrossRef CAS.
- W. M. J. Franssen and A. P. M. Kentgens, Solid State Nucl. Magn. Reson., 2019, 100, 36–44 CrossRef CAS.
- Y. Chen, S. R. Smock, A. H. Flintgruber, F. A. Perras, R. L. Brutchey and A. J. Rossini, J. Am. Chem. Soc., 2020, 142, 6117–6127 CrossRef CAS.
- D. J. Kubicki, D. Prochowicz, A. Hofstetter, B. J. Walder and L. Emsley, ACS Energy Lett., 2020, 5, 2964–2971 CrossRef CAS.
- A. Karmakar, M. S. Dodd, X. Zhang, M. S. Oakley, M. Klobukowski and V. K. Michaelis, Chem. Commun., 2019, 55, 5079–5082 RSC.
- D. Prochowicz, P. Yadav, M. Saliba, D. J. Kubicki, M. M. Tavakoli, S. M. Zakeeruddin, J. Lewiński, L. Emsley and M. Grätzel, Nano Energy, 2018, 49, 523–528 CrossRef CAS.
- M. Ha, A. Karmakar, G. M. Bernard, E. Basilio, A. Krishnamurthy, A. M. Askar, K. Shankar, S. Kroeker and V. K. Michaelis, J. Phys. Chem. C, 2020, 124, 15015–15027 CrossRef CAS.
- D. J. Kubicki, D. Prochowicz, E. Salager, A. Rakhmatullin, C. P. Grey, L. Emsley and S. D. Stranks, J. Am. Chem. Soc., 2020, 142, 7813–7826 CrossRef CAS.
- K. Yamada, K. Fujise, S. Hino, Y. Yamane and T. Nakagama, Chem. Lett., 2019, 48, 749–752 CrossRef CAS.
- B. Wrackmeyer, in Annu. Rep. NMR Spectrosc., ed. G. A. Webb, Academic Press, 1999, vol. 38, pp. 203–264 Search PubMed.
- P. Wolf, M. Valla, A. J. Rossini, A. Comas-Vives, F. Núñez-Zarur, B. Malaman, A. Lesage, L. Emsley, C. Copéret and I. Hermans, Angew. Chem., Int. Ed., 2014, 53, 10179–10183 CrossRef CAS.
- P. Wolf, M. Valla, F. Núñez-Zarur, A. Comas-Vives, A. J. Rossini, C. Firth, H. Kallas, A. Lesage, L. Emsley, C. Copéret and I. Hermans, ACS Catal., 2016, 6, 4047–4063 CrossRef CAS.
- A. Grykałowska and B. Nowak, Solid State Nucl. Magn. Reson., 2005, 27, 223–227 CrossRef.
- J. Barrett, S. R. A. Bird, J. D. Donaldson and J. Silver, J. Chem. Soc. A, 1971, 3105–3108 RSC.
- F. R. Poilsen and S. E. Rasmussen, Acta Chem. Scand., 1970, 24, 150–156 CrossRef.
- A. Oranskaia, J. Yin, O. M. Bakr, J. L. Brédas and O. F. Mohammed, J. Phys. Chem. Lett., 2018, 9, 5474–5480 CrossRef CAS.
- Z. Hong, D. Tan, R. A. John, Y. K. E. Tay, Y. K. T. Ho, X. Zhao, T. C. Sum, N. Mathews, F. García and H. Sen Soo, iScience, 2019, 16, 312–325 CrossRef CAS.
- R. F. Moran, D. Mckay, P. C. Tornstrom, A. Aziz, A. Fernandes, R. Grau-Crespo and S. E. Ashbrook, J. Am. Chem. Soc., 2019, 141, 17838–17846 CrossRef CAS.
- S. E. Ashbrook, K. R. Whittle, G. R. Lumpkin and I. Farnan, J. Phys. Chem. B, 2006, 110, 10358–10364 CrossRef CAS.
- D. J. Kubicki, M. Saski, S. Macpherson, K. Gałkowski, J. Lewiński, D. Prochowicz, J. J. Titman and S. D. Stranks, Chem. Mater., 2020, 32, 8129–8138 CrossRef CAS.
- R. R. Sharp, J. Chem. Phys., 1972, 57, 5321–5330 CrossRef CAS.
- R. R. Sharp, J. Chem. Phys., 1974, 60, 1149–1157 CrossRef CAS.
- D. Prochowicz, M. Franckevicius, A. M. Cieslak, S. M. Zakeeruddin, M. Grätzel and J. Lewinski, J. Mater. Chem. A, 2015, 3, 20772–20777 RSC.
- D. Prochowicz, P. Yadav, M. Saliba, M. Saski, S. M. Zakeeruddin, J. Lewiński and M. Grätzel, Sustainable Energy Fuels, 2017, 1, 689–693 RSC.
- T. Friščić, in Encyclopedia of Inorganic and Bioinorganic Chemistry, 2014, DOI:10.1002/9781119951438.eibc2202.
- S. L. James, C. J. Adams, C. Bolm, D. Braga, P. Collier, T. Friscic, F. Grepioni, K. D. M. Harris, G. Hyett, W. Jones, A. Krebs, J. Mack, L. Maini, A. G. Orpen, I. P. Parkin, W. C. Shearouse, J. W. Steed and D. C. Waddell, Chem. Soc. Rev., 2012, 41, 413–447 RSC.
- B. Chen, M. Yang, X. Zheng, C. Wu, W. Li, Y. Yan, J. Bisquert, G. Garcia-Belmonte, K. Zhu and S. Priya, J. Phys. Chem. Lett., 2015, 6, 4693–4700 CrossRef CAS.
- Y. Yuan and J. Huang, Acc. Chem. Res., 2016, 49, 286–293 CrossRef CAS.
- P. Calado, A. M. Telford, D. Bryant, X. Li, J. Nelson, B. C. O’Regan and P. R. F. Barnes, Nat. Commun., 2016, 7, 13831 CrossRef CAS.
- C. Eames, J. M. Frost, P. R. F. Barnes, B. C. O'Regan, A. Walsh and M. S. Islam, Nat. Commun., 2015, 6, 7497 CrossRef CAS.
- K. Yamada, H. Kawaguchi, T. Matsui, T. Okuda and S. Ichiba, Bull. Chem. Soc. Jpn., 1990, 63, 2521–2525 CrossRef CAS.
- N. Onoda-Yamamoto, T. Matsuo and H. Suga, J. Chem. Thermodyn., 1991, 23, 987–999 CrossRef.
- M. H. Futscher, J. M. Lee, L. McGovern, L. A. Muscarella, T. Wang, M. I. Haider, A. Fakharuddin, L. Schmidt-Mende and B. Ehrler, Mater. Horiz., 2019, 6, 1497–1503 RSC.
- J. Mizusaki, K. Arai and K. Fueki, Solid State Ionics, 1983, 11, 203–211 CrossRef CAS.
- T. Xia, Y. Li, L. Huang, W. Ji, M. Yang and X. Zhao, ACS Appl. Mater. Interfaces, 2020, 12, 18634–18641 CrossRef CAS.
- T. A. Kuku, Solid State Ionics, 1986, 20, 217–222 CrossRef CAS.
- H. Hoshino, M. Yamazaki, Y. Nakamura and M. Shimoji, J. Phys. Soc. Jpn., 1969, 26, 1422–1426 CrossRef CAS.
- H. Hoshino, S. Yokose and M. Shimoji, J. Solid State Chem., 1973, 7, 1–6 CrossRef CAS.
- A. Walsh, D. O. Scanlon, S. Chen, X. G. Gong and S. H. Wei, Angew. Chem., Int. Ed., 2015, 54, 1791–1794 CrossRef CAS.
- S. Indris, M. Scheuermann, S. M. Becker, V. Šepelák, R. Kruk, J. Suffner, F. Gyger, C. Feldmann, A. S. Ulrich and H. Hahn, J. Phys. Chem. C, 2011, 115, 6433–6437 CrossRef CAS.
- R. G. Barnes, J. Phys. Chem. Solids, 1966, 27, 567–573 CrossRef.
Footnote |
| † Electronic supplementary information (ESI) available: Experimental section, Tables S1–S8 and Fig. S1–S14. See DOI: 10.1039/d0sc05614f |
| This journal is © The Royal Society of Chemistry 2021 |

