
 Open Access Article
 This Open Access Article is licensed under a Creative Commons Attribution-Non Commercial 3.0 Unported Licence
Expeditious synthesis of aromatic-free piperidinium-functionalized polyethylene as alkaline anion exchange membranes†
Wei
You
 a,
Jacob M.
Ganley
b,
Brian G.
Ernst
a,
Cheyenne R.
Peltier
a,
Hsin-Yu
Ko
a,
Robert A.
DiStasio
Jr
*a,
Robert R.
Knowles
*b and
Geoffrey W.
Coates
*a
a,
Jacob M.
Ganley
b,
Brian G.
Ernst
a,
Cheyenne R.
Peltier
a,
Hsin-Yu
Ko
a,
Robert A.
DiStasio
Jr
*a,
Robert R.
Knowles
*b and
Geoffrey W.
Coates
*a
aDepartment of Chemistry and Chemical Biology, Baker Laboratory, Cornell University, Ithaca, NY 14853, USA
bDepartment of Chemistry, Princeton University, Princeton, NJ 08544, USA
First published on 1st February 2021
Abstract
Alkaline anion exchange membranes (AAEMs) with high hydroxide conductivity and good alkaline stability are essential for the development of anion exchange membrane fuel cells to generate clean energy by converting renewable fuels to electricity. Polyethylene-based AAEMs with excellent properties can be prepared via sequential ring-opening metathesis polymerization (ROMP) and hydrogenation of cyclooctene derivatives. However, one of the major limitations of this approach is the complicated multi-step synthesis of functionalized cyclooctene monomers. Herein, we report that piperidinium-functionalized cyclooctene monomers can be easily prepared via the photocatalytic hydroamination of cyclooctadiene with piperidine in a one-pot, two-step process to produce high-performance AAEMs. Possible alkaline-degradation pathways of the resultant polymers were analyzed using spectroscopic analysis and dispersion-inclusive hybrid density functional theory (DFT) calculations. Quite interestingly, our theoretical calculations indicate that local backbone morphology—which can potentially change the Hofmann elimination reaction rate constant by more than four orders of magnitude—is another important consideration in the rational design of stable high-performance AAEMs.
Introduction
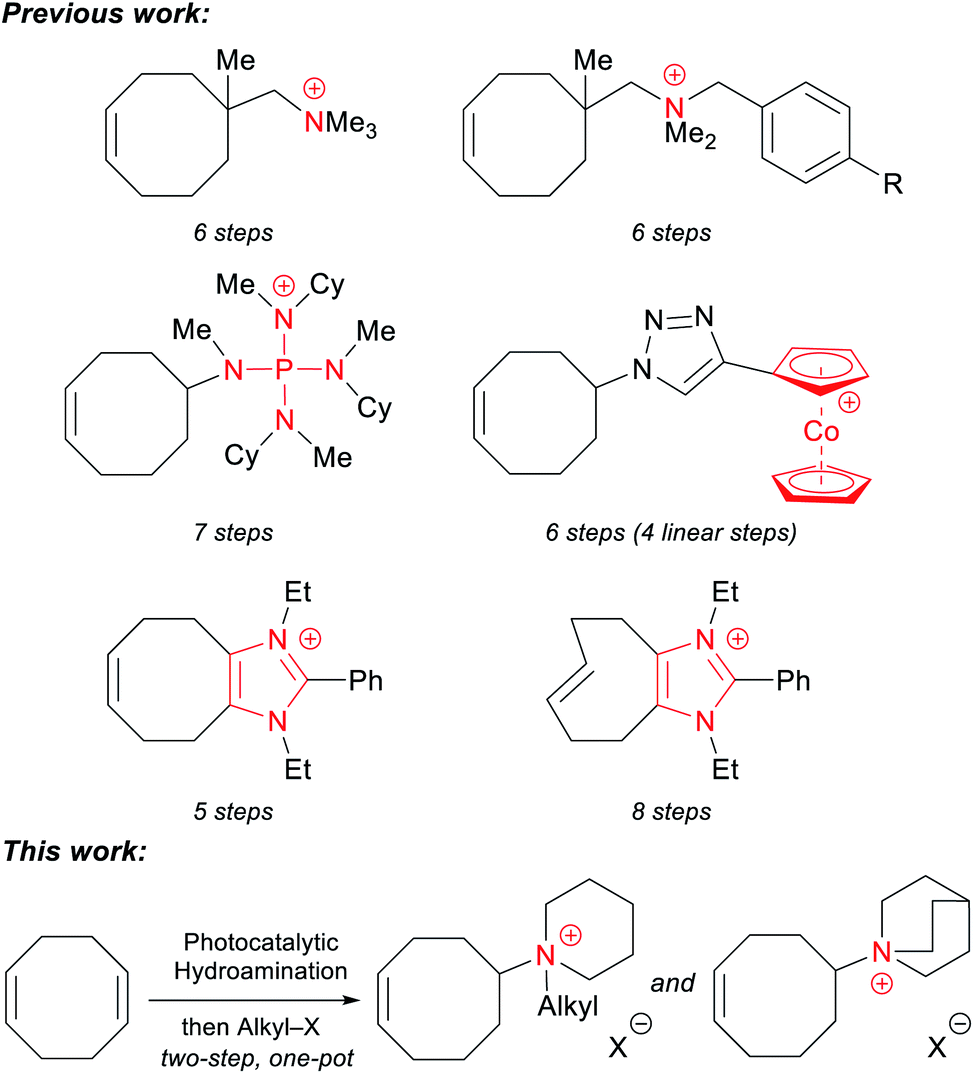
The replacement of fossil fuels with renewable fuels (e.g., H2) will be an important part of addressing issues related to CO2 emission.1 Anion exchange membrane fuel cells (AEMFCs) are a state-of-the-art technology that efficiently convert chemical energy to electricity without the use of expensive Pt-group electrocatalysts.2–5 The alkaline anion exchange membrane (AAEM) and the anion exchange ionomer (AEI), which are both composed of polymeric backbones with pendant cationic functional groups, are critical components in AEMFCs and are responsible for conducting hydroxide anions from the cathode to the anode. Unfortunately, the chemical instability of these cationic polymers towards hydroxide anions remains one of the major obstacles for the development of viable AEMFCs.6–8 Both the polymeric backbones and the tethered cations must be stable to alkaline conditions in order to produce durable devices.9–11Given that cation degradation under alkaline conditions is a major problem, many cationic moieties have been investigated for AAEM applications, including ammonium,12–19 phosphonium,20–23 imidazolium,24–29 and metal-based cations.30–33 Model compound studies can shed light on cation stabilities and their mechanisms of degradation.10,34–38 Notably, in 2015, Marino and Kreuer suggested incorporating piperidinium cations within AAEMs due to their outstanding alkaline stability and ease of synthesis.38 Since then, several groups have developed strategies to synthesize piperidinium-functionalized AAEMs.39–53 For example, Jannasch, Yan, and Zhuang independently developed polyphenylene-piperidinium systems, and all of which displayed good alkaline stabilities.39–43 In addition, Jannasch and coworkers prepared a multi-piperidinium-functionalized AAEM with a hydroxide conductivity of 221 mS cm−1 at 80 °C.44 These results suggest that piperidinium cations are promising structural motifs for high-performance AAEMs.
Every previously reported piperidinium-functionalized AAEM is based on a poly(aromatic) backbone: poly(phenylene oxide), polysulfone, polystyrene, polyphenylene, etc. These aromatic structures can make the polymers rigid, and may also be adsorbed by electrocatalysts, thereby reducing the efficiency of electrochemical reactions.54–56 Additionally, it has been proposed that the aryl-ether linkages in poly(phenylene oxide)s and polysulfones are unstable under alkaline conditions.56–58 More recently, Kim and coworkers demonstrated that poly(aromatic) backbones lacking heteroatoms can undergo oxidative degradation in an operating membrane electrode assembly (MEA).59 Therefore, it is advantageous to prepare analogous AAEMs free of aromatic substituents. Some aromatic-free AAEMs have been prepared with polyolefin backbones, including polyethylene (PE),12,20 polypropylene,60 polynorbornene,14,61–65 and polytetrafluoroethylene (PTFE).66,67 Among these materials, PE-based AAEMs have shown promising chemical stability and mechanical integrity. These materials are conveniently prepared from a ring-opening-metathesis polymerization (ROMP)/hydrogenation sequence of cyclooctene (COE) monomers functionalized with various cations, including ammonium,12,13 phosphonium,20 imidazolium,25,26 and cobaltocenium.30,33 Despite the outstanding properties of PE-based AAEMs, one of the major limitations of these materials is the laborious synthesis of the cationic monomers, which usually requires four to eight linear steps from commercially available 1,5-cyclooctadiene (COD) (Scheme 1).
 | ||
| Scheme 1 General scheme of functionalized cyclooctene monomers to prepare PE-based AAEMs. | ||
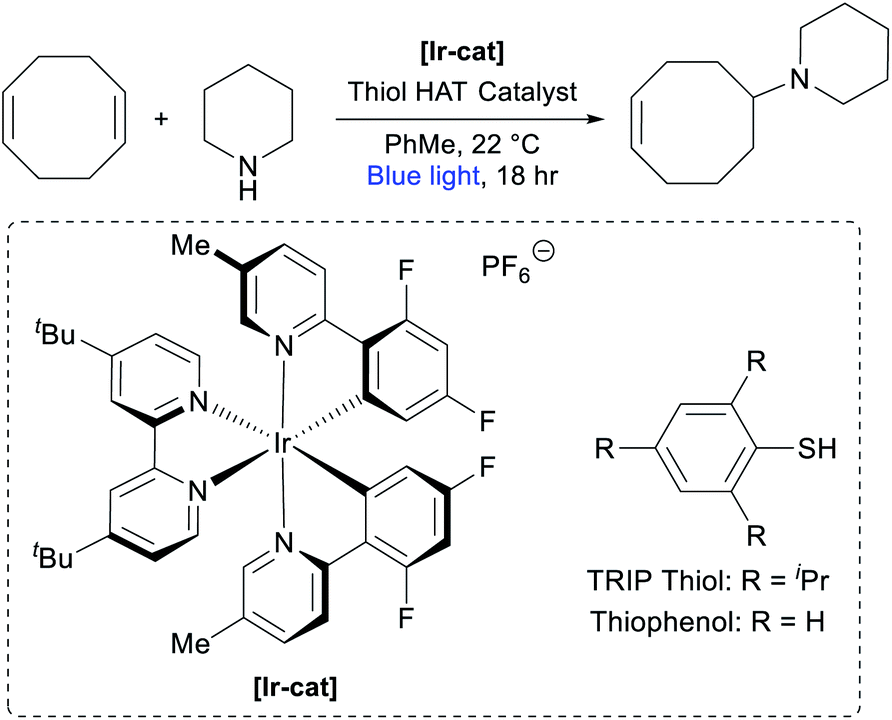
Most synthetic routes to these COE monomers first entail an oxidation state or functional group manipulation of COD, followed by the installation of a nitrogen group. A more direct and conceptually simple synthesis of these compounds would be the redox neutral hydroamination of COD.68,69 While significant progress in the field has been made, intermolecular hydroaminations of unactivated alkenes with simple amines remain rare.70–73 Indeed, only a single example of COD hydroamination has been published to date. In 2017, we reported that the photocatalytic hydroamination of COD with piperidine could afford a functionalized COE in a single step.74 With the robust ROMP/hydrogenation strategy, we sought to convert these easily accessible monomers to potential AAEM materials. Herein, we use a modified protocol to prepare a series of piperidinium-functionalized COE monomers in a two-step, one-pot process that directly combines COD, piperidine, and an alkyl iodide. This photocatalytic method allows for the efficient synthesis of multi-gram quantities of monomers in a 100% atom-economical fashion. The quinuclidinium-functionalized analogue can also be synthesized in two steps from commercially available starting materials. To the best of our knowledge, this is the first report of aromatic-free piperidinium- and quinuclidinium-functionalized AAEMs.
Results and discussion
Optimization of monomer synthesis
In our previous report on the photocatalytic hydroamination of olefins, we disclosed that COD could be directly functionalized with piperidine.74 Although the reported conditions were noteworthy for their high efficiency across a broad scope of substrates, we identified a number of factors that made them less ideal for the large-scale synthesis of AAEM monomers, such as the high loading of photocatalyst [Ir(dF(Me)ppy)2(dtbbpy)]PF6 ([Ir-cat], 2 mol%), the use of commercially unavailable 2,4,6-triisopropylbenzenethiol (TRIP thiol) as H-atom transfer (HAT) catalyst (50 mol%), and the relatively dilute reaction conditions (0.05 M).74 Seeking to develop an efficient multi-gram synthesis of cyclooctene-piperidine monomers, we commenced optimization studies (Table 1). Using the original conditions, we observed the desired addition product in 76% yield based on piperidine (entry 1), with the major side product resulting from double hydroamination of the alkenes in COD. Increasing the equivalents of COD from 5 to 10 gave a modestly improved yield and markedly decreased the over-hydroamination side products (entry 2). Increasing the reaction concentration from 0.05 M to 0.2 M in toluene reduced the reactivity of the system (entry 3), but an accompanying reduction in photocatalyst loading boosted the yield to 86% (entry 4). We were also pleased to find that the reaction still worked efficiently with only 15 mol% HAT catalyst (entry 5). Switching to thiophenol as a simpler HAT catalyst proved to be slightly less efficient (entry 6), but in weighing the practicality of the reaction we opted to move forward with this system.|
|
|||||
|---|---|---|---|---|---|
| Entry | [Piperidine] | COD equiv. | [Ir-cat] mol% | Thiol (mol%) | Yield |
| a Reactions were run at 0.5 mmol scale (piperidine). Yields were calculated based on piperidine for isolated materials after purification. See the ESI for more details. | |||||
| 1 | 0.05 M | 5.0 | 2.0 | TRIP thiol (50) | 76% |
| 2 | 0.05 M | 10 | 2.0 | TRIP thiol (50) | 82% |
| 3 | 0.2 M | 10 | 2.0 | TRIP thiol (50) | 72% |
| 4 | 0.2 M | 10 | 0.25 | TRIP thiol (50) | 86% |
| 5 | 0.2 M | 10 | 0.25 | TRIP thiol (15) | 80% |
| 6 | 0.2 M | 10 | 0.25 | Thiophenol (15) | 69% |
| 7 | 0.2 M | 10 | 0.25 | Thiophenol (50) | 64% |
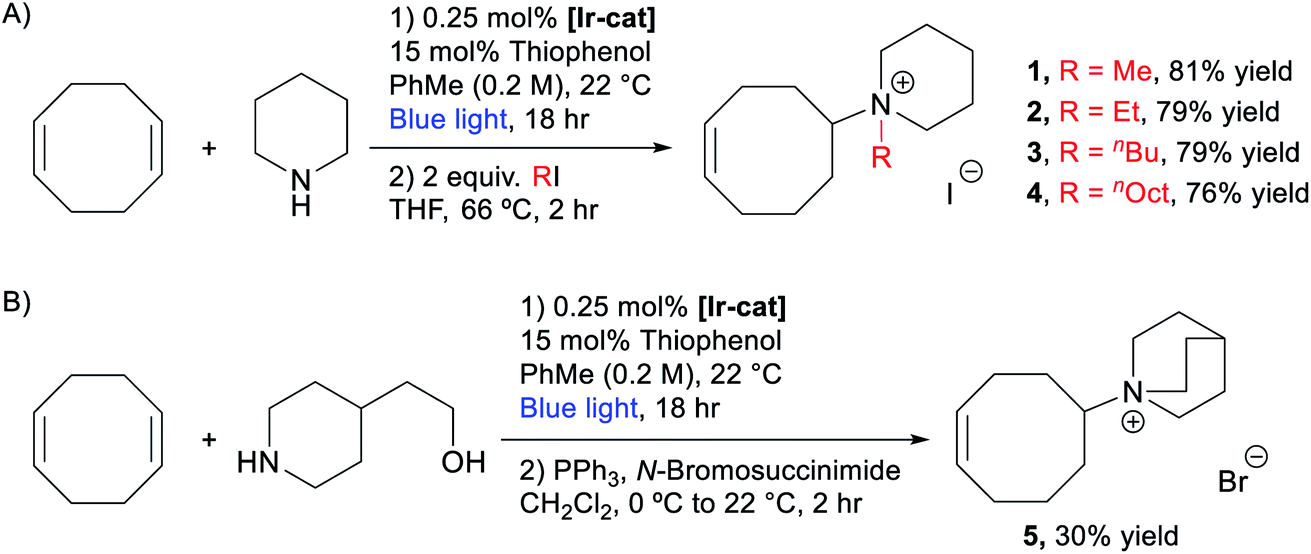
We then evaluated the possibility of a telescoped sequence to directly isolate the quaternary ammonium monomers. After the optimized hydroamination reaction described above (Table 1, entry 6), the toluene, unreacted piperidine, COD, and thiophenol catalyst were removed under reduced pressure. The residue was refluxed with 2 equiv. of MeI in THF for 2 hours providing white solid 1 in 81% yield after trituration in Et2O. This one-pot, two-step approach can be used to prepare monomers expediently in at least 1.5 gram scale (see the ESI† for more details). Similar strategies were applied to synthesize other piperidinium-functionalized monomers, including ethyl (2), n-butyl (3), and n-octyl (4) derivatives (Scheme 2A). Quinuclidinium monomer 5 was prepared in 30% yield over two steps via hydroamination of COD with 2-(piperidin-4-yl)ethanol followed by an Appel reaction (Scheme 2B).75
 | ||
| Scheme 2 Synthesis of (A) piperidinium- and (B) quinuclidinium-functionalized cyclooctenes. | ||
Membrane synthesis and properties
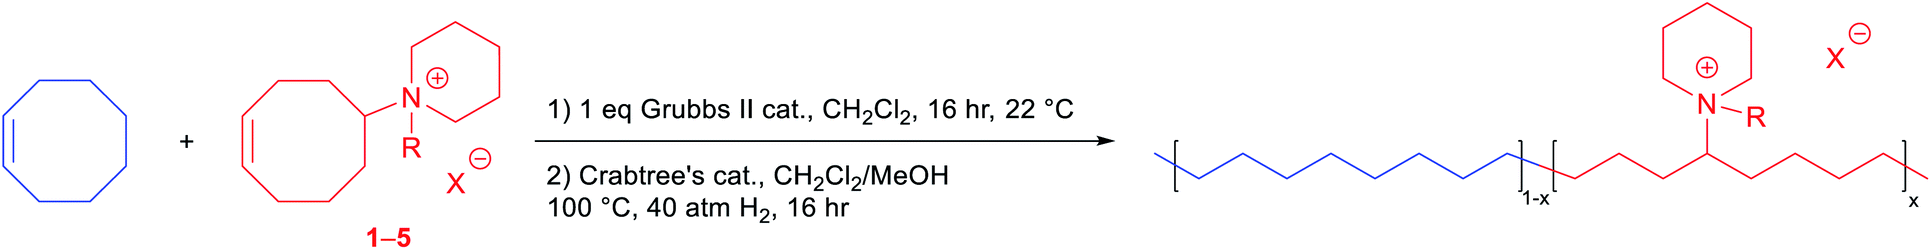
With various functionalized cyclooctene monomers in hand, a series of piperidinium-functionalized AAEMs (i.e.PEPM, PEPE, PEPB, PEPO, and PEQ membranes from monomers 1–5, respectively) were prepared via a ROMP/hydrogenation sequence (Table 2). The functionalized monomers were first copolymerized with cis-COE by adapting our previous ROMP procedures.12,20,25 The molar ratio of cis-COE to Grubbs II catalyst was 800![[thin space (1/6-em)]](https://www.rsc.org/images/entities/char_2009.gif) :1, and the incorporation of the ionic monomers can be easily tuned by changing their loading (Table 2). The resulting copolymers were then hydrogenated using Crabtree's catalyst and H2 to produce AAEMs with PE backbones. After hydrogenation, the AAEM thin films were cast via a melt-pressing method, and the anions were exchanged to hydroxide in a 1 M KOH aqueous solution before measuring hydroxide conductivity (σ(OH−, 22 °C)), water uptake (WU), and dimensional change (ΔL) (Table 2). Their ion exchange capacities (IECs) were determined by comparing integration ratios in 1H NMR spectra (Table 2), and the results were consistent with monomer feeding ratios and Mohr titration results (see the ESI Table S4† for more details). When R = Me, both the hydroxide conductivity and WU increased with IEC, and it was found that the cation incorporation ratio in the range of 20–23% allowed for a good balance between the two properties (PEPM20 and PEPM23) (Fig. 1A). Therefore, we controlled the cation incorporation ratio in substituted piperidinium (Et (2), nBu (3), and nOct (4)) and quinuclidinium (5) AAEMs to be approximately 20 mol% (PEPE20, PEPB18, PEPO23, and PEQ20, respectively). Excellent WU (within 40%) and ΔL (within 11%) performance was observed for all membranes with different alkyl substituents. PEPB18 and PEPO23 exhibited relatively low hydroxide conductivity, but they became significantly more conductive after 1 M KOHaq treatment at 80 °C for 3 days (vide infra, see Fig. 2). This is likely because their hydrophobic side chains slowed down the anion exchange process, so that longer time and higher temperatures were required for thorough hydroxide exchange.15 The hydroxide conductivities at 80 °C of AAEMs with methyl substituents were found to be in the range of 74–95 mS cm−1 (Fig. 1B), which are comparable to previously reported piperidinium functionalized AAEMs with similar IECs.39–42,45–53,76
:1, and the incorporation of the ionic monomers can be easily tuned by changing their loading (Table 2). The resulting copolymers were then hydrogenated using Crabtree's catalyst and H2 to produce AAEMs with PE backbones. After hydrogenation, the AAEM thin films were cast via a melt-pressing method, and the anions were exchanged to hydroxide in a 1 M KOH aqueous solution before measuring hydroxide conductivity (σ(OH−, 22 °C)), water uptake (WU), and dimensional change (ΔL) (Table 2). Their ion exchange capacities (IECs) were determined by comparing integration ratios in 1H NMR spectra (Table 2), and the results were consistent with monomer feeding ratios and Mohr titration results (see the ESI Table S4† for more details). When R = Me, both the hydroxide conductivity and WU increased with IEC, and it was found that the cation incorporation ratio in the range of 20–23% allowed for a good balance between the two properties (PEPM20 and PEPM23) (Fig. 1A). Therefore, we controlled the cation incorporation ratio in substituted piperidinium (Et (2), nBu (3), and nOct (4)) and quinuclidinium (5) AAEMs to be approximately 20 mol% (PEPE20, PEPB18, PEPO23, and PEQ20, respectively). Excellent WU (within 40%) and ΔL (within 11%) performance was observed for all membranes with different alkyl substituents. PEPB18 and PEPO23 exhibited relatively low hydroxide conductivity, but they became significantly more conductive after 1 M KOHaq treatment at 80 °C for 3 days (vide infra, see Fig. 2). This is likely because their hydrophobic side chains slowed down the anion exchange process, so that longer time and higher temperatures were required for thorough hydroxide exchange.15 The hydroxide conductivities at 80 °C of AAEMs with methyl substituents were found to be in the range of 74–95 mS cm−1 (Fig. 1B), which are comparable to previously reported piperidinium functionalized AAEMs with similar IECs.39–42,45–53,76
|
|
||||||
|---|---|---|---|---|---|---|
| Samples | Ionic monomer | mol% of 1–5 | IECb (mmol I− per g) | σ (OH−, 22 °C) (mS cm−1) | WUd | ΔLe |
| a See the ESI for more details. b Determined by 1H NMR analysis before hydrogenation. c Determined from the average of three trials ± standard deviation. d Water uptake at 22 °C = 100 × [masswet − massdry]/massdry%. e Dimensional change at 22 °C = 100 × [lengthwet − lengthdry]/lengthdry%. | ||||||
| PEPM0.16 | 1 | 16% | 1.09 | 26 ± 1 | 22% | 4% |
| PEPM0.20 | 1 | 20% | 1.31 | 35 ± 2 | 26% | 7% |
| PEPM0.23 | 1 | 23% | 1.41 | 43 ± 2 | 54% | 8% |
| PEPM0.28 | 1 | 28% | 1.61 | 53 ± 2 | 92% | 9% |
| PEPE0.20 | 2 | 20% | 1.25 | 36 ± 2 | 28% | 6% |
| PEPB0.18 | 3 | 18% | 1.12 | 16 ± 1 | 24% | 6% |
| PEPO0.23 | 4 | 23% | 1.23 | 15 ± 5 | 40% | 8% |
| PEQ0.20 | 5 | 20% | 1.25 | 35 ± 1 | 36% | 11% |
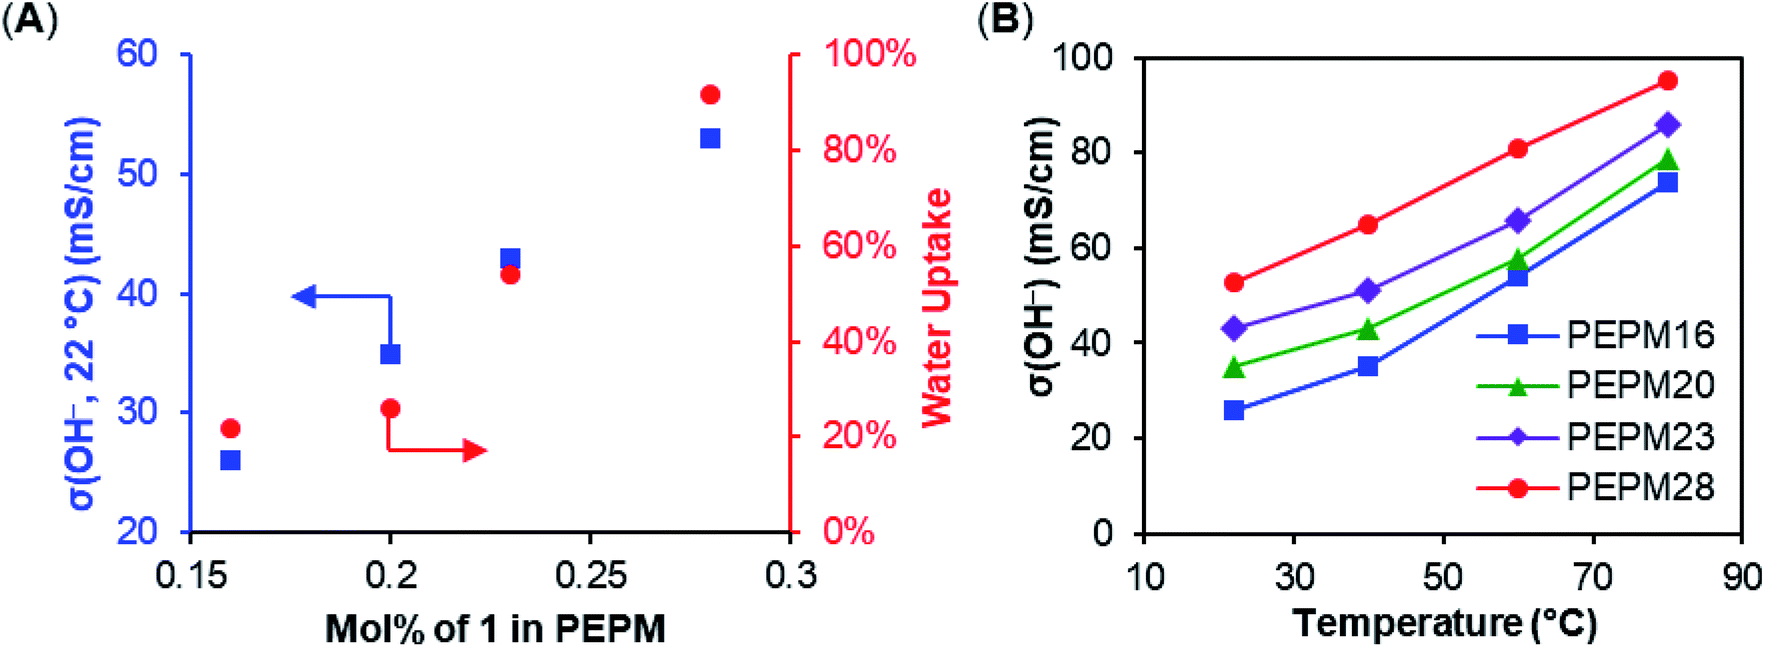 | ||
| Fig. 1 (A) Membrane hydroxide conductivity and water uptake of PEPMs with different ionic contents. (B) Membrane hydroxide conductivities of PEPMs under different temperatures. | ||
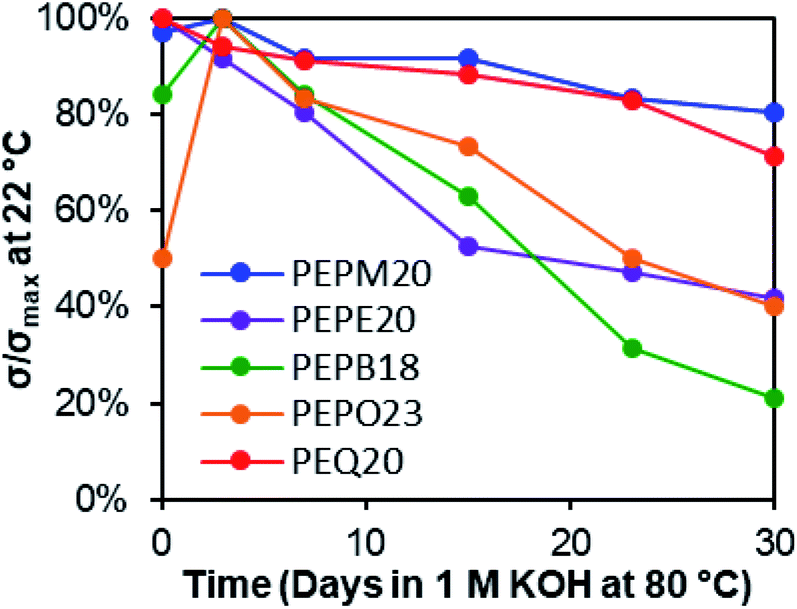 | ||
| Fig. 2 Membrane hydroxide conductivity stability under 1 M KOHaq at 80 °C in PP vials for 30 days. | ||
Membrane alkaline stability
In line with previously observed mechanisms for cation degradation,10,34–38,77 we expected there to be two major degradation mechanisms (i.e., nucleophilic substitution and Hofmann elimination) at three different sites in these piperidinium-functionalized AAEMs (i.e., the piperidinium ring, the alkyl substituent, and the PE backbone). Since nucleophilic substitution at the methine center of the polymer backbone should be relatively unlikely, we anticipated the five possible degradation pathways summarized in Scheme 3. Pathways a and b arise from nucleophilic substitution, while pathways c, d, and e derive from β-hydrogen Hofmann elimination.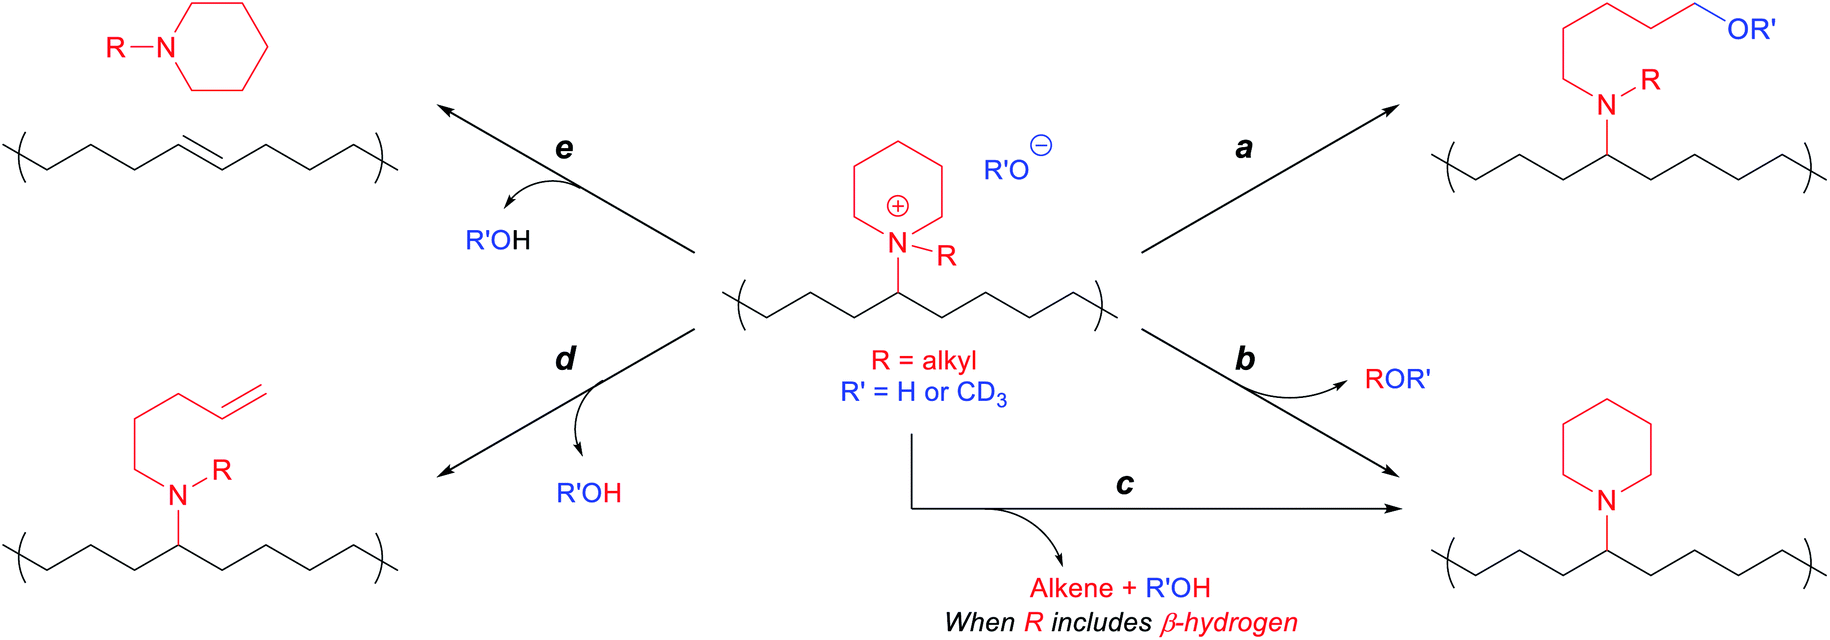 | ||
| Scheme 3 Possible degradation pathways of piperidinium-functionalized polyethylene. | ||
The membranes were soaked as strips in 1 M KOHaq at 80 °C in polypropylene (PP) vials for 30 days, and their alkaline stabilities were evaluated by both changes in hydroxide conductivities (Fig. 2) and Fourier-transform infrared (FT-IR) spectroscopy (Fig. 3). The methyl-substituted piperidinium PEPM20 and quinuclidinium PEQ20 showed the best conductivity stability (80% and 71% retained conductivity, respectively). The hydroxide conductivities of PEPB18 and PEPO23 boosted during the first three days with the plausible reasons discussed above, while drastic conductivity decreases were observed afterwards (21% and 40% remaining, respectively). AAEMs with ethyl substituents (PEPE20) exhibited obvious conductivity loss from the beginning of the stability tests (42% remaining after 30 days). These overall stability trends agreed well with previous reports.38,39 One of the most stable AAEMs, PEPM20, was further evaluated for its mechanical stability before and after the alkaline treatment (Fig. S38†). It was found that the as-synthesized membrane PEPM20 (fully hydrated in the iodide form) was strong and ductile (22 MPa stress and 330% strain at break), then the membrane became relatively weaker (15 MPa) yet more ductile (357% strain) after soaking in 1 M KOHaq at 80 °C for 30 days. Their excellent mechanical properties were comparable to Nafion™ N115 (32 MPa stress and 310% strain at break).78 The elongation properties of these PE-based AAEMs significantly outperformed the rigid AAEMs derived from poly(aromatic)s.54,79
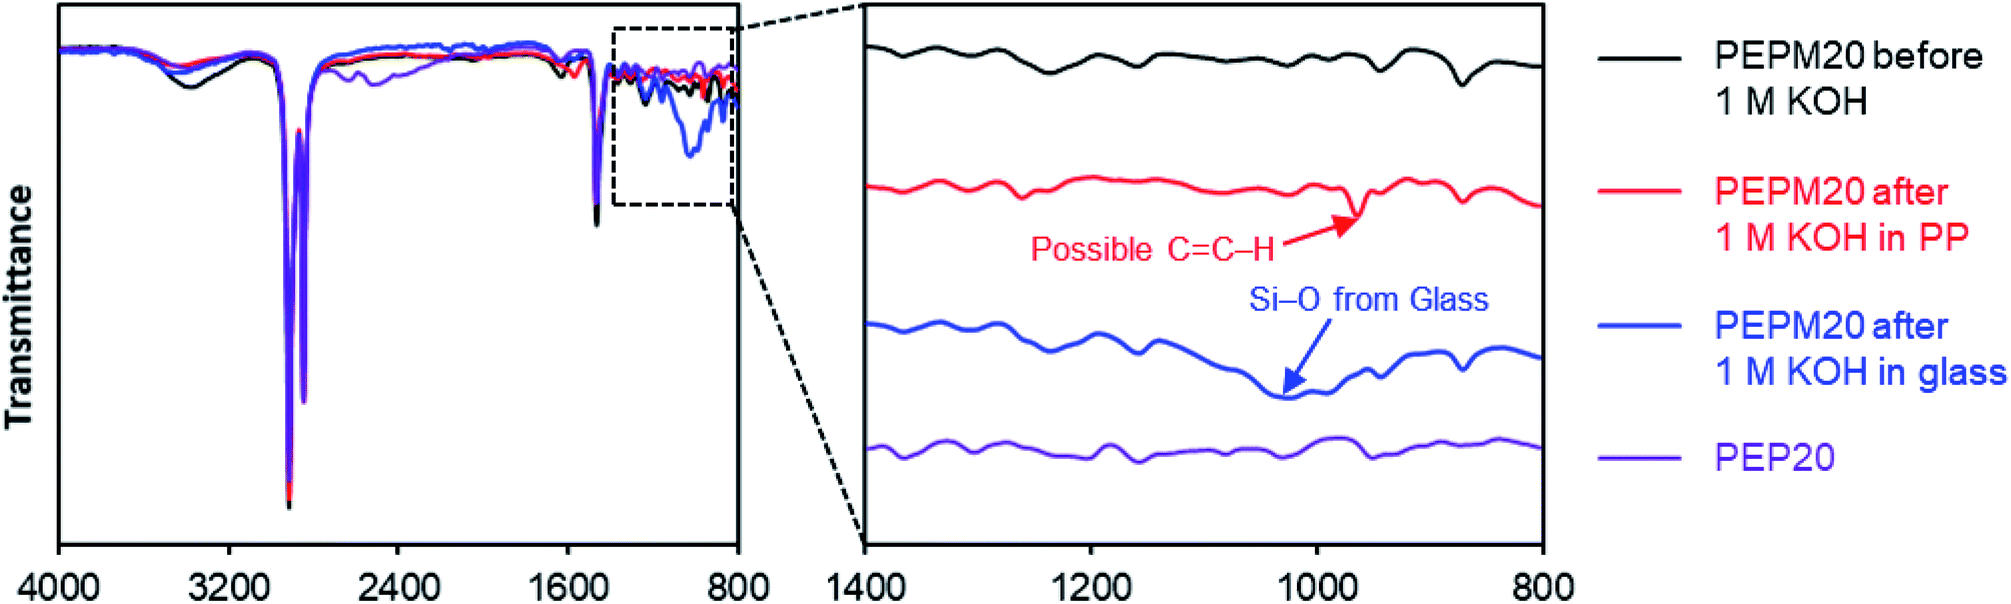 | ||
| Fig. 3 FT-IR spectra of membranes before and after alkaline treatment to study degradation mechanisms. | ||
To interrogate the degradation pathways, we used FT-IR spectroscopy to study the structural changes in these membranes before and after the alkaline treatment (Fig. 3). Piperidine-functionalized PE (PEP20) was also prepared from the HCl adduct of the hydroamination intermediate (compound S1†) using an analogous ROMP copolymerization strategy followed by deprotonation to mimic some of the proposed degradation products (pathways b and c in Scheme 3, see ESI† for more details).25 Since the as-prepared PE-based AAEMs cannot be dissolved in common organic solvents, solid-state characterization methods such as FT-IR are advantageous. Originally, we proposed that the piperidinium AAEMs would give extremely clear FT-IR spectra, as there are only three types of bonds in these aromatic-free polymers (i.e., C–C, C–H, and C–N bonds). However, as shown in Fig. 3 and S39,† we noticed that the signals of C–N bonds were too weak to be confidently assigned in comparison to the strong C–H bond signals (1460 cm−1 and 2800–3000 cm−1). The small hump peaks at 1650 cm−1 and 3300 cm−1 were from water in membranes.80 The FT-IR spectra of PEP, PEPM, PEPE, PEPB, PEPO, and PEQ were almost the same (Fig. S39†) suggesting that FT-IR spectroscopy might not be sensitive enough to distinguish piperidine and piperidinium in these polymer samples. A new peak at 964 cm−1 possibly suggested the presence of alkene groups in the polymer after alkaline treatment (the red trace in Fig. 3), yet it is hard to clearly assign it as pathways d or e in Scheme 3. As an important note, we observed that when we performed the stability studies in soda lime glass vials, there were always new broad peaks around 1050 cm−1 in FT-IR spectra for all the samples after alkaline treatment (see the blue trace in Fig. 3 and S40†). These peaks were attributed to Si–O bonds from glass etching, as we measured the weight of the glass vials dropping by near 0.5 g after the stability studies (Table S5†). We also observed relatively slower conductivity decrease in glass vials (Fig. S41†). Although similar glass etching problems have been observed in alkaline stability studies,81,82 this is the first spectroscopic evidence to prove that the detached Si–O substances could be adsorbed by polymer samples to affect their ionic conductivities. Plastic containers made from PP and PTFE are recommended to perform aqueous alkaline stability tests.38
To gain more insight into the degradation mechanism, we decided to use solution-based 1H NMR analysis, as it can provide quantitative degradation kinetics and clearer degradation product assignments. Our group has previously conducted alkaline stability studies under accelerated degradation conditions by treating model compounds or polymers with KOH solutions in CD3OH using 3-(trimethylsilyl)-1-propanesulfonic acid sodium salt as the internal standard at 80 °C in sealed NMR tubes.10,25,26,36 As a side note, control experiments showed that borosilicate glass NMR tubes were more resistant to basic corrosion and there were almost no changes to their weights after the KOH/methanol stability studies (Table S5†).10 One requirement of this NMR stability protocol is that the studied model compounds or polymers must be soluble in methanol. Fortunately, we can easily tune their solubilities by changing the cation incorporation ratio and molecular weight during the ROMP copolymerization process. For example, to get the previously mentioned mechanically strong AAEMs, we used a mol ratio of [COE]:[piperidinium]:[Ru] to be 800:200:1. By changing the ratio to 200:150:1, we obtained cationic polymers that were soluble in n-propanol (5 wt%) at 50 °C, which are ideal candidates as AEI solutions (Fig. S15†).12 By further changing the feeding ratio to 25:50:1, we were able to prepare a series of oligomers that were soluble in methanol at 50 °C. Notably, the cation incorporation percentage was slightly lower than expected in these oligomers, and monomers 1–5 gave rise to oligomers PEPM52, PEPE54, PEPB58, PEPO64, and PEQ55, respectively (see ESI† for more details).
We then subjected five cationic oligomers and a small molecule model compound N-hexyl-N-methylpiperidinium bromide (6) to the accelerated alkaline degradation conditions: 2 M KOH in CD3OH at 80 °C for 30 days (Fig. 4). The use of CD3OH makes anions ([OH]− and [OCD3]−) more reactive due to a smaller hydration sphere, and also prevents potential H/D exchange reactions.10,36 We found that cationic model compound 6 had very good alkaline stability (94% remaining after 30 days), and detected small amounts of byproducts from both nucleophilic demethylation (3%) and Hofmann elimination (2%).83 However, we observed much faster cation degradation in oligomers with the general trend being PEQ ≈ PEPM > PEPE > PEPB > PEPO. Oligomers PEPM52, PEPB58, and PEPO64 decomposed mostly through backbone Hofmann elimination (e) under these accelerated KOH/methanol conditions, as large quantities of N-alkylpiperidines were detected as byproducts (Fig. 4). We observed 27%, 55%, and 66% N-methyl-, N-butyl-, and N-octyl-piperidine compared to 41%, 87%, and 93% degradation from the corresponding PEPM52, PEPB58, and PEPO64, respectively. In all these cases, we also detected a broad single peak around 5.4 ppm, which is consistent with internal alkene peaks. The trend of increasing length of alkyl chains facilitating Hofmann elimination elsewhere is consistent with what Jannasch and coworkers demonstrated for their piperidinium-functionalized AAEMs, although they observed ring-opening Hofmann elimination as the major degradation pathway due to rigid substituents on the piperidinium ring.39 Ring-opening Hofmann elimination and nucleophilic ring opening degradation may also occur under our conditions, but these minor degradation pathways are extremely difficult to be accurately quantified by 1H NMR analysis in the complicated reaction system. Interestingly, a volatile degradation byproduct, ethylene, was detected from the degradation of PEPE54 oligomer (31% remaining). The backbone elimination (22%, e) and ethyl elimination (26%, c) gave similar rates under the testing conditions. Quinuclidinium PEQ55 gave 30% nucleophilic ring-opening degradation out of its 35% cation degradation, probably owing to the ring strain in this bicyclic scaffold. It is noteworthy that for all these oligomer studies in sealed NMR tubes, we observed the formation of dark insoluble materials, which likely formed as the oligomers became electroneutral and less polar after degradation, diminishing their solubility in methanol. These findings highlight the importance of using an internal standard to track polymer alkaline stabilities through 1H NMR analysis, as key information about volatile and insoluble byproducts could be easily missed otherwise.
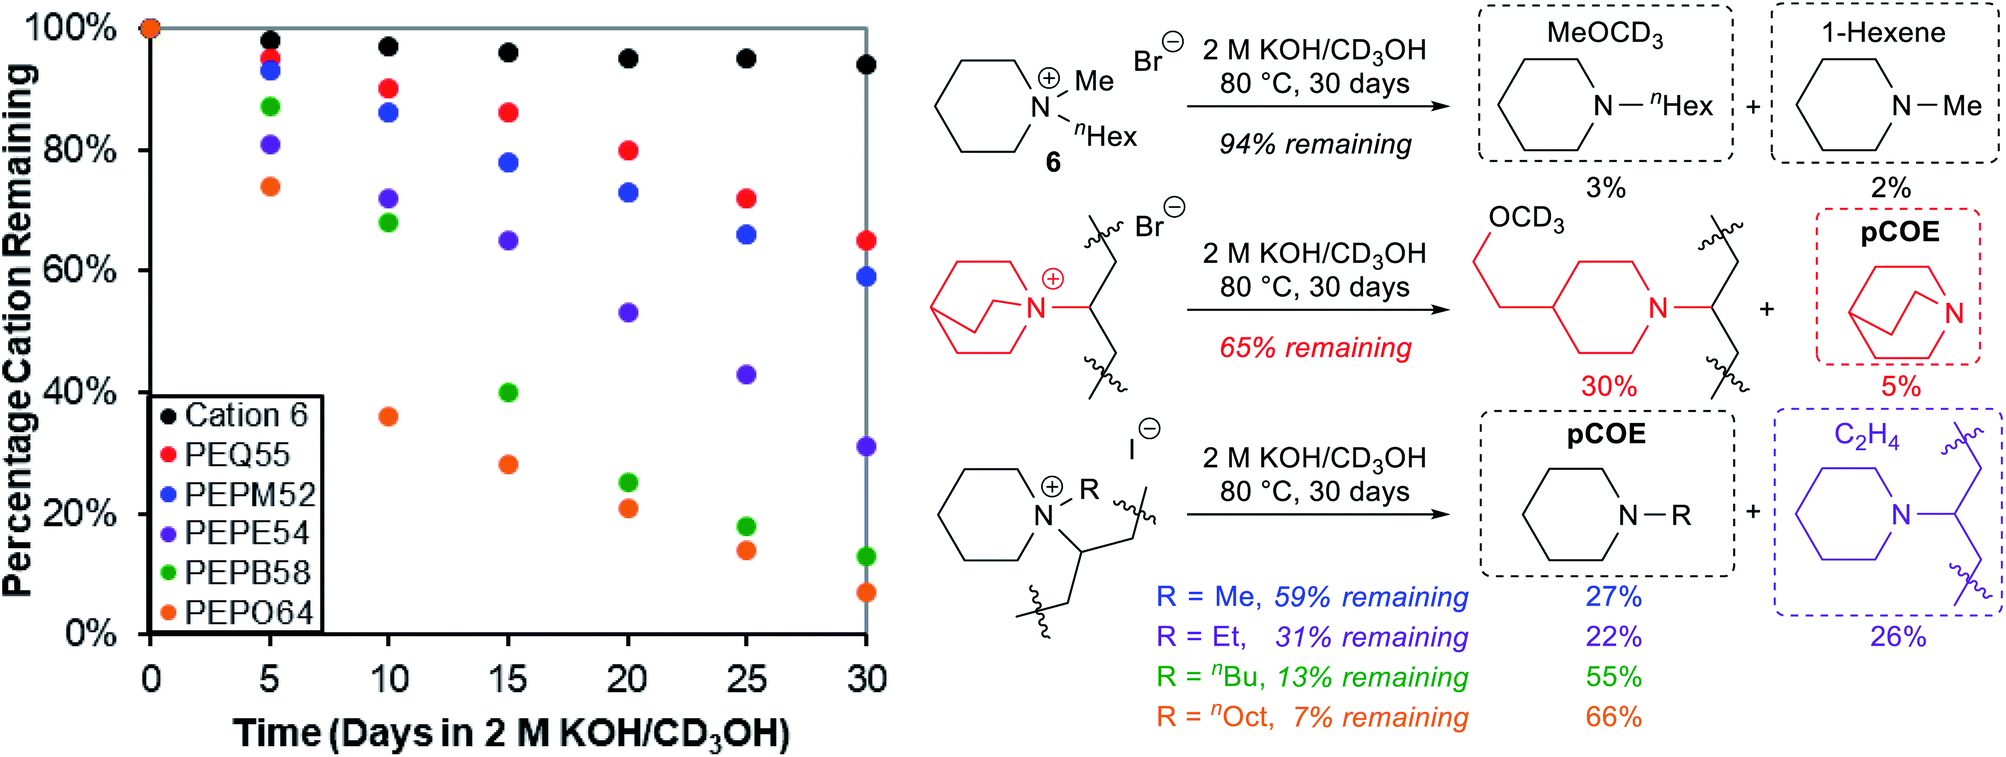 | ||
| Fig. 4 Alkaline stability evaluation of model compound 6 and oligomers under 2 M KOH/CD3OH conditions at 80 °C for 30 days: degradation kinetics by 1H NMR analysis (left) and byproduct assignment (right). | ||
To provide additional insight into the degradation mechanisms of these piperidinium- and quinuclidinium-functionalized AAEMs, we used dispersion-inclusive hybrid density functional theory (DFT) in conjunction with an implicit solvent model to compute free-energy barriers (ΔG‡) for the degradation pathways in Scheme 3 under the experimental conditions (2 M KOH/CD3OH, 80 °C). To do so, we constructed models of the PEPM, PEPE, and PEQ systems (i.e., model-PEPM, model-PEPE, and model-PEQ) in which the PE backbone was truncated to include only seven carbon atoms (see Fig. 5B for a graphical depiction of model-PEPM; see Theoretical and computational methods for a detailed description of the computational protocol).
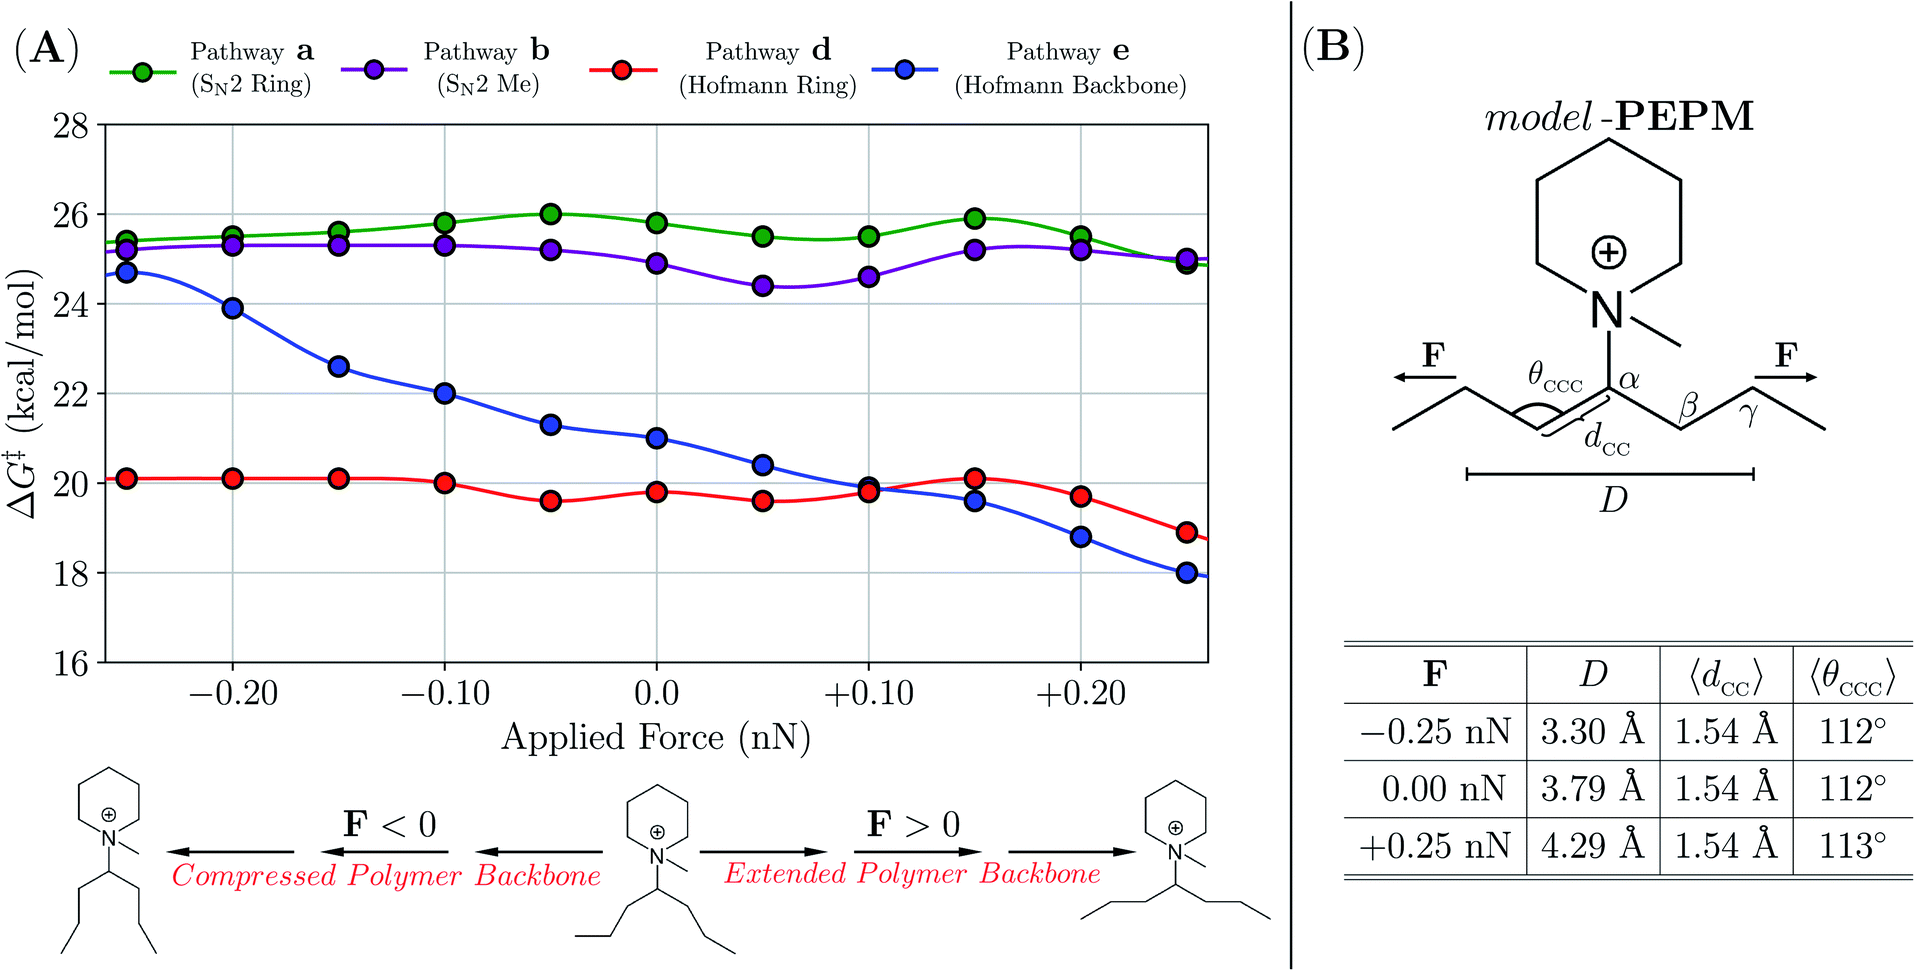 | ||
| Fig. 5 (A) Free-energy barriers (ΔG‡ in kcal mol−1) corresponding to the degradation pathways in Scheme 3 for model-PEPM as a function of an applied force (F in nN) to the distance (D) between γ-carbons on the polymer backbone. All barrier heights were computed with CH3O− as the nucleophile and base (i.e., at the experimental conditions of 2 M KOH/CD3OH, 80 °C) using the EFEI approach in conjunction with dispersion-inclusive hybrid DFT and an implicit solvent model. (B) Top: Graphical depiction of model-PEPM. Bottom: Tabulated statistics describing the model-PEPM backbone as a function of F. Even with the largest forces considered in this work (F = ±0.25 nN), the average backbone C–C bond length (〈dCC〉) and C–C–C bond angle (〈θCCC〉) remained largely unchanged from their force-free (F = 0 nN) values. | ||
For model-PEPM, ΔG‡ values associated with Hofmann elimination (d, e) were lower than that of SN2 (a, b) by ca. 4–6 kcal mol−1, which suggests that these nucleophilic substitution channels were not the primary degradation modes in this system (see Table 3). When comparing amongst the Hofmann elimination pathways, DFT predicted that d was preferred over e by ΔΔG‡ = ΔG‡e − ΔG‡d = 1.2 kcal mol−1. This ΔΔG‡ value corresponds to a factor of ca. 5.5× in the relative degradation rate constants (i.e., kd/ke = exp[(19.8 kcal mol−1 − 21.0 kcal mol−1)/RT ] = 5.5 at T = 80 °C in accordance with transition state theory (TST), see Theoretical and computational methods). As described above, 1H NMR analysis indicated that byproducts from e comprised 66% of the PEPM degradation (i.e., 27% of the total 41% degradation; see Fig. 4), while the remaining 34% remained unassigned (potentially due to solubility issues, vide supra). According to the theoretical results in Table 3, this unassigned portion most likely resulted from d, as the SN2 pathways have substantially higher ΔG‡ values. Although DFT errors in the prediction of relative barrier heights can exceed 1.0 kcal mol−1,84 our calculations on model-PEPM suggested that d should be the dominant degradation pathway, while 1H NMR analysis showed a slight preference for e.
| System | Pathway a | Pathway b | Pathway c | Pathway d | Pathway e |
|---|---|---|---|---|---|
| a All barrier heights were computed with CH3O− as the nucleophile and base (i.e., at the experimental conditions of 2 M KOH/CD3OH, 80 °C) using dispersion-inclusive hybrid DFT and an implicit solvent model. Values in bold indicate primary degradation pathways based on the relative ΔG‡ values for a given system. b For consistency with model-PEPM and model-PEPE, we treated the bridgehead –CH2CH2– group that is orientated perpendicular to the backbone as the substituent (i.e., the pathways involving this –CH2CH2– group are b and c). When computing ΔG‡ for model-PEQ, the SN2 (a and b) and Hofmann elimination (c and d) degradation pathways depend on this orientation and are therefore reported with different values. Effective ΔG‡ values for these combined pathways are 22.9 kcal mol−1 (a, b) and 25.6 kcal mol−1 (c, d). See Theoretical and computational methods for more details. | |||||
| Model-PEPM | 25.8 | 24.9 | N/A | 19.8 | 21.0 |
| Model-PEPE | 26.1 | 25.2 | 17.1 | 20.7 | 22.7 |
| Model-PEQb | 23.0 | 24.6 | 26.4 | 25.8 | 22.1 |
To further explore this issue, we investigated one aspect of the experiment that was not accounted for in the theoretical ΔG‡ in Table 3, namely, how the local conformation of the polymer backbone affects degradation kinetics in piperidinium-based AAEMs. To do so, we sampled both compressed and extended backbone conformations in model-PEPM, and computed ΔG‡ for each degradation pathway as a function of backbone geometry (see Fig. 5). This was accomplished by applying a small tensile force (F) to the distance (D) between the γ-carbons (Cγ) in model-PEPMvia the external forces explicitly included (EFEI) approach.85 In doing so, we explored a wide range of backbone conformations without perturbing the backbone C–C bond lengths (and C–C–C bond angles) in model-PEPM, thereby mimicking the distribution of local polymer morphologies present in PEPM. From the plot in Fig. 5A, backbone geometry had little to no effect on ΔG‡ for the SN2 pathways (a, b) as well as the Hofmann elimination on the piperidinium ring (d). However, Hofmann elimination along the backbone (e) was strongly dependent on the backbone conformation and became increasingly facile for extended, and increasingly difficult for compressed model-PEPM backbones. According to our calculations, this effect was remarkably large (i.e., modifying ΔG‡ by ca. 7 kcal mol−1) and can potentially change the TST rate constant by up to four orders of magnitude!
This finding is consistent with the Hofmann elimination (E2) mechanism, which proceeds more favorably when Hβ–Cβ is anti-periplanar to Cα–N, i.e., θHβCβCαN > 150° or θHβCβCαN < −150°.38 For compressed backbone conformations (in which Cγ–Cβ tended to be anti-periplanar to Cα–N), the observed increase in ΔG‡ resulted from unfavorable torsional rearrangement in the transition state to access the required anti-periplanar Hβ–Cβ–Cα–N orientation. For extended backbone conformations, Hβ–Cβ was naturally anti-periplanar to Cα–N, hence e can proceed with relative ease. Since PEPM exists as an ensemble of backbone conformations, accounting for the effects of local backbone morphology on ΔG‡ (via an appropriately weighted Boltzmann average over the ΔG‡ values in Fig. 5) could yield a very different picture of the degradation kinetics than that provided by the ΔG‡ (F = 0) values alone. As such, one explanation that is consistent with both our experimental and theoretical data is that the distribution of backbone conformations tends to be more extended in PEPM; this would lead to a more favorable ΔG‡ for e, making this pathway competitive with (or even more favorable than) d.
To investigate how the substitution of R = Me (PEPM) for R = Et (PEPE) affected the stability of these piperidinium-based AAEMs, we also computed barriers for the analogous model-PEPE system. Again, we found that the SN2 pathways (a, b) had higher barriers than the Hofmann elimination pathways (c, d, e), thereby suggesting that nucleophilic substitutions were not the primary degradation modes in PEPE as well. 1H NMR analysis attributed ca. 38% and 32% of the total PEPE degradation to c and e (i.e., 26% and 22% of the total 69% degradation; see Fig. 4); with higher SN2 barriers, we again hypothesized that the remaining 30% (unassigned) likely resulted from d. Since local backbone morphology substantially influenced ΔG‡ for e in model-PEPM (see Fig. 5), we expect the same in model-PEPE; if extended backbone conformations were favored in PEPE, e could again be competitive with d, which was observed experimentally.
Since rotation about Cα–Cβ in the ethyl moiety of model-PEPE was largely unhindered, one would expect that any one of the three corresponding β-hydrogens would be in the anti-periplanar position preferred by Hofmann elimination. DFT calculations on model-PEPE strongly agreed with these expectations and predicted ΔΔG‡ values for c (with respect to the other pathways) that were tantamount to >99% of the degradation proceeding through this channel. As mentioned above, 1H NMR indicated that c was only responsible for 38% of the PEPE degradation, in stark contrast to the theoretical result. Since the model-PEPE backbone conformation was unlikely to affect ΔG‡ for c, theoretical arguments based on local polymer morphology alone are insufficient to explain why c seems to be severely hindered in PEPE. Notably, a similar discrepancy also occurs in (even simpler) tetraalkylammonium systems, wherein experimental characterization of the kinetics associated with ethyl-based Hofmann elimination also yields markedly different results from the theoretical ΔΔG‡ values (cf. Table 3 of ref. 38 with Fig. 6 of ref. 86). In this case, experimental Hofmann elimination rates, i.e., half-life (τ) data, obtained by Marino and Kreuer38 for ethyltrimethylammonium (ETM) and propyltrimethylammonium (PTM) correspond to a ΔΔG‡ = ΔG‡ETM − ΔG‡PTM = −RTln[τPTM/τETM] = −RTln[33.2 h/2.8 h] = −2.1 kcal mol−1 at T = 160 °C (assuming pseudo-first order kinetics in 6 M NaOH and no side reactions), while the theoretical calculations of Long et al.86 yield ΔΔG‡ = ΔG‡ETM − ΔG‡PTM = 17.5 kcal mol−1 − 22.9 kcal mol−1 = −5.4 kcal mol−1 under the same conditions. As such, the (relative) rate of ethyl-based Hofmann elimination in tetraalkylammonium salts also seems to be markedly attenuated with respect to the theoretically predicted ΔΔG‡ values. Since a deeper understanding of this degradation pathway can be leveraged in the rational design of robust next-generation AAEMs for alkaline fuel cell applications, the underlying reason(s) (e.g., the use of TST, approximate treatment of electronic structure and solvent effects, etc.) for this apparent discrepancy is currently under investigation in our group.
For model-PEQ, the Hβ–Cβ in the bicyclic (quinuclidinium) ring cannot easily access an anti-periplanar position with Cα–N, thereby making Hofmann eliminations via the ring (c, d) less viable degradation pathways (Table 3). In direct contrast to model-PEPM and model-PEPE, the ring-opening SN2 reactions (a, b) have much lower ΔG‡ values (most likely due to ring strain) and now become competitive pathways in model-PEQ. 1H NMR analysis indicated that these SN2 reactions (a, b; experimentally indistinguishable) and the remaining Hofmann elimination (e) were indeed the primary degradation pathways, with a corresponding assignment of 86% (a, b) and 14% (e) of the PEQ byproducts (i.e., 30% and 5% of the total 35% degradation, respectively; see Fig. 4). In this case, there is strong experimental (cf. relative degradation kinetics for e for all polymers in Fig. 4) and theoretical (cf. relative ΔG‡ values for model-PEQ in Table 3) evidence that degradation through e was attenuated in PEQ. Taking local backbone morphology into consideration, these findings might be indicative of a preference for compressed backbone conformations in PEQ (in contrast to PEPM and PEPE). As such, this morphological picture of PEQ shares some similarities with the stacked layer model proposed by Trigg et al. for precisely sulfonated polyethylene materials.87
Conclusions
In this work, we demonstrate that a photocatalytic hydroamination reaction enables the facile synthesis of significant quantities of a piperidinium-cyclooctene monomer, which is quickly converted through a ROMP/hydrogenation sequence to materials for alkaline fuel cell applications. These materials are the first aromatic-free, piperidinium- and quinuclidinium-functionalized AAEMs with PE backbones. This strategy not only expediently produced AAEMs with strong mechanical properties, high hydroxide conductivity, and good alkaline stability, but also enabled us to perform systematic studies to compare different alkaline stability testing conditions (containers) and different characterization techniques. By employing a combination of FT-IR, 1H NMR, and DFT analysis, we have identified the primary degradation pathways in these AAEMs, and elucidated the crucial role played by polymer backbone conformations in regulating degradation pathways based on Hofmann elimination along the PE backbone. In doing so, we find that methyl-substituted-piperidinium- and quinuclidinium-functionalized AAEMs (PEPM and PEQ) gave the highest alkaline stability. Due to the ease of their preparation, we propose that these cation-functionalized PE materials should be excellent candidates for anion exchange membranes with broader applications beyond AEMFCs.Theoretical and computational methods
All calculations were performed using the Q-Chem (v5.2) software package.88 Geometry optimizations employed the dispersion-inclusive hybrid B3LYP+D389–91 density functional approximation in conjunction with the 6-31G* basis set for C, H, and N (and the more diffuse 6-31+G* basis set for the O in the charged nucleophilic species); this mixed basis set will be denoted as 6-31G*[HCN]/6-31+G*[O] below. Vibrational frequency calculations were used to confirm the nature of all stationary points, wherein all minima contained no imaginary frequencies and all transition state (TS) structures each contained a single imaginary frequency connecting the reactants (i.e., a local optimized reaction complex of the charged nucleophilic species with model-PEPM, model-PEPE, or model-PEQ) and the respective degradation products. Since the degradation experiments in this work were performed in 2 M KOH/CD3OH at T = 80 °C, methoxide (CH3O− or CD3O−) is expected to be the primary and preferred reactive species (over OH−) due to its higher nucleophilicity and basicity. In this and previous work, we successfully identified the CD3O− addition byproducts.83 In all of the theoretical calculations performed herein, CH3O− was therefore used as the nucleophilic (and basic) species. In many cases, the frozen string algorithm92,93 aided in the search for TS structures. Thermal contributions to the internal energy (E), enthalpy (H), entropy (S), and free energy (G) were computed at T = 80 °C using partition functions derived within the ideal gas (IG), rigid rotor (RR), and harmonic oscillator (HO) approximations. Entropic contributions from low-frequency vibrational modes (present in both the reactants and TS structures) were computed using the quasi-RRHO correction as outlined by Grimme (with α = 4, ω0 = 100 cm−1, and Bav set to the geometric mean of the principal moments of inertia (I1, I2, I3) for each system).94 Higher-level single-point corrections to the electronic component of the internal energy (Eelec) were obtained using the ωB97X-V95 density functional approximation and the cc-pVTZ96 basis set for C, H, and N (and the more diffuse aug-cc-pVTZ96 basis set for the O in the charged nucleophilic species); this mixed basis set will be denoted as cc-pVTZ[HCN]/aug-cc-pVTZ[O] below. All calculations were performed in the integral equation formalism polarizable continuum model (PCM) with a dielectric constant of ε = 23.9, which corresponds to methanol extrapolated to T = 80 °C.97–100 To investigate the effect of local backbone morphology, a small tensile force (−0.25 nN ≤ F ≤ +0.25 nN) was applied in increments of 0.05 nN to the distance (D) between the γ-carbons in the polymer backbone via the external forces explicitly included (EFEI) approach.85
As such, the following working expression was used when computing G for a given reactant (Greact) or TS species (GTS):
| G(F) = Eelec + H − TS + VEFEI(F) − RTlng. | (1) |
In this expression, Eelec is the electronic (or DFT) energy computed at the ωB97X-V/cc-pVTZ[HCN]/aug-cc-pVTZ[O]/PCM//B3LYP+D3/6-31G*[HCN]/6-31+G*[O]/PCM level. H is the enthalpic contribution:
| H = H(T) = Etrans(T) + Erot(T) + Evib(T) + pV, | (2) |
| S = S(T) = Strans(T) + Srot(T) + Svib(T), | (3) |
Since the primary purpose of the theoretical calculations in this work is to assess the relative viability among a set of competing degradation pathways (with the same reactants), all free-energy barriers (ΔG‡ = GTS − Greact) were computed with respect to a single reference, i.e., the global minimum reactant complex on the corresponding potential energy surface (PES), instead of the reactant complex directly connected to each TS via the intrinsic reaction coordinate (IRC). Doing so explicitly accounts for the equilibrium (Boltzmann) population of the corresponding IRC-based reaction complex—which is potentially a local minimum reaction complex on the PES—in each ΔG‡ value provided herein, and therefore allows for a fairer comparison among competing degradation pathways.
Due to the potential errors that arise when computing free-energy barriers with DFT (which often exceed 1.0 kcal mol−1),95 we avoid discussing absolute reaction rates throughout this work, and instead compare and contrast ΔG‡ values corresponding to different degradation pathways (ΔG‡1 and ΔG‡2) in relative terms, i.e., ΔΔG‡ = ΔG‡1 − ΔG‡2. We also discuss the relative differences between ΔG‡i values in terms of the corresponding reaction rate constants (ki), which have been estimated using the Eyring equation of transition state theory (TST):
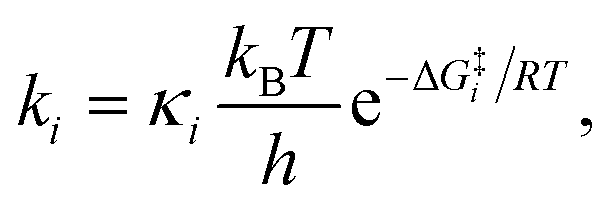 | (4) |
 | (5) |
 | (6) |
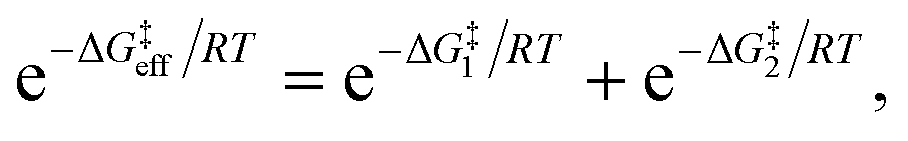
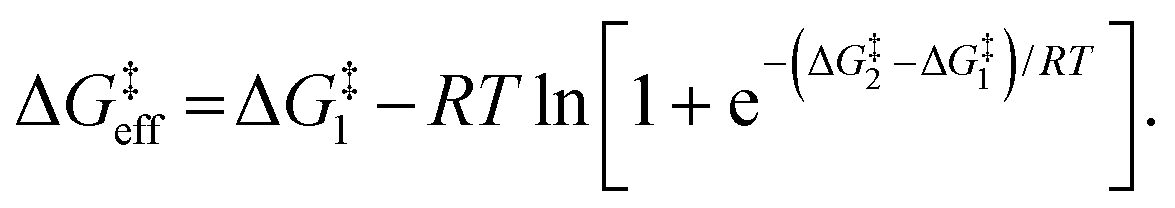
For identical degradation pathways (e.g., with two chemically equivalent SN2 or E2 sites), ΔG‡1 = ΔG‡2 and this expression simplifies to:
| ΔG‡eff = ΔG‡1 − RTln2, | (7) |
All calculations were performed using the following convergence criteria: 10−8 au for the DIIS error and 10−11 au for the integral thresholding value during self-consistent field (SCF) optimizations; 3.0 × 10⁻⁶ hartree per bohr for the maximum gradient component, 1.2 × 10⁻⁵ bohr for the maximum atomic displacement, and 1.0 × 10⁻⁸ hartree for the energy change between successive steps during geometry optimizations (with convergence reached after satisfying any two of these criteria). A detailed breakdown of the free-energy components (Table S6†) as well as the optimized geometries for each species are included in the ESI.†
Conflicts of interest
There are no conflicts to declare.Acknowledgements
This work was primarily supported as part of the Center for Alkaline-based Energy Solutions (CABES), an Energy Frontier Research Center funded by the U.S. Department of Energy, Office of Science, Basic Energy Sciences under Award #DE-SC0019445. R. R. K. provided monomer materials to the work with financial support from the National Institutes of Health (R35 GM134893). This study made use of the NMR facility supported by the National Science Foundation (NSF, CHE-1531632) and the Cornell Center for Materials Research Shared Facilities supported by NSF MRSEC (DMR-1719875). Computational resources were provided by the National Energy Research Scientific Computing Center (NERSC), a U.S. Department of Energy Office of Science User Facility operated under Contract No. DE-AC02-05CH11231. All authors thank I. Keresztes and A. Condo for assistance with the NMR and MS measurements, P. Carubia for assistance with the FT-IR measurements, and H. Abruña for help with electrochemical impedance spectroscopy (EIS). All authors also acknowledge X. Lu, B. Pivovar, and P. Xu for helpful discussions.Notes and references
- I. Staffell, D. Scamman, A. V. Abad, P. Balcombe, P. E. Dodds, P. Ekins, N. Shah and K. R. Ward, Energy Environ. Sci., 2019, 12, 463–491 RSC
.
- J. R. Varcoe, P. Atanassov, D. R. Dekel, A. M. Herring, M. A. Hickner, P. A. Kohl, A. R. Kucernak, W. E. Mustain, K. Nijmeijer, K. Scott, T. Xu and L. Zhuang, Energy Environ. Sci., 2014, 7, 3135–3191 RSC
- S. Maurya, S. H. Shin, Y. Kim and S. H. Moon, RSC Adv., 2015, 5, 37206–37230 RSC
- C. G. Arges and L. Zhang, ACS Appl. Energy Mater., 2018, 1, 2991–3012 CrossRef CAS
- S. Lu, J. Pan, A. Huang, L. Zhuang and J. Lu, Proc. Natl. Acad. Sci. U. S. A., 2008, 95, 20611–20614 CrossRef
- G. Merle, M. Wessling and K. Nijmeijer, J. Membr. Sci., 2011, 377, 1–35 CrossRef CAS
- D. R. Dekel, J. Power Sources, 2018, 375, 158–169 CrossRef CAS
- S. Gottesfeld, D. R. Dekel, M. Page, C. Bae, Y. Yan, P. Zelenay and Y. S. Kim, J. Power Sources, 2018, 375, 170–184 CrossRef CAS
- Z. Sun, B. Lin and F. Yan, ChemSusChem, 2018, 11, 58–70 CrossRef CAS
- K. M. Hugar, W. You and G. W. Coates, ACS Energy Lett., 2019, 4, 1681–1686 CrossRef CAS
- W. You, K. J. T. Noonan and G. W. Coates, Prog. Polym. Sci., 2020, 100, 101177 CrossRef CAS
- H. A. Kostalik IV, T. J. Clark, N. J. Robertson, P. F. Mutolo, J. M. Longo, H. D. Abruña and G. W. Coates, Macromolecules, 2010, 43, 7147–7150 CrossRef
- N. J. Robertson, H. A. Kostalik IV, T. J. Clark, P. F. Mutolo, H. D. Abruña and G. W. Coates, J. Am. Chem. Soc., 2010, 132, 3400–3404 CrossRef CAS
- T. J. Clark, N. J. Robertson, H. A. Kostalik IV, E. B. Lobkovsky, P. F. Mutolo, H. D. Abruña and G. W. Coates, J. Am. Chem. Soc., 2009, 131, 12888–12889 CrossRef CAS
- A. M. A. Mahmoud, A. M. M. Elsaghier, K. Otsuji and K. Miyatake, Macromolecules, 2017, 50, 4256–4266 CrossRef CAS
- L. Wang, X. Peng, W. E. Mustain and J. R. Varcoe, Energy Environ. Sci., 2019, 12, 1575–1579 RSC
- W.-H. Lee, Y. S. Kim and C. Bae, ACS Macro Lett., 2015, 4, 814–818 CrossRef CAS
- L. Zhu, J. Pan, Y. Wang, J. Han, L. Zhuang and M. A. Hickner, Macromolecules, 2016, 49, 815–824 CrossRef CAS
- L. Liu, X. Chu, J. Liao, Y. Huang, Y. Li, Z. Ge, M. A. Hickner and N. Li, Energy Environ. Sci., 2018, 11, 435–446 RSC
- K. J. T. Noonan, K. M. Hugar, H. A. Kostalik IV, E. B. Lobkovsky, H. D. Abruña and G. W. Coates, J. Am. Chem. Soc., 2012, 134, 18161–18164 CrossRef CAS
- B. Zhang, R. B. Kaspar, S. Gu, J. Wang, Z. Zhuang and Y. Yan, ChemSusChem, 2016, 9, 2374–2379 CrossRef CAS
- C. T. Womble, G. W. Coates, K. Matyjaszewski and K. J. T. Noonan, ACS Macro Lett., 2016, 5, 253–257 CrossRef CAS
- W. Zhang, Y. Liu, A. C. Jackson, A. M. Savage, S. P. Ertem, T.-H. Tsai, S. Seifert, F. L. Beyer, M. W. Liberatore, A. M. Herring and E. B. Coughlin, Macromolecules, 2016, 49, 4714–4722 CrossRef CAS
- J. Wang, S. Gu, R. B. Kaspar, B. Zhang and Y. Yan, ChemSusChem, 2013, 6, 2079–2082 CrossRef CAS
- W. You, K. M. Hugar and G. W. Coates, Macromolecules, 2018, 51, 3212–3218 CrossRef CAS
- W. You, E. Padgett, S. N. MacMillan, D. A. Muller and G. W. Coates, Proc. Natl. Acad. Sci. U. S. A., 2019, 116, 9729–9734 CrossRef CAS
- J. Fan, S. Willdorf-Cohen, E. M. Schibli, Z. Paula, W. Li, T. J. G. Skalski, A. T. Sergeenko, A. Hohenadel, B. J. Frisken, E. Magliocca, W. E. Mustain, C. E. Diesendruck, D. R. Dekel and S. Holdcroft, Nat. Commun., 2019, 10, 2306–2315 CrossRef
- J. Fan, A. G. Wright, B. Britton, T. Weissbach, T. J. G. Skalski, J. Ward, T. J. Peckham and S. Holdcroft, ACS Macro Lett., 2017, 6, 1089–1093 CrossRef CAS
- A. G. Wright, J. Fan, B. Britton, T. Weissbach, H.-F. Lee, E. A. Kitching, T. J. Peckham and S. Holdcroft, Energy Environ. Sci., 2016, 9, 2130–2142 RSC
- T. Zhu, S. Xu, A. Rahman, E. Dogdibegovic, P. Yang, P. Pageni, M. P. Kabir, X.-D. Zhou and C. Tang, Angew. Chem., Int. Ed., 2018, 57, 2388–2392 CrossRef CAS
- M. T. Kwasny, L. Zhu, M. A. Hickner and G. N. Tew, J. Am. Chem. Soc., 2018, 140, 7961–7969 CrossRef CAS
- S. Gu, J. Wang, R. B. Kaspar, Q. Fang, B. Zhang, E. B. Coughlin and Y. Yan, Sci. Rep., 2015, 5, 11668–11678 CrossRef CAS
- T. Zhu, Y. Sha, H. A. Firouzjaie, X. Peng, Y. Cha, D. M. M. M. Dissanayake, M. D. Smith, A. K. Vannucci, W. E. Mustain and C. Tang, J. Am. Chem. Soc., 2020, 142, 1083–1089 CrossRef CAS
- A. D. Mohanty and C. Bae, J. Mater. Chem. A, 2014, 2, 17314–17320 RSC
- M. R. Sturgeon, C. S. Macomber, C. Engtrakul, H. Long and B. S. Pivovar, J. Electrochem. Soc., 2015, 162, F366−F372 CrossRef
- K. M. Hugar, H. A. Kostalik IV and G. W. Coates, J. Am. Chem. Soc., 2015, 137, 8730–8737 CrossRef CAS
- C. T. Womble, J. Kang, K. M. Hugar, G. W. Coates, S. Bernhard and K. J. T. Noonan, Organometallics, 2017, 36, 4038–4046 CrossRef CAS
- M. G. Marino and K. D. Kreuer, ChemSusChem, 2015, 8, 513–523 CrossRef CAS
- J. S. Olsson, T. H. Pham and P. Jannasch, Adv. Funct. Mater., 2018, 28, 1702758 CrossRef
- T. H. Pham, J. S. Olsson and P. Jannasch, J. Mater. Chem. A, 2018, 6, 16537–16547 RSC
- J. S. Olsson, T. H. Pham and P. Jannasch, J. Membr. Sci., 2019, 578, 183–195 CrossRef CAS
- H. Peng, Q. Li, M. Hu, L. Xiao, J. Lu and L. Zhuang, J. Power Sources, 2018, 390, 165–167 CrossRef CAS
- J. Wang, Y. Zhao, B. P. Setzler, S. Rojas-Carbonell, C. Ben Yehuda, A. Amel, M. Page, L. Wang, K. Hu, L. Shi, S. Gottesfeld, B. Xu and Y. Yan, Nat. Energy, 2019, 4, 392–398 CrossRef CAS
- H.-S. Dang and P. Jannasch, ACS Appl. Energy Mater., 2018, 1, 2222–2231 CrossRef CAS
- L. Gu, H. Dong, Z. Sun, Y. Li and F. Yan, RSC Adv., 2016, 6, 94387–94398 RSC
- T. H. Pham, J. S. Olsson and P. Jannasch, J. Am. Chem. Soc., 2017, 139, 2888–2891 CrossRef CAS
- H.-S. Dang and P. Jannasch, J. Mater. Chem. A, 2017, 5, 21965–21978 RSC
- X. Chu, Y. Shi, L. Liu, Y. Huang and N. Li, J. Mater. Chem. A, 2019, 7, 7717–7727 RSC
- J. S. Olsson, T. H. Pham and P. Jannasch, Macromolecules, 2017, 50, 2784–2793 CrossRef CAS
- J. Ponce-González, D. K. Whelligan, L. Wang, R. Bance-Soualhi, Y. Wang, Y. Peng, H. Peng, D. C. Apperley, H. N. Sarode, T. P. Pandey, A. G. Divekar, S. Seifert, A. M. Herring, L. Zhuang and J. R. Varcoe, Energy Environ. Sci., 2016, 9, 3724–3735 RSC
- N. Chen, C. Lu, Y. Li, C. Long, Z. Li and H. Zhu, J. Membr. Sci., 2019, 588, 117120 CrossRef CAS
- T. H. Pham, J. S. Olsson and P. Jannasch, J. Mater. Chem. A, 2019, 7, 15895–15906 RSC
- D. J. Strasser, B. J. Graziano and D. M. Knauss, J. Mater. Chem. A, 2017, 5, 9627–9640 RSC
- B. R. Caire, M. A. Vandiver, T. P. Pandey, A. M. Herring and M. W. Liberatore, J. Electrochem. Soc., 2016, 163, H964–H969 CrossRef CAS
- I. Matanovic, S. Maurya, E. J. Park, J. Y. Jeon, C. Bae and Y. S. Kim, Chem. Mater., 2019, 31, 4195–4204 CrossRef CAS
- A. D. Mohanty, S. E. Tignor, J. A. Krause, Y.-K. Choe and C. Bae, Macromolecules, 2016, 49, 3361–3372 CrossRef CAS
- C. G. Arges and V. Ramani, Proc. Natl. Acad. Sci. U. S. A., 2013, 110, 2490–2495 CrossRef CAS
- J. Parrondo, M.-s. J. Jung, Z. Wang, C. G. Arges and V. Ramani, J. Electrochem. Soc., 2015, 162, F1236–F1242 CrossRef CAS
- S. Maurya, A. S. Lee, D. Li, E. J. Park, D. P. Leonard, S. Noh, C. Bae and Y. S. Kim, J. Power Sources, 2019, 436, 226866 CrossRef CAS
- M. Zhang, C. Shan, L. Liu, J. Liao, Q. Chen, M. Zhu, Y. Wang, L. An and N. Li, ACS Appl. Mater. Interfaces, 2016, 8, 23321–23330 CrossRef CAS
- M. Mandal, G. Huang and P. A. Kohl, J. Membr. Sci., 2019, 570–571, 394–402 CrossRef CAS
- M. Mandal, G. Huang and P. A. Kohl, ACS Appl. Energy Mater., 2019, 2, 2447–2457 CrossRef CAS
- W. Chen, M. Mandal, G. Huang, X. Wu, G. He and P. A. Kohl, ACS Appl. Energy Mater., 2019, 2, 2458–2468 CrossRef CAS
- S. C. Price, X. Ren, A. M. Savage and F. L. Beyer, Polym. Chem., 2017, 8, 5708–5717 RSC
- C. Wang, B. Mo, Z. He, Q. Shao, D. Pan, E. Wujick, J. Guo, X. Xie, X. Xie and Z. Guo, J. Membr. Sci., 2018, 556, 118–125 CrossRef CAS
- X. Liu, H. Gao, X. Chen, Y. Hu, H. Li and Y. Zhang, Polym. Chem., 2016, 7, 2904–2912 RSC
- X. Liu, H. Gao, X. Chen, Y. Hu, S. Pei, H. Li and Y. Zhang, J. Membr. Sci., 2016, 515, 268–276 CrossRef CAS
- T. E. Muller, K. C. Hultzsch, M. Yus, F. Foubelo and M. Tada, Chem. Rev., 2008, 108, 3795–3892 CrossRef
- L. Huang, M. Arndt, K. Gooßen, H. Heydt and L. J. Gooßen, Chem. Rev., 2015, 115, 2596–2697 CrossRef CAS
- Y. Li and T. J. Marks, Organometallics, 1996, 15, 3770–3772 CrossRef CAS
- A. L. Reznichenko, H. N. Nguyen and K. C. Hultzsch, Angew. Chem., Int. Ed., 2010, 49, 8984–8987 CrossRef CAS
- S. Zhu and S. L. Buchwald, J. Am. Chem. Soc., 2014, 136, 15913–15916 CrossRef CAS
- S. C. Ensign, E. P. Vanable, G. D. Kortman, L. J. Weir and K. L. Hull, J. Am. Chem. Soc., 2015, 137, 13748–13751 CrossRef CAS
- A. J. Musacchio, B. C. Lainhart, X. Zhang, S. G. Naguib, T. C. Sherwood and R. R. Knowles, Science, 2017, 355, 727–730 CrossRef CAS
- T. W. Baughman, J. C. Sworen and K. B. Wagener, Tetrahedron, 2004, 60, 10943–10948 CrossRef CAS
- A. Zhegur-Khais, F. Kubannek, U. Krewer and D. R. Dekel, J. Membr. Sci., 2020, 612, 118461 CrossRef CAS
- B. Lee, D. Yun, J.-S. Lee, C. H. Park and T.-H. Kim, J. Phys. Chem. C, 2019, 123, 13508–13518 CrossRef CAS
- Nafion™ 115, 117, and 1110 Membrane Properties Sheet, https://www.fuelcellstore.com/spec-sheets/chemours-nafion-115-117-1110-spec-sheet.pdf, accessed Aug 24, 2019 Search PubMed.
- E. J. Park and Y. S. Kim, J. Mater. Chem. A, 2018, 6, 15456–15477 RSC
- T. P. Pandey, A. M. Maes, H. N. Sarode, B. D. Peters, S. Lavina, K. Vezzu, Y. Yang, S. D. Poynton, J. R. Varcoe, S. Seifert, M. W. Liberatore, V. D. Noto and A. M. Herring, Phys. Chem. Chem. Phys., 2015, 17, 4367–4378 RSC
- B. Lin, H. Dong, Y. Li, Z. Si, F. Gu and F. Yan, Chem. Mater., 2013, 25, 1858–1867 CrossRef CAS
- O. I. Deavin, S. Murphy, A. L. Ong, S. D. Poynton, R. Zeng, H. Herman and J. R. Varcoe, Energy Environ. Sci., 2012, 5, 8584–8597 RSC
- W. You, K. M. Hugar, R. C. Selhorst, M. Treichel, C. R. Peltier, K. J. T. Noonan and G. W. Coates, J. Org. Chem., 2021, 86, 254–263 CrossRef CAS
- L. Goerigk, A. Hansen, C. Bauer, S. Ehrlich, A. Najibi and S. Grimme, Phys. Chem. Chem. Phys., 2017, 19, 32184–32215 RSC
- J. Ribas-Arino, M. Shiga and D. Marx, Angew. Chem., Int. Ed., 2009, 48, 4190–4193 CrossRef CAS
- H. Long, K. Kim and B. S. Pivovar, J. Phys. Chem. C, 2012, 116, 9419–9426 CrossRef CAS
- E. B. Trigg, T. W. Gaines, M. Maréchal, D. E. Moed, P. Rannou, K. B. Wagener, M. J. Stevens and K. I. Winey, Nat. Mater., 2018, 17, 725–731 CrossRef CAS
- Y. Shao, Z. Gan, E. Epifanovsky, A. T. B. Gilbert, M. Wormit, J. Kussmann, A. W. Lange, A. Behn, J. Deng, X. Feng, D. Ghosh, M. Goldey, P. R. Horn, L. D. Jacobson, I. Kaliman, R. Z. Khaliullin, T. Kuś, A. Landau, J. Liu, E. I. Proynov, Y. M. Rhee, R. M. Richard, M. A. Rohrdanz, R. P. Steele, E. J. Sundstrom, H. L. Woodcock, P. M. Zimmerman, D. Zuev, B. Albrecht, E. Alguire, B. Austin, G. J. O. Beran, Y. A. Bernard, E. Berquist, K. Brandhorst, K. B. Bravaya, S. T. Brown, D. Casanova, C.-M. Chang, Y. Chen, S. H. Chien, K. D. Closser, D. L. Crittenden, M. Diedenhofen, R. A. DiStasio Jr, H. Do, A. D. Dutoi, R. G. Edgar, S. Fatehi, L. Fusti-Molnar, A. Ghysels, A. Golubeva-Zadorozhnaya, J. Gomes, M. W. D. Hanson-Heine, P. H. P. Harbach, A. W. Hauser, E. G. Hohenstein, Z. C. Holden, T.-C. Jagau, H. Ji, B. Kaduk, K. Khistyaev, J. Kim, J. Kim, R. A. King, P. Klunzinger, D. Kosenkov, T. Kowalczyk, C. M. Krauter, K. U. Lao, A. D. Laurent, K. V. Lawler, S. V. Levchenko, C. Y. Lin, F. Liu, E. Livshits, R. C. Lochan, A. Luenser, P. Manohar, S. F. Manzer, S.-P. Mao, N. Mardirossian, A. V. Marenich, S. A. Maurer, N. J. Mayhall, E. Neuscamman, C. M. Oana, R. Olivares-Amaya, D. P. O’Neill, J. A. Parkhill, T. M. Perrine, R. Peverati, A. Prociuk, D. R. Rehn, E. Rosta, N. J. Russ, S. M. Sharada, S. Sharma, D. W. Small, A. Sodt, T. Stein, D. Stück, Y.-C. Su, A. J. W. Thom, T. Tsuchimochi, V. Vanovschi, L. Vogt, O. Vydrov, T. Wang, M. A. Watson, J. Wenzel, A. White, C. F. Williams, J. Yang, S. Yeganeh, S. R. Yost, Z.-Q. You, I. Y. Zhang, X. Zhang, Y. Zhao, B. R. Brooks, G. K. L. Chan, D. M. Chipman, C. J. Cramer, W. A. Goddard, M. S. Gordon, W. J. Hehre, A. Klamt, H. F. Schaefer, M. W. Schmidt, C. D. Sherrill, D. G. Truhlar, A. Warshel, X. Xu, A. Aspuru-Guzik, R. Baer, A. T. Bell, N. A. Besley, J.-D. Chai, A. Dreuw, B. D. Dunietz, T. R. Furlani, S. R. Gwaltney, C.-P. Hsu, Y. Jung, J. Kong, D. S. Lambrecht, W. Liang, C. Ochsenfeld, V. A. Rassolov, L. V. Slipchenko, J. E. Subotnik, T. Van Voorhis, J. M. Herbert, A. I. Krylov, P. M. W. Gill and M. Head-Gordon, Mol. Phys., 2014, 113, 184–215 CrossRef
- A. D. Becke, J. Chem. Phys., 1993, 98, 5648–5652 CrossRef CAS
- C. Lee, W. Yang and R. G. Parr, Phys. Rev. B: Condens. Matter Mater. Phys., 1988, 37, 785–789 CrossRef CAS
- S. Grimme, J. Antony and S. E. H. Krieg, J. Chem. Phys., 2010, 132, 154104 CrossRef
- A. Behn, P. M. Zimmerman, A. T. Bell and M. Head-Gordon, J. Chem. Phys., 2011, 135, 224108 CrossRef
- S. M. Sharada, P. M. Zimmerman, A. T. Bell and M. Head-Gordon, J. Chem. Theory Comput., 2012, 8, 5166–5174 CrossRef
- S. Grimme, Chem.–Eur. J., 2012, 18, 9955–9964 CrossRef CAS
- N. Mardirossian and M. Head-Gordon, Phys. Chem. Chem. Phys., 2014, 16, 9904–9924 RSC
- T. H. Dunning, J. Chem. Phys., 1989, 90, 1007–1023 CrossRef CAS
- E. Cancès, B. Mennucci and J. Tomasi, J. Chem. Phys., 1997, 107, 3032–3041 CrossRef
- D. M. Chipman, J. Chem. Phys., 2000, 112, 5558–5565 CrossRef CAS
- E. Cancès and B. Mennucci, J. Chem. Phys., 2001, 115, 6130–6135 CrossRef
- R. D. Bezman, E. F. Casassa and R. L. Kay, J. Mol. Liq., 1997, 73–74, 397–402 CrossRef
Footnote |
| † Electronic supplementary information (ESI) available. See DOI: 10.1039/d0sc05789d |
| This journal is © The Royal Society of Chemistry 2021 |